Article

Comparative and Phylogenetic Analysis of Six New Complete Chloroplast Genomes of Rubus (Rosaceae)

1
Zhejiang Provincial Key Laboratory of Plant Evolutionary Ecology and Conservation, College of Life Sciences, Taizhou University, Taizhou 318000, China
2
Institute of Horticulture, Taizhou Academy of Agricultural Sciences, Linhai 317000, China
3
Institute of Horticulture, Zhejiang Academy of Agricultral Sciences, Hangzhou 310021, China
*
Author to whom correspondence should be addressed.
Forests 2024, 15(7), 1167; https://doi.org/10.3390/f15071167
Submission received: 3 June 2024 / Revised: 29 June 2024 / Accepted: 2 July 2024 / Published: 4 July 2024
(This article belongs to the Section Genetics and Molecular Biology)

Abstract

:
Rubus includes a group of important plants with medicinal and culinary significance, as well as ornamental value. However, due to its status as one of the largest genera in the Rosaceae family and frequent occurrences of apomixis, hybridization, and polyploidy among its species, the morphological identification of this genus is highly challenging. The plastid genome serves as a valuable tool for studying the evolutionary relationships among plants. Therefore, based on the raw data of the whole genomes from six popular Rubus taxa, the complete Cp genomes were assembled, annotated, and subjected to comparative and phylogenetic analyses. In this research, six newly complete Cp genomes were reported, which all had a representative quadripartite formation, with a similar GC content (37.06%–37.26%), and their size ranged from 155,493 bp to 156,882 bp. They all encode 111 unique genes, containing 79 PCGs, 28 tRNA, and 4 rRNA. The analysis of gene structure of different groups showed that the sequence and content of genes were relatively conservative, and there was no gene rearrangement. Most of their PCGs had a high frequency codon usage bias and all genes were in purifying selection states. A nucleotide variable analysis revealed that the IR areas had less variation than the SC areas, and there was the greatest diversity in the SSC area. Eleven hypervariable areas were identified, containing rpl32-trnL, rpl32, rps16-trnQ, trnT-trnL, trnQ-psbK, trnK-rps16, and rps15-ycf1, which could be used as labels for genetic diversity and taxa identification. The phylogenetic trees of 72 Rosaceae plants were constructed based on ML and BI methods. The results strongly support the theory that the Rubus genus was a monophyletic group and sampled species could be arranged into seven subgenera. Overall, this study sheds its new light into the phylogeny of the Rubus genus, providing valuable insights for future studies of the Cp genomes from the expanded taxa of the Rosaceae family.

1. Introduction

Rubus L. belongs to the Rosaceae family. As one of the biggest genera in the family, it encompasses a diversity of species including deciduous and evergreen shrubs, semi-shrubs, and perennial creeping herbs. It is also one of the genera containing the most taxa in Rosaceae. The genus is widely distributed, with more than 700 species in the world covering all seven continents except Antarctica, mainly in the temperate regions of the northern hemisphere and a few occurrences in the tropics and southern hemispheres [1,2,3]. A total of 208 taxa have been identified in China, with 139 of them being endemic to the country [4], and almost all of the distributed Rubus plants are native, with few cultivated species.
Rubus is a kind of plant that is essential to medicine and food. Its fruit has high nutritional value and is often used for fresh food, or for making jam, jelly, fruit juice, candy, wine, and vinegar. It is rich in vitamin C, flavonoids, anthocyanins, and other antioxidants, and is known as the “fruit of life” [5,6,7]. Since ancient times, the dried fruits, seeds, and leaves of Rubus are also often used in traditional Chinese medicine. It has a long medicinal history at home and abroad, with anti-cancer, anti-aging, anti-inflammatory, anti-oxidation, anti-thrombus, anti-microbial, and hypoglycemic effects [5,8]. Moreover, its root has a strong tillering ability, which can be used for the treatment of barren mountains and wasteland, as well as the treatment of soil heavy metal pollution [9,10]. Therefore, the genus Rubus is widely cultivated in Europe and the United States for its economic, medicinal, and ecological value. In addition, Rubus chingii Hu is endemic to China and is mainly distributed in the eastern region, so it is also known as “Huadong Fu-peng-zi”. R. chingii is the only species selected in Chinese Pharmacopoeia among 208 Rubus species [11], and the contents of ellagic acid and kaempferol-3-O-rutoside in dried fruits are the main criteria for judging medicinal quality. It has the function of tonifying kidneys, preventing spermatorrhea and reducing urine, and nourishing the liver and eyesight, so it is widely used in China.
The Rubus genus comprises numerous species with significant variability and complex types, including apomictic types that commonly experience polyploidy and hybridization [12,13,14]. Such complexities make delineating species boundaries within the genus challenging, consequently rendering it one of the most challenging flower plant genera to classify using traditional morphology. As such, molecular evidence is essential in studying the plastid phylogeny of Rubus, which enhances the understanding of accurate interspecies relationships and improves the development and utilization of wild seed resources.
Some molecular phylogenetic studies have been carried out in the taxonomy of Rubus [15,16,17]. Yang et al. studied the phylogeny of 21 Korean Rubus plants based on chloroplast fragments (trnL-trnF) and the nuclear gene LEAFY [18]; the results revealed that there were diversities between them and the subordinate taxonomy of Focke [3]. Wang et al. used Cp fragments (rbcL, rpl20-rps12, and trnG-trnS, ITS) and nuclear gene fragments (GBSSI-2 and PEPC) to analyze the phylogeny of 142 Rubus taxa [15]; the results revealed that the closely related taxa were difficult to distinguish, and the phylogenetic results of nuclear and plastid were inconsistent. In addition, the complete Cp genomes of some Rubus species have also been reported one after another, from 8 Rubus species endemic to Taiwan [19], to 51 Rubus species [2], and to 63 Rubus species belonging to six subgenera today [20]. However, for a large number of species in the genus, it is still worth further expanding the study.
With the decreasing cost of high-throughput sequencing and advancements in sequencing technology, genome information has gained widespread utilization in phylogenetic research. These developments have facilitated the integration of genome data into studies, enabling a more comprehensive understanding of evolutionary relationships among species. Up to now, although the whole genomes of six Rubus plants have been published, namely Rubus argutus [21], R. chingii [22], R. corchorifolius [23], R. idaeus [24,25], R. occidentalis [26,27], and R. parviflorus [28], the phylogenetic studies on them are still lacking. Apart from the Cp genomes of R. chingii and R. corchorifolius that were published (lacking overall comparative analysis), the whole Cp genomes from the other four taxa were not fully assembled and annotated. This incompleteness has led to a waste of valuable genome resources and hinders their full potential utilization. Due to its relatively conservative size, structure, and gene composition, as well as its ease of sequencing and assembly, the Cp genome has emerged as a useful tool for studying plant phylogeny and species identification [29].
To acquire an integrated opinion of the Cp genome structure in Rubus plants and pave the way for further studies on genetic diversity and phylogeny, we assembled and obtained six whole Cp genomes of Rubus based on their original whole-genome sequencing data. Our analysis involved comparing various characteristics of the genome, such as size, GC content, gene count, structural variations, collinearity and repeat sequences, nucleotide variable sites, and codon usage bias. Additionally, we carried out a phylogenetic analysis of the Cp genomes from all Rubus plants available in the NCBI database. This approach allows us to better understand the Rubus chloroplast genome structure and will prove helpful for future studies on the genetic diversity and phylogeny of Rubus plants and the expanded species of the family.

2. Materials and Methods

2.1. Sample Collection, DNA Extraction, and Sequencing

The young leaves of Rubus chingii Hu were collected from the raspberry planting base of Taizhou University. After being frozen with liquid nitrogen, the young leaves were taken back to the laboratory, and all of the genome DNA was isolated by the improved CTAB method [30]. The extracted DNA samples were preliminarily tested via 1% agarose gel, and the concentration and purity of DNA were detected by NanoDrop. The eligible DNA undertook double-end sequencing by the Illumina HiSeq 6000 platform with the 150 bp sequence read. Moreover, we downloaded the raw data of whole-genome sequences of Rubus idaeus L. (SRR24443182), Rubus argutus Link (SRR18716326), Rubus occidentalis H. Lév. (SRR25572467), Rubus parviflorus Nutt. (SRR25481745), and Rubus corchorifolius L. f. (SRR12424504) from the SRA database in NCBI for Cp genome assembly.

2.2. Chloroplast Genome Assembly and Annotation

Firstly, FastQC v0.11.7 was used to detect the quality of the original data [31], and the fastp v0.19.5 tool was used to remove the adapters of the raw data and delete the low-quality reads (i.e., the removal of reads with an N content of more than 10%; when the low quality (less than 10) base number contained in the single-ended sequencing read exceeds 20% of the length in the read, this pair of reads needs to be removed) [32]. The basic indicator statistics of the data before and after filtering were recorded in Table S3. Then, taking the whole Cp genome of R. amabilis (NC_047211) as the reference sequence, the above six Rubus data were assembled by Getorganelle v1.7.7 software to acquire the Cp genome sequences [33]. Clean reads mapping to Cp genome sequences was performed via the samtools v1.15.1 tool to detect its integrity. Then, the assembled complete Cp genomes were annotated by CPGAVAS2 and the GeSeq online database [34,35], the annotation information was compared via Geneious v11.0.18 software [36], and the contradictions were manually corrected to gain accurate annotation information. Finally, the online software CHLOROPLOT (https://irscope.shinyapps.io/Chloroplot/, accessed on 18 May 2024) was used to visualize the circle graphs of complete Cp genomes [37], and the whole genomes were submitted in the NCBI database to obtain the accession number. Details of all Rubus species were recorded in Table S1.

2.3. The Characteristics Analysis of the Cp Genome

The basic characteristics of Cp genome sequences from 6 Rubus species were analyzed by using CPGView (http://47.96.249.172:16085/cpgview/home, accessed on 18 May 2024) online software [38], including the length, GC content, and gene annotation of complete genome sequences and four main regions (LSC/IRa/SSC/IRb). In order to compare the contraction/expansion of the IR boundaries, we analyzed the manually corrected annotation sequence files through the IRscope (https://irscope.shinyapps.io/irapp/, accessed on 19 May 2024) online software [39].

2.4. Comparison of Diversity in Cp Genomes

To explore the gene recombination and arrangement of six Rubus Cp genomes, we used Mauve v2.4.0 [40] to analyze the collinearity of the whole genome to detect the existence of missing genes, repetitive genes, rearrangement genes, or translocation genes. Furthermore, the Cp genome sequences of Rubus were compared via the shuffle-LAGAN model in the mVISTA v2.1 software to identify the diversities among genomes [41]. The nucleotide divergence values (Pi) of Cp genomes were calculated by DnaSP v6.12.03 software [42], and the window length and sliding step size were set to 600 and 200 bp, respectively.

2.5. Repeat Sequences Identification

The simple sequence repeats (SSRs) in Cp genomes of 6 Rubus were recognized and counted via tool MISA-web [43]. The following parameters were set (unit size and min repeats): the mononucleotide was 10, dinucleotide was 5, trinucleotide was 4, tetranucleotide was 3, pentanucleotide was 3, and hexanucleotide was 3. Moreover, the online program REPuter [44] was used to count four types of dispersed sequence repeats (complement repeats, forward repeats, reverse repeats, and palindromic repeats) in complete Cp genomes, with the following parameter: the minimum repeat size of 30 bp and a hamming distance of 3. The tandem repeats were identified by Tendem Repeat Finder [45] with default parameters.

2.6. A Gene Selection Pressure Analysis of PCGs in Rubus

The non-synonymous substitution rate (Ka), the synonymous substitution rate (Ks), and their ratio (Ka/Ks) were calculated via the KaKs_Calculator 2.0 tool [46]. Before calculation, we first extracted all the coding sequences and protein sequences from the Cp genomes, took the protein sequence of R. amabilis as the reference sequence, and compared it with the protein sequences of another six Rubus taxa by the BLASTN v2.10.1 program, so as to obtain the homologous protein sequence. Then, the shared PCGs were aligned via MAFFT v7.427 software [47]. Finally, we used the KaKs_Calculator 2.0 tool to calculate Ka and Ks.

2.7. Codon Usage Bias Analysis

To analyze the diversities of base composition and the relative synonymous codon usage (RSCU) among six Cp genomes of Rubus, the base composition of Cp sequences was counted in Geneious v11.0.18 software, all the PCGs were extracted and exported to the FASTA format and analyzed by CodonW v1.4.2 software, the number of codons was encoded by the PCGs, and the RSCU were obtained. The RSCU > 1 indicated that there was a codon usage bias, RSCU = 1 indicated that it lacked a codon usage bias, and RSCU < 1 indicated that the codon was used less frequently. Furthermore, in order to further assess the codon usage bias of coding genes, we used the ENC online computing tool to obtain the GC content (GC1, GC2, and GC3) and effective number of codon (ENC) from six Cp genomes and discussed the relationship between ENC and GC3 distribution. The ENC value indicated the degree to which the codon usage bias was from random selection [48], and ENC-plot was an effective method to break down the influencing factors of codon usage preference in genetic data.

2.8. Phylogenetic Analysis

To determine the evolutionary relationship of the six newly assembled Rubus taxa in the whole Rubus species, we downloaded all the complete Cp genomes of Rubus plants (a total of 62) available from GenBank in NCBI. Moreover, 2 Fragaria plants and 2 Rosa plants were downloaded as outgroups. Details of all samples were interpreted in the supplementary information (Table S1).
Firstly, the unique common genes in 72 chloroplast genomes were extracted by Phylosuit v1.2.3 software [49], and the sequences were aligned by the MAFFT program in Phylosuit. All the gene sequences after alignment were concatenated by the Concatenate program to obtain a super gene sequence, and the sequence was optimized by Gblocks v0.91b. Then, the optimized sequence was imported into IQ-TREE v2.2.0.3 [50] to construct the maximum likelihood (ML) tree with the following parameters: bootstrap values set to 5000 and the best model (GTR+F+I+G4) was found by the ModelFinder tool [51]. The Bayesian inference (BI) tree was constructed via the MrBayes v3.2.7a [52] tool, and the GTR+I model was selected by the jModelTest tool [53]. The number of chains and runs was set to 4 and 3, respectively. All other parameters referred to previous studies [54]. Finally, the online website Chiplot was adopted to visualize the evolutionary trees [55].

3. Results

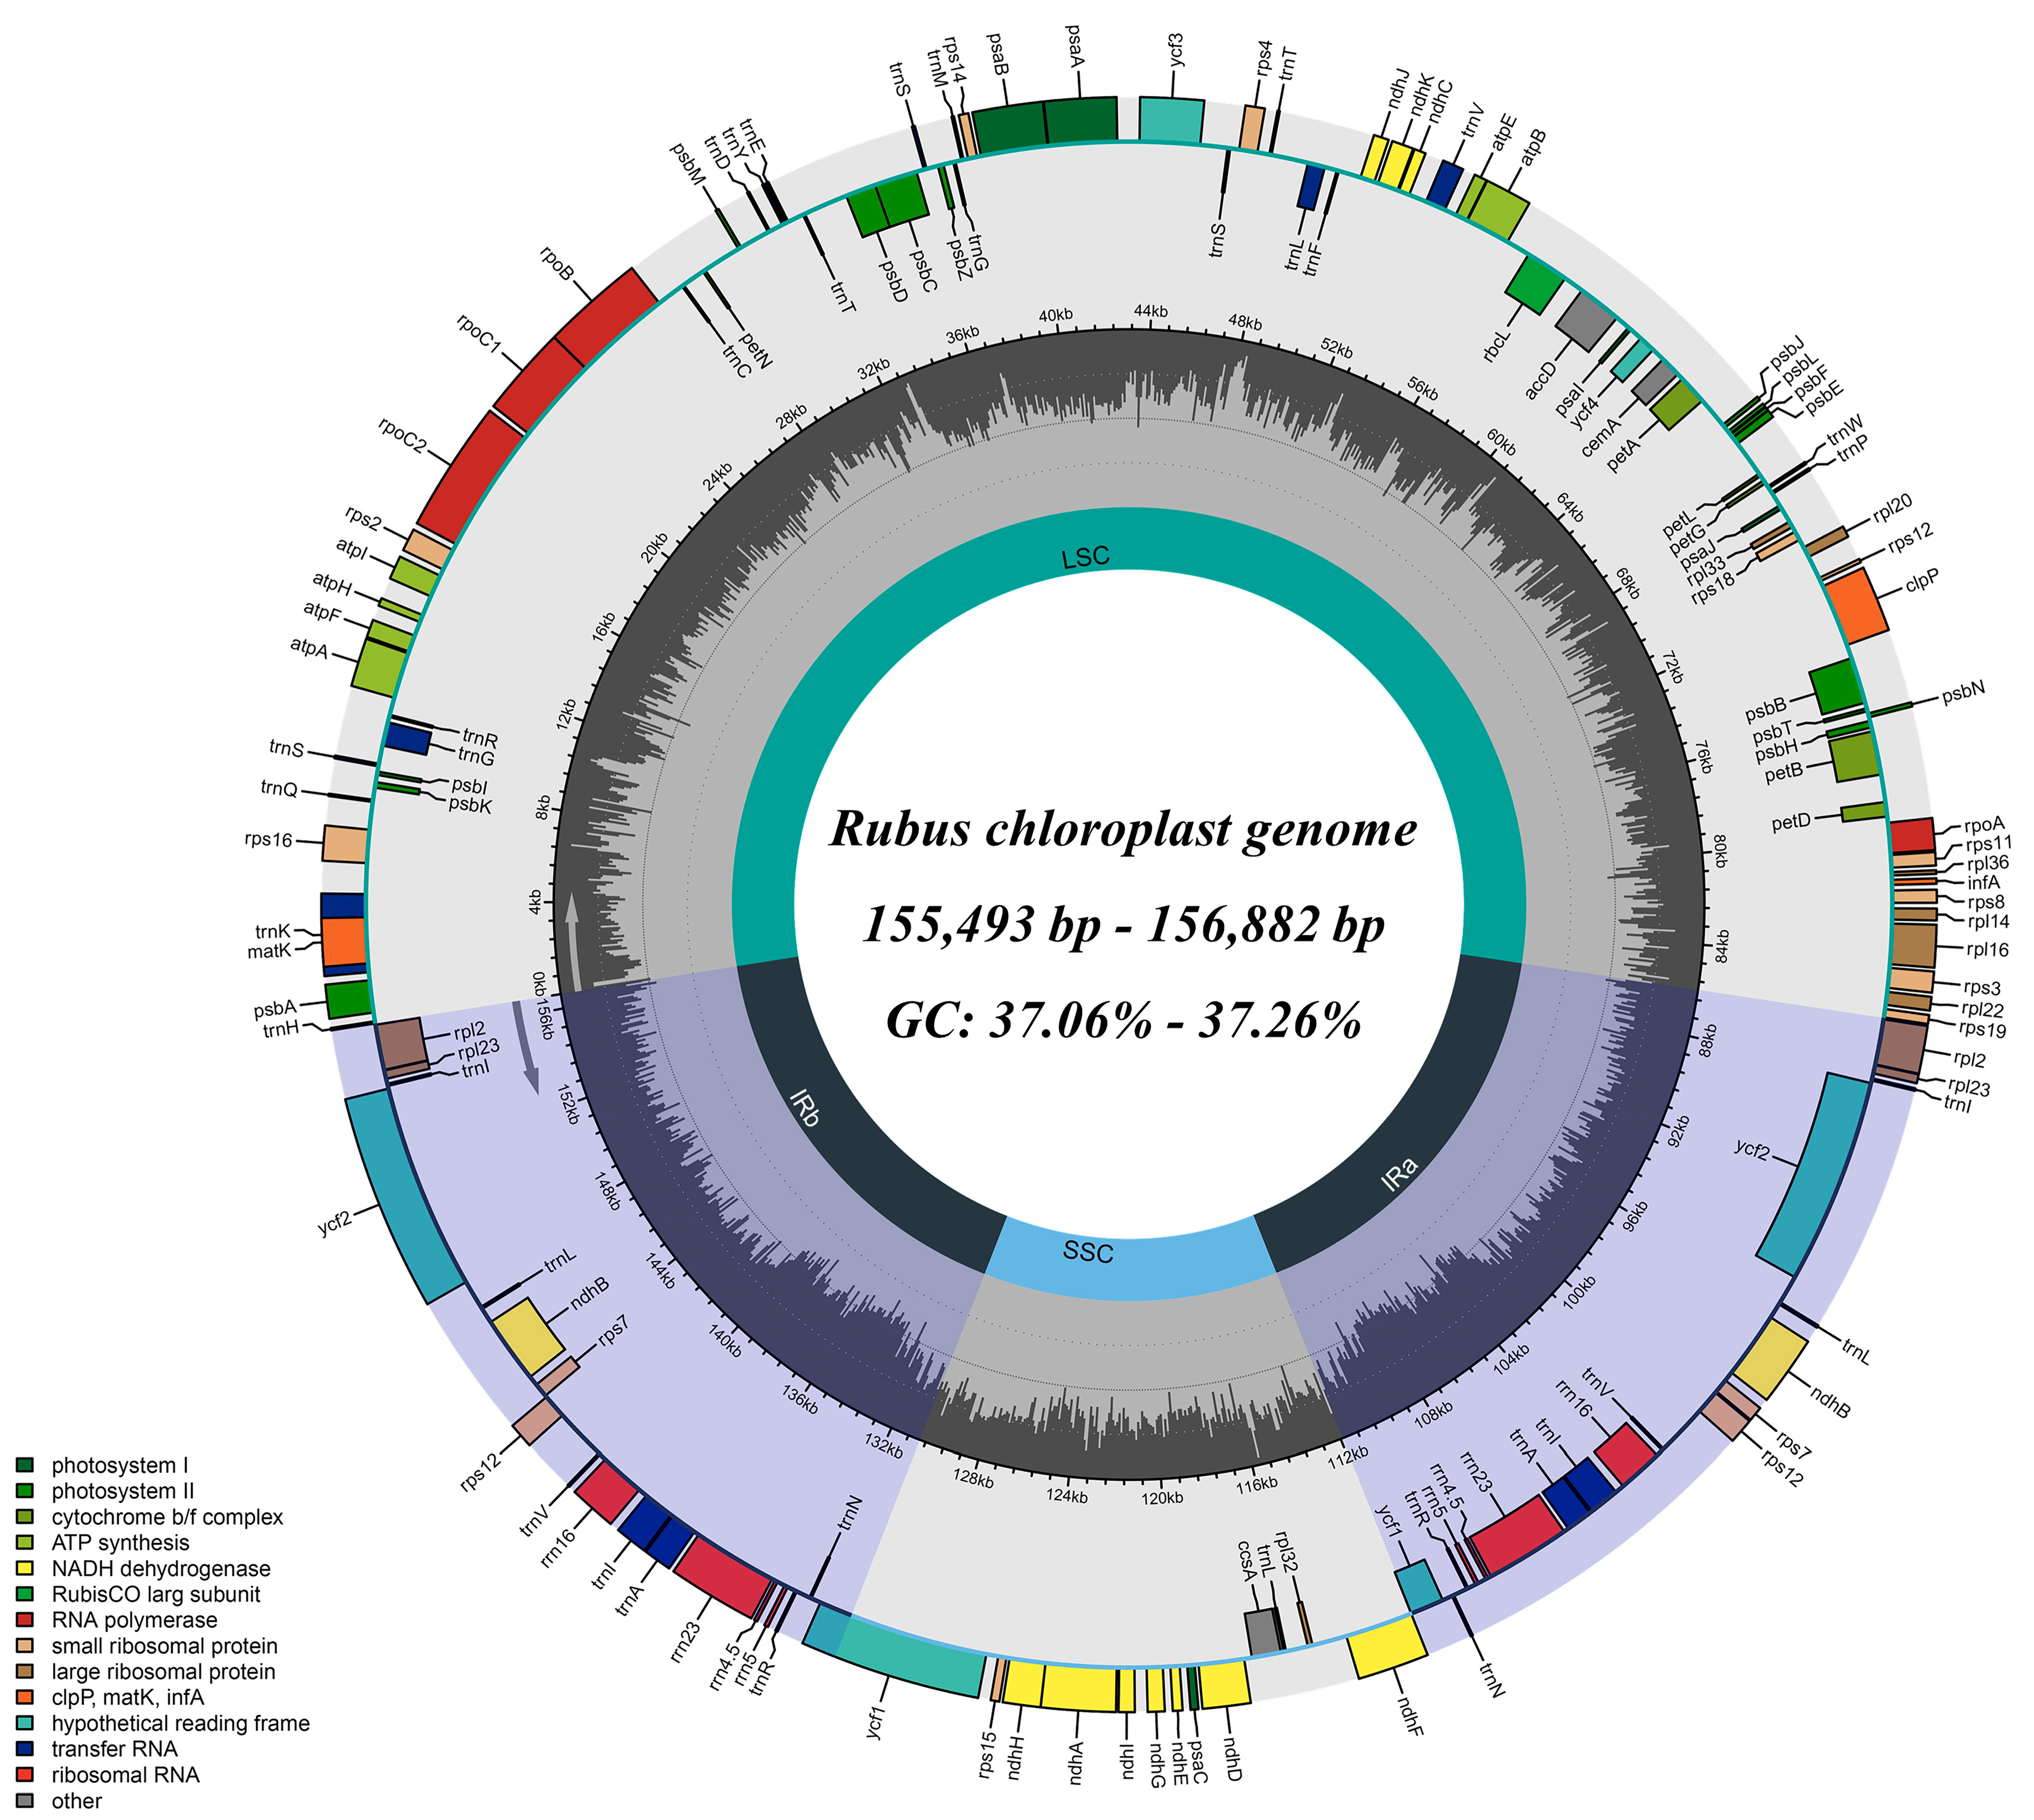
3.1. Basic Characteristics of Rubus Chloroplast Genomes

The Cp genomes of the six newly assembled plants of Rubus had some differences; the size of Cp genomes ranged from 155,493 bp (R. corchorifolius) to 156,882 bp (R. parviflorus) (Figure 1). Furthermore, they also had some similarities, showing a classic quadripartite formation with two single copy areas (LSC and SSC) divided by a pair of inverted repeats (IRa and IRb). The length of LSC/SSC/IR ranged from 85,026 bp (R. idaeus) to 86,069 bp (R. parviflorus), from 18,702 bp (R. corchorifolius) to 18,843 bp (R. occidentalis), and from 25,749 bp (R. chingii) to 26,009 bp (R. occidentalis). The GC contents from six Cp genomes were basically consistent, ranging from 37.06% to 37.26% (Table 1). The content of GC in the IR region (42.78%–42.84%) was greater than that in the LSC block (34.91%–35.18%) and the SSC block (30.83%–31.36%).
The six newly assembled Cp genomes of Rubus were not only structurally conserved, but also quite conserved in the number of coding genes. They all encoded 111 genes (unique), containing 79 PCGs, 28 tRNAs, and 4 rRNAs, respectively (Table 1). Their functions were classified into three categories, including photosynthesis, self-replication, and other genes (Table S2); in total, 13 genes (ndhA, ndhB, petB, rpl16, rpl2, rps16, rpoC1, trnA-UGC, trnG-UCC, trnI-GAU, trnK-UUU, trnL-UAA, and trnV-UAC) have 1 intron and 3 genes have 2 introns (ycf3, clpP, and rps12) (Table S2 and Figure 1). Furthermore, the Cp genomes contained 49.61%–51.49% CDS region, 29.24%–32.25% non-coding region, 7.46%–7.81% RNA region (tRNA and tRNA), in which the GC content of the rRNA region (55.00%–55.46%) was higher than that in the CDS region (37.75%–38.01%) and the non-coding region (31.23%–31.68%) (Table 1).

3.2. Comparison of the IR Region Expansion/Contraction among Different Species

To explore the expansion and contraction of the IR area in Cp genomes of six Rubus taxa, the boundaries of their IR/SC were compared and analyzed. The results displayed that there were few diversities among the Cp genomes from the six plants, and the length of the IR region and the border between the IR area and SC area were highly conservative, but there were some differences among these species (Figure 2A). The rps19 and rpl2 genes were located at the border of LSC/IRb, the ndhF gene was located at the border of SSC/IRb, and the rpl2 and trnH genes were located at the boundary of LSC/IRa. The two ycf1 genes spanned the SSC/IRb and LSC/IRa regions, respectively, and the truncated lengths were slightly different, which may be the reason for the small variety in Cp genome size in the Rubus species.

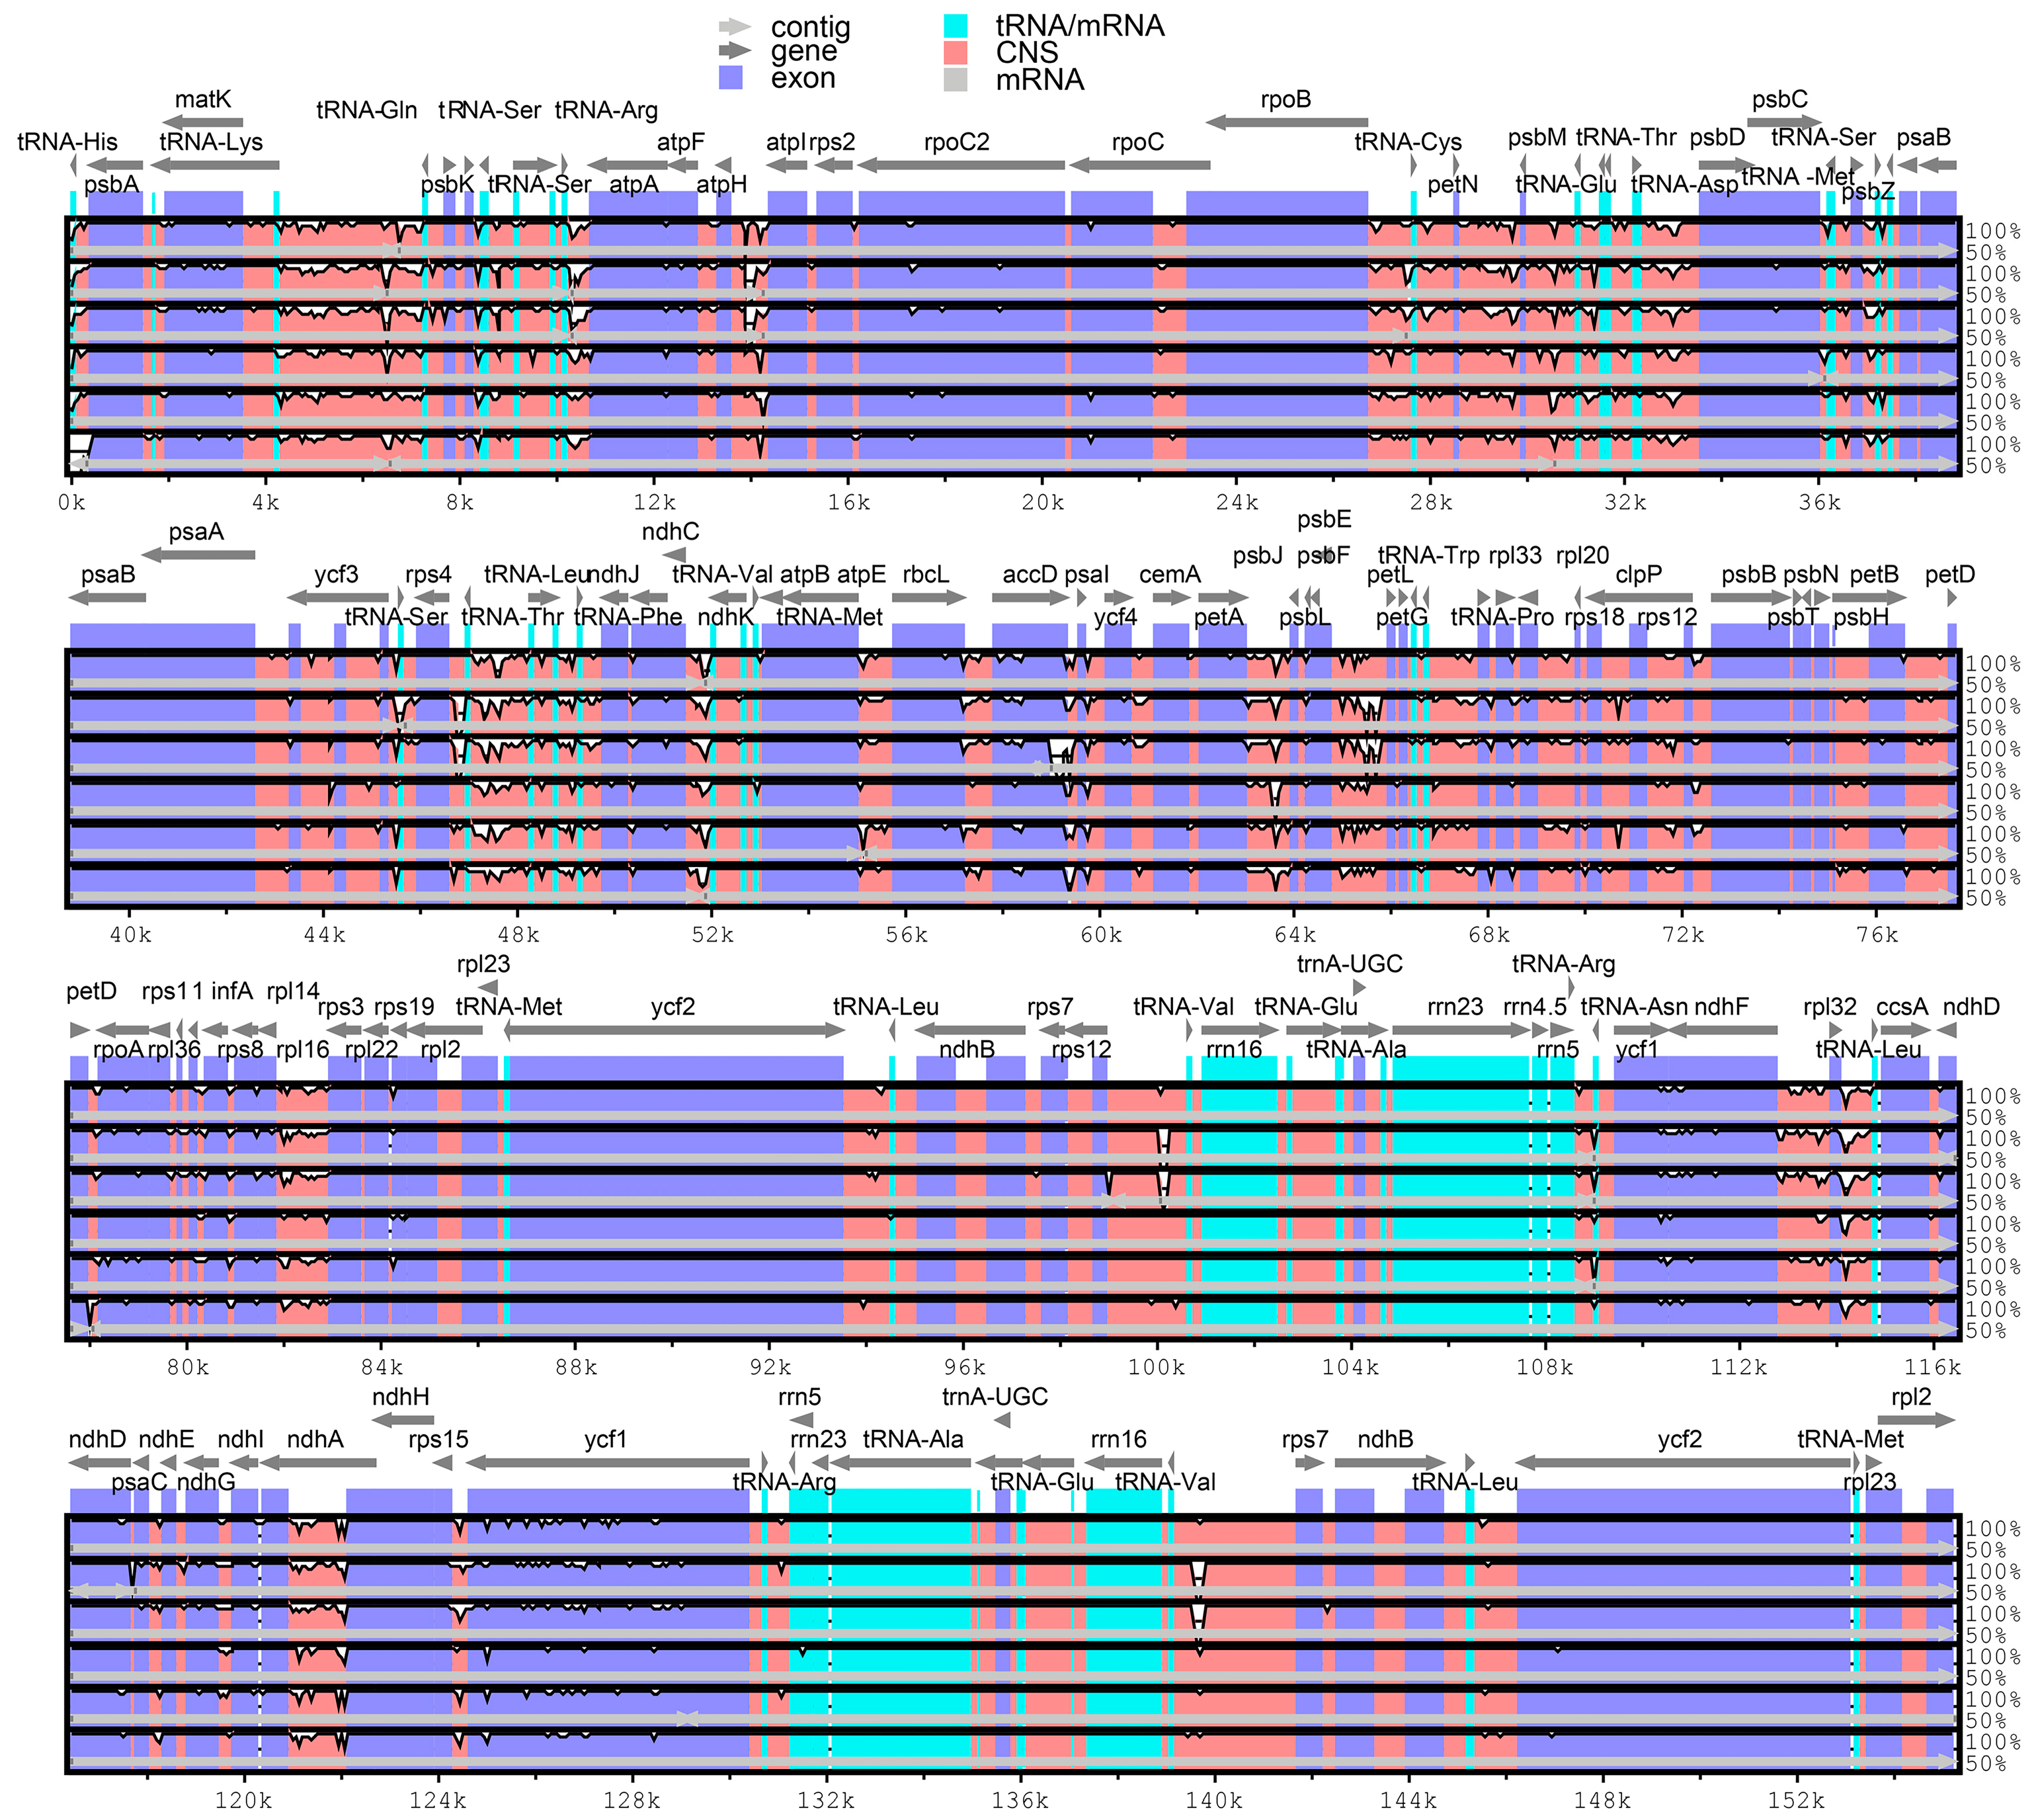
3.3. Comparative Cp Genome Sequences Diversities and Hotspots Regions

In order to detect the gene recombination and arrangement of six Rubus Cp genomes, we used MAUVE v2.4.0 software to compare the six Cp genomes (Figure 2B). The results displayed that there were local shared blocks among the Cp genomes, and all genes were highly conserved and lacked gene recombination and inversion. Moreover, in order to detect gene variation, the Cp genome of R. amabilis was used as the reference sequence, compared with six newly assembled Cp genomes, and the differences among species were determined by mVISTA software (Figure 3). The results displayed that the inverted repeat was less variable than the single copy area, while the diverged regions mainly appeared in the non-coding regions (CNS), such as trnK-trnQ, trnS-trnR, trnD-psbD, rps12-trnV, rpl32-trnL, and so on. In the protein coding region, the ycf1 gene was the most variable. Generally speaking, the sequences of the six Cp genomes were highly similar.
Based on the sliding window analysis of DnaSP software, the nucleotide diversity (Pi) was calculated, and the total average value was 0.01021, ranging from 0 to 0.06044 (Figure 4). The Pi value of the SSC area (Pi = 0.01764) was the greatest, followed by the LSC area (Pi = 0.01317), while the IR region (Pi = 0.00325) was relatively conservative. The 11 highly variable regions were detected, namely rpl32-trnL (Pi = 0.06044, 0.05733), rpl32 (Pi = 0.04856), rps16-trnQ (Pi = 0.04589, 0.04178), trnT-trnL (Pi = 0.04378, 0.03944), trnQ-psbK (Pi = 0.03622), trnK-rps16 (Pi = 0.03567, 0.03478), and rps15-ycf1 (Pi = 0.03467). Among them, seven hypervariable blocks were located in the LSC region, while the largest high variable site was located in the SSC region. These hypervariable blocks can be used as specific markers for species identification.

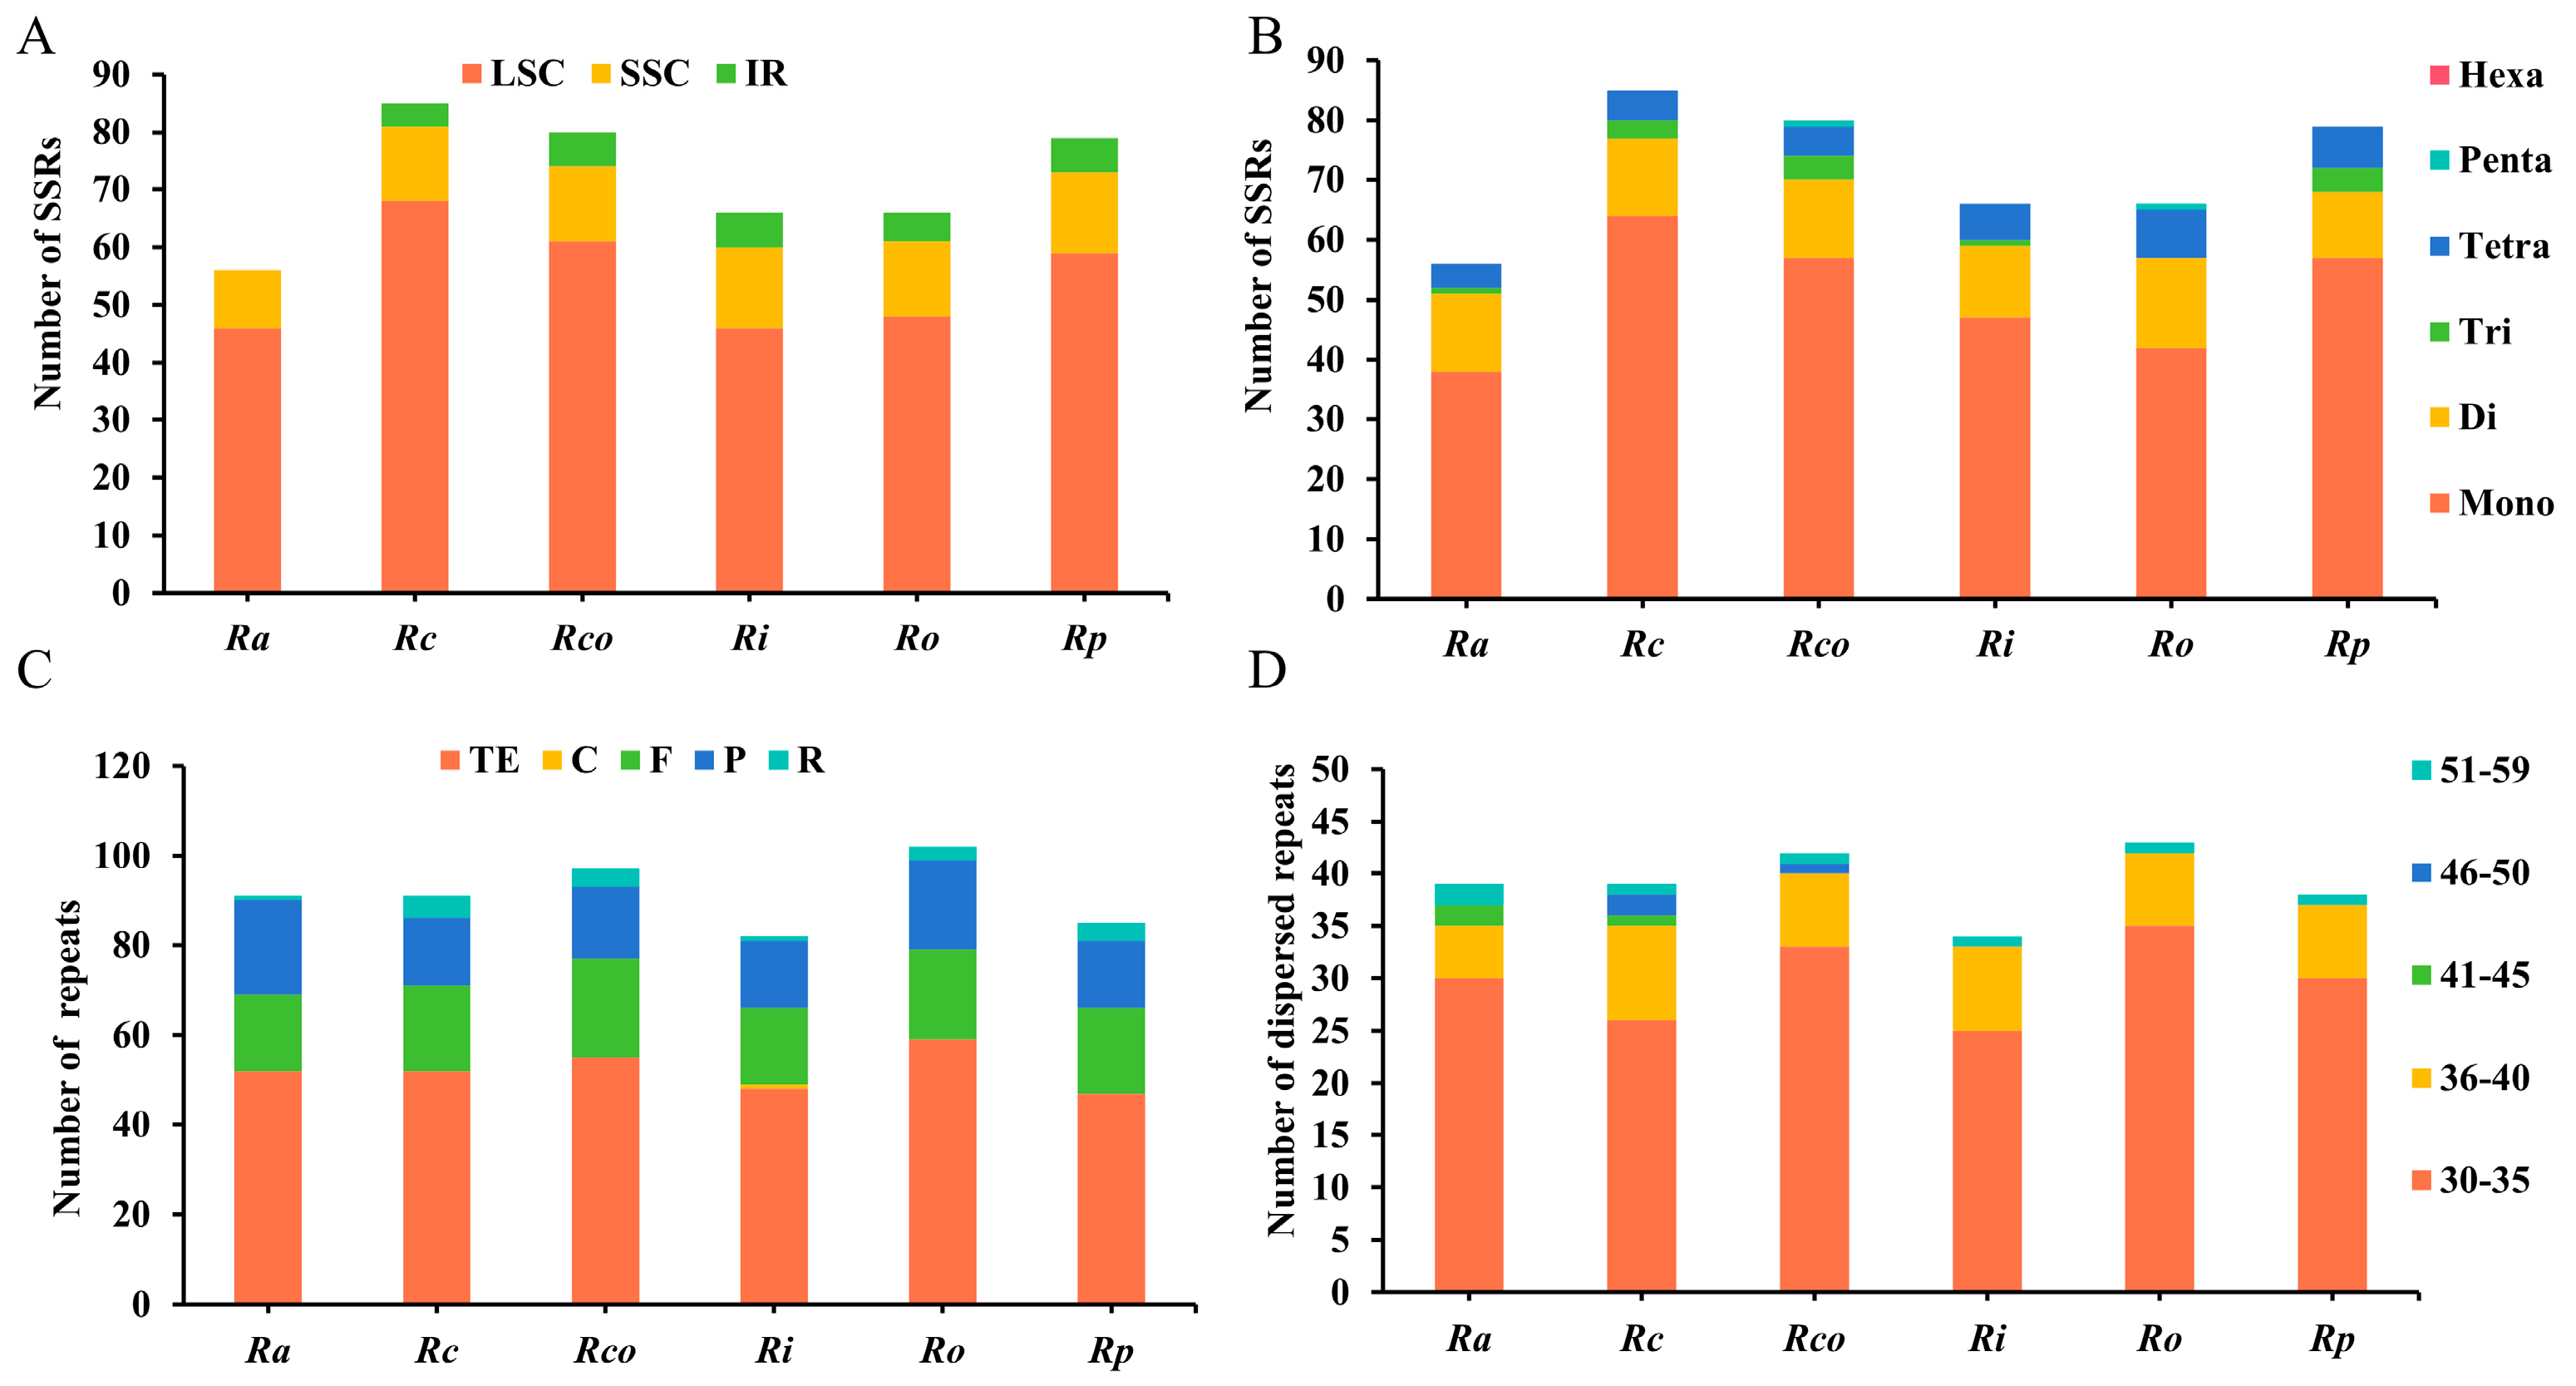
3.4. Repeat Sequences Analysis

The characteristics of SSRs from six newly assembled Cp genomes of Rubus were analyzed (Figure 5A,B). A total of 56, 85, 80, 66, 66, and 79 SSR loci were detected in the Cp genomes of six species (R. argutus, R. chingii, R. corchorifolius, R. idaeus, R. occidentalis, and R. parviflorus), respectively. Among them, the most abundant SSR was the A/T nucleotide repeat sequence, accounting for 62.12%–72.94% of the total sequences. The SSR distribution patterns of R. argutus varied greatly from those of other species; however, the SSR of the other five taxa were distributed in four regions (LSC/SSC/IRs), mainly in the LSC region (69.70%–80.00%), and less commonly in the SSC region (15.29%–21.21%) and the IR region (4.71%–9.09%). However, the SSRs of R. argutus were only distributed in the LSC (82.14%) and SSC (17.86%) areas. Moreover, there were some differences in different types of SSR among different species, in which there were four types (Mono-/Di-/Tri-/Tetra-) of nucleotide repeat sequences in R. argutus, R. chingii, R. idaeus, and R. parviflorus, while the other two species had more Penta-nucleotide repeat sequences (Figure 5B).
In six Cp genomes, 34–43 dispersed repeats of 30 bp or longer were detected, respectively (Figure 5C,D). Among them, the number of forward repeats (43.59%–52.38%) and palindromic repeats (38.10%–53.85%) was larger, the number of reverse repeats (2.56%–12.82%) was smaller, and only one complement repeat was found in R. idaeus (Figure 5C). And, the majority of these repeat sequences were distributed in LSC areas (58.82%–74.36%). Furthermore, most sequence lengths were distributed between 30 and 35 bp (66.67%–81.40%), followed by 36–40 bp (12.82%–23.53%), while sequences of 41–59 bp were less numerous or only existed in some species (Figure 5D). We also detected 47–55 tandem repeats in six species.

3.5. Synonymous and Non-Synonymous Substitution Rate Analysis

Taking the Cp genome of R. amabilis as the reference sequence, the Ka and Ks changes of the Cp genome of the remaining six Rubus were analyzed (Figure 6). The Ka/Ks ratio values of 79 PCGs from the six Cp genomes were calculated. Interestingly, the Ka/Ks ratio values of all PCGs were less than 1 or could not be detected, and when the values of Ka or Ks were 0, this also showed that they were extremely conserved. These genes were undergoing negative selection in six species, and the genes of different species were extremely similar.

3.6. Codon Usage Bias Statistics

According to the statistical analysis of codon usage preference, in the Cp genomes from six Rubus taxa, the size of PCGs was 77,748–80,175 bp, encoding 25,916–26,725 codons. Among the six species, the largest codon number encoded by isoleucine was 1995–2056, followed by lysine (1987–2032), while in R. corchorifolius and R. parviflorus, lysine encodes the most codons (2003 and 2012), followed by isoleucine (2002 and 2007), which contrasted with the other four species (Figure 7B). The number of codons encoded by methionine was the smallest among the six species. Furthermore, the RSCU values were slightly different in the Cp genomes of six plants (Figure 7A). It was found that the 32 codons RSCU > 1 in all taxa, of which 29 codons ended with A/U; in total, if the 30 codons with RSCU < 1, 30 codons ended with C/G. However, the RSCU of Tryptophan was 1 and there was no codon bias.
In addition, in order to evaluate the codon usage favor of each Cp genome and the factors affecting the usage pattern, we extracted 79 PCGs shared by six species, and calculated their GC content at the first, second, and third sites and the ENC. The results showed that the values of GC1, GC2, and GC3 were 39.65%–46.74%, 38.02%–41.19%, and 29.45%–32.98% (Figure 7D), respectively. However, the GC content of R. idaeus was quite different from that of the other five species, as that of the other species were similar and the average value was less than 50%, indicating that there was a codon usage bias for the A/T base and the A/T ending codon in the Cp genome of these five taxa. The ENC values ranged from 47.59% to 51.71% with an average of 48.42%, indicating that there was a codon usage favor in the Cp genomes from the six taxa. Furthermore, an ENC-plot analysis displayed that most PCGs were below the curve, and only a few genes were distributed above the curve (Figure 7C), indicating that the codon ENC value was low, which was significantly correlated with the level of gene expression and displayed a certain codon usage favor. The trend of these factors in the six taxa was the same.

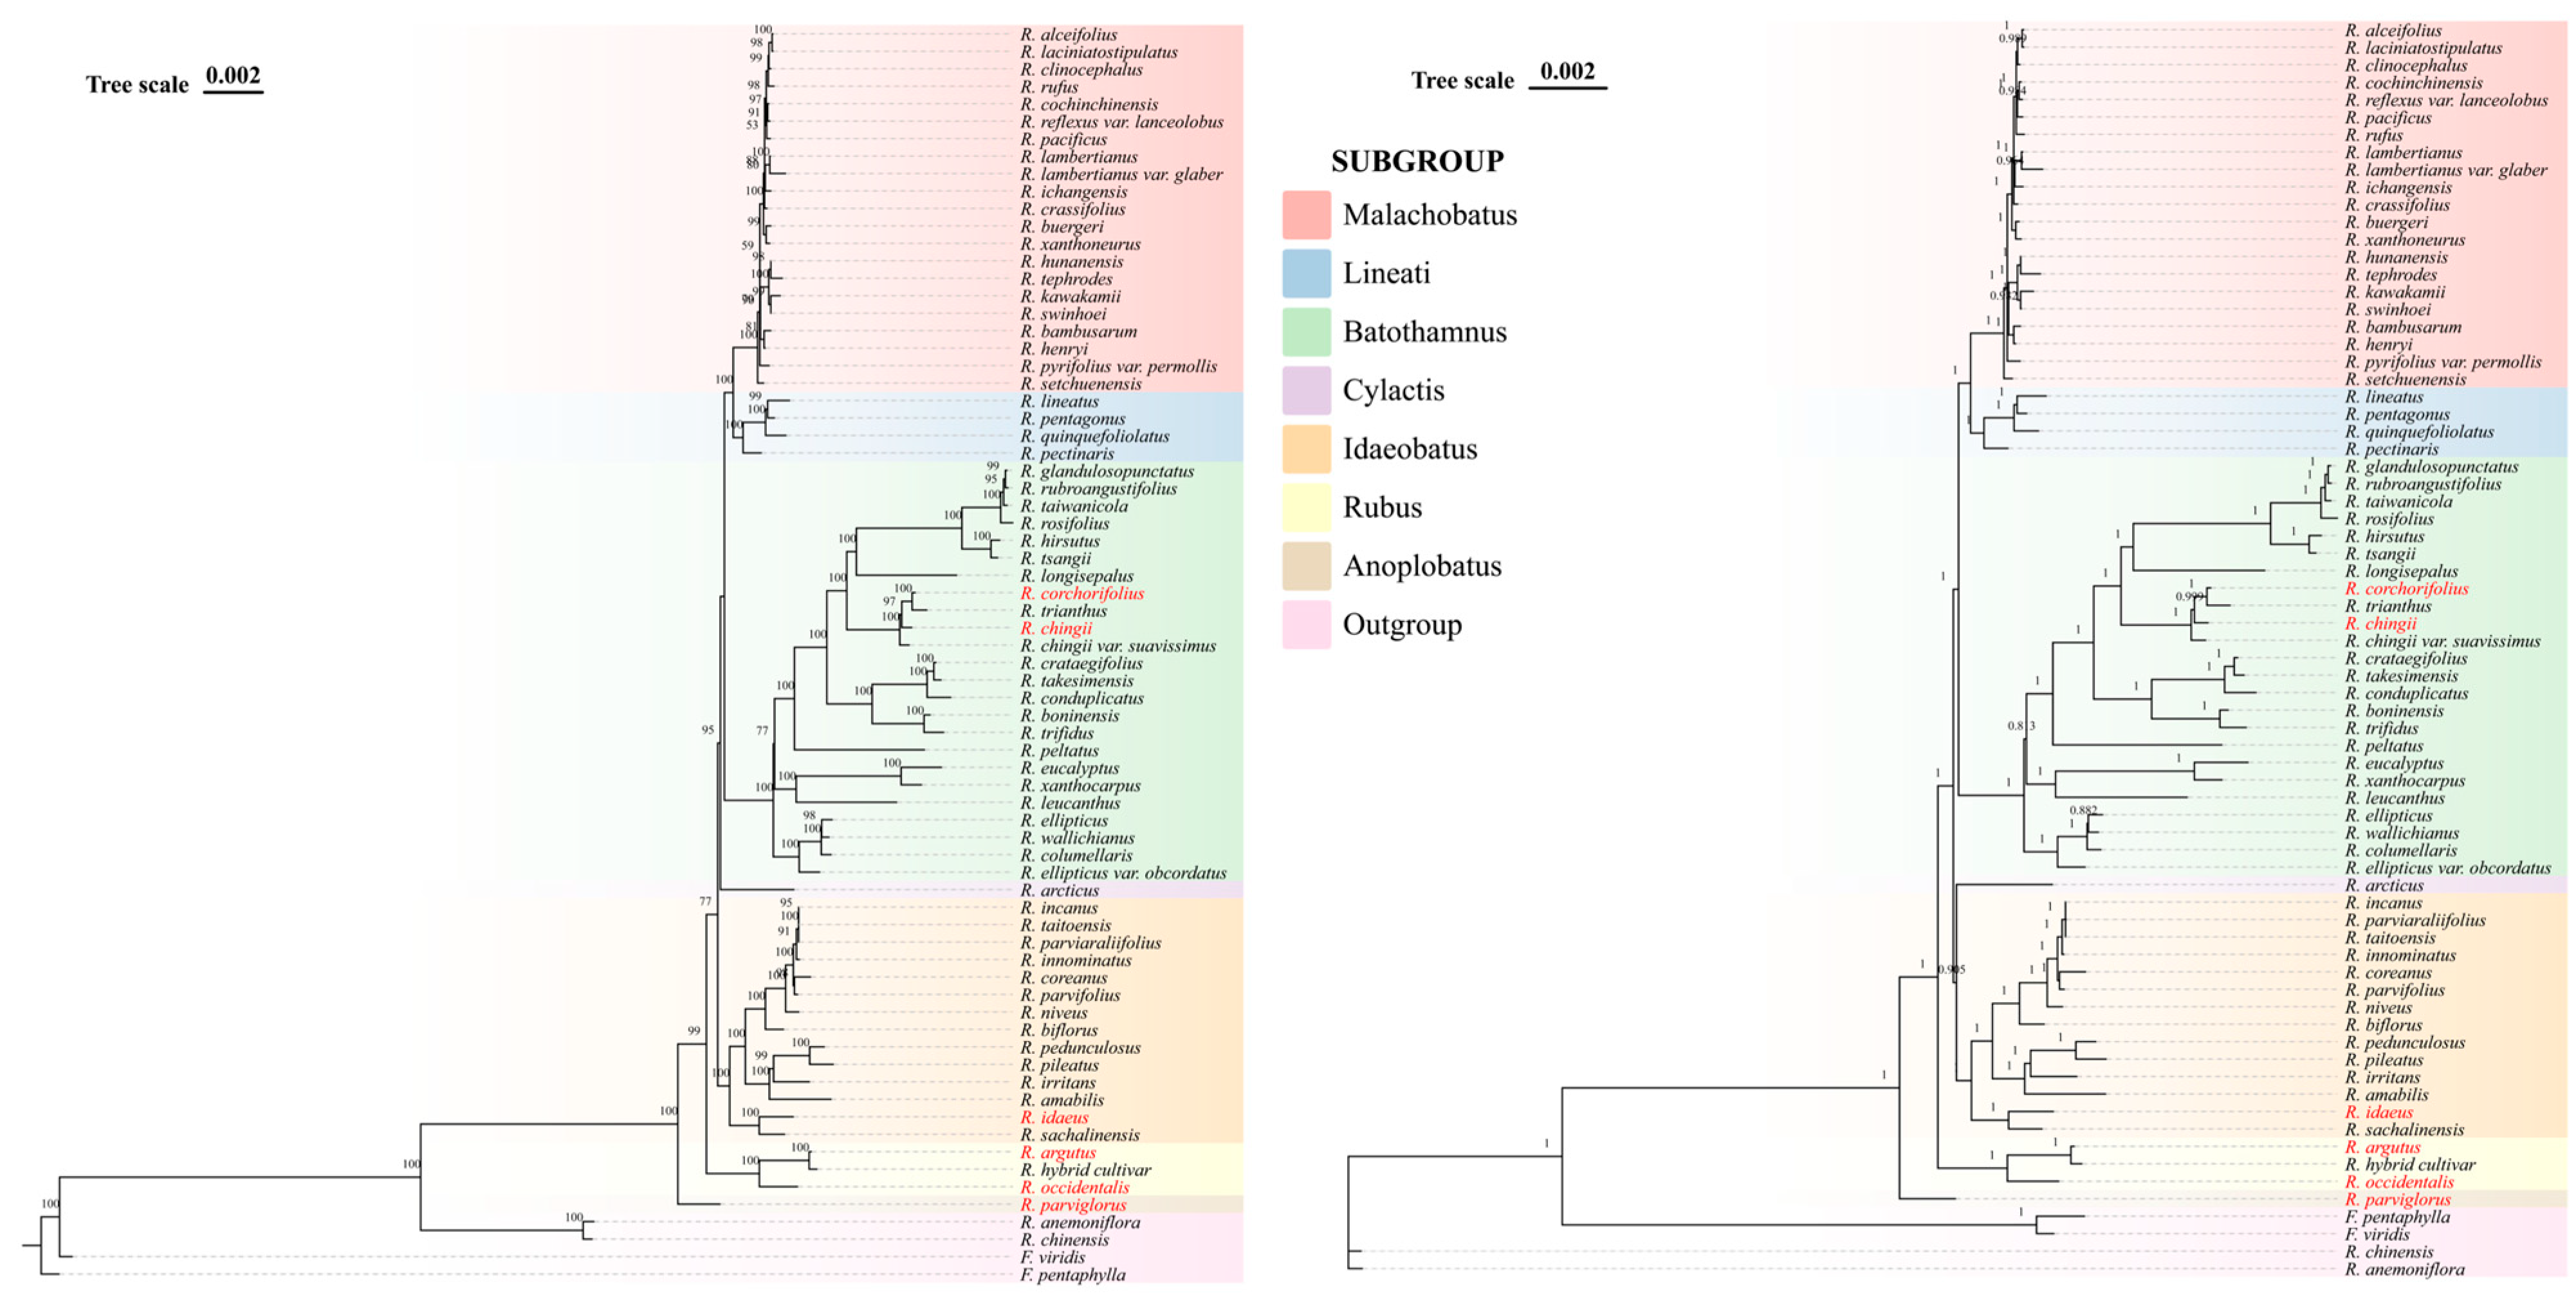
3.7. Phylogenetic Analysis

In this research, the ML method and the BI method were used to analyze the plastome phylogeny of 72 Rosaceae plants with the 66 shared PCGs from the Cp genomes used as the data set. All of the species included 68 Rubus plants (six newly assembled Cp genomes), 2 Fragaria, and 2 Roses as outgroups, covering all the published Rubus plants. The topologies of the evolutionary trees constructed via two different methods were basically the same and highly supported (Figure 8). A phylogenetic analysis showed that 68 Rubus plants formed a monophyletic group and were strongly supported. Among the 68 Rubus plants, they could be divided into seven subgroups (R. subgroup Malachobatus, Lineati, Batothamnus, Cylactis, Idaeobatus, Rubus, and Anoplobatus) according to Huang et al.’s classification system [56]. In phylogenetic trees, R. parviflorus plastome represented the first separating lineage. R. occidentalis and R. argutus belonged to the subgroup Rubus and their plastomes formed a clade. Plastomes of R. idaeus and R. sachalinensis were sister groups within a clade corresponding to R. subgroup Idaeobatus, while R. chingii, R. corchorifolius, and R. trianthus were the closest relatives located among plastomes of R. subgroup Batothamnus representatives. At present, the phylogenetic tree only showed the phylogeny of plastomes from existing groups. In order to further study the evolutionary relationships in the whole Rubus species, it is necessary to analyze the nucleotide sequences from nuclear genomes also, in addition to plastome phylogenies.

4. Discussion

In this study, six new complete Cp genomes were assembled and compared to further understand the Cp genome information and taxonomy system of Rubus. The six newly assembled Rubus Cp genomes, like most angiosperm Cp genomes [57,58], had a highly conserved framework, consisting of an LSC area, an SSC area, and two IR areas, forming a typical quadripartite structure (Figure 1). The size of the complete Cp genomes ranged from 155,493 bp to 156,882 bp, which was similar to that of most angiosperms (120–170 kb) [59] and was relatively stable. The length difference among different species of Rubus was about 1 kb (Figure 1). Moreover, the higher the GC content, the more stable the sequence and the lower the mutation rate, and the GC contents of most angiosperm Cp genome sequences were 30%–40%, which were greater than that of the LSC and SSC areas [60,61,62]. The overall GC contents of the Cp genome of Rubus ranged from 37.06% to 37.26%, and the GC content of rRNA genes (55.00%–55.46%) in the IR region were high, resulting in a higher overall GC content (42.78%–42.84%) of the IR region, compared with the LSC (34.91%–35.18%) and SSC regions (30.83%–31.36%) (Table 1). The same phenomenon was also shown at the level of Cp sequences alignment, which displayed that the IRs areas were more conservative than the SC areas, and the ycf1 gene had the greatest variability (Figure 3). In addition, other genes had high similarity among six Rubus species, and lacked gene rearrangement and inversion (Figure 2B).
In the process of Cp genome evolution in angiosperms, the expansion/contraction of the IR boundary and gene loss were considered to be the main reasons for the difference in Cp genome size among different species [63,64,65], while the highly variable genes in the IR boundary could be used as evolutionary markers to study the phylogenetic relationship between different groups [66]. In this research, the comparative analysis with Cp genomic IR/SC boundaries of six Rubus species showed that the structural regions among Rubus species were relatively stable, and there was no obvious IR expansion/contraction (Figure 2A). Although there was no greatly significant change in the overall IR boundary, there was one different gene in the IRb/SSC and IRa/SSC boundary region, namely ycf1, and there was a certain difference in size among different species, which was similar to that of other Rubus genomes [2,67]. Therefore, the ycf1 gene in the IR boundary block can be used as key marker gene in interspecific phylogeny to study the evolutionary status of taxa.
The gene content of the Cp genome in terrestrial plants was highly conservative, usually containing 100–120 genes [68]. The loss of genes and introns was particularly prominent in some plants, such as parasitic plants such as dodder and mistletoe and the photosynthetic family ndh was lost as a whole [69,70]; the rps16 gene of Gentiana was lost [71] and the clpP gene of kiwifruit was lost [72]. The number of genes from six Rubus Cp genomes was 111. Furthermore, six species all contained two ycf1 genes, one copy was a complete gene and the other copy was truncated by the boundary between the IRs area and the SSC area (Figure 2A), which might be a pseudogene, such as those found in the plants from Nelumbonaceae, Salicaceae, and Brassicaceae, and some plants even had a complete loss of the ycf1 gene [73,74,75,76]. On the other hand, the loss of the ycf1 gene was linked to direct independent loss, and there was no horizontal gene transfer [77]. Therefore, it was speculated that the lack of genes and the change of copy number may be the main reasons for the difference in Cp genome size.
The Pi value is not only a marker of the degree of difference of the DNA sequence, but also represents the genetic variations of taxa [78]. In the study of Rubus, the intergenic region (trnS-trnG and trnS-trnG) and coding genes (ndhF, rbcl, and rpl16) were often used to reconstruct the phylogenetic relationship [15,79,80,81,82], but the low level of sequence variation provided limited information and could not solve the intra-genus relationship well. Therefore, eleven high-resolution regions (Figure 4), including rpl32-trnL (Pi = 0.06044, 0.05733), rpl32 (Pi = 0.04856), rps16-trnQ (Pi = 0.04589, 0.04178), trnT-trnL (Pi = 0.04378, 0.03944), trnQ-psbK (Pi = 0.03622), trnK-rps16 (Pi = 0.03567, 0.03478), and rps15-ycf1 (Pi = 0.03467), were screened according to nucleotide polymorphisms, which can be used as effective molecular indicia for taxa identification and phylogeny within the genus.
Repeat sequences have great potential in explaining the evolutionary history of chloroplast genomes [83]. The type, number, and location of repeat sequences vary from species to species and can be used as molecular markers to help identify species and phylogeny [84]. In this study, we identified 34–43 dispersed repeat sequences in six raspberry plants, of which forward and palindromic repeat sequences dominated, and the majority of them were distributed in the LSC area (Figure 5C,D). The interspecific variation trend was consistent, which also reflected the high conservation of Cp genomes. Moreover, 50–85 SSRs loci were identified, of which the main repetitive type was A/T (Figure 5A,B), which was similar to that of most plants [85,86,87]. The mononucleotide repeat type of SSR may be a possible molecular marker in the genetic various and phylogeny of Rubus and its related taxa.
When the base mutation does not change the amino acid, the synonymous mutation occurs; on the contrary, it is a non-synonymous mutation, which is often affected by natural selection [88]. If the Ka/Ks > 1, there is a positive selection effect, and when the Ka/Ks < 1, there is a purification selection effect [89]. Interestingly, the Ka/Ks ratio values of all genes were less than 1 (Figure 6), indicating that all genes were under the state of purifying selection, which is different from that of most plants [2,88,90]. Even in the study of the same genus, there are great differences. A study found that 29 PCGs of eight Rubus species from Taiwan experienced positive selection [19]. Another study found that all the PCGs of 64 Rubus species were under purifying selection [20], which was same as the results of this study. This huge difference may be due to different reference genomes or methods selected for analysis. Furthermore, gene composition and natural selection are two main factors affecting codon usage bias [91,92]. In the Cp genome of Rubus plants, there were 63 codons that encode 20 amino acids, and the codon usage favor was the third codon position A/T (Figure 7), which was consistent with most plant groups [93,94,95].
The maximum likelihood and Bayesian phylogenetic trees were reconstructed using the Cp genome of 72 species (Figure 8). The tree topology was relatively stable, and the whole genome had a high support value and good resolution, which was similar to the results of previous studies [2]. In this study, six Rubus species belonged to four subgenera. Among them, R. occidentalis and R. argutus belonged to the subgroup Rubus. Plastomes of R. idaeus and R. sachalinensis were sister groups within a clade corresponding to R. subgroup Idaeobatus, while R. chingii and R. corchorifolius were the closest relatives located among plastomes of R. subgroup Batothamnus representatives. R. parviflorus was the basalmost taxon in the plastome phylogeny of Rubus. The topology tree was consistent with the phylogenetic tree constructed by the whole genome [23]. These results partly reflected the plastome phylogeny of Rubus, and provided tried authentication for the phylogeny and molecular identification of medicinal and edible plants.

5. Conclusions

In this study, the Cp genomes of six Rubus species were assembled, annotated, and compared. The plastids of Rubus were highly conserved; only the genome size, the number of repeats, and the IR boundary were slightly different. Furthermore, we confirmed 11 regions with high Pi values, which can be used as potential molecular markers for future genetic and phylogenetic studies. The results of phylogenetic analyses showed that the plastomes of Rubus formed a monophyletic group and the six new plastomes found their place in four subgenera. The findings of this study not only contribute to the development and utilization of Rubus resources, but also provide data support for subsequent phylogenetic, genetic engineering, and population genetics studies.

Supplementary Materials

The following supporting information can be downloaded at: https://www.mdpi.com/article/10.3390/f15071167/s1, Figure S1: Codon usage bias analysis of PCGs in chloroplast genomes of five Rubus species; Table S1: Details of chloroplast genomes for 72 species; Table S2: Gene annotation of Rubus chloroplast genome; Table S3: Basic information statistics of sequencing files.

Author Contributions

Y.S., Z.C., J.J., X.L. and W.Z. conceived and performed the original research project. Y.S., Z.C. and J.J. collected samples and performed the experiments. Y.S. and X.L. designed the experiments and analyzed the data. Y.S. refined the project and wrote the manuscript with contributions from all authors. W.Z. and Z.C. supervised the experiments and revised the writing. Z.C. and W.Z. obtained the funding for the research project. All authors have read and agreed to the published version of the manuscript.

Funding

This work was funded by the Basic Public Welfare Research Project of Zhejiang Province (LGN22C020001) and Startup Funding of Taizhou University for the Biomass Polysaccharide Metabolism Institute (T20231801002).

Data Availability Statement

The newly assembled complete chloroplast genomic sequences of six Rubus species can be obtained on GenBank (https://www.ncbi.nlm.nih.gov/nuccore/, accessed on 25 May 2024). The accession numbers are recorded in Table S1.

Conflicts of Interest

The authors declare no conflicts of interest.

References

  1. Moreno-Medina, B.L.; Casierra-Posada, F.; Cutler, J. Phytochemical composition and potential use of Rubus species. Gesunde Pflanz. 2018, 70, 65–74. [Google Scholar] [CrossRef]
  2. Yu, J.; Fu, J.; Fang, Y.; Xiang, J.; Dong, H. Complete chloroplast genomes of Rubus species (Rosaceae) and comparative analysis within the genus. BMC Genom. 2022, 23, 32. [Google Scholar] [CrossRef] [PubMed]
  3. Focke, W.O. Species Ruborum: Monographiae Generis Rubi Prodromus; E. Schweizerbart: Stuttgart, Germany, 1914. [Google Scholar]
  4. Lu, L.; Boufford, D.E. Rubus Linnaeus, Sp. P1.1: 492.1753. In Flora of China; Missouri Botanical Garden Press: St. Louis, MO, USA, 2003; Volume 9, pp. 192–285. [Google Scholar]
  5. Foster, T.M.; Bassil, N.V.; Dossett, M.; Leigh Worthington, M.; Graham, J. Genetic and genomic resources for Rubus breeding: A roadmap for the future. Hortic. Res. 2019, 6, 116. [Google Scholar] [CrossRef] [PubMed]
  6. Moyer, R.A.; Hummer, K.E.; Finn, C.E.; Frei, B.; Wrolstad, R.E. Anthocyanins, phenolics, and antioxidant capacity in diverse small fruits: Vaccinium, Rubus, and Ribes. J. Agric. Food Chem. 2002, 50, 519–525. [Google Scholar] [CrossRef] [PubMed]
  7. Kaume, L.; Howard, L.R.; Devareddy, L. The blackberry fruit: A review on its composition and chemistry, metabolism and bioavailability, and health benefits. J. Agric. Food Chem. 2012, 60, 5716–5727. [Google Scholar] [CrossRef] [PubMed]
  8. Yu, G.; Luo, Z.; Wang, W.; Li, Y.; Zhou, Y.; Shi, Y. Rubus chingii Hu: A review of the phytochemistry and pharmacology. Front. Pharmacol. 2019, 10, 799. [Google Scholar] [CrossRef] [PubMed]
  9. Marques, A.P.; Moreira, H.; Rangel, A.O.; Castro, P.M. Arsenic, lead and nickel accumulation in Rubus ulmifolius growing in contaminated soil in Portugal. J. Hazard. Mater. 2009, 165, 174–179. [Google Scholar] [CrossRef] [PubMed]
  10. Yang, W.; Li, H.; Zhang, T.; Sen, L.; Ni, W. Classification and identification of metal-accumulating plant species by cluster analysis. Environ. Sci. Pollut. Res. 2014, 21, 10626–10637. [Google Scholar] [CrossRef]
  11. He, B.; Dai, L.; Jin, L.; Liu, Y.; Li, X.; Luo, M.; Wang, Z.; Kai, G. Bioactive components, pharmacological effects, and drug development of traditional herbal medicine Rubus chingii Hu (Fu-Pen-Zi). Front. Nutr. 2023, 9, 1052504. [Google Scholar] [CrossRef] [PubMed]
  12. Alice, L. Evolutionary relationships in Rubus (Rosaceae) based on molecular data. Acta Hortic. 2002, 585, 79–83. [Google Scholar] [CrossRef]
  13. Alice, L.A.; Campbell, C.S. Phylogeny of Rubus (Rosaceae) based on nuclear ribosomal DNA internal transcribed spacer region sequences. Am. J. Bot. 1999, 86, 81–97. [Google Scholar] [CrossRef] [PubMed]
  14. Thompson, M.M. Survey of chromosome numbers in Rubus (Rosaceae: Rosoideae). Ann. Mo. Bot. Gard. 1997, 84, 128–164. [Google Scholar] [CrossRef]
  15. Wang, Y.; Chen, Q.; Chen, T.; Tang, H.; Liu, L.; Wang, X. Phylogenetic insights into Chinese Rubus (Rosaceae) from multiple chloroplast and nuclear DNAs. Front. Plant Sci. 2016, 7, 968. [Google Scholar] [CrossRef] [PubMed]
  16. Wang, Y.; Chen, Q.; Chen, T.; Zhang, J.; He, W.; Liu, L.; Luo, Y.; Sun, B.; Zhang, Y.; Tang, H.-R. Allopolyploid origin in Rubus (Rosaceae) inferred from nuclear granule-bound starch synthase I (GBSS I) sequences. BMC Plant Biol. 2019, 19, 303. [Google Scholar]
  17. Yang, J.Y.; Pak, J.-H. Phylogeny of Korean Rubus (Rosaceae) based on ITS (nrDNA) and trnL/F intergenic region (cpDNA). J. Plant Biol. 2006, 49, 44–54. [Google Scholar] [CrossRef]
  18. Yang, J.; Yoon, H.-S.; Pak, J.-H. Phylogeny of Korean Rubus (Rosaceae) based on the second intron of the LEAFY gene. Can. J. Plant Sci. 2012, 92, 461–472. [Google Scholar] [CrossRef]
  19. Yang, J.; Chiang, Y.-C.; Hsu, T.-W.; Kim, S.-H.; Pak, J.-H.; Kim, S.-C. Characterization and comparative analysis among plastome sequences of eight endemic Rubus (Rosaceae) species in Taiwan. Sci. Rep. 2021, 11, 1152. [Google Scholar] [CrossRef] [PubMed]
  20. Lu, Q.; Tian, Q.; Gu, W.; Yang, C.-X.; Wang, D.-J.; Yi, T.-S. Comparative genomics on chloroplasts of Rubus (Rosaceae). Genomics 2024, 116, 110845. [Google Scholar] [CrossRef]
  21. Brůna, T.; Aryal, R.; Dudchenko, O.; Sargent, D.J.; Mead, D.; Buti, M.; Cavallini, A.; Hytönen, T.; Andrés, J.; Pham, M.; et al. A chromosome-length genome assembly and annotation of blackberry (Rubus argutus, cv. “Hillquist”). G3 Genes Genomes Genet. 2022, 13, jkac289. [Google Scholar] [CrossRef]
  22. Wang, L.; Lei, T.; Han, G.; Yue, J.; Zhang, X.; Yang, Q.; Ruan, H.; Gu, C.; Zhang, Q.; Qian, T. The chromosome-scale reference genome of Rubus chingii Hu provides insight into the biosynthetic pathway of hydrolyzable tannins. Plant J. 2021, 107, 1466–1477. [Google Scholar] [CrossRef]
  23. Yang, Y.; Zhang, K.; Xiao, Y.; Zhang, L.; Huang, Y.; Li, X.; Chen, S.; Peng, Y.; Yang, S.; Liu, Y. Genome assembly and population resequencing reveal the geographical divergence of shanmei (Rubus corchorifolius). Genom. Proteom. Bioinform. 2022, 20, 1106–1118. [Google Scholar] [CrossRef] [PubMed]
  24. Davik, J.; Røen, D.; Lysøe, E.; Buti, M.; Rossman, S.; Alsheikh, M.; Aiden, E.L.; Dudchenko, O.; Sargent, D.J. A chromosome-level genome sequence assembly of the red raspberry (Rubus idaeus L.). PLoS ONE 2022, 17, e0265096. [Google Scholar] [CrossRef] [PubMed]
  25. Price, R.J.; Davik, J.; Fernandéz Fernandéz, F.; Bates, H.J.; Lynn, S.; Nellist, C.F.; Buti, M.; Røen, D.; Šurbanovski, N.; Alsheikh, M. Chromosome-scale genome sequence assemblies of the ‘Autumn Bliss’ and ‘Malling Jewel’ cultivars of the highly heterozygous red raspberry (Rubus idaeus L.) derived from long-read Oxford Nanopore sequence data. PLoS ONE 2023, 18, e0285756. [Google Scholar] [CrossRef] [PubMed]
  26. VanBuren, R.; Bryant, D.; Bushakra, J.M.; Vining, K.J.; Edger, P.P.; Rowley, E.R.; Priest, H.D.; Michael, T.P.; Lyons, E.; Filichkin, S.A. The genome of black raspberry (Rubus occidentalis). Plant J. 2016, 87, 535–547. [Google Scholar] [CrossRef] [PubMed]
  27. VanBuren, R.; Wai, C.M.; Colle, M.; Wang, J.; Sullivan, S.; Bushakra, J.M.; Liachko, I.; Vining, K.J.; Dossett, M.; Finn, C.E.; et al. A near complete, chromosome-scale assembly of the black raspberry (Rubus occidentalis) genome. GigaScience 2018, 7, giy094. [Google Scholar] [CrossRef] [PubMed]
  28. Caplan, J.S.; Yeakley, J.A. Functional morphology underlies performance differences among invasive and non-invasive ruderal Rubus species. Oecologia 2013, 173, 363–374. [Google Scholar] [CrossRef] [PubMed]
  29. Maliga, P. Plastid transformation in higher plants. Annu. Rev. Plant Biol. 2004, 55, 289–313. [Google Scholar] [CrossRef] [PubMed]
  30. Doyle, J.J.; Doyle, J.L. A rapid DNA isolation procedure for small quantities of fresh leaf tissue. Phytochem. Bull. 1987, 19, 11–15. [Google Scholar]
  31. Wingett, S.; Andrews, S. FastQ Screen: A tool for multi-genome mapping and quality control [version 2; peer review: 4 approved]. F1000Research 2018, 7, 1338. [Google Scholar] [CrossRef]
  32. Chen, S.; Zhou, Y.; Chen, Y.; Gu, J. fastp: An ultra-fast all-in-one FASTQ preprocessor. Bioinformatics 2018, 34, i884–i890. [Google Scholar] [CrossRef]
  33. Jian, J.-J.; Yu, W.-B.; Yang, J.-B.; Song, Y.; Yi, T.-S.; Li, D.-Z. GetOrganelle: A fast and versatile toolkit for accurate de novo assembly of organelle genomes. Genome Biol. 2020, 21, 1–31. [Google Scholar] [CrossRef] [PubMed]
  34. Shi, L.; Chen, H.; Jiang, M.; Wang, L.; Wu, X.; Huang, L.; Liu, C. CPGAVAS2, an integrated plastome sequence annotator and analyzer. Nucleic Acids Res. 2019, 47, W65–W73. [Google Scholar] [CrossRef] [PubMed]
  35. Tillich, M.; Lehwark, P.; Pellizzer, T.; Ulbricht-Jones, E.S.; Fischer, A.; Bock, R.; Greiner, S. GeSeq–versatile and accurate annotation of organelle genomes. Nucleic Acids Res. 2017, 45, W6–W11. [Google Scholar] [CrossRef] [PubMed]
  36. Kearse, M.; Moir, R.; Wilson, A.; Stones-Havas, S.; Cheung, M.; Sturrock, S.; Buxton, S.; Cooper, A.; Markowitz, S.; Duran, C. Geneious Basic: An integrated and extendable desktop software platform for the organization and analysis of sequence data. Bioinformatics 2012, 28, 1647–1649. [Google Scholar] [CrossRef] [PubMed]
  37. Zheng, S.; Poczai, P.; Hyvönen, J.; Tang, J.; Amiryousefi, A. Chloroplot: An online program for the versatile plotting of organelle genomes. Front. Genet. 2020, 11, 576124. [Google Scholar] [CrossRef] [PubMed]
  38. Liu, S.; Ni, Y.; Li, J.; Zhang, X.; Yang, H.; Chen, H.; Liu, C. CPGView: A package for visualizing detailed chloroplast genome structures. Mol. Ecol. Resour. 2023, 23, 694–704. [Google Scholar] [CrossRef] [PubMed]
  39. Amiryousefi, A.; Hyvönen, J.; Poczai, P. IRscope: An online program to visualize the junction sites of chloroplast genomes. Bioinformatics 2018, 34, 3030–3031. [Google Scholar] [CrossRef] [PubMed]
  40. Darling, A.C.; Mau, B.; Blattner, F.R.; Perna, N.T. Mauve: Multiple alignment of conserved genomic sequence with rearrangements. Genome Res. 2004, 14, 1394–1403. [Google Scholar] [CrossRef] [PubMed]
  41. Frazer, K.A.; Pachter, L.; Poliakov, A.; Rubin, E.M.; Dubchak, I. VISTA: Computational tools for comparative genomics. Nucleic Acids Res. 2004, 32 (Suppl. S2), W273–W279. [Google Scholar] [CrossRef]
  42. Rozas, J.; Sánchez-DelBarrio, J.C.; Messeguer, X.; Rozas, R. DnaSP, DNA polymorphism analyses by the coalescent and other methods. Bioinformatics 2003, 19, 2496–2497. [Google Scholar] [CrossRef]
  43. Beier, S.; Thiel, T.; Münch, T.; Scholz, U.; Mascher, M. MISA-web: A web server for microsatellite prediction. Bioinformatics 2017, 33, 2583–2585. [Google Scholar] [CrossRef] [PubMed]
  44. Kurtz, S.; Choudhuri, J.V.; Ohlebusch, E.; Schleiermacher, C.; Stoye, J.; Giegerich, R. REPuter: The manifold applications of repeat analysis on a genomic scale. Nucleic Acids Res. 2001, 29, 4633–4642. [Google Scholar] [CrossRef]
  45. Benson, G. Tandem repeats finder: A program to analyze DNA sequences. Nucleic Acids Res. 1999, 27, 573–580. [Google Scholar] [CrossRef] [PubMed]
  46. Wang, D.; Zhang, Y.; Zhang, Z.; Zhu, J.; Yu, J. KaKs_Calculator 2.0: A toolkit incorporating gamma-series methods and sliding window strategies. Genom. Proteom. Bioinform. 2010, 8, 77–80. [Google Scholar] [CrossRef] [PubMed]
  47. Katoh, K.; Standley, D.M. MAFFT multiple sequence alignment software version 7: Improvements in performance and usability. Mol. Biol. Evol. 2013, 30, 772–780. [Google Scholar] [CrossRef] [PubMed]
  48. Wright, F. The ‘effective number of codons’ used in a gene. Gene 1990, 87, 23–29. [Google Scholar] [CrossRef] [PubMed]
  49. Zhang, D.; Gao, F.; Jakovlić, I.; Zou, H.; Zhang, J.; Li, W.X.; Wang, G.T. PhyloSuite: An integrated and scalable desktop platform for streamlined molecular sequence data management and evolutionary phylogenetics studies. Mol. Ecol. Resour. 2020, 20, 348–355. [Google Scholar] [CrossRef] [PubMed]
  50. Minh, B.Q.; Schmidt, H.A.; Chernomor, O.; Schrempf, D.; Woodhams, M.D.; von Haeseler, A.; Lanfear, R. IQ-TREE 2: New Models and Efficient Methods for Phylogenetic Inference in the Genomic Era. Mol. Biol. Evol. 2020, 37, 1530–1534. [Google Scholar] [CrossRef]
  51. Kalyaanamoorthy, S.; Minh, B.Q.; Wong, T.K.; Von Haeseler, A.; Jermiin, L.S. ModelFinder: Fast model selection for accurate phylogenetic estimates. Nat. Methods 2017, 14, 587–589. [Google Scholar] [CrossRef]
  52. Ronquist, F.; Teslenko, M.; Van Der Mark, P.; Ayres, D.L.; Darling, A.; Höhna, S.; Larget, B.; Liu, L.; Suchard, M.A.; Huelsenbeck, J.P. MrBayes 3.2: Efficient Bayesian phylogenetic inference and model choice across a large model space. Syst. Biol. 2012, 61, 539–542. [Google Scholar] [CrossRef]
  53. Darriba, D.; Taboada, G.L.; Doallo, R.; Posada, D. jModelTest 2: More models, new heuristics and high-performance computing. Nat. Methods 2012, 9, 772. [Google Scholar] [CrossRef] [PubMed]
  54. Shi, Y.; Chen, Z.; Shen, M.; Li, Q.; Wang, S.; Jiang, J.; Zeng, W. Identification and Functional Verification of the Glycosyltransferase Gene Family Involved in Flavonoid Synthesis in Rubus chingii Hu. Plants 2024, 13, 1390. [Google Scholar] [CrossRef] [PubMed]
  55. Xie, J.; Chen, Y.; Cai, G.; Cai, R.; Hu, Z.; Wang, H. Tree Visualization by One Table (tvBOT): A web application for visualizing, modifying and annotating phylogenetic trees. Nucleic Acids Res. 2023, 51, gkad359. [Google Scholar] [CrossRef]
  56. Huang, T.-R.; Chen, J.-H.; Hummer, K.E.; Alice, L.A.; Wang, W.-H.; He, Y.; Yu, S.-X.; Yang, M.-F.; Chai, T.-Y.; Zhu, X.-Y.; et al. Phylogeny of Rubus (Rosaceae): Integrating molecular and morphological evidence into an infrageneric revision. TAXON 2023, 72, 278–306. [Google Scholar] [CrossRef]
  57. Ravi, V.; Khurana, J.; Tyagi, A.; Khurana, P. An update on chloroplast genomes. Plant Syst. Evol. 2008, 271, 101–122. [Google Scholar] [CrossRef]
  58. Luo, C.; Huang, W.; Sun, H.; Yer, H.; Li, X.; Li, Y.; Yan, B.; Wang, Q.; Wen, Y.; Huang, M. Comparative chloroplast genome analysis of Impatiens species (Balsaminaceae) in the karst area of China: Insights into genome evolution and phylogenomic implications. BMC Genom. 2021, 22, 571. [Google Scholar] [CrossRef]
  59. Downie, S.R.; Palmer, J.D. Use of chloroplast DNA rearrangements in reconstructing plant phylogeny. In Molecular Systematics of Plants; Springer: Boston, MA, USA, 1992; pp. 14–35. [Google Scholar]
  60. Xiao, S.; Xu, P.; Deng, Y.; Dai, X.; Zhao, L.; Heider, B.; Zhang, A.; Zhou, Z.; Cao, Q. Correction to: Comparative analysis of chloroplast genomes of cultivars and wild species of sweetpotato (Ipomoea batatas [L.] Lam). BMC Genom. 2021, 22, 368. [Google Scholar] [CrossRef]
  61. Li, D.-M.; Li, J.; Wang, D.-R.; Xu, Y.-C.; Zhu, G.-F. Molecular evolution of chloroplast genomes in subfamily Zingiberoideae (Zingiberaceae). BMC Plant Biol. 2021, 21, 558. [Google Scholar] [CrossRef]
  62. Li, B.; Liu, T.; Ali, A.; Xiao, Y.; Shan, N.; Sun, J.; Huang, Y.; Zhou, Q.; Zhu, Q. Complete chloroplast genome sequences of three aroideae species (Araceae): Lights into selective pressure, marker development and phylogenetic relationships. BMC Genom. 2022, 23, 218. [Google Scholar] [CrossRef]
  63. Cheon, K.-S.; Kim, K.-A.; Yoo, K.-O. The complete chloroplast genome sequences of three Adenophora species and comparative analysis with Campanuloid species (Campanulaceae). PLoS ONE 2017, 12, e0183652. [Google Scholar] [CrossRef]
  64. Sun, Y.; Moore, M.J.; Zhang, S.; Soltis, P.S.; Soltis, D.E.; Zhao, T.; Meng, A.; Li, X.; Li, J.; Wang, H. Phylogenomic and structural analyses of 18 complete plastomes across nearly all families of early-diverging eudicots, including an angiosperm-wide analysis of IR gene content evolution. Mol. Phylogenet. Evol. 2016, 96, 93–101. [Google Scholar] [CrossRef]
  65. Downie, S.R.; Jansen, R.K. A comparative analysis of whole plastid genomes from the Apiales: Expansion and contraction of the inverted repeat, mitochondrial to plastid transfer of DNA, and identification of highly divergent noncoding regions. Syst. Bot. 2015, 40, 336–351. [Google Scholar] [CrossRef]
  66. Wang, R.-J.; Cheng, C.-L.; Chang, C.-C.; Wu, C.-L.; Su, T.-M.; Chaw, S.-M. Dynamics and evolution of the inverted repeat-large single copy junctions in the chloroplast genomes of monocots. BMC Evol. Biol. 2008, 8, 36. [Google Scholar] [CrossRef] [PubMed]
  67. Wang, Q.; Huang, Z.; Gao, C.; Ge, Y.; Cheng, R. The complete chloroplast genome sequence of Rubus hirsutus Thunb. and a comparative analysis within Rubus species. Genetica 2021, 149, 299–311. [Google Scholar] [CrossRef] [PubMed]
  68. Wicke, S.; Schneeweiss, G.M.; Depamphilis, C.W.; Müller, K.F.; Quandt, D. The evolution of the plastid chromosome in land plants: Gene content, gene order, gene function. Plant Mol. Biol. 2011, 76, 273–297. [Google Scholar] [CrossRef] [PubMed]
  69. McNeal, J.R.; Kuehl, J.V.; Boore, J.L.; De Pamphilis, C.W. Complete plastid genome sequences suggest strong selection for retention of photosynthetic genes in the parasitic plant genus Cuscuta. BMC Plant Biol. 2007, 7, 57. [Google Scholar] [CrossRef]
  70. Funk, H.T.; Berg, S.; Krupinska, K.; Maier, U.G.; Krause, K. Complete DNA sequences of the plastid genomes of two parasitic flowering plant species, Cuscuta reflexa and Cuscuta gronovii. BMC Plant Biol. 2007, 7, 45. [Google Scholar] [CrossRef] [PubMed]
  71. Sun, S.-S.; Fu, P.-C.; Zhou, X.-J.; Cheng, Y.-W.; Zhang, F.-Q.; Chen, S.-L.; Gao, Q.-B. The complete plastome sequences of seven species in Gentiana sect. Kudoa (Gentianaceae): Insights into plastid gene loss and molecular evolution. Front. Plant Sci. 2018, 9, 493. [Google Scholar] [PubMed]
  72. Yao, X.; Tang, P.; Li, Z.; Li, D.; Liu, Y.; Huang, H. The first complete chloroplast genome sequences in Actinidiaceae: Genome structure and comparative analysis. PLoS ONE 2015, 10, e0129347. [Google Scholar] [CrossRef]
  73. Park, I.; Kim, W.J.; Yeo, S.-M.; Choi, G.; Kang, Y.-M.; Piao, R.; Moon, B.C. The complete chloroplast genome sequences of Fritillaria ussuriensis Maxim. and Fritillaria cirrhosa D. Don, and comparative analysis with other Fritillaria species. Molecules 2017, 22, 982. [Google Scholar] [CrossRef]
  74. Wu, Z.; Gui, S.; Quan, Z.; Pan, L.; Wang, S.; Ke, W.; Liang, D.; Ding, Y. A precise chloroplast genome of Nelumbo nucifera (Nelumbonaceae) evaluated with Sanger, Illumina MiSeq, and PacBio RS II sequencing platforms: Insight into the plastid evolution of basal eudicots. BMC Plant Biol. 2014, 14, 289. [Google Scholar] [CrossRef] [PubMed]
  75. Chen, Y.; Hu, N.; Wu, H. Analyzing and characterizing the chloroplast genome of Salix wilsonii. BioMed Res. Int. 2019, 2019, 5190425. [Google Scholar] [CrossRef] [PubMed]
  76. Dong, W.-L.; Wang, R.-N.; Zhang, N.-Y.; Fan, W.-B.; Fang, M.-F.; Li, Z.-H. Molecular evolution of chloroplast genomes of orchid species: Insights into phylogenetic relationship and adaptive evolution. Int. J. Mol. Sci. 2018, 19, 716. [Google Scholar] [CrossRef] [PubMed]
  77. Drescher, A.; Ruf, S.; Calsa, T., Jr.; Carrer, H.; Bock, R. The two largest chloroplast genome-encoded open reading frames of higher plants are essential genes. Plant J. 2000, 22, 97–104. [Google Scholar] [CrossRef] [PubMed]
  78. Akhunov, E.D.; Akhunova, A.R.; Anderson, O.D.; Anderson, J.A.; Blake, N.; Clegg, M.T.; Coleman-Derr, D.; Conley, E.J.; Crossman, C.C.; Deal, K.R. Nucleotide diversity maps reveal variation in diversity among wheat genomes and chromosomes. BMC Genom. 2010, 11, 702. [Google Scholar] [CrossRef]
  79. Alice, L.; Dodson, T.; Sutherland, B. Diversity and relationships of Bhutanese Rubus. Acta Hortic. 2008, 777, 63–70. [Google Scholar] [CrossRef]
  80. Li, Z.; Yan, W.; Qing, C.; Ya, L.; Yong, Z.; Tang, H.-R.; Wang, X.-R. Phylogenetic utility of Chinese Rubus (Rosaceae) based on ndhF sequence. Acta Hortic. Sin. 2015, 42, 19. [Google Scholar]
  81. Morden, C.W.; Gardner, D.E.; Weniger, D.A. Phylogeny and biogeography of Pacific Rubus subgenus Idaeobatus (Rosaceae) species: Investigating the origin of the endemic Hawaiian raspberry R. macraei. Pac. Sci. 2003, 57, 181–197. [Google Scholar] [CrossRef]
  82. Imanishi, H.; Nakahara, K.; Tsuyuzaki, H. Genetic relationships among native and introduced Rubus species in Japan based on rbcL sequence. Acta Hortic. 2008, 918, 195–199. [Google Scholar] [CrossRef]
  83. Milligan, B.G.; Hampton, J.N.; Palmer, J.D. Dispersed repeats and structural reorganization in subclover chloroplast DNA. Mol. Biol. Evol. 1989, 6, 355–368. [Google Scholar]
  84. Powell, W.; Morgante, M.; McDevitt, R.; Vendramin, G.; Rafalski, J. Polymorphic simple sequence repeat regions in chloroplast genomes: Applications to the population genetics of pines. Proc. Natl. Acad. Sci. USA 1995, 92, 7759–7763. [Google Scholar] [CrossRef] [PubMed]
  85. Xue, S.; Shi, T.; Luo, W.; Ni, X.; Iqbal, S.; Ni, Z.; Huang, X.; Yao, D.; Shen, Z.; Gao, Z. Comparative analysis of the complete chloroplast genome among Prunus mume, P. armeniaca, and P. salicina. Hortic. Res. 2019, 6, 89. [Google Scholar] [CrossRef] [PubMed]
  86. Somaratne, Y.; Guan, D.-L.; Wang, W.-Q.; Zhao, L.; Xu, S.-Q. Complete chloroplast genome sequence of Xanthium sibiricum provides useful DNA barcodes for future species identification and phylogeny. Plant Syst. Evol. 2019, 305, 949–960. [Google Scholar] [CrossRef]
  87. Li, X.; Zuo, Y.; Zhu, X.; Liao, S.; Ma, J. Complete chloroplast genomes and comparative analysis of sequences evolution among seven Aristolochia (Aristolochiaceae) medicinal species. Int. J. Mol. Sci. 2019, 20, 1045. [Google Scholar] [CrossRef] [PubMed]
  88. Yanfei, N.; Tai, S.; Chunhua, W.; Jia, D.; Fazhong, Y. Complete chloroplast genome sequences of the medicinal plant Aconitum transsectum (Ranunculaceae): Comparative analysis and phylogenetic relationships. BMC Genom. 2023, 24, 90. [Google Scholar] [CrossRef] [PubMed]
  89. Nekrutenko, A.; Makova, K.D.; Li, W.-H. The KA/KS ratio test for assessing the protein-coding potential of genomic regions: An empirical and simulation study. Genome Res. 2002, 12, 198–202. [Google Scholar] [CrossRef] [PubMed]
  90. Gong, L.; Ding, X.; Guan, W.; Zhang, D.; Zhang, J.; Bai, J.; Xu, W.; Huang, J.; Qiu, X.; Zheng, X. Comparative chloroplast genome analyses of Amomum: Insights into evolutionary history and species identification. BMC Plant Biol. 2022, 22, 520. [Google Scholar] [CrossRef] [PubMed]
  91. Rensing, S.A.; Fritzowsky, D.; Lang, D.; Reski, R. Protein encoding genes in an ancient plant: Analysis of codon usage, retained genes and splice sites in a moss, Physcomitrella patens. BMC Genom. 2005, 6, 43. [Google Scholar] [CrossRef] [PubMed]
  92. Quax, T.E.; Claassens, N.J.; Söll, D.; van der Oost, J. Codon bias as a means to fine-tune gene expression. Mol. Cell 2015, 59, 149–161. [Google Scholar] [CrossRef]
  93. Mehmood, F.; Shahzadi, I.; Ahmed, I.; Waheed, M.T.; Mirza, B. Characterization of Withania somnifera chloroplast genome and its comparison with other selected species of Solanaceae. Genomics 2020, 112, 1522–1530. [Google Scholar] [CrossRef]
  94. Li, H.; Wu, M.; Lai, Q.; Zhou, W.; Song, C. Complete chloroplast of four Sanicula taxa (Apiaceae) endemic to China: Lights into genome structure, comparative analysis, and phylogenetic relationships. BMC Plant Biol. 2023, 23, 444. [Google Scholar] [CrossRef] [PubMed]
  95. Tao, L.; Duan, H.; Tao, K.; Luo, Y.; Li, Q.; Li, L. Complete chloroplast genome structural characterization of two Phalaenopsis (Orchidaceae) species and comparative analysis with their alliance. BMC Genom. 2023, 24, 359. [Google Scholar] [CrossRef] [PubMed]
Figure 1. The complete Cp genomes map of six Rubus taxa.
Forests 15 01167 g001
Figure 2. Contrast with six Cp genomes boundary regions (A) and an analysis of genome sequence alignment (B).
Forests 15 01167 g002
Figure 3. An analysis of difference in chloroplast genome sequences. Genes were represented by gray arrows at the top of the sequences. Diverse regions were endowed with various colors.
Forests 15 01167 g003
Figure 4. A nucleotide diversity analysis of six whole Cp genomes of Rubus. The x-axis shows the location of each gene window and the y-axis shows the nucleotide diversity of each window. Eleven highly variable regions are highlighted.
Forests 15 01167 g004
Figure 5. Statistics of repeat sequences from six newly assembled Cp genomes of Rubus. (A) The number of SSRs located in the LSC/SSC/IR areas. (B) The number of different types of SSR. (C) The number of different types of repeat sequences. Complement repeat (C), reverse repeat (R), forward repeat (F), palindromic repeat (P), and tandem repeat (TE). (D) The number of dispersed repeat sequences of various lengths in R. argutus (Ra), R. chingii (Rc), R. corchorifolius (Rco), R. idaeus (Ri), R. occidentalis (Ro), and R. parviflorus (Rp).
Forests 15 01167 g005
Figure 6. The Ka/Ks ratio values of the PCGs from six Rubus Cp genomes were compared, with R. amabilis as the reference sequence. Different species are represented by columns of different colors including R. argutus (Ra), R. chingii (Rc), R. corchorifolius (Rco), R. idaeus (Ri), R. occidentalis (Ro), and R. parviflorus (Rp).
Forests 15 01167 g006
Figure 7. A codon usage bias analysis of complete Cp genomes of six Rubus taxa. (A) Statistics from RSCU values of amino acids. The histogram corresponds to the same color as the codon, and from left to right are R. argutus, R. chingi, R. corchorifolius, R. idaeus, R. occidentalis, and R. parviflorus, respectively. (B) The number of codons per amino acid. (C) ENC-plot of 79 PCGs from R. chingii. The black curve is the standard curve, the formula is ENC = 2 + GC3 + 29/ [GC32 + (1 − GC3)2], and each red dot represents a gene. (D) GC contents and ENC values of 79 PCGs from R. chingii. The ENC value, GC content, and ENC-plot of the other five species are recorded in Figure S1.
Forests 15 01167 g007
Figure 8. The maximum likelihood (left) and Bayesian (right) phylogenetic trees based on the concatenated sequences of shared chloroplast coding genes. The support values are displayed on the branches of the tree, and six species with newly assembled chloroplast genes are highlighted in red.
Forests 15 01167 g008
Table 1. The characteristics of six Rubus Cp genomes.
SpeciesR. argutusR. chingiiR. corchorifoliusR. idaeusR. occidentalisR. parviflorus
Length (bp)Total156,630155,563155,493155,702156,712156,882
LSC85,96285,32285,27185,02685,92986,069
SSC18,75418,74318,70218,70618,84318,795
IR25,95725,74925,76025,98525,97026,009
Region size (%)CDS49.9050.9150.5851.4949.6150.13
Cis-spliced intron12.1911.8812.3712.5511.7412.68
tRNA1.741.791.751.801.691.78
rRNA5.785.825.826.015.775.76
Non-coding region31.4630.6930.5629.2432.2531.00
GC content (%)Total37.1337.0637.0637.2637.1137.18
LSC35.0134.9434.9135.1834.9735.08
SSC31.2330.8330.9131.3631.131.25
IR42.7942.8442.8342.8042.8142.78
CDS37.9537.7537.8437.9537.8538.01
Cis-spliced intron3737.3536.7337.0137.1736.97
tRNA53.7153.4853.7853.4553.6853.44
rRNA55.4455.4255.3955.0055.4455.46
Non-coding region31.5231.2331.3231.4431.6831.62
Gene numbersTotal (unique)131(111)131(111)131(111)131(111)131(111)131(111)
PCG (unique)86(79)86(79)86(79)86(79)86(79)86(79)
tRNA (unique)37(28)37(28)37(28)37(28)37(28)37(28)
rRNA (unique)8(4)8(4)8(4)8(4)8(4)8(4)
Disclaimer/Publisher’s Note: The statements, opinions and data contained in all publications are solely those of the individual author(s) and contributor(s) and not of MDPI and/or the editor(s). MDPI and/or the editor(s) disclaim responsibility for any injury to people or property resulting from any ideas, methods, instructions or products referred to in the content.

