Abstract
This study examines the Riparian Buffer Zones (RBZs) in Türkiye, analyzing land cover changes from 2017 to 2023 to assess their effectiveness in ecological conservation and water resource management. The research employs Esri-Sentinel land cover data, Shuttle Radar Topography Mission digital elevation models, and RiverATLAS data to identify and delineate RBZs, classify land cover types, and evaluate trends and changes over seven years. The findings indicate that 44.8% of RBZs are covered by ‘Rangelands’, 32.2% by ‘Crops’, and 16.1% by ‘Trees’ classes. The study notes a considerable increase in built areas and agricultural fields, which may indicate ongoing urban expansion and its potential impact on the effectiveness of RBZs. Despite regulatory efforts, the substantial presence of agriculture within RBZs indicates a need for more robust environmental protection policies. The results indicate a pressing need for a policy reassessment to enhance forest cover within RBZs and reduce agricultural encroachment. This would improve water quality and facilitate the achievement of sustainability goals numbered 2, 3, 6, 11, 14 and 15. The findings thus call for a strategic enhancement of RBZ management to better protect water resources against the adverse effects of agricultural and urban activities.
1. Introduction
Access to clean and drinkable water is one of the most critical challenges facing humankind today and will continue to be a significant concern in the future. According to the United Nations (UN), approximately 40 percent of the world’s population is currently affected by water scarcity, a problem that is expected to worsen as global temperatures continue to rise [1,2]. Recognizing the urgency of these issues, the United Nations Development Program (UNDP) launched the Sustainable Development Goals (SDGs) in 2015 [2]. These goals focus on critical global challenges, such as ending hunger and protecting the environment. In particular, Goal 6, ‘Clean Water and Sanitation’, specifically targets protecting water resources worldwide and aims to ensure universal access to clean and safe water. Alongside Goal 6, other SDGs, including Goal 2, ‘Zero Hunger’, Goal 3, ‘Good Health and Well-Being’, Goal 11, ‘Sustainable Cities and Communities’, Goal 14, ‘Life Below Water’, and Goal 15, ‘Life on Land’ are also directly or indirectly linked to the management and conservation of water resources. These interconnected goals underscore the need for sustainable water management practices to reduce climate change’s effects and conserve water resources for future generations.
Addressing these challenges necessitates focused attention on critical ecological interfaces such as riparian zones, which play a pivotal role in sustaining water quality and availability. The term “riparian” is derived from the Latin word riparius, which originates from ripa, meaning river bank [3,4]. Riparian zones, broadly defined, include the areas that extend from the edges of water bodies to the surrounding floodplains [5]. These zones represent critical transitional areas between terrestrial and aquatic ecosystems and are classified as one of the world’s 15 terrestrial biomes [3,6]. The vegetation characteristic of riparian zones plays a crucial role in environmental protection. It improves water quality and soil stability by slowing surface runoff from precipitation and reinforcing riparian soils with robust root systems [7,8]. Given their critical role in protecting water resources to prevent drinking water scarcity, riparian zones must be maintained or restored with appropriate vegetation.
While geographically limited to narrow bands along water bodies, riparian zones disproportionately influence ecological [9,10,11] and socio-economic functions [10,11,12]. These areas facilitate critical environmental processes such as stabilizing energy transfer, nutrient cycling, and base flow [13]. They are also essential for maintaining the biodiversity of adjacent, broader habitats [14]. Riparian zones also serve as important refuges, providing shelter and abundant food sources for local wildlife [15]. Consequently, any changes to riparian ecosystems can profoundly affect the surrounding environment’s biodiversity [16]. These zones’ wide range of benefits underscores their importance for ecological sustainability and biodiversity conservation.
Despite the many beneficial functions of riparian zones discussed above, these critical areas are increasingly impacted by human activities [17]. Surface water quality is inherently susceptible due to its accessibility features, and it is directly influenced by the land cover and land use of riparian zones [18,19]. The accelerating pace of urbanization, industrialization, and agricultural activities, driven by growing population pressures, increases the stress on riparian land cover and contributes to water pollution [19,20,21]. The vegetation structure within these zones is crucial in mitigating pollution from surface water. Therefore, monitoring, protection, and management of the land cover of the riparian zones have become the focus of extensive scientific research. However, many countries must develop legal frameworks for riparian buffer zone (RBZ) planning and management. In addition, the study of riparian vegetation and hydromorphology relationships tends to be more rigorously pursued in North America, with significant studies also conducted in Europe and South America [22], highlighting a difference in the intensity of research efforts across regions.
The delineation of buffer zones to protect wetland ecosystems is regulated by the Ministry of Agriculture and Forestry under the ‘Wetland Protection Regulation’, published in the Official Gazette in 2014 in Türkiye [23]. These zones, which can be at most 2500 m in width, are not established around all streams within the national borders but selectively in areas identified through on-the-ground assessments and expert evaluations coordinated by the Ministry. This selective approach leads to unavoidable inconsistencies in wetlands and riparian zone protection strategies throughout the country. Apart from this regulation, in January 2024, the Silviculture Department of the General Directorate of Forestry issued a communiqué entitled ‘Technical Principles of Silviculture Applications’, which outlines the implementation principles of RBZs. The policy states that RBZs should be established at intervals of 25–50 m on both banks of small, narrow-bottomed streams and 50–100 m on both banks of large, wide-bottomed streams, depending on the degree of slope, in forest areas adjacent to the river. These zones must be managed with moderate interventions that maintain uninterrupted forest cover [24]. The communiqué clearly defines the widths of these zones but lacks detailed guidance on the specific forest structures within the RBZs and information about how RBZ width will be determined by slope degree.
Are there any assessments or comprehensive data on the condition of riparian zones for Türkiye based on the above regulations? A review of the relevant literature reveals one notable review article summarizing studies from 2010 to 2021 focusing on the country’s riparian ecosystems [25]. In addition, numerous small-scale studies examine specific rivers or regional riparian zones [26,27,28,29] and research vegetation [30] and bird diversity [31] within these zones. However, these studies do not provide a holistic view or foreknowledge of national riparian ecosystems and the prediction of the overall quality of the country’s water resources. A comprehensive understanding of the condition of RBZs across Türkiye is essential for effective intervention and compliance with SDGs and for protecting water resources and endangered flora and fauna species within these important ecosystems.
The primary motivation for this study is the recognized gap in comprehensive data on the current status of RBZs throughout Türkiye. This study aims to systematically identify and classify stream networks and delineate RBZs within the national borders using Geographic Information Systems (GIS) and spatial datasets, following the “Technical Principles of Silviculture Applications” guidelines issued by the Silviculture Department of the General Directorate of Forestry. A key objective of this study is to assess the land cover status of the delineated RBZs annually from 2017 to 2023, tracing the change trends over these years. This study aims to shed light on the current status and temporal trends of RBZs across the country and generate a comprehensive dataset that can inform and guide future interventions by relevant institutions and organizations. In addition, the outcome dataset will be instrumental in aligning with the SDGs, improving water resource management, and protecting endangered species within these critical ecosystems.
2. Materials and Methods
2.1. Study Area
Türkiye covers approximately 780,000 square kilometers in the northern hemisphere and is located between the continents of Europe, Asia, and Africa. As a peninsula, Türkiye has a unique geographical setup between 36–42 degrees north latitude and 26–45 degrees east longitude, primarily in the subtropical climate zone and closer to the equator than the North Pole. This positioning influences its climate and contributes significantly to its rich biodiversity. Officially, 29.4% of the country is forested [32], supporting about 11,000 naturally occurring plant taxa, of which 35 percent are endemic [33].
The country has an important stream network characterized by short rivers that vary widely in flow throughout the year, reaching peak flows in spring due to snowmelt. Major rivers like the Kızılırmak, Yeşilırmak, Sakarya, Dicle, and Fırat carve through the northern and southern mountain ranges in deep valleys, leading the way in both elevation and water volume. Another set, including the Filyos Stream and Fırtına Stream, settles on the slopes facing the sea, shaped by the climatic conditions post the tectonic development of Türkiye. Rivers such as the Büyük Menderes, Küçük Menderes, Gediz, and Bakırçay, nestled in Western Anatolia’s tectonic depressions, form another group [34,35]. Additionally, the country is home to 122 wetlands, including 14 Ramsar Sites, underscoring their global ecological importance [36].
Annual precipitation levels show considerable regional variations; the Eastern Black Sea region receives up to 2300 mm annually, contrasting sharply with less than 500 mm in Central Anatolia and the eastern parts of Eastern Anatolia [37,38]. This intricate mosaic of ecological, geographical, and hydrological features underscores the complexity of the study area. Türkiye’s rivers serve as sources for drinking water, agricultural irrigation, industrial production, and tourism, holding significant hydroelectric energy production potential [39]. However, they are seldom used for transportation due to their bed characteristics.
Over the past two decades, per capita water availability has declined significantly, from 1652 cubic meters in 2000 to 1346 cubic meters in 2020 in Türkiye [40]. According to the per capita usable water availability index, this trend places the country among the countries facing water scarcity challenges. With continued population growth and changing climatic conditions, Türkiye will likely face increased water resource challenges in the foreseeable future. Furthermore, projections by the European Environment Agency indicate that many regions of Türkiye could experience medium to high levels of water scarcity by 2030, underscoring the critical need for effective water resource management strategies [41]. Given these impending challenges of water scarcity and the strategic importance of its diverse climatic and hydrological conditions, Türkiye is an ideal case study for examining the RBZs in conserving water resources.
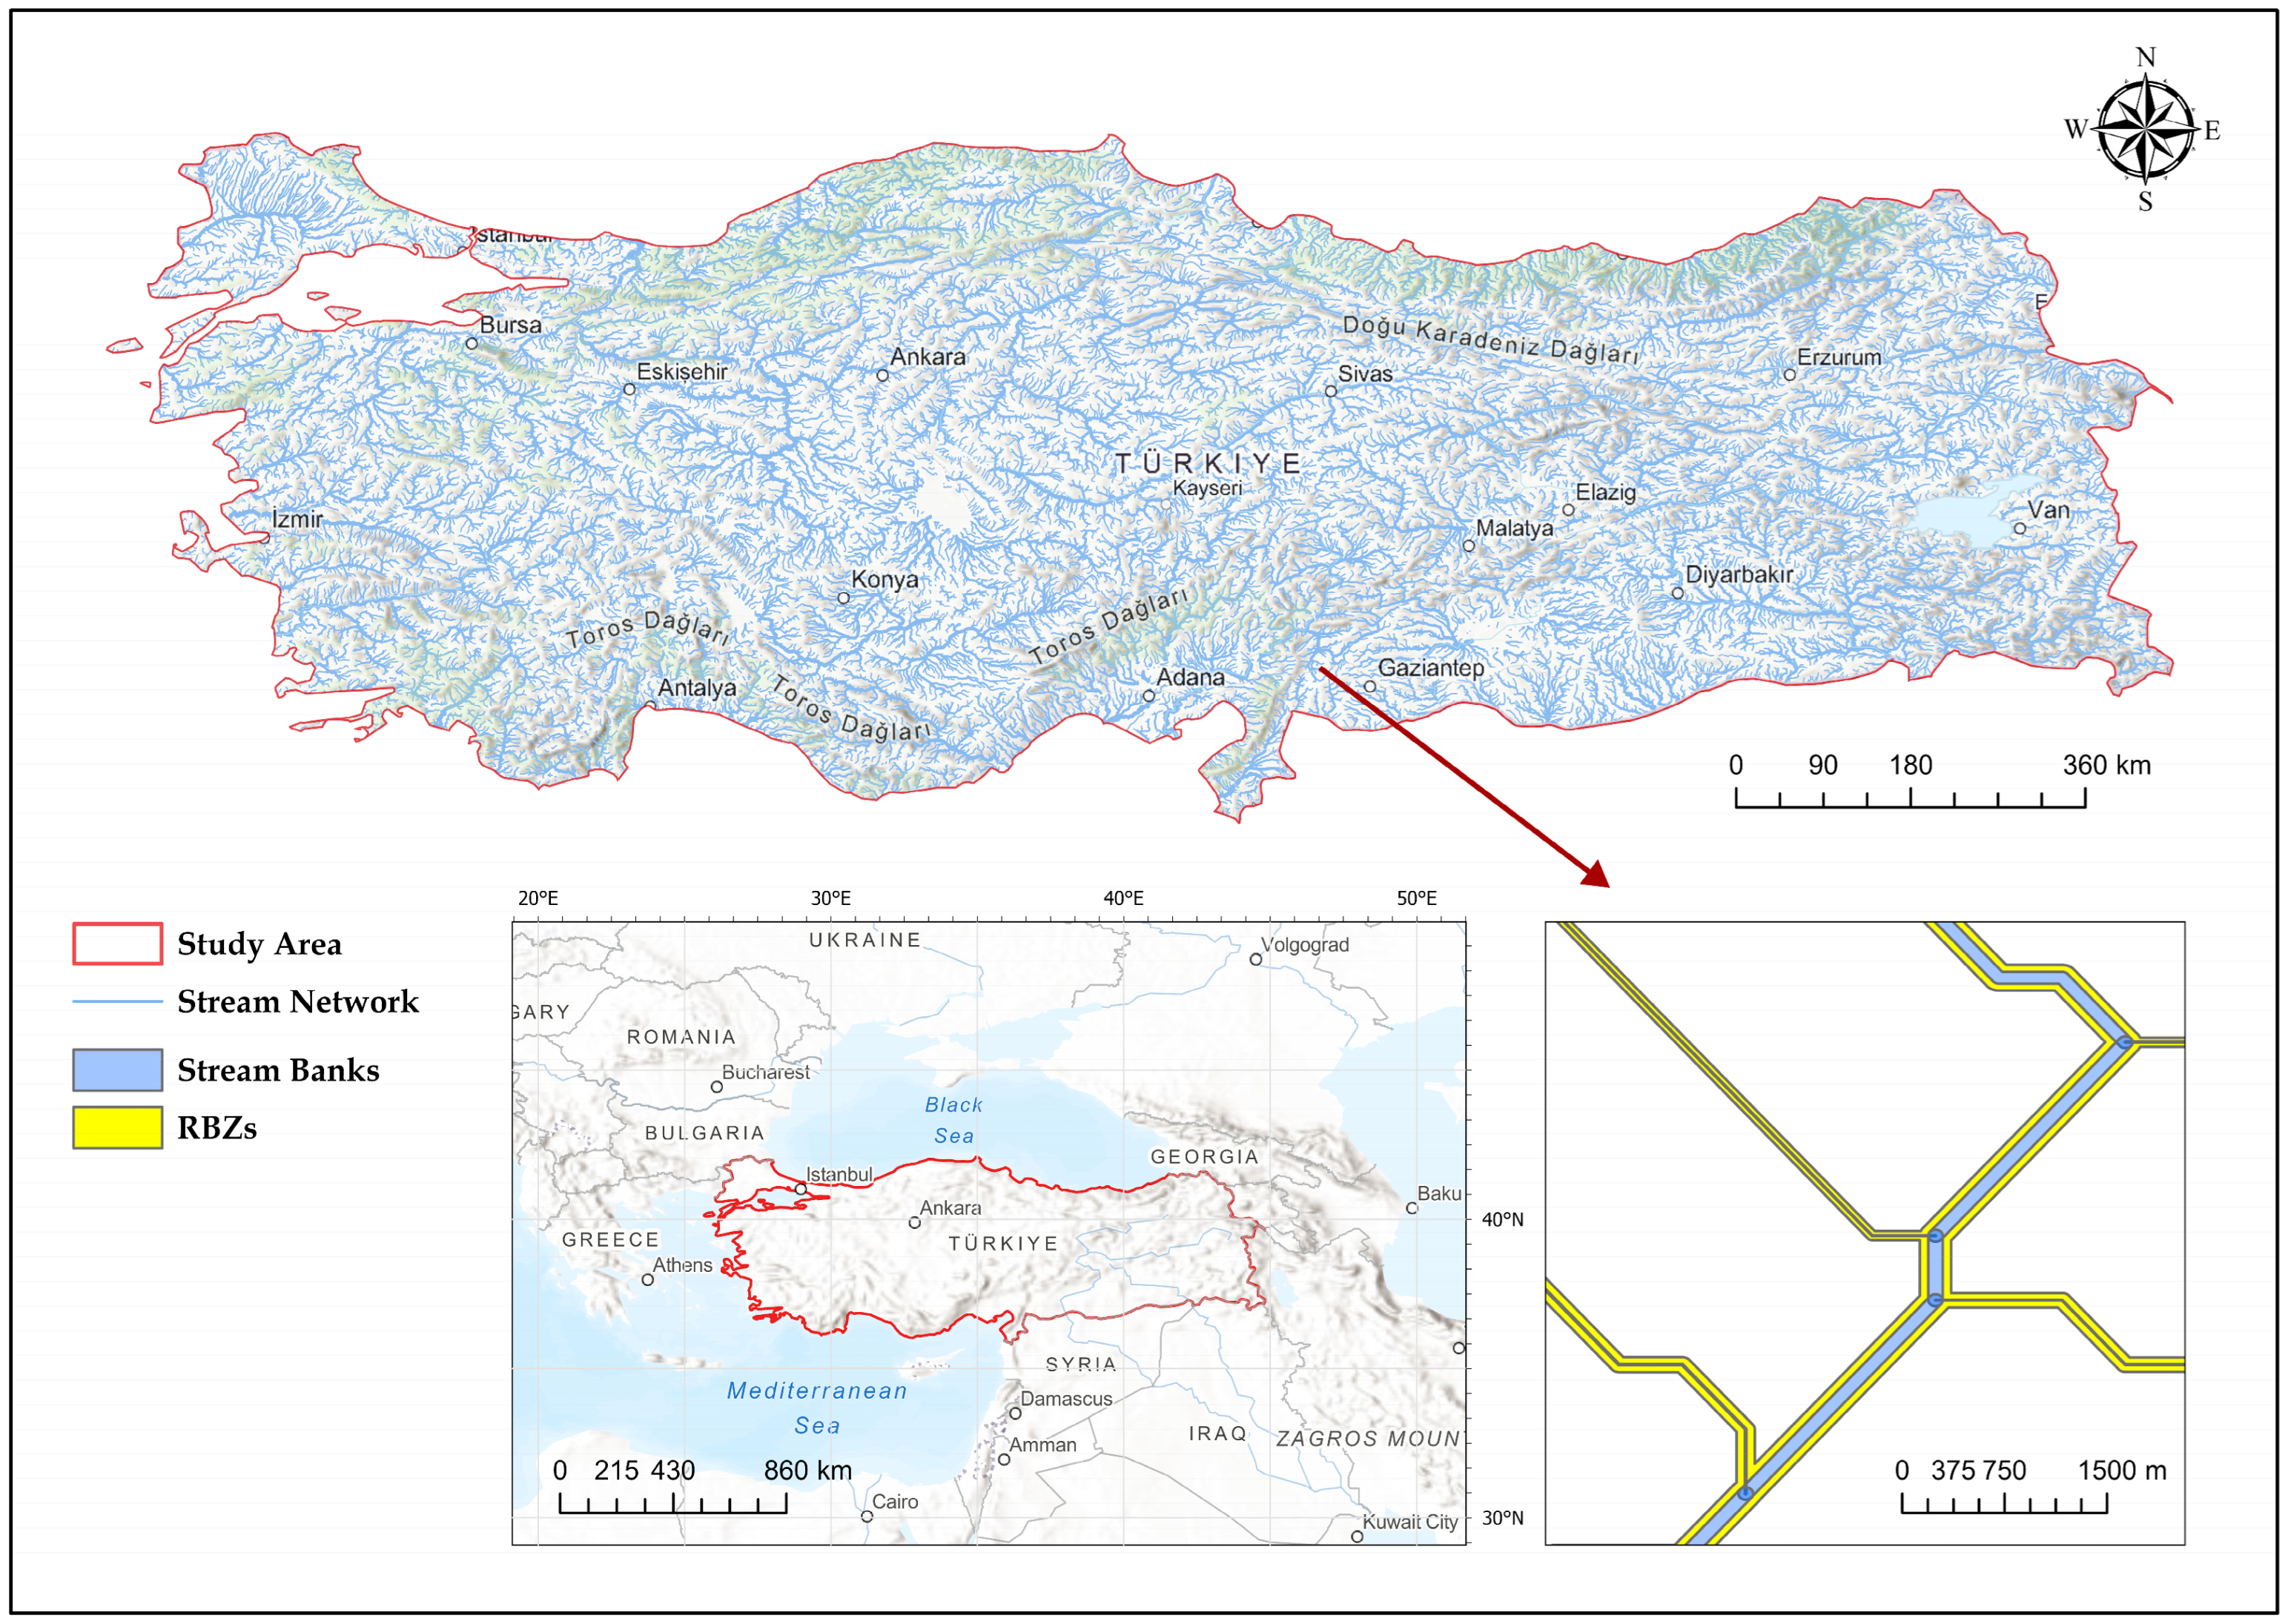
Within the scope of this study, the region of interest includes all perennial, intermittent, and ephemeral streams within the administrative boundaries of the Republic of Türkiye, with a total length of 39,348 km (Figure 1). This comprehensive inclusion of stream types ensures a thorough analysis of RBZs under different hydrological conditions within the country. It is important to note that larger water bodies like lakes, reservoirs, and dams are excluded from this study’s focus on stream networks.
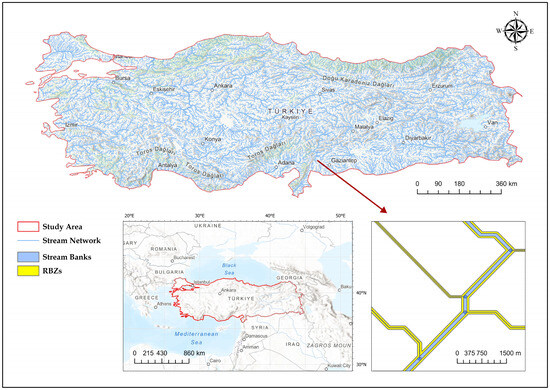
Figure 1.
Geographical location of the study area, stream networks within the study area, estimated stream banks, and estimated RBZs.
2.2. Datasets
Several datasets were used in this study to increase the accuracy and depth of our analyses. A primary data source was the HydroSHEDS products initiated by the World Wildlife Fund US in 2006. The HydroSHEDS project aims to produce and distribute global digital hydrographic data layers at no cost and includes a comprehensive set of georeferenced vector and raster datasets. These datasets include detailed representations of river networks, watershed boundaries, drainage directions, and flow accumulations [42]. Specifically, the RiverATLAS dataset was used to delineate the river network across Türkiye and to estimate the width of river banks using the provided variables by the dataset. RiverATLAS consists of a vectorized line network representing global rivers with a minimum catchment area of 10 km² or an average flow of at least 0.1 m3/s [43]. In addition, the LakeATLAS product, which delineates shoreline polygons for all global lakes larger than 10 ha [44], was used to define the spatial boundaries of lakes and dams within Türkiye, thereby excluding these features from the analysis.
Another important dataset used in this study is the Shuttle Radar Topography Mission (SRTM) digital elevation data (DEM), which is essential for calculating stream slope, a critical factor in determining the width of RBZs. Initiated in 2000 by the National Aeronautics and Space Administration (NASA) and the National Geospatial-Intelligence Agency (NGA), SRTM 1 Arc-Second Global provides high-resolution elevation data on a global scale. This dataset is characterized by its one arc-second (approximately 30 m) void-filled coverage, which provides detailed and reliable topographic information [45].
The last dataset used in this study is the Esri-Sentinel global land cover data, which is critical for monitoring land cover status and change within the estimated RBZs. Developed through a collaboration between Esri, Impact Observatory, and Microsoft AI for Earth, this dataset uses a deep learning model applied to European Space Agency (ESA) Sentinel-2 satellite imagery [46,47]. It provides users with detailed land cover information at a spatial resolution of 10 m, with annual updates from 2017 to 2023. This study used these datasets and their land cover schema to track the yearly changes and status of land cover within the polygonal areas of the delineated RBZs throughout the specified period.
2.3. Stream Banks Delineation
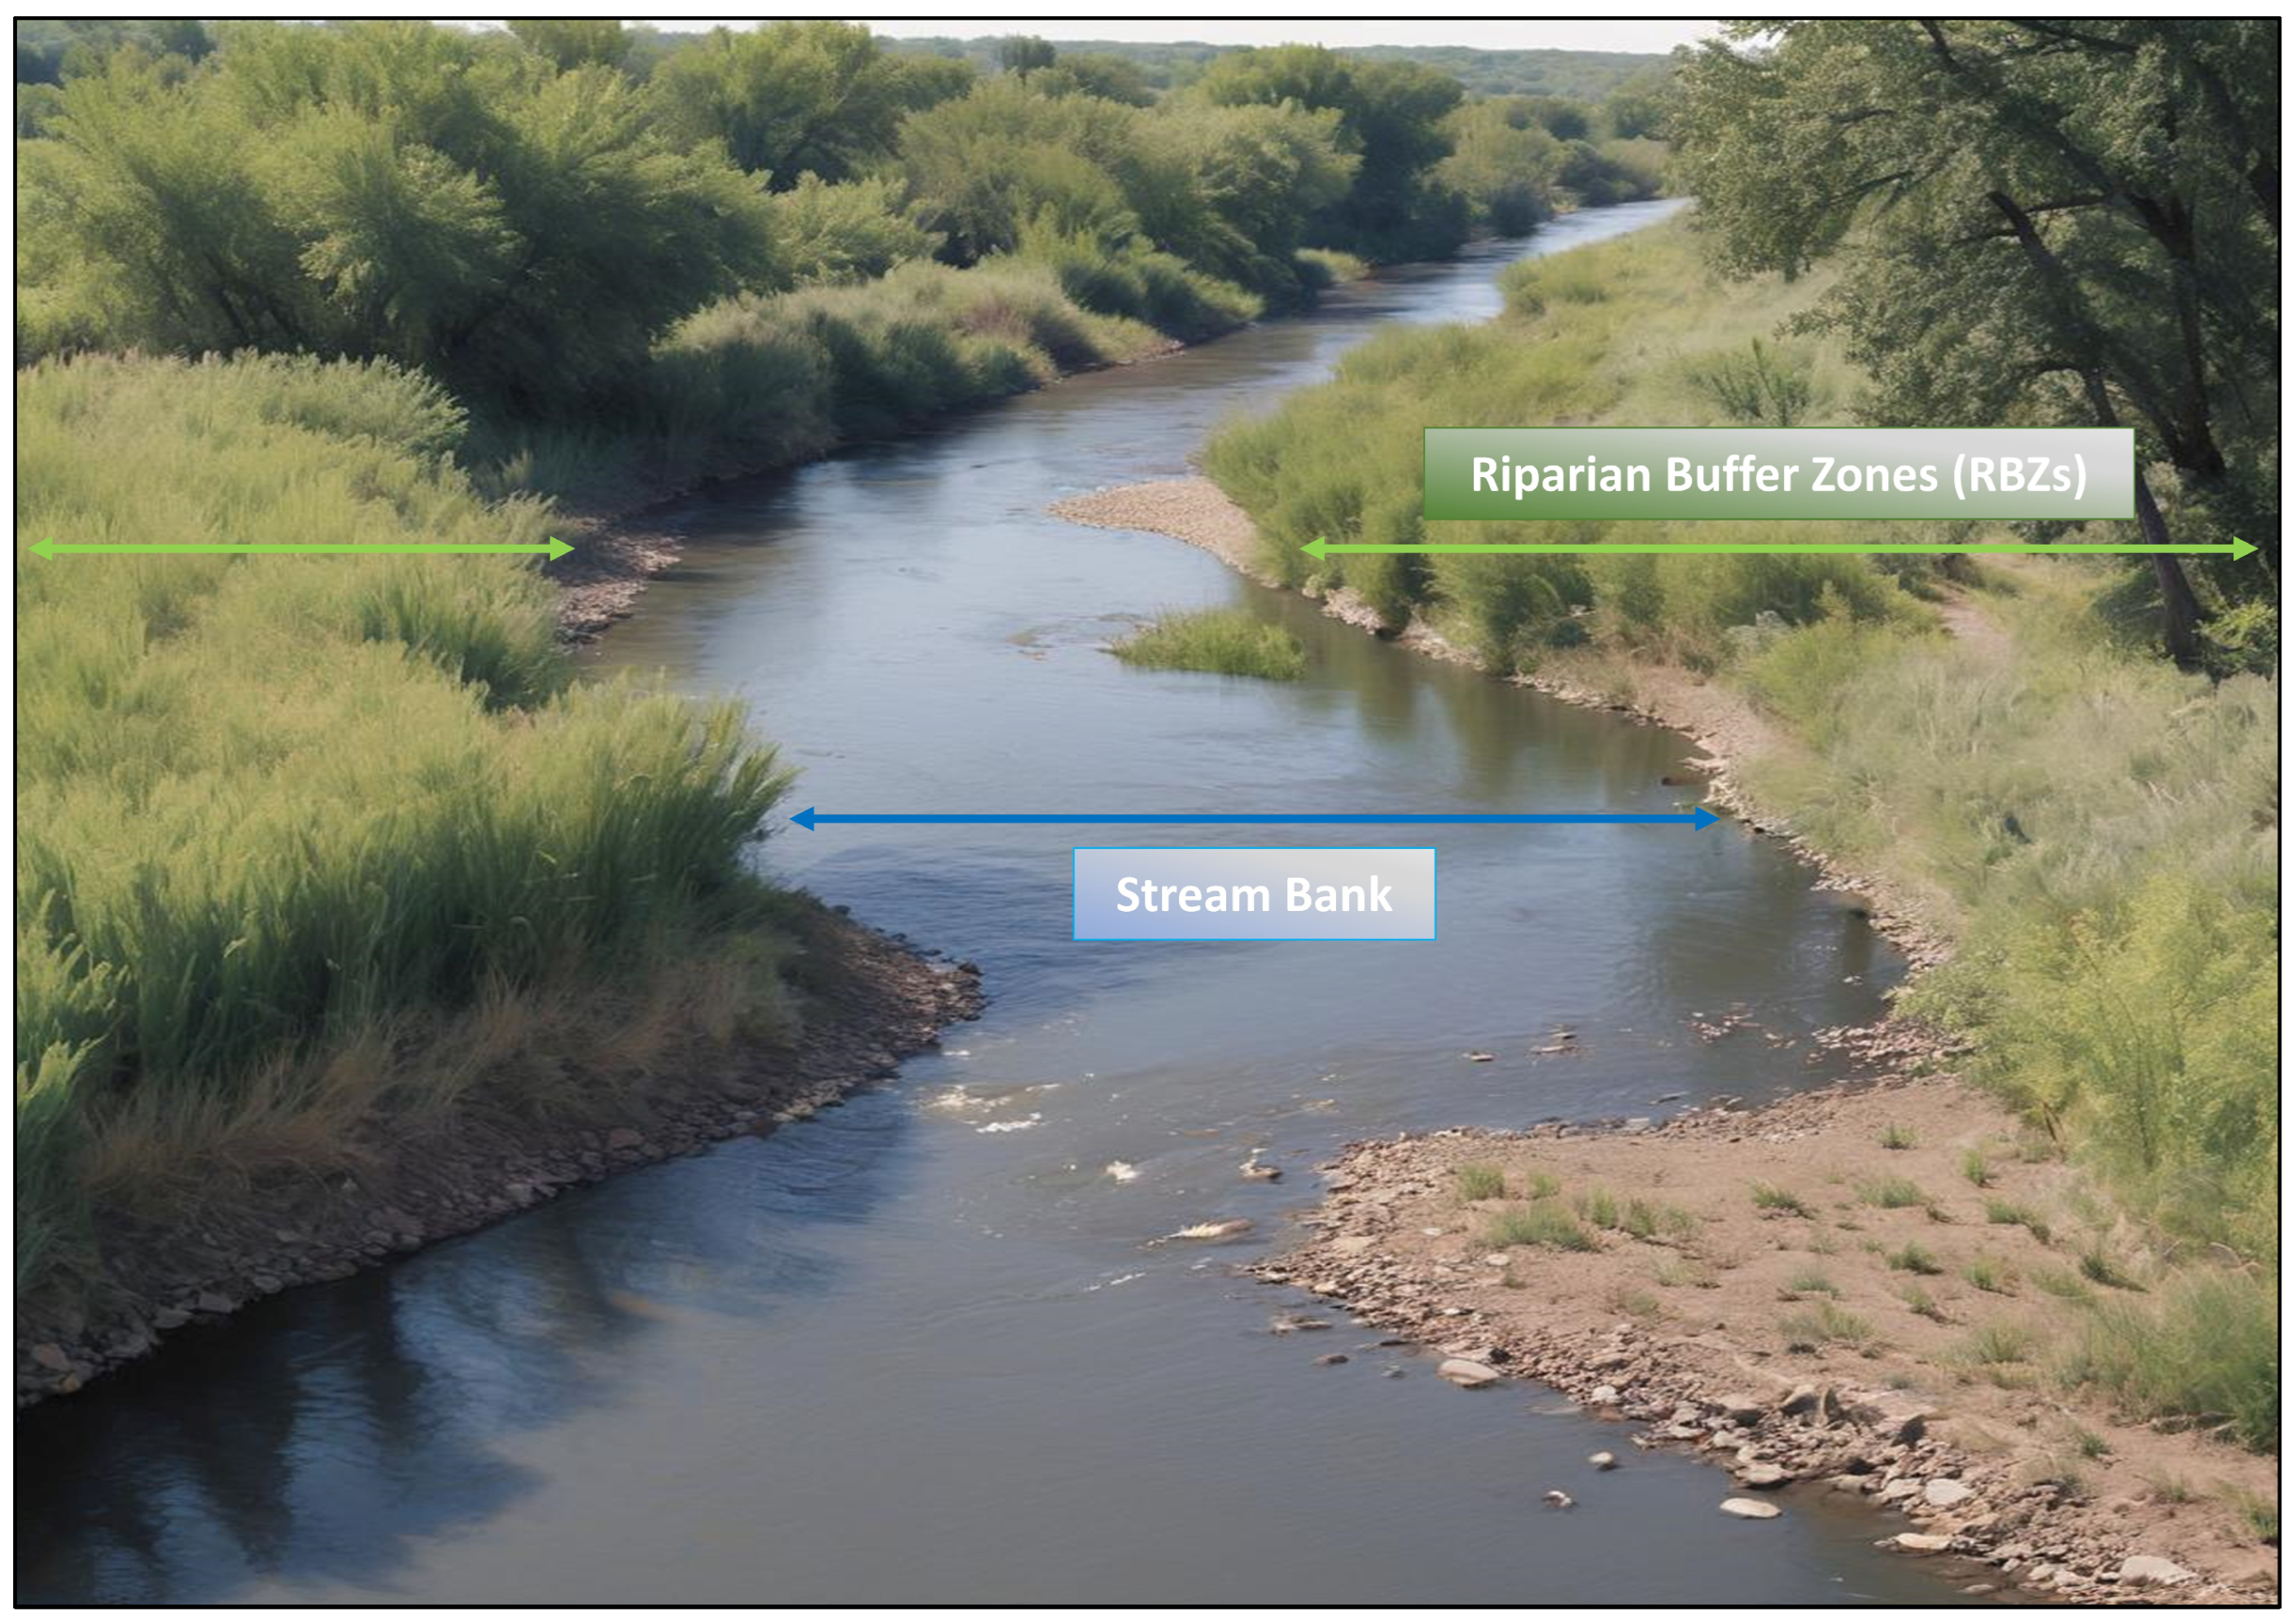
The accurate delineation of RBZs, a primary objective of this study, requires the initial delineation of stream banks. The term “stream bank” or “river bank” refers to the land adjacent to the main channel of a stream or river, marking the interface between the watercourse and the surrounding terrain. These banks exist on both sides of streams or rivers and are subject to frequent flooding and drying due to fluctuations in water levels (Figure 2). Stream banks are critical to ecosystem health because they directly influence water quality and provide essential habitat features. In addition, these areas are often subject to erosion and flooding, making their protection and management critical to sustainable water resource management [48].
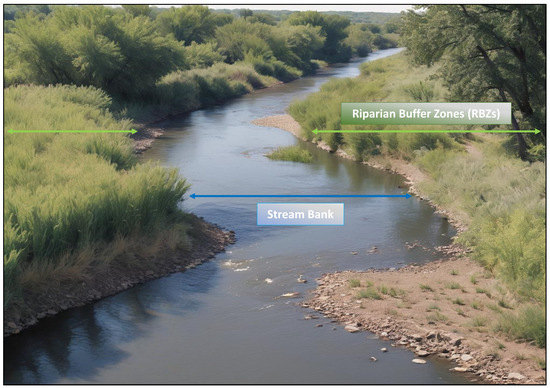
Figure 2.
Illustration of a stream bank and RBZs on each side of a stream.
While the datasets do not explicitly provide information on stream bank width, certain variables within the RiverATLAS data facilitate the estimation of this dimension. Specifically, the variables ‘LENGTH_KM’ (stream length) and ‘riv_ha_rsu’ (stream area) allow us to calculate average stream bank widths. In this study, these variables were used to derive the average bank width of rivers in meters using the formula below:
2.4. RBZs Delineation
RBZs are the land and plant communities adjacent to rivers, streams, bays, and other water bodies (Figure 2). These areas are characterized by high soil moisture and are prone to erosion, underscoring the need for their proper management. The width of these buffer zones and their vegetation types are critical initial decisions in their management. Historical studies, including one conducted in Australia in 1881, found that buffer zones with a grass width of 5 m and tree cover of up to 30 m effectively prevented erosion and the subsurface movement of nutrients [49]. Following these early findings, the effectiveness of various widths and vegetation strategies in preventing erosion within RBZs has been extensively studied over time [50,51,52,53,54].
In this study, the delineation of RBZ widths within the borders of Türkiye was guided by national regulations. According to the “Technical Principles of Silvicultural Applications” issued by the Silviculture Department of the General Directorate of Forestry, RBZs are to be established at intervals of 25–50 m on both banks of small, narrow-bottomed streams and 50–100 m on both banks of large, broad-bottomed streams, depending on the degree of slope in the forested areas adjacent to the river [24]. The ‘ORD_STRA’ variable from the RiverATLAS dataset can be helpful to classify streams as either small or large. This variable follows the Strahler stream order system [55], where a stream of order 1 represents a headwater stream, and the confluence of two first-order streams results in a second-order river. This system classified headwater streams as large and their tributaries as small for this study (Table 1).

Table 1.
RBZ widths in meters according to Turkish Technical Principles of Silvicultural Applications [24].
The slope percentage of the stream also influences the determination of RBZ widths based on Turkish regulatory guidelines. Therefore, this study used SRTM 1 Arc-Second Global DEM data to calculate the slope percentage. Because the regulation does not explicitly define the threshold for classifying slopes as high or low, a slope threshold of 20 percent, generally considered indicative of a steep slope, was chosen in this study. As a result, large streams with a slope of less than 20 percent are assigned an RBZ width of 50 m, while those exceeding that slope are assigned 100 m. Similarly, tributaries classified as small streams are assigned an RBZ width of 30 m on gentle slopes and 50 m on steep slopes (Table 1). Notably, the RBZ width range specified in the ordinance for small streams, set initially at 25–50 m, was adjusted to 30–50 m to match the 10 m spatial resolution of the land cover dataset used in subsequent study phases.
2.5. Land Cover and Change Analysis
This study used seven iterations of Esri Sentinel global land cover data from 2017 to 2023 to assess land cover status within RBZs and track land cover changes temporally. These datasets categorize the landscape into nine different land cover classes. The ‘Water’ class includes bodies of water such as rivers, ponds, lakes, and oceans that remain waterlogged for most of the year. The ‘Tree’ class is defined by communities of trees at least 15 m tall and with a high degree of canopy cover. ‘Flooded vegetation’ represents areas where water is visibly interspersed with vegetation for most of the year. The ‘Crops’ class includes cultivated areas where agricultural products such as corn, wheat, and soybeans are grown instead of tree-covered areas. Urban areas, including buildings, cities, and non-porous surfaces such as roads, are classified as ‘Built Areas’. ‘Bare Ground’ identifies deserts, sands, or rocky terrains with sparse or lack of vegetation. The ‘Snow/Ice’ and ‘Clouds’ classes represent regions that are primarily influenced by atmospheric or climatic conditions during image processing. Finally, the ‘Rangelands’ class is characterized by non-arboreal vegetation, including both annual and perennial herbaceous plants and grassy areas [46].
In this study, each land cover class described above was included in the analysis to provide comprehensive results. The coverage of each annual land cover class within the RBZs was quantified and averaged over the past seven years to assess the overall condition of these zones. In addition, changes, trends, and directions of change between 2017 and 2023 were meticulously analyzed to facilitate a detailed examination of the country’s riparian ecosystems. This approach allowed an in-depth understanding of riparian zones’ temporal dynamics and health over the specified period.
While this study extensively utilized the Esri Sentinel global land cover data from 2017 to 2023 to evaluate the land cover changes within RBZs, it is important to acknowledge the inherent uncertainties associated with remote sensing data. One comparative study has shown that while the Esri Sentinel land cover dataset achieves the highest overall accuracy among datasets with similar spatial resolutions at 75%, there are still inevitable errors present. For instance, compared with Dynamic World and World Cover datasets, which reported 72% and 65% accuracy, respectively, the Esri Sentinel data showed superior performance, yet still contained some classification uncertainty [56]. This potential for error underscores the need to carefully interpret these dataset’s land cover change results.
2.6. Data Analyses
This study employed comprehensive data analysis to assess changes and trends within RBZs in Türkiye. All spatial data analyses were conducted using ArcGIS Pro software, a robust spatial analysis and mapping tool. The software facilitated the accurate delineation and mapping of RBZs, thereby enabling a precise evaluation of land cover changes over the designated period.
The Jupyter Notebook environment, which employs the Python programming language, was utilized to conduct statistical analyses. This configuration permitted the implementation of sophisticated statistical methodologies and the effective management of voluminous datasets. In particular, the Mann–Kendall trend analysis, a non-parametric test commonly employed for assessing trends in time-series data [57], was utilized to investigate the temporal trends in land cover within the RBZs. This method facilitated the identification of statistically significant changes and trends over time. The results of the Mann–Kendall trend analysis were represented visually through trend charts and heatmaps, which provided precise and intuitive insights into the direction and magnitude of land cover changes within the RBZs, facilitating a deeper understanding of the dynamics. These tools were crucial in highlighting significant patterns and trends, further supporting the findings discussed in the study.
3. Results
Following the delineation of stream bank widths as described in Section 2.3, RBZs were delineated on both sides of the stream bank boundaries according to the regulations outlined in Table 1 (Figure 1). These delineated RBZs are calculated to cover an area of approximately 1.2 million hectares within the study area. The focus then shifted to analyzing the land cover status within these zones, assessing changes from the past to the present.
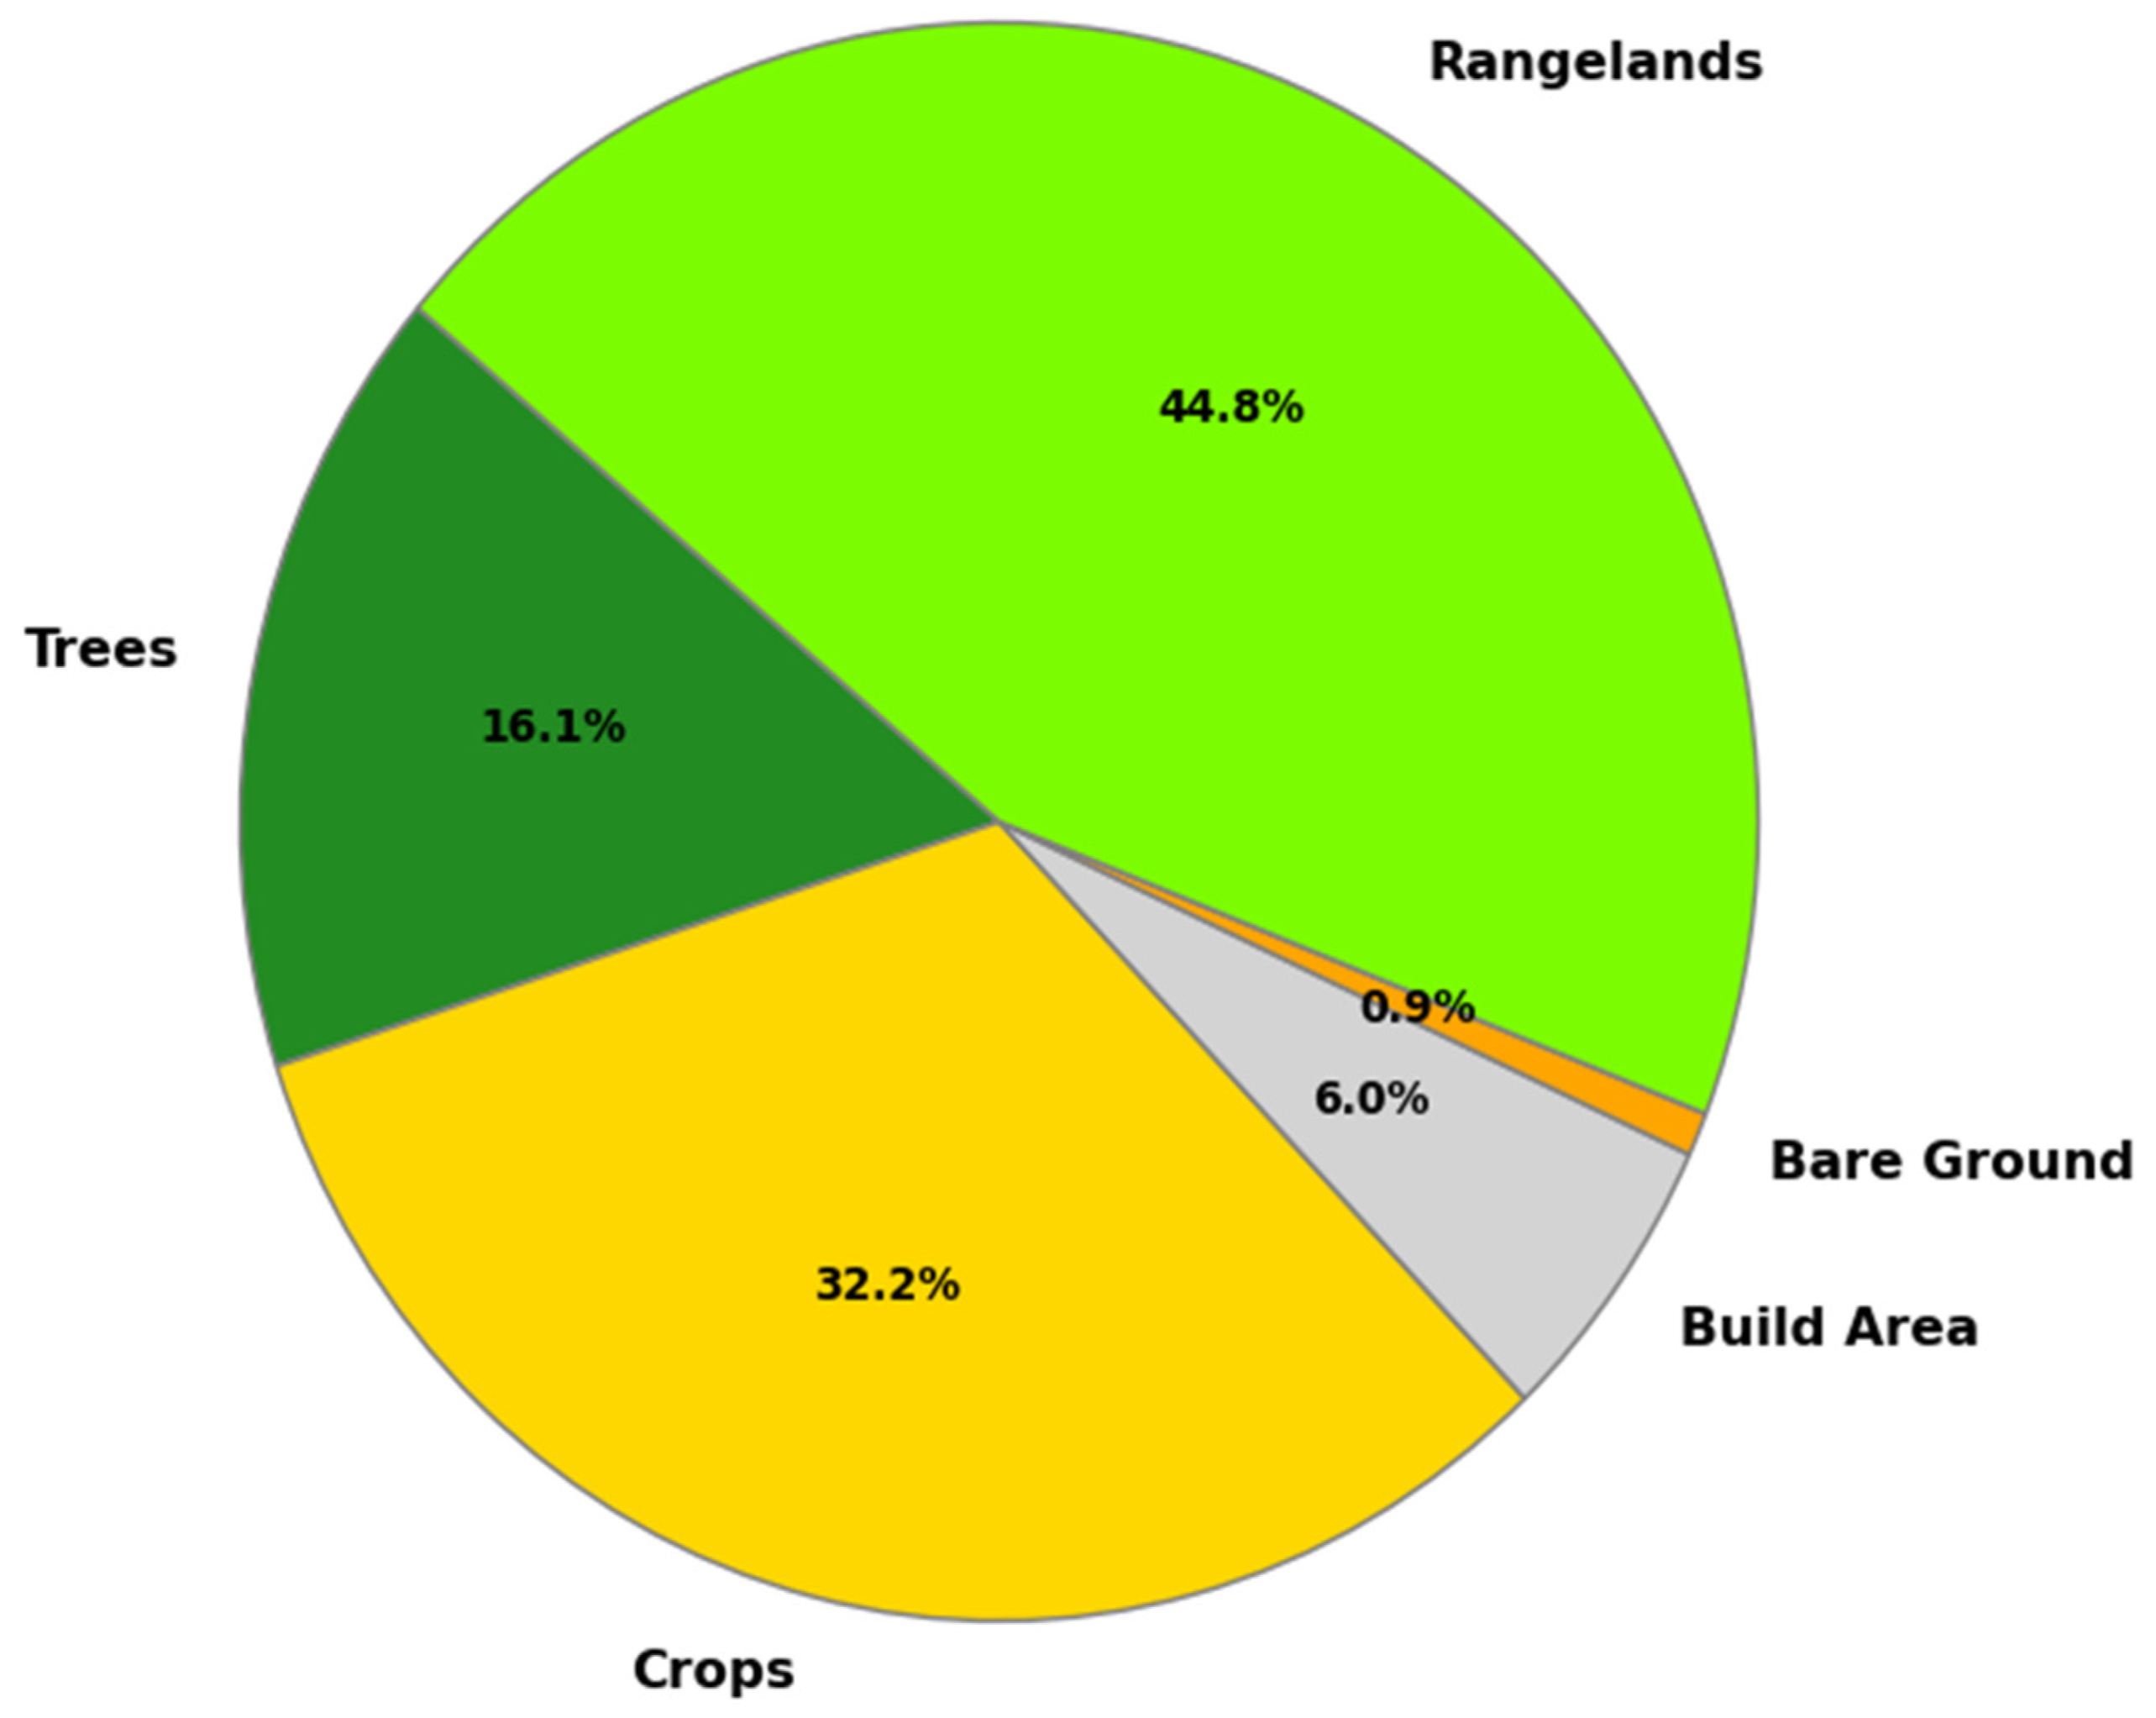
The current status and temporal land cover changes within the designated RBZs were assessed using Esri Sentinel global land cover maps produced annually between 2017 and 2023. The area, measured in hectares, covered annually by eight of the nine different land cover classes within the RBZs, is detailed in Table 2. In addition, Figure 3 illustrates the average percentage coverage of dominant land cover classes over the seven years. The analysis shows that ‘Rangelands’ is the predominant land cover within the RBZs, consistently covering over 500,000 hectares. On average, the ‘Rangelands’ class accounts for 44.8 percent of RBZs, followed by ‘Crops’ at 32.2 percent and ‘Trees’ at 16.1 percent. In addition, it has been determined that total green areas, excluding agricultural fields, cover approximately 61 percent of the entire RBZs. The ‘Built Area’ class accounts for an average of 6 percent of RBZs, varying between 62,000 and 76,000 hectares over the years. The least common class is ‘Bare Ground’, besides the classes ‘Flooded Vegetation’ ‘Snow-Ice’, and ‘Clouds’, which are not included in Figure 3 due to their negligible representation.
Table 2.
Areas in hectares of land cover classes within RBZs by year (Flood. Veg. = Flooded Vegetation Class).
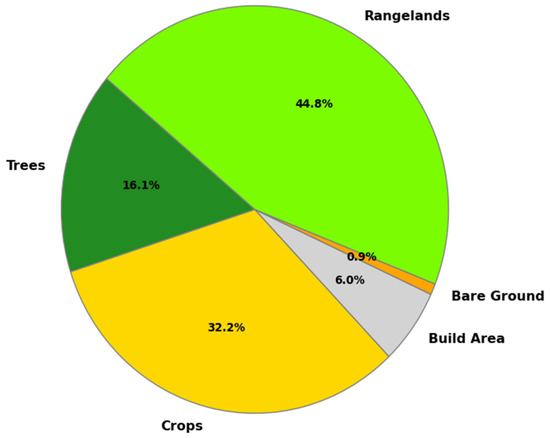
Figure 3.
Average percentage areas of land cover classes within RBZs between 2017 and 2023.
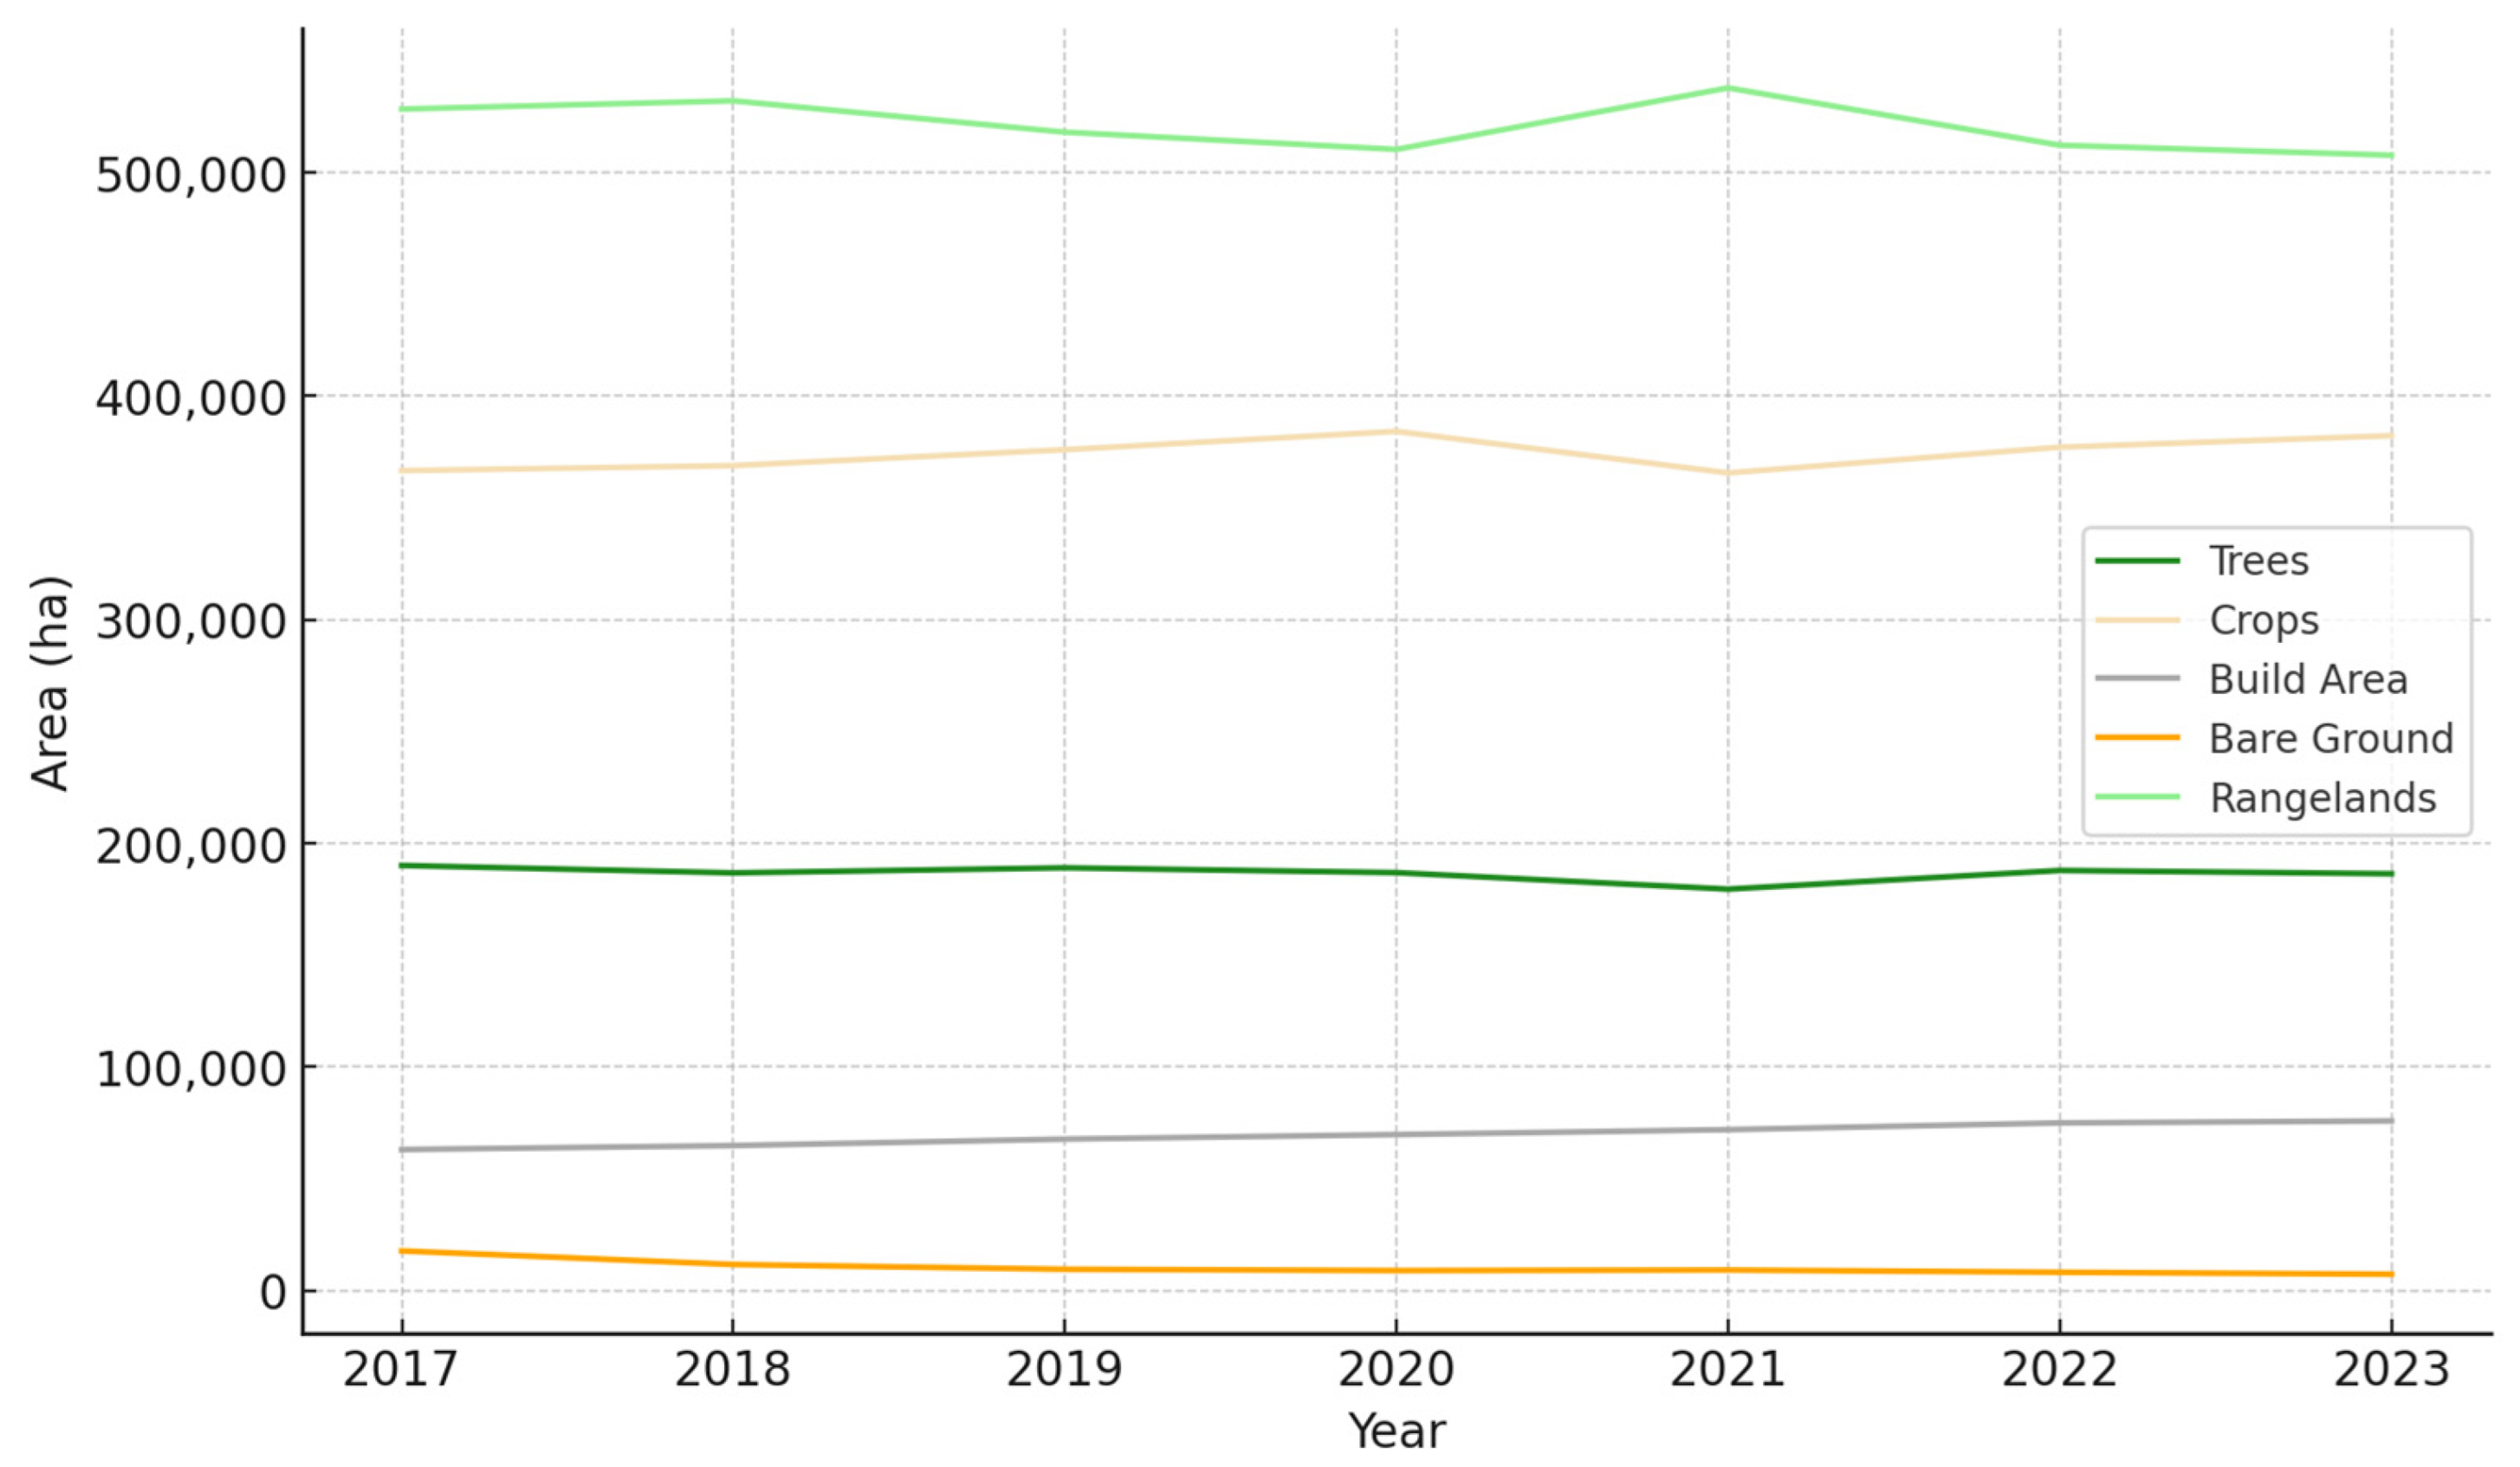
Created after trend analyses, Figure 4 presents a line graph that illustrates the changes in land cover classes, visually depicting the extent and nature of these changes over the study period. Additionally, Figure 5 features a heatmap that delineates the outcomes of the Mann–Kendall trend test, providing a detailed view of the trends within each land cover class based on the statistical analyses described in the Data Analyses subsection. Examining the Mann–Kendall trend test results by land cover class, the ‘Trees’ class shows a trend coefficient (tau) of −0.43, indicating a decreasing trend; however, with a p-value of 0.239, this trend is not statistically significant at the conventional alpha level of 0.05, so the null hypothesis of no trend cannot be rejected. The ‘Crops’ class shows a trend coefficient of 0.43, indicating an increasing trend, but again with a non-significant p-value of 0.239. Conversely, the ‘Built Area’ class shows a strong increasing trend with a trend coefficient of 1.0 and a statistically significant p-value of approximately 0.0004, confirming the significance of this increase. The Bare Ground class shows a strong decreasing trend with a trend coefficient of −0.90 and a significant p-value of approximately 0.0028, indicating a significant decrease over the years. Finally, the ‘Rangelands’ class has a trend coefficient of −0.43, indicating a decreasing trend, but its p-value of 0.239 renders this trend statistically insignificant.
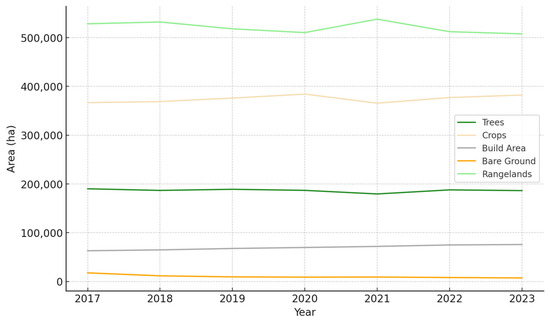
Figure 4.
The line graph illustrates the area (ha) trend of different land cover classes from 2017 to 2023.
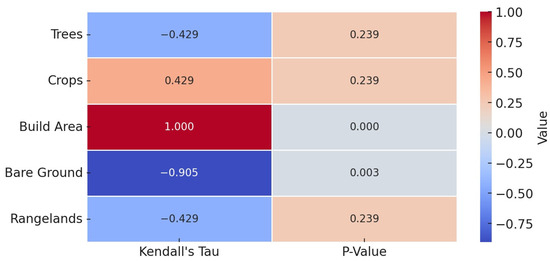
Figure 5.
The heatmap summarizes each land cover class’s Mann–Kendall trend test results, displaying Kendall’s tau (trend coefficient) and p-values.
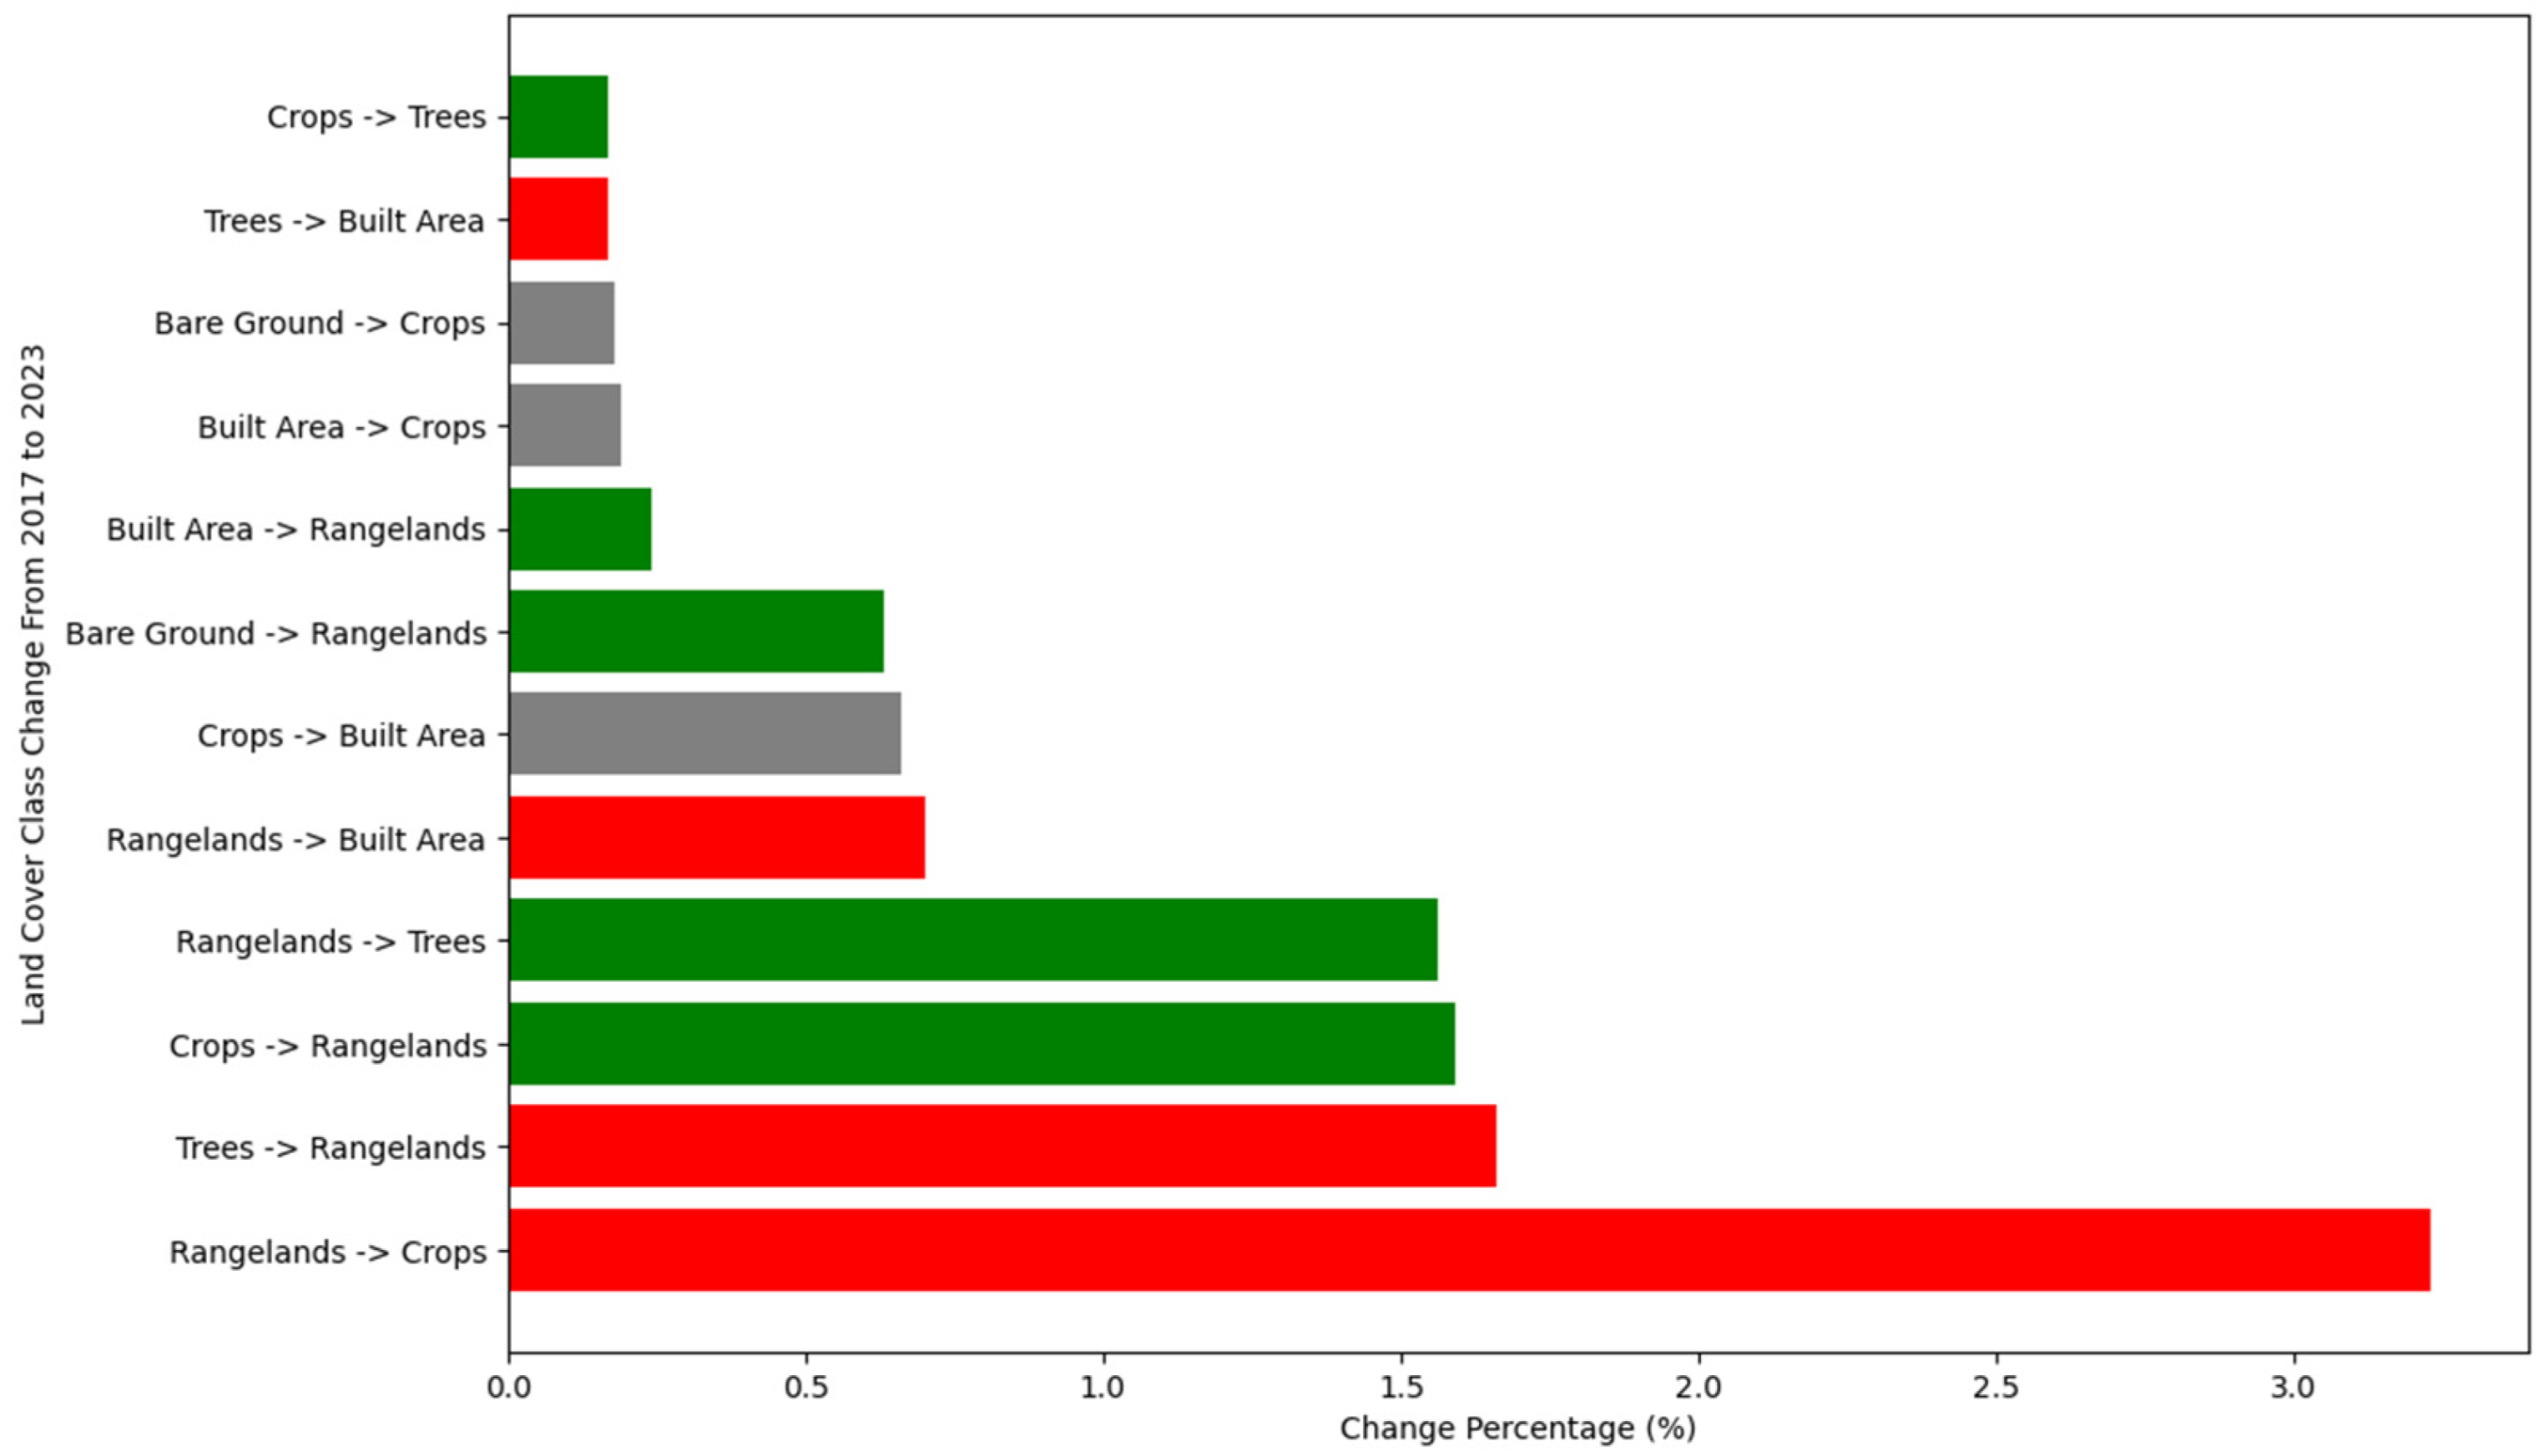
Following the trend analysis over the years, change analyses were conducted to determine the direction of land cover change within RBZs from 2017 to 2023. The study revealed that 88.56 percent of the areas within the RBZs experienced no change in land cover. The most significant land cover conversions occurred between the ‘Rangelands’ and ‘Crops’ classes of the remaining regions. Specifically, 3.23 percent of RBZ land changed from rangeland to cropland, or about 37,000 hectares (Figure 6). Conversely, about 18,000 hectares shifted from the ‘Crops’ class to the ‘Rangelands’ class. This resulted in a net conversion of about 19,000 hectares from ‘Rangelands’ to ‘Crops’ over the seven years.

Figure 6.
Bar graph depicting percentage shifting between land cover classes within RBZs from 2017 to 2023. Green bars indicate transitions beneficial to water quality, such as increases in vegetation cover, while red bars represent shifts detrimental to water quality, such as increases in built-up areas or agricultural expansion. Gray bars denote neutral changes or show no significant impact on ecological health.
Another significant conversion was observed between the land cover classes ‘Trees’ and ‘Rangelands’. Specifically, a total of 19,154 hectares, or 1.66 percent of all RBZs, shifted from the ‘Trees’ class to the ‘Rangelands’ class. Conversely, a slightly smaller area of 17,971 hectares moved from ‘Rangelands’ to ‘Trees’. This results in a net change of only 1183 hectares between these two classes, which is relatively small in the context of the total RBZ area.
Over the seven years, there were notable shifts within the RBZs, particularly from the ‘Rangelands’ and ‘Crops’ classes to the ‘Built-up Area’ class, which showed a positive trend. Conversely, the areas classified in the ‘Bare Ground’ class, which showed a negative trend, predominantly moved into the ‘Rangelands’ class. Furthermore, it was found that the ‘Rangelands’ and ‘Crops’ classes, which occupy the most significant areas within the RBZs, were the most dynamic regarding changes experienced with other land cover classes.
4. Discussion
According to our findings, the ‘Rangelands’ class, which occupies the largest area within RBZs (44.8%), typically includes treeless shrubs, bushes, and grasslands. Previous research indicates that rangelands, especially those adjacent to agricultural lands, are generally less effective at improving water quality, with significantly lower denitrification capabilities than riparian forests [57,58]. Because the land cover dataset does not distinguish between shrublands, scrublands, and natural grasslands within the “Rangelands” class, it is difficult to determine the exact impacts. However, these areas are less effective at managing water quality and mitigating erosion risks than forested areas.
On the other hand, the fact that the number of forests in the entire RBZs is limited to 16 percent points to a significant issue. Forest cover, which ensures reduced erosion, sediment transport, and better denitrification, is lower within the RBZs than in the rest of the country. According to the report “Forest Asset 2020” prepared by the General Directorate of Forestry, forests cover 29.4 percent of the country’s total area [32]. This situation indicates that many riparian zones need improvement in the management. In addition, one of the most striking findings of this study is that the forest buffer zones around stream courses are essential to reduce the major negative impacts of agricultural fields, which are the most common form of land use created by human hands [59] and compose about half of all agricultural fields within RBZs of the whole country.
A noteworthy observation from the study is the prevalence of the “Crops” class within the RBZs, which has significant implications for water quality and greenhouse gas emissions. RBZs are essential for intercepting agricultural runoff pollutants before reaching streams, aquifers, and reservoirs. Fertilizers in agriculture introduce various pollutants, including nitrous oxide (N2O), a potent greenhouse gas contributing to climate change. The use of synthetic nitrogen fertilizers in global food production has increased the concentration of N2O in the atmosphere, where it remains for a more extended period than carbon dioxide. This has the effect of exacerbating the environmental impact of N2O. In agricultural systems, nitrogen is introduced to the soil through various means, including atmospheric deposition, nitrogen-fixing legumes, chemical fertilizers, animal manure, and organic residue mineralization [60,61]. Nitrogen is removed from the soil through several processes, including plant uptake, volatilization, denitrification, NH4+ fixation, leaching, and erosion. Furthermore, nitrogen transformation processes—immobilization, mineralization, and nitrification—contribute to environmental challenges [62,63,64]. As nitrogen volatilizes, it increases the concentration of nitrogen oxides in the atmosphere, thereby enhancing the greenhouse effect [60].
The necessity for buffer zones along stream banks extends beyond forest lands to include pasture, agricultural, and residential areas, which represent significant sources of pollutants entering streams. Implementing measures in these areas to mitigate pollution is of the utmost importance. Specifically, buffer zones should be established along streams within agricultural lands to minimize the pollution from agricultural fertilizers. Additionally, efforts should be made to reduce the usage of fertilizers and to promote organic farming practices in these zones. Nevertheless, the findings of this study indicate that a substantial 32.2 percent of the RBZs are composed of agricultural areas, regardless of the adjacent land cover types. Ideally, these areas should be safeguarded by riparian forests or even less impactful natural grasslands, and shrub plant communities such as maquis. The prevalence of agricultural land within RBZs at this scale represents a significant concern, underscoring the need for more effective management and protective measures.
To address these issues, undertaking a comprehensive reevaluation of the country’s agricultural and water policies is of the utmost importance. It is recommended that agricultural activities should be prohibited in proximity to streams and those areas previously subjected to such practices undergo rehabilitation, with compensation provided to the affected landowners. Nevertheless, rehabilitating an area as extensive as 375,000 hectares would necessitate substantial financial resources. To identify a more effective solution, it is necessary to examine the RBZ width guidelines set forth by the Silviculture Department of the General Directorate of Forestry in the ‘Technical Principles of Silvicultural Applications’ in greater detail [24]. Countries implement varying RBZ widths to balance economic gains and ecological preservation [48,51,65,66]. It is of the utmost importance that these practices be subjected to rigorous analysis to determine an optimal RBZ width for Türkiye that aligns with economic and ecological objectives. Moreover, it is paramount to identify the specific plant species and varieties within these RBZs to facilitate future planning. The absence of academic research on these topics in Türkiye underscores the pressing need to advance water conservation efforts through informed and strategic approaches.
Another objective of this study was to analyze the trend in land cover changes within RBZs from 2017 to 2023. Statistically, the “Built Area” land cover class has demonstrated an increasing trend, while the “Bare Ground” class has shown a decrease over the years. Although not statistically definitive, the Table 2 and Figure 4 and Figure 5 observations indicate a general decrease in the ‘Rangelands’ and ‘Trees’ classes and an increase in the ‘Crops’ class over the last seven years. In light of the impacts, as mentioned earlier, of agricultural expanses and urban developments on water quality, it is evident that these increases could have a detrimental effect on water resources. Moreover, these findings indicate that the agricultural and water policies proposed earlier have yet to be effectively implemented over the past seven years.
The study’s findings highlight the critical role of RBZs in achieving multiple key objectives in addressing the United Nations SDGs. Most directly, the research supports Goal 6, ‘Clean Water and Sanitation’ by demonstrating the vital function of RBZs in maintaining water quality, which is essential for human and ecological health. Maintaining clean water resources is also of great importance for the sustainability of agriculture, which is closely linked to Goal 2, ‘Zero Hunger’. Given Türkiye’s expanding population and rising demand for food, it is imperative to maintain the health of RBZs to ensure agricultural productivity and food security [67]. Improved water quality facilitates enhanced agricultural yields and reduces the likelihood of crop failures due to water pollution, directly impacting the nation’s ability to combat hunger.
Moreover, providing clean water is paramount in preventing waterborne diseases, which significantly contribute to the morbidity and mortality associated with Goal 3, ‘Good Health and Well-Being’. Improved water quality has been demonstrated to substantially reduce health risks, as the World Health Organization has documented [68]. This underscores the crucial role of effective water management in enhancing public health. The findings of this study indicate that a considerable proportion of the RBZs, which serve as conduits for water resources in Türkiye, are subject to the influence of agricultural activities, resulting in a notable decline in water quality. The rehabilitation of these RBZs is essential for protecting public health and reducing healthcare costs associated with waterborne diseases. Therefore, these zones must be preserved and improved if we are to safeguard public health and ensure sustainable healthcare spending.
Concerning Goal 11, the effective management of urban water resources through RBZs ensures the sustainability of water distribution systems, which are crucial for urban planning. Integrating RBZs into urban landscapes mitigates the impacts of urban runoff and pollutants, thereby ensuring the creation of safer and more sustainable urban environments. Although the “Built Area” class within RBZs, accounting for 6 percent as evidenced by the study results, does not cover a large area overall, the increasing population and scarcity of living spaces may intensify pressures on these zones. Moreover, given the vital function of these zones in ensuring access to clean water, it is of the utmost importance that national authorities meticulously evaluate the dilemma to balance urban expansion and environmental sustainability.
The health of aquatic ecosystems within the RBZs of Türkiye, which is surrounded by seas on three sides, is critical, as it supports Goal 14, ‘Life Below Water’, which focuses on the conservation and sustainable use of oceans, seas, and marine resources. The findings of this study, which highlight significant changes in land cover within RBZs, particularly the increase in agricultural and built areas, raise concerns about the potential adverse effects on aquatic biodiversity. Maintaining clean waterways is of great importance for preserving aquatic habitats and the biodiversity they support. These ecosystems are home to diverse flora and fauna, which are crucial for maintaining ecological balance. The study posits that enhancing the protection and management of these buffer zones could significantly contribute to the health of marine and freshwater ecosystems by mitigating pollutant runoff and preserving natural habitats. Similarly, conserving terrestrial ecosystems near water bodies aligns with the objectives outlined in Goal 15, ‘Life on Land’. RBZs play a pivotal role in maintaining these terrestrial ecosystems, enhancing biodiversity, and providing vital ecosystem services. However, as observed in the study, the encroachment of agricultural lands and the expansion of built areas threaten these terrestrial habitats. To counteract these pressures, it is essential to implement more robust conservation strategies within RBZs to ensure that they continue to serve as adequate buffers that enhance terrestrial biodiversity. This entails the implementation of more rigorous land-use regulations within these zones, accompanied by promoting practices that facilitate ecological sustainability.
5. Conclusions
This study offers a comprehensive analysis of RBZs in Türkiye, evaluating the changes in land cover within these zones from 2017 to 2023. Our findings underscore the critical role of RBZs in water resource management and ecological conservation. Despite the original intentions behind establishing RBZs, a significant proportion—specifically 32.2% of these zones—remain dominated by agricultural practices, which continue to present a risk to water quality due to runoff and the associated pollutants. Furthermore, the continued expansion of built-up areas within RBZs raises concerns about the ongoing encroachment of urban areas into these ecologically sensitive regions.
The study revealed that while the ‘Rangelands’ class represents the most extensive land cover class within RBZs, their effectiveness in pollution mitigation is less than that of forested areas, constituting only 16 percent of the RBZs. This imbalance highlights a significant gap in the protective coverage that RBZs are supposed to provide against environmental degradation. Furthermore, the observed trends of declining forest areas and expanding croplands within RBZs worsen the vulnerability of water resources to agricultural pollutants, with nitrous oxide—a potent greenhouse gas—a notable example.
Given these findings, it is clear that a strategic overhaul of environmental, agricultural, and land management policies is required to enhance the functionality and coverage of RBZs. It is of the utmost importance that future policies not only focus on expanding forested areas within RBZs but also rigorously control agricultural expansion and urban development within these zones. Integrating more detailed environmental assessments and adaptive management strategies into the regulatory framework can significantly improve the effectiveness of RBZs in safeguarding water quality and promoting biodiversity. Ultimately, the objective should align more closely with the Sustainable Development Goals, thereby ensuring Türkiye’s sustainable and resilient environmental future. This study provides the foundation for informed decision-making and underscores the pressing need for comprehensive action to address the challenges identified.
Author Contributions
Conceptualization, E.A., K.G., M.A., O.K. and F.Y.; methodology, E.A.; software, E.A.; validation, E.A., M.A., K.G., O.K. and F.Y.; formal analysis, E.A.; investigation, E.A., K.G. and O.K.; resources, E.A. and M.A.; data curation, E.A.; writing—original draft preparation, E.A.; writing—review and editing, K.G., M.A., O.K. and F.Y.; visualization, E.A.; supervision, K.G., M.A. and O.K. All authors have read and agreed to the published version of the manuscript.
Funding
This research received no external funding.
Data Availability Statement
The datasets analyzed in the current study were obtained from publicly accessible sources. The datasets, including HydroSHEDS, SRTM 1 Arc-Second Global, and Esri-Sentinel global land cover data, can be accessed online through their respective platforms. Due to the extensive size of the compiled dataset, it is not directly available for public download. Researchers who wish to access specific parts of the dataset or require further information about the data analysis are invited to contact Dr. Emre AKTURK with their queries.
Conflicts of Interest
The authors declare no conflicts of interest.
References
- Mukheibir, P. Water access, water scarcity, and climate change. Environ. Manag. 2010, 45, 1027–1039. [Google Scholar] [CrossRef]
- G20 High-Level Principles for Digital Financial Inclusion Sustainable Development Knowledge Platform. Available online: https://sustainabledevelopment.un.org/index.php?page=view&type=400&nr=2667&menu=1515 (accessed on 13 June 2023).
- Maraseni, T.N.; Mitchell, C. An assessment of carbon sequestration potential of riparian zone of Condamine Catchment, Queensland, Australia. Land Use Policy 2016, 54, 139–146. [Google Scholar] [CrossRef]
- Yilmaz, M.; Çiçek, E. Yüzeysel su kaynakları çevresinde ormancılık etkinlikleri. J. Fac. For. Istanb. Univ. 2002, 52, 95–110. [Google Scholar]
- Naiman, R.J.; Decamps, H. The ecology of interfaces: Riparian zones. Annu. Rev. Ecol. Syst. 1997, 28, 621–658. [Google Scholar] [CrossRef]
- Sweeney, B.W.; Bott, T.L.; Jackson, J.K.; Kaplan, L.A.; Newbold, J.D.; Standley, L.J.; Horwitz, R.J. Riparian deforestation, stream narrowing, and loss of stream ecosystem services. Proc. Natl. Acad. Sci. USA 2004, 101, 14132–14137. [Google Scholar] [CrossRef]
- Monteiro, J.A.; Kamali, B.; Srinivasan, R.; Abbaspour, K.; Gücker, B. Modelling the effect of riparian vegetation restoration on sediment transport in a human-impacted Brazilian catchment. Ecohydrology 2016, 9, 1289–1303. [Google Scholar] [CrossRef]
- Tabacchi, E.; Lambs, L.; Guilloy, H.; Planty-Tabacchi, A.M.; Muller, E.; Decamps, H. Impacts of riparian vegetation on hydrological processes. Hydrol. Process. 2000, 14, 2959–2976. [Google Scholar] [CrossRef]
- Pettit, N.E.; Naiman, R.J. Fire in the riparian zone: Characteristics and ecological consequences. Ecosystems 2007, 10, 673–687. [Google Scholar] [CrossRef]
- González, E.; Felipe-Lucia, M.R.; Bourgeois, B.; Boz, B.; Nilsson, C.; Palmer, G.; Sher, A.A. Integrative conservation of riparian zones. Biol. Conserv. 2017, 211, 20–29. [Google Scholar] [CrossRef]
- Majumdar, A.; Avishek, K. Riparian zone assessment and management: An integrated review using geospatial technology. Water Air Soil Pollut. 2023, 234, 319. [Google Scholar] [CrossRef]
- Buffin-Bélanger, T.; Biron, P.M.; Larocque, M.; Demers, S.; Olsen, T.; Choné, G.; Eyquem, J. Freedom space for rivers: An economically viable river management concept in a changing climate. Geomorphology 2015, 251, 137–148. [Google Scholar] [CrossRef]
- Kujanová, K.; Matoušková, M.; Hošek, Z. The relationship between river types and land cover in riparian zones. Limnologica 2018, 71, 29–43. [Google Scholar] [CrossRef]
- Patten, D.T. Riparian ecosytems of semi-arid North America: Diversity and human impacts. Wetlands 1998, 18, 498–512. [Google Scholar] [CrossRef]
- Burbrink, F.T.; Phillips, C.A.; Heske, E.J. A riparian zone in southern Illinois as a potential dispersal corridor for reptiles and amphibians. Biol. Conserv. 1998, 86, 107–115. [Google Scholar] [CrossRef]
- Risser, P.G. The ecological importance of land-water ecotones. In The Ecology and Management of Aquatic-Terrestrial Ecotones; Robert, J.N., Henri, D., Eds.; The Parthenon Publishing Group: London, UK, 1990; Volume 4, pp. 7–21. [Google Scholar]
- Fonseca, A.; Ugille, J.P.; Michez, A.; Rodríguez-González, P.M.; Duarte, G.; Ferreira, M.T.; Fernandes, M.R. Assessing the connectivity of Riparian Forests across a gradient of human disturbance: The potential of Copernicus “Riparian Zones” in two hydroregions. Forests 2021, 12, 674. [Google Scholar] [CrossRef]
- Zhang, A.Y.; Wang, Q.; Wu, C.; Ma, W.; Zhou, M.; Cao, K. Spatial and temporal analysis of water quality trends in the Min River Basin. In Proceedings of the 2012 International Symposium on Geomatics for Integrated Water Resource Management, Lanzhou, China, 19–21 October 2012; IEEE: Piscataway, NJ, USA, 2012. [Google Scholar]
- de Mello, K.; Valente, R.A.; Randhir, T.O.; dos Santos, A.C.A.; Vettorazzi, C.A. Effects of land use and land cover on water quality of low-order streams in Southeastern Brazil: Watershed versus riparian zone. Catena 2018, 167, 130–138. [Google Scholar] [CrossRef]
- Claessens, L.; Hopkinson, C.; Rastetter, E.; Vallino, J. Effect of historical changes in land use and climate on the water budget of an urbanizing watershed. Water Resour. Res. 2006, 42, 1–13. [Google Scholar] [CrossRef]
- Li, S.; Liu, W.; Gu, S.; Cheng, X.; Xu, Z.; Zhang, Q. Spatio-temporal dynamics of nutrients in the upper Han River basin, China. J. Hazard. Mater. 2009, 162, 1340–1346. [Google Scholar] [CrossRef]
- Dufour, S.; Rodríguez-González, P.M.; Laslier, M. Tracing the scientific trajectory of riparian vegetation studies: Main topics, approaches and needs in a globally changing world. Sci. Total Environ. 2019, 653, 1168–1185. [Google Scholar] [CrossRef]
- Mevzuat. Available online: https://www.mevzuat.gov.tr/File/GeneratePdf?mevzuatNo=19546&mevzuatTur=KurumVeKurulusYonetmeligi&mevzuatTertip=5 (accessed on 12 May 2024).
- OGM. Available online: https://www.ogm.gov.tr/tr/e-kutuphane-sitesi/mevzuat-sitesi/Tebligler/Silvikültür%20Uygulamalarının%20Teknik%20Esasları.pdf (accessed on 12 May 2024).
- Gültekin, Y.S. An Overview of Studies on “Riparian Ecosystems” in Turkey (2010–2021). J. Int. Sci. Publ. Ecol. Saf. 2021, 15, 73–81. [Google Scholar]
- Abdullah, E. Mapping and analysis of riparian forests: Case study of baskonus research and application forest in Kahramanmaras, Turkey. Technology 2010, 13, 251–260. [Google Scholar]
- Akay, A.E.; Sivrikaya, F.; Gulci, S. Analyzing riparian forest cover changes along the Firniz River in the Mediterranean City of Kahramanmaras in Turkey. Environ. Monit. Assess. 2014, 186, 2741–2747. [Google Scholar] [CrossRef]
- Zogaris, S.; Markogianni, V.; Özeren, S.C.; Dimitriou, E. Assessment of Riparian zone and river Island conditions in a Trans-boundary greenbelt: The Evros/Meriç river (Greece-Turkey). Fresenius Environ. Bull. 2015, 24, 269–277. [Google Scholar]
- Karakuş, C.B. Assessment of relationship between land use/cover and surface water quality trends within the riparian zone: A case study from Sivas, Turkey. Desalination Water Treat. 2020, 182, 414–433. [Google Scholar] [CrossRef]
- Özdeniz, E.; Kurt, L.; Bergmeier, E. Syntaxonomical analysis of the riparian vegetation of the Porsuk River (Eskişehir-Kütahya/Turkey). Turk. J. Bot. 2017, 41, 609–619. [Google Scholar] [CrossRef]
- Keten, A.; Eroglu, E.; Kaya, S.; Anderson, J.T. Bird diversity along a riparian corridor in a moderate urban landscape. Ecol. Indic. 2020, 118, 106751. [Google Scholar] [CrossRef]
- 2020 Türkiye Orman Varlığı. Available online: https://www.ogm.gov.tr/tr/ormanlarimiz-sitesi/TurkiyeOrmanVarligi/Yayinlar/2020%20T%C3%BCrkiye%20Orman%20Varl%C4%B1%C4%9F%C4%B1.pdf (accessed on 9 May 2024).
- Aksoy, N.; Tuğ, N.G.; Eminağaoğlu, Ö. Türkiye’nin Vejetasyon Yapısı. In Türkiye’nin Doğal-Egzotik Ağaç ve Çalıları 1; T.C. Orman ve Su İşleri Bakanlığı Yayınları: Ankara, Türkiye, 2014. [Google Scholar]
- Akyol, İ. Türkiye’de akarsu sistemleri ve rejimleri. Türk Coğrafya Derg. 1947, 9–10, 1–35. [Google Scholar]
- Akbulut, N.E.; Bayarı, S.; Akbulut, A.; Özyurt, N.N.; Sahin, Y. Rivers of Turkey. In Rivers of Europe; Elsevier: Amsterdam, The Netherlands, 2022; pp. 853–882. [Google Scholar] [CrossRef]
- Tarım ve Orman Bakanlığı Doğa Koruma ve Milli Parklar Genel Müdürlüğü. Available online: https://www.tarimorman.gov.tr/DKMP/Menu/31/Sulak-Alanlar (accessed on 25 June 2024).
- Erinç, S. Klimatoloji ve Metodları; No: 3278; İstanbul Üniversitesi Yayınları: İstanbul, Türkiye, 1984; Volume 2. [Google Scholar]
- Ölgen, M.K. Türkiye’de yillik ve mevsimsel yağiş değişkenliğinin alansal dağilimi. Ege Coğrafya Derg. 2010, 19, 85–95. [Google Scholar]
- Akpınar, E. Nehir tipi santrallerin Türkiye’nin hidroelektrik üretimindeki yeri. Erzincan Üniversitesi Eğitim Fakültesi Derg. 2005, 7, 1–25. [Google Scholar]
- DSI. Available online: https://dsi.gov.tr/Sayfa/Detay/754 (accessed on 9 May 2024).
- European Environment Agency. Available online: https://www.eea.europa.eu/publications/eea_report_2005_4/download (accessed on 9 May 2024).
- Wickel, B.A.; Lehner, B.; Sindorf, N. HydroSHEDS: A global comprehensive hydrographic dataset. In AGU Fall Meeting Abstracts; American Geophysical Union: San Francisco, CA, USA, 2007; p. H11H-05. [Google Scholar]
- Linke, S.; Lehner, B.; Ouellet Dallaire, C.; Ariwi, J.; Grill, G.; Anand, M.; Beames, P.; Burchard-Levine, V.; Maxwell, S.; Moidu, H.; et al. Global hydro-environmental sub-basin and river reach characteristics at high spatial resolution. Sci. Data 2019, 6, 283. [Google Scholar] [CrossRef] [PubMed]
- Lehner, B.; Messager, M.L.; Korver, M.C.; Linke, S. Global hydro-environmental lake characteristics at high spatial resolution. Sci. Data 2022, 9, 351. [Google Scholar] [CrossRef]
- USGS. Available online: https://www.usgs.gov/centers/eros/science/usgs-eros-archive-digital-elevation-shuttle-radar-topography-mission-srtm-1?qt-science_center_objects=0#qt-science_center_objects (accessed on 2 April 2024).
- ESRI. Available online: https://livingatlas.arcgis.com/landcover/ (accessed on 2 April 2024).
- Karra, K.; Kontgis, C.; Statman-Weil, Z.; Mazzariello, J.C.; Mathis, M.; Brumby, S.P. Global land use/land cover with Sentinel 2 and deep learning. In Proceedings of the 2021 IEEE International Geoscience and Remote sensing Symposium IGARSS, Brussels, Belgium, 11–16 July 2021; IEEE: Piscataway, NJ, USA, 2021. [Google Scholar] [CrossRef]
- Hughes, A.O. Riparian management and stream bank erosion in New Zealand. N. Z. J. Mar. Freshw. Res. 2016, 50, 277–290. [Google Scholar] [CrossRef]
- Fryirs, K.; Spink, A.; Brierley, G. Post-European settlement response gradients of river sensitivity and recovery across the upper Hunter catchment, Australia. Earth Surf. Process. Landf. 2009, 34, 897–918. [Google Scholar] [CrossRef]
- Wenger, S.J. A Review of the Scientific Literature on Riparian Buffer Width, Extent and Vegetation; University of Georgia, Public Service & Outreach, Institute of Ecology: Athens, GA, USA, 1999; 59p. [Google Scholar]
- Lee, P.; Smyth, C.; Boutin, S. Quantitative review of riparian buffer width guidelines from Canada and the United States. J. Environ. Manag. 2004, 70, 165–180. [Google Scholar] [CrossRef]
- McDermott, C.; Cashore, B.; Kanowski, P. Global Environmental Forest Policies, 1st ed.; Earthscan: London, UK, 2010; ISBN 978-1-84977-492-5. [Google Scholar]
- King, S.E.; Osmond, D.L.; Smith, J.; Burchell, M.R.; Dukes, M.; Evans, R.O.; Kunickis, S. Effects of riparian buffer vegetation and width: A 12-year longitudinal study. J. Environ. Qual. 2016, 45, 1243–1251. [Google Scholar] [CrossRef]
- Akturk, E.; Post, C.; Mikhailova, E.A. Modeling and monitoring riparian buffer zones using LiDAR data in South Carolina. Environ. Monit. Assess. 2020, 192, 350. [Google Scholar] [CrossRef]
- Strahler, A.N. Quantitative analysis of watershed geomorphology. Eos Trans. Am. Geophys. Union 1957, 38, 913–920. [Google Scholar] [CrossRef]
- Venter, Z.S.; Barton, D.N.; Chakraborty, T.; Simensen, T. Global 10 m Land Use Land Cover Datasets: A Comparison of Dynamic World, World Cover and Esri Land Cover. Remote Sens. 2022, 14, 4101. [Google Scholar] [CrossRef]
- McLeod, A.I. Kendall: Kendall Rank Correlation and Mann-Kendall Trend Test. R Package Version 22. Available online: https://cran.r-project.org/web/packages/Kendall/index.html (accessed on 2 April 2024).
- Hayakawa, A.; Shimizu, M.; Woli, K.P.; Kuramochi, K.; Hatano, R. Evaluating stream water quality through land use analysis in two grassland catchments: Impact of wetlands on stream nitrogen concentration. J. Environ. Qual. 2006, 35, 617–627. [Google Scholar] [CrossRef]
- Fiquepron, J.; Garcia, S.; Stenger, A. Land use impact on water quality: Valuing forest services in terms of the water supply sector. J. Environ. Manag. 2013, 126, 113–121. [Google Scholar] [CrossRef]
- Davies, B.; Biggs, J.; Williams, P.; Thompson, S. Making agricultural landscapes more sustainable for freshwater biodiversity: A case study from southern England. Aquat. Conserv. Mar. Freshw. Ecosyst. 2009, 19, 439–447. [Google Scholar] [CrossRef]
- Laegreid, M.; Bockman, O.C.; Kaarstad, O. Agriculture Fertilizers and the Environment; CABI Publishing in Association with Norsk Hydro ASA: New York, NY, USA, 1999; pp. 5–13. [Google Scholar]
- Sanchez, A.P. Properties and Management of Soils in the Tropics; Cambridge University Press: New York, NY, USA, 2019. [Google Scholar]
- Johnson, C.; Albrecht, G. Nitrogen basics–the nitrogen cycle. Agron. Fact Sheet Ser. Fact Sheet 2005, 2, 1–2. [Google Scholar]
- García-Garizábal, I.; Causapé, J.; Abrahão, R. Nitrate contamination and its relationship with flood irrigation management. J. Hydrol. 2012, 442, 15–22. [Google Scholar] [CrossRef]
- da Silva, R.L.; Leite, M.F.A.; Muniz, F.H.; de Souza, L.A.G.; de Moraes, F.H.R.; Gehring, C. Degradation impacts on riparian forests of the lower Mearim river, eastern periphery of Amazonia. For. Ecol. Manag. 2017, 402, 92–101. [Google Scholar] [CrossRef]
- Bourgeois, B.; Vanasse, A.; Rivest, D.; Poulin, M. Establishment success of trees planted in riparian buffer zones along an agricultural intensification gradient. Agric. Ecosyst. Environ. 2016, 222, 60–66. [Google Scholar] [CrossRef]
- Göçoğlu, V.; Göksu, S. How do industrialization and agricultural land use affect urban population in Turkey? Policy implications in the context of SDGs. J. Policy Model. 2024, 46, 198–211. [Google Scholar] [CrossRef]
- World Health Organization. Global action plan on physical activity 2018–2030: More active people for a healthier world. J. Policy Model. 2018, 113, 113. [Google Scholar]

Disclaimer/Publisher’s Note: The statements, opinions and data contained in all publications are solely those of the individual author(s) and contributor(s) and not of MDPI and/or the editor(s). MDPI and/or the editor(s) disclaim responsibility for any injury to people or property resulting from any ideas, methods, instructions or products referred to in the content. |
© 2024 by the authors. Licensee MDPI, Basel, Switzerland. This article is an open access article distributed under the terms and conditions of the Creative Commons Attribution (CC BY) license (https://creativecommons.org/licenses/by/4.0/).