Article

Detection of Mulberry Leaf Diseases in Natural Environments Based on Improved YOLOv8

by
Ming Zhang
1,
Chang Yuan
2,
Qinghua Liu
1,*,
Hongrui Liu
2,
Xiulin Qiu
1 and
Mengdi Zhao
3
1
College of Automation, Jiangsu University of Science and Technology, Zhenjiang 212003, China
2
College of Computer, Jiangsu University of Science and Technology, Zhenjiang 212003, China
3
Department of Materials Science and Engineering, Suzhou University of Science and Technology, Suzhou 215011, China
*
Author to whom correspondence should be addressed.
Forests 2024, 15(7), 1188; https://doi.org/10.3390/f15071188
Submission received: 13 June 2024 / Revised: 30 June 2024 / Accepted: 5 July 2024 / Published: 9 July 2024
(This article belongs to the Special Issue Artificial Intelligence and Machine Learning Applications in Forestry)

Abstract

:
Mulberry leaves, when infected by pathogens, can suffer significant yield loss or even death if early disease detection and timely spraying are not performed. To enhance the detection performance of mulberry leaf diseases in natural environments and to precisely locate early small lesions, we propose a high-precision, high-efficiency disease detection algorithm named YOLOv8-RFMD. Based on improvements to You Only Look Once version 8 (YOLOv8), we first proposed the Multi-Dimension Feature Attention (MDFA) module, which integrates important features at the pixel-level, spatial, and channel dimensions. Building on this, we designed the RFMD Module, which consists of the Conv-BatchNomalization-SiLU (CBS) module, Receptive-Field Coordinated Attention (RFCA) Conv, and MDFA, replacing the Bottleneck in the model’s Residual block. We then employed the ADown down-sampling structure to reduce the model size and computational complexity. Finally, to improve the detection precision of small lesion features, we replaced the Complete Intersection over Union (CIOU) loss function with the Normalized Wasserstein Distance (NWD) loss function. Results show that the YOLOv8-RFMD model achieved a mAP50 of 94.3% and a mAP50:95 of 67.8% on experimental data, representing increases of 2.9% and 4.3%, respectively, compared to the original model. The model size was reduced by 0.53 MB to just 5.45 MB, and the GFLOPs were reduced by 0.3 to only 7.8. YOLOv8-RFMD has displayed great potential for application in real-world mulberry leaf disease detection systems and automatic spraying operations.

1. Introduction

The mulberry tree, belonging to the Moraceae family and Morus genus, stands as one of the globe’s foremost economically significant crops. It is widely distributed across all continents and is considered highly suitable for sustainable development [1]. Cultivating mulberry trees not only enhances environmental quality but also generates significant economic value across various industries, including sericulture, pharmaceuticals, food, and cosmetics. In China, the cultivation of mulberry trees dates back to ancient times. As early as the Shang Dynasty (1600–1046 BC), mulberry trees were widely planted and utilized. The primary reason is that mulberry leaves are the main food source for silkworms, and silk production held considerable economic and cultural significance in ancient China. Therefore, the cultivation of mulberry trees was closely linked to the development of sericulture, as the quality and quantity of mulberry leaves directly influence the cocooning rate of silkworms [2]. As sericulture technology and trade advanced, the cultivation areas and uses of mulberry trees expanded progressively. Concurrently, with advancements in forestry and plant pathology, various diseases affecting mulberry leaves have also gained increasing recognition.
Mulberry leaf diseases are widespread globally, with mulberry brown spot, powdery mildew, and sooty leaf spot being the most common. Therefore, this study focuses on these three diseases. During the growth of mulberry leaves, they are inevitably susceptible to these pathogens, which can cause diseases. If these diseases are not detected and controlled early, the infected leaves can quickly spread the pathogens to healthy leaves, leading to a significant reduction in yield or even the death of the mulberry plants, causing substantial economic losses to the sericulture industry [3]. Currently, the detection and treatment of mulberry leaf diseases are mainly performed manually. This manual process is time-consuming and labor-intensive, and subjective judgment can lead to incorrect pesticide application. Therefore, promoting intelligent and automated pesticide application is essential to enhance the management efficiency of mulberry plantations. The primary task for achieving intelligent pesticide application is to efficiently and precisely detect and locate diseased mulberry leaves, which is crucial for ensuring the yield and quality of mulberry leaves.
Conventional approaches to monitor the physiological status and behavior of animals, such as collar tracking, acoustic monitoring, and sampling techniques, have been widely employed in zoological studies (Andreychev [4], 2018; Xie and Yu [5], 2023). However, not all of these are suitable for studying physiological states and identifying plant diseases, prompting scientists to continually seek effective remote sensing methods in botanical research. As computer technology continues to advance, more scholars are increasingly applying deep learning techniques to rapidly advance the identification and detection of crop diseases [6]. Although there is limited research on mulberry leaf diseases in the literature, there have been significant achievements in other crop fields. Javidan et al. [7] used a novel image processing algorithm and multi-class support vector machine (SVM) to diagnose and classify grape leaf diseases (black measles, black rot, and leaf blight). The K-means clustering was used to automatically separate disease symptom areas from healthy parts of the leaves, achieving an precision of 98.97%. Sladojevic et al. [8] developed a new method for crop image-based pest and disease recognition using the AlexNet [9] convolutional network, achieving a precision of 91% to 98% in single-category tests and an overall model precision of 96.3%. Rangarajan et al. [10] trained tomato disease images using improved AlexNet and Visual Geometry Group (VGG16) [11] models, but the model recognition precision was not satisfactory. Nahiduzzaman et al. [12] proposed an explainable AI (XAI) framework and developed a unique lightweight parallel depthwise separable convolutional neural network (CNN) model, PDS-CNN, to classify mulberry leaf diseases using a newly established mulberry leaf dataset. The results showed that the XAI-based PDS-CNN model had higher classification precision, fewer parameters, fewer layers, and a smaller overall size compared to other transfer learning models. Waheed et al. [13] proposed an optimized DenseNet model to better identify and classify maize leaf diseases that are indistinguishable at the seedling stage to monitor crop health. The optimized model achieved a precision of 98.06% and required significantly fewer parameters and computation time than existing CNNs.
In the actual cultivation environment of mulberry leaves, images for the automated detection of mulberry leaf diseases often contain different types of diseases, and partial occlusion between leaves can occur. Based on this, compared to image classification algorithms, object detection algorithms are more suitable for detecting multiple targets in images and determining the size and location of actual disease features. Wen et al. [14] proposed an algorithm that combines a multi-scale residual network with Squeeze-and-excitation Net (SENet) for identifying mulberry leaf diseases. To enhance the network’s ability to capture extensive information, multi-scale convolution was employed in place of traditional single-scale convolution, alongside the integration of SENet to improve key feature extraction. The results showed a recognition precision of 98.72%, with a recall rate and F1 score of 98.73% and 98.72%, respectively. Xue et al. [15] proposed an improved You Only Look Once (YOLO) v5-based model for detecting tea leaf diseases and pests, named YOLO-Tea, in natural environments. Compared to models like YOLOv5s, (faster region-based convolutional neural network) Faster R-CNN [16], and Single Shot Multibox Detector (SSD) [17], YOLO-Tea improved by 0.3% to 15.0% on all test data. Li et al. [18] improved the informative content of feature maps and minimized feature information loss by incorporating the Coordinated Attention (CA) module [19] and the spatial pyramid pooling (SSP) model into YOLOv5s, thereby enhancing the precision of maize leaf disease detection. Nie et al. [20] proposed a disease detection network based on Faster R-CNN and multi-task learning for precisely detecting strawberry wilt disease. The strawberry wilt disease detection network (SVWDN) can automatically classify petioles and young leaves while determining whether strawberries are infected with downy mildew, achieving an precision of 99.95% in strawberry wilt disease detection. Dwived et al. [21] proposed a grape leaf disease detection network (GLDDN) that utilizes dual attention modules for feature evaluation, detection, and classification. Experiments on a benchmark dataset confirmed that GLDDN is more suitable than existing methods.
Although the aforementioned research has significantly advanced crop disease recognition and detection, some challenges remain unresolved. First, under natural conditions, the complexity of detection environments often leads to models with poor detection and localization precision, resulting in missed detections and false positives. Second, there is limited research on detecting minute disease features that may not be apparent in early stages of leaf diseases, yet are critical for timely prevention. Finally, while model fusion methods ensure a certain detection precision, they increase model size and computational load, hindering deployment on mobile devices. After comparing numerous studies and deep learning algorithms, this study adopted the YOLOv8 algorithm. Compared to earlier YOLO versions [22], YOLOv8 is a more stable detection model with advanced training methods that shorten training times and improve convergence speed, while maintaining high detection precision and enhancing inference speed. However, despite the widespread use of YOLO algorithms in various leaf disease detections, their application in detecting mulberry leaf diseases has been limited.
Given these current challenges, this study aims to develop a more efficient and precise model for detecting mulberry leaf diseases in natural environments. We hypothesize that an improved YOLOv8 algorithm, incorporating superior feature extraction modules, down-sampling structures, and loss functions, can enhance detection precision and efficiency while being lightweight enough to meet the deployment requirements of mobile devices.
The primary contributions of this study include the following: (1) We proposed the Multi-Dimension Feature Attention (MDFA) module, integrating important features at pixel-level, spatial, and channel dimensions. (2) We designed the RFMD Module, which includes the Conv-BatchNormalization-SiLU (CBS) module, Receptive-Field Coordinated Attention (RFCA Conv), and MDFA, replacing the Bottleneck in the Residual block of the original model. (3) We introduced the ADown down-sampling structure to reduce model size and computational load while maintaining precision. (4) We substituted the Complete Intersection over Union (CIoU) loss function with the Normalized Wasserstein Distance (NWD) loss function to improve the detection of small disease features.
By addressing these research objectives, this study aims to contribute to the field of intelligent and automated detection of mulberry leaf diseases, providing a new approach for more precise and efficient disease management in mulberry plantations.

2. Materials and Methods

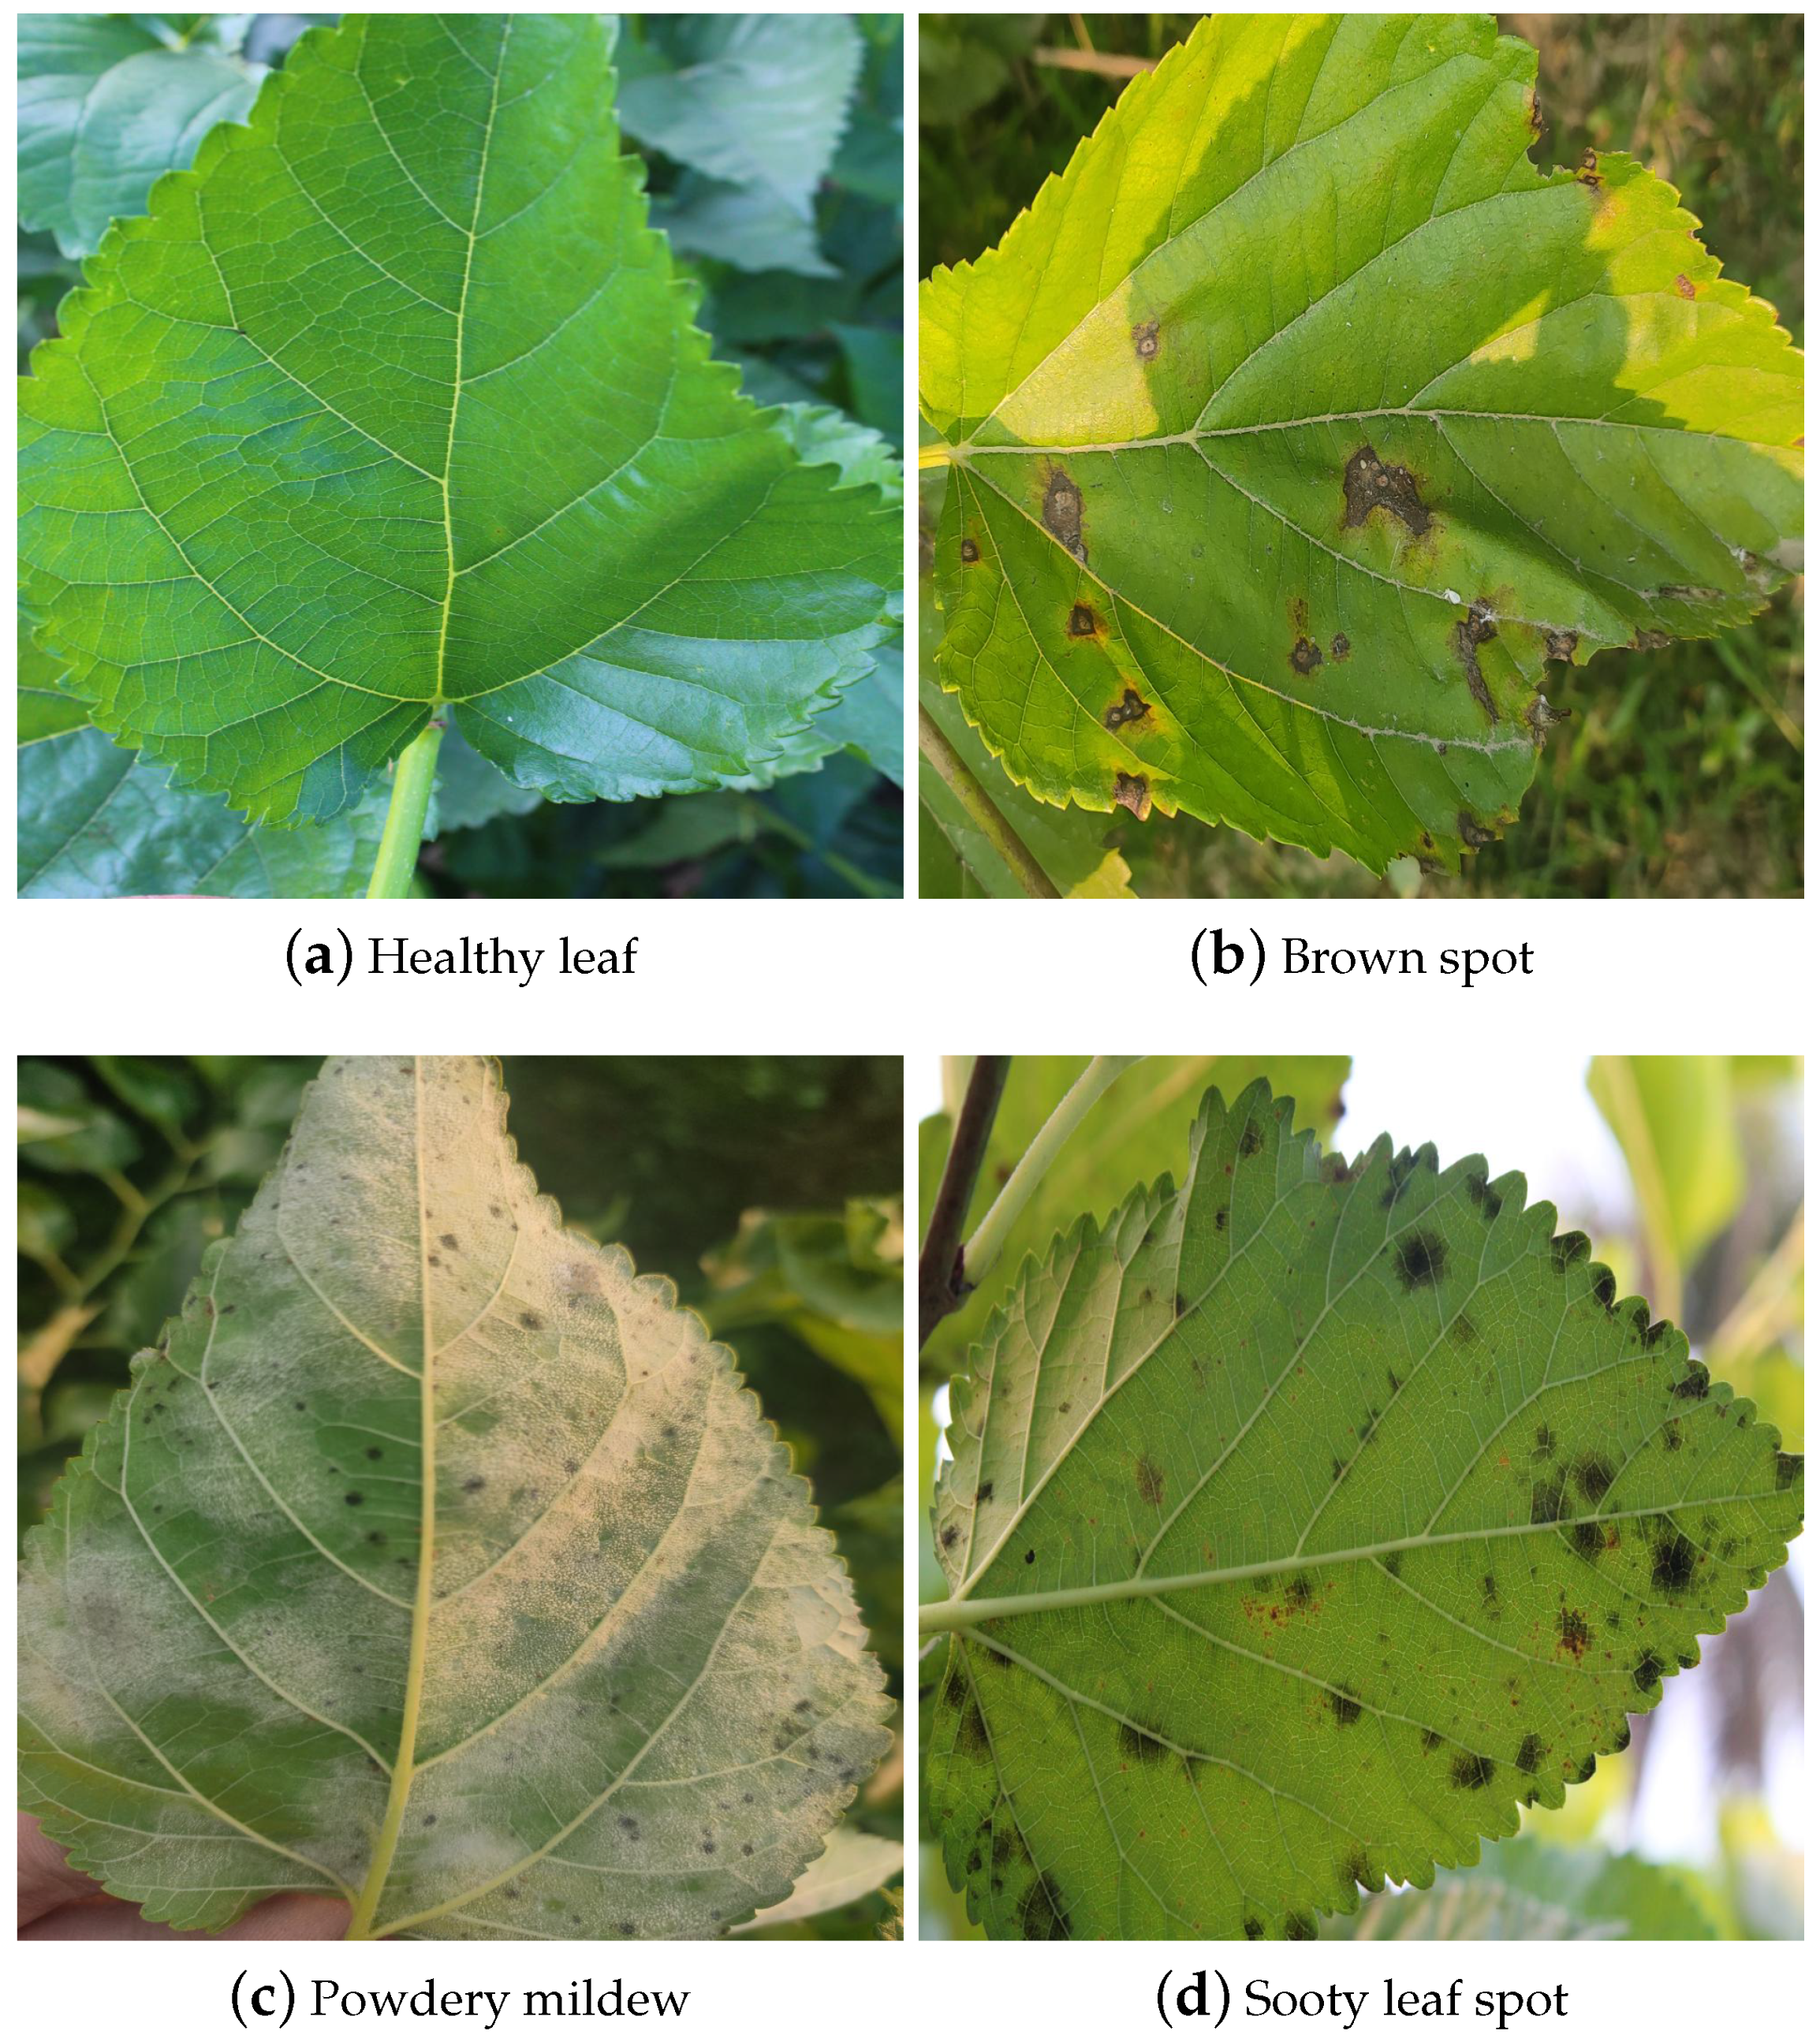
2.1. Dataset Construction

The dataset for this study was sourced from the Kaggle website, comprising 871 high-quality images of both diseased and healthy leaves. These images were captured in mulberry gardens in Rajshahi city, Bangladesh, using a high-resolution DSLR camera. The dataset comprises images depicting leaves affected by brown spot, powdery mildew, sooty leaf spot, as well as healthy leaves. The photographs were taken under various conditions, including sunny and cloudy weather, front and back lighting, different angles (upward and downward), and both the front and back of the leaves. This variety was intended to maximize the diversity of the images. Table 1 describes the main characteristics of the diseases involved in this study. To ensure relative uniformity across categories, unsuitable images were removed, resulting in a dataset of 600 images. Approximately half of these images contain two or more diseases. The images of healthy mulberry leaves and diseased mulberry leaves are shown in Figure 1.
To prevent overfitting in the neural network and enhance the robustness of the samples as well as the generalization ability of the network, the original images were augmented using methods such as flipping, adding noise, and adjusting brightness. A total of 3000 images were generated through these augmentations. The augmented images were subsequently annotated manually using the LabelImg tool to capture the category and spatial details of the target diseases within the images. The annotated information was saved in txt files, completing the construction of the mulberry leaf disease dataset. The dataset was randomly divided into training, validation, and test sets in a ratio of 7:2:1, with 2100 images in the training set, 600 images in the validation set, and 300 images in the test set.

2.2. YOLOv8 Algorithm

The YOLOv8 algorithm is a popular detection algorithm that is divided into four parts: input, backbone network, neck network, and head network. Depending on the application scenario, it has different models including n, s, l, m, and x. For real-time performance and a compact model size, this study adopted the YOLOv8n version, noted for its minimal parameter count and rapid detection speed. Compared to previous generations of YOLO algorithms, the YOLOv8 algorithm’s backbone network adopts the Cross Stage Partial (CSP) Darknet53 [23] architecture, incorporating CBS, Faster Implementation of CSP Bottleneck with 2 convolutions (C2f), and SPPF (spatial pyramid pooling fusion) structures. The C2f structure is the primary module for learning residual features, combining the CSP Bottleneck with 3 convolutions (C3) structure from YOLOv5 and the Efficient Layer Aggregation Network (ELAN) structure from YOLOv7 [24], providing richer gradient flow information. The neck network uses the path aggregation network [25] (PAN) and the feature pyramid network [26] (FPN) structures to achieve the fusion and enhancement of features of different sizes, providing richer information for the head network to detect. The head network utilizes a decoupled structure that separates the detection and classification processes. The detection head utilizes Bbox Loss, which combines CIOU loss [27] and distribution focal loss (DF Loss) for loss measurement, while the classification head applies binary cross-entropy (BCE) loss. This approach collectively enhances the model’s accuracy in predicting bounding boxes. Although the original YOLOv8 algorithm can achieve good detection precision, the presence of small objects, varied scales, and similar features in images can affect detection precision. Additionally, the original model’s computational complexity and model size need to be reduced, indicating that YOLOv8 still requires improvements.

2.3. Improved YOLOv8 Algorithm

This study aims to improve the original YOLOv8 algorithm. The improved network structure is shown in Figure 2, with specific improvements detailed as follows:
(1)
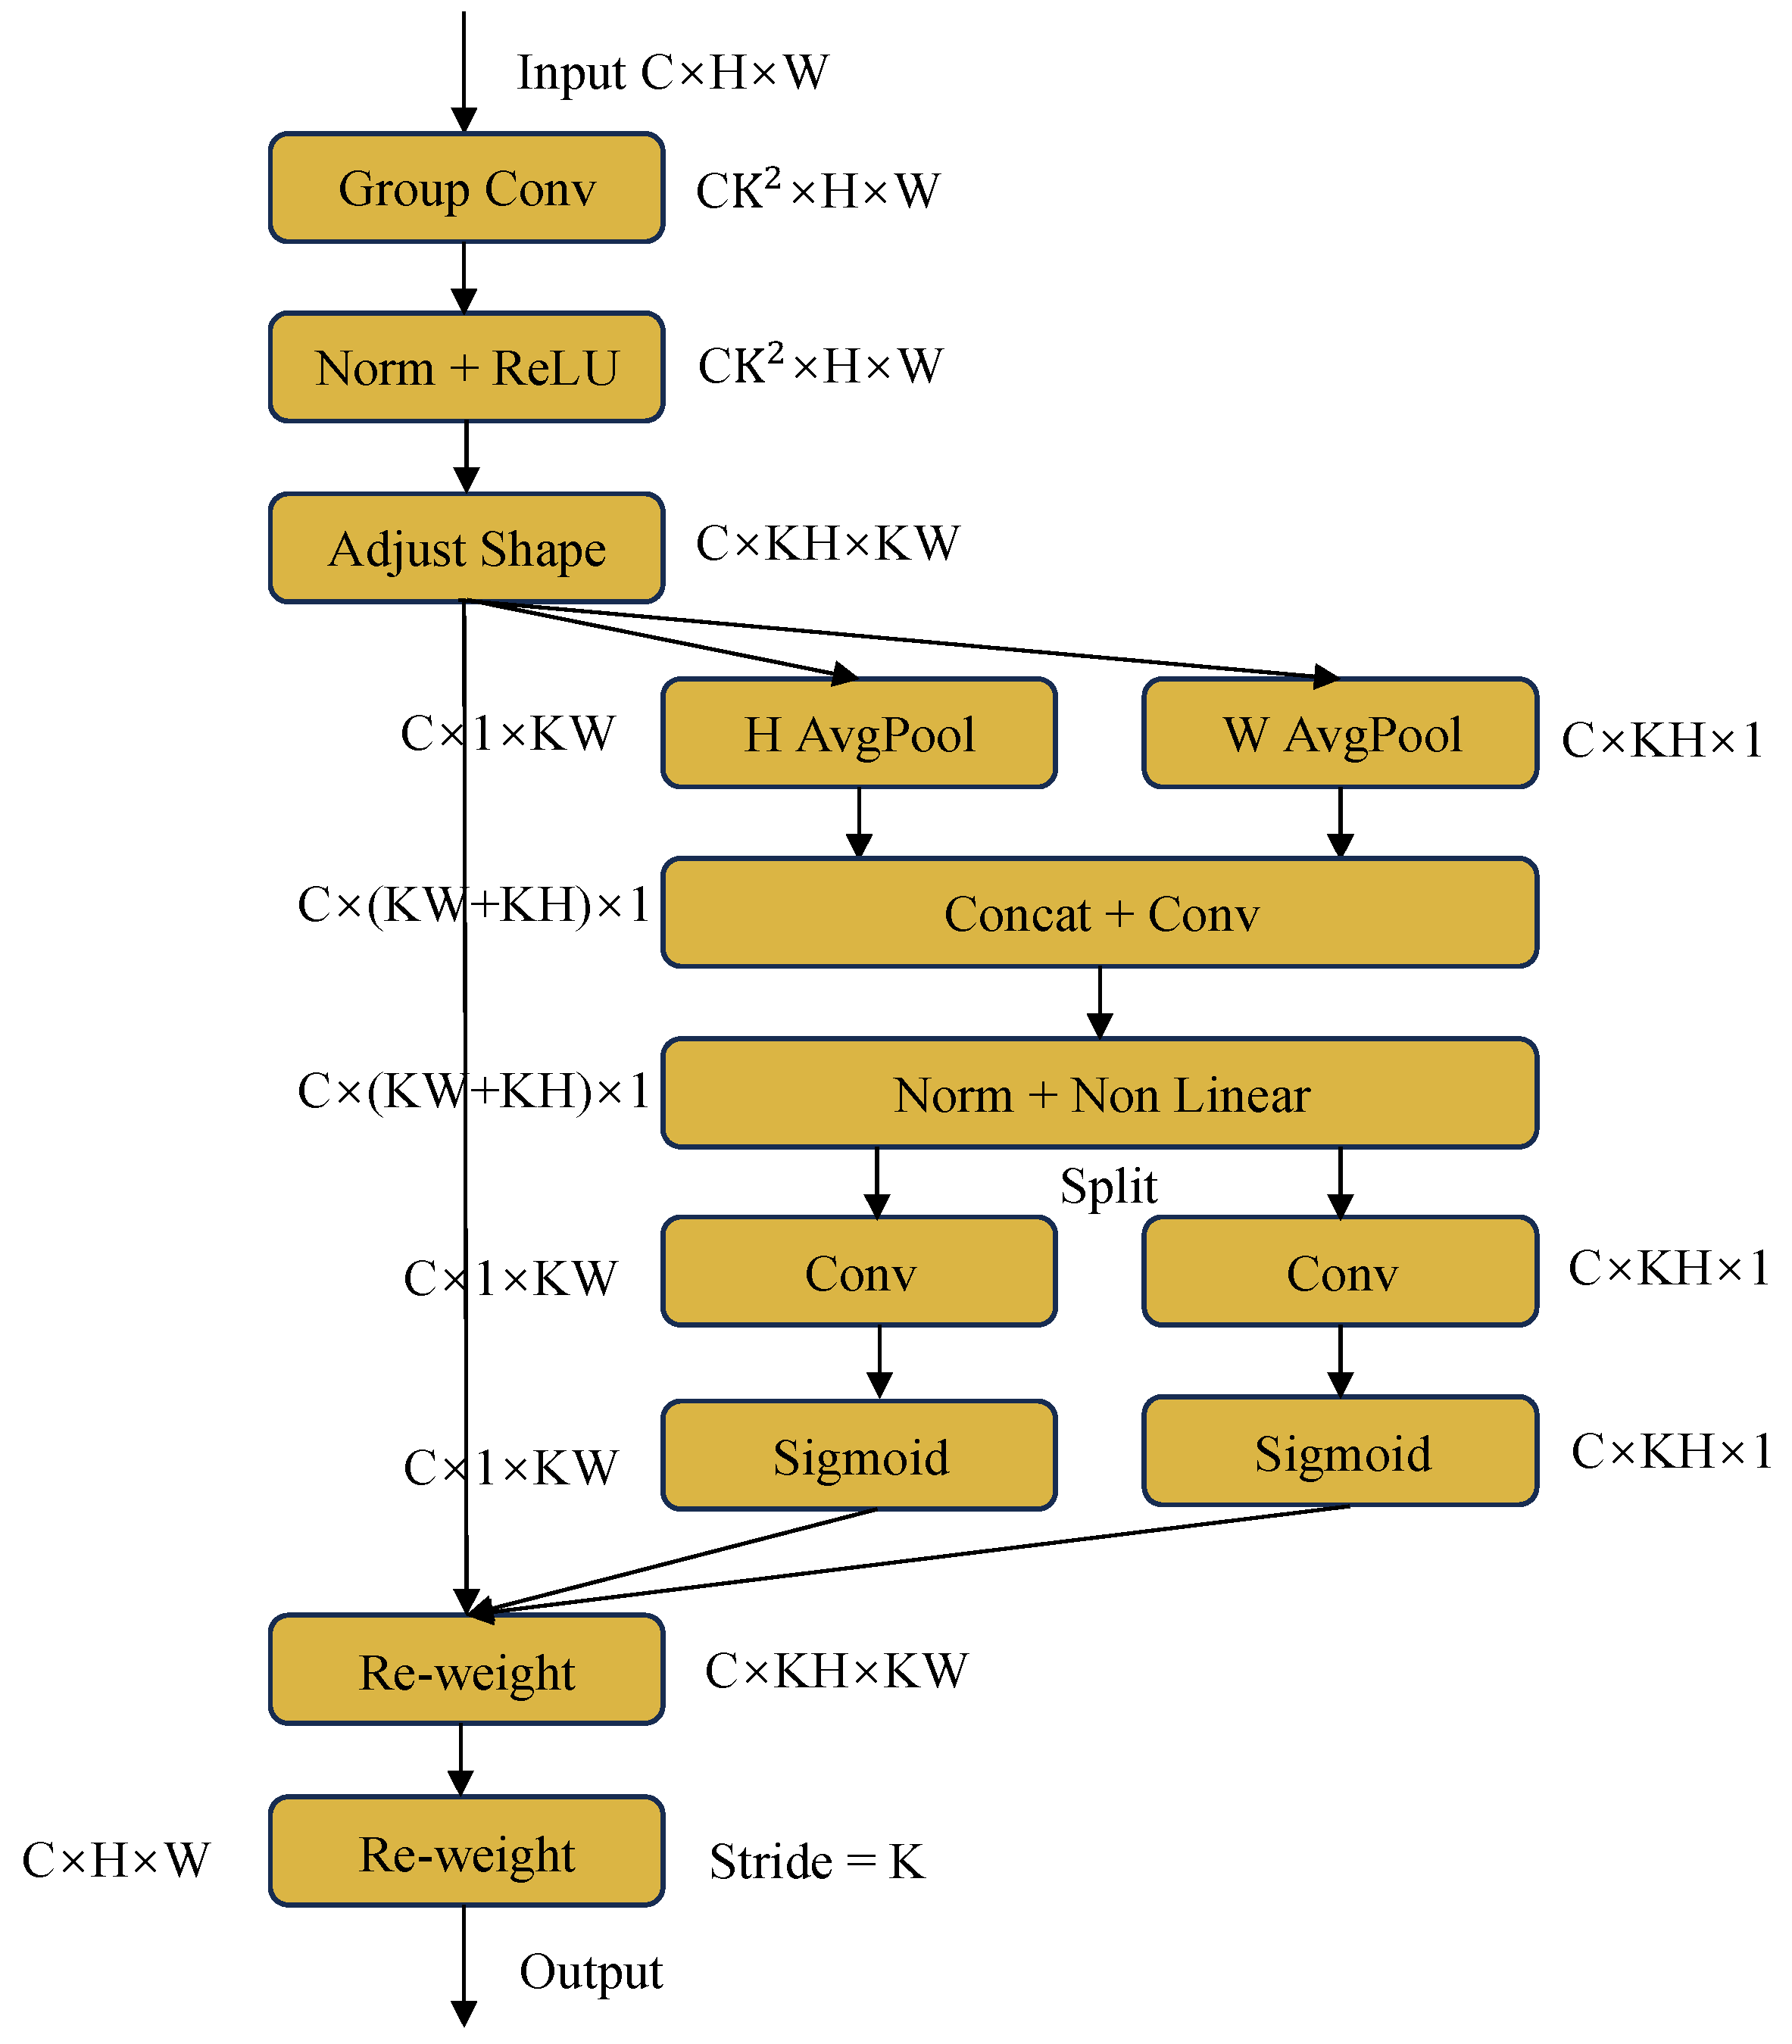
The Bottleneck in the C2f module is replaced with the RFMD Module, which consists of the CBS module, RFCA Conv, and MDFA. The RFMD Module uses the MDFA module proposed in this paper, which focuses on features from the pixel-level dimension, spatial dimension, and channel dimension. This enhances the extraction of effective feature information from channels while integrating both global and local spatial information. Additionally, the RFCA Conv not only focuses on important local information at each receptive field level but also enables the model to more precisely locate defect positions during detection, addressing the parameter sharing issue inherent in traditional convolutions.
(2)
The CBS modules in P3, P4, and P5 of the backbone network, as well as the CBS modules in the neck network, are replaced with the ADown down-sampling structure. This structure utilizes a variety of down-sampling methods to extract features, thereby preventing the loss of critical information while simultaneously reducing both computational complexity and model size.
(3)
The original YOLOv8’s CIOU loss function has been replaced with NWD loss, enhancing the detection precision of small targets.

2.3.1. MDFA Attention

In the detection of mulberry leaf diseases, using the original YOLOv8 algorithm often results in missed and false detections, particularly in the early stages of diseases such as powdery mildew and sooty leaf spot. This is because the algorithm fails to filter out important feature information during feature extraction. To more precisely identify disease spots, this study proposes the MDFA module. Common channel attention modules (e.g., SE [28] or Efficient Channel Attention (ECA) [29]) only consider relationships between channels and ignore spatial dimension information. If a channel has a low weight but its spatial information is significant, this important feature information will be lost. Additionally, common spatial attention modules (e.g., Convolutional Block Attention Module (CBAM) [30]) perform redundant operations in spatial dimension attention, as the weight distribution of specific local areas is generally uniform. The proposed MDFA simultaneously considers information from the pixel-level dimension, channel dimension, and spatial dimension. Initially, the input features are preprocessed through an energy function [31], which assigns a 3D weight to each feature point to evaluate its importance and highlight key feature points. The preprocessed feature map is then divided into multiple patches to further incorporate channel and spatial dimension information. One-dimensional convolution is employed to decrease parameter complexity and computational complexity. This approach allows the model to capture channel information, spatial information, local information, and global information simultaneously, achieving multi-dimensional feature attention. The specific structure is illustrated in Figure 3.
The input feature vector for MDFA is first preprocessed through an energy function; the energy function is represented by Equation (1):
e t = 4 ( σ ^ 2 + λ ) ( t μ ^ ) 2 + 2 σ ^ 2 + 2 λ
Here, μ ^ = 1 M i = 1 M x i , σ ^ 2 = 1 M i = 1 M ( x i μ ^ ) 2 , and t and x i represent the target feature point and other feature points within a single channel of the input features, respectively. i is the index in the spatial dimension, and M = H × W denotes the total number of feature points in that channel. A lower energy value e t indicates a greater contrast between the feature point t and its surrounding points, signifying higher importance. Thus, the importance of each feature point can be quantified as 1/ e t .
After the energy function preprocessing, the feature map enters the pooling section, which consists of two steps: local average pooling and global average pooling. The input is converted into a vector 1 × C × ks × ks to extract local spatial information through local pooling. Based on the initial stage, the input is transformed into a one-dimensional vector using three branches. The first branch incorporates global information, while the second branch focuses on local spatial details. After one-dimensional convolution, these are restored to the size of C × ks × ks through unpooling and reshaping, and the information from the two branches is added and unpooled back to the original resolution. The third branch, after one-dimensional convolution, is reshaped back to the size of C × H × W . Finally, the information from the three branches is fused, achieving the goal of multi-dimensional feature attention. In the diagram, Conv1d represents one-dimensional convolution, where the number of channels C is proportional to the kernel size k. This implies that, in capturing local cross-channel interaction information, only the relationship between each channel and its k adjacent channels is considered. The formula for selecting k is as follows:
k = φ ( C ) = log 2 ( C ) γ + b γ o d d
Here, k is the kernel size, and C denotes the number of channels. Both b and γ are hyperparameters with a default value set to 2. k is chosen to be an odd number; if k is even, 1 is added to make it odd.

2.3.2. RFCA Conv in the RFMD Module

In natural settings, mulberry leaves often grow densely, and the pathological features usually vary in size. The original YOLOv8 uses standard convolution operations, which typically apply fixed weights to input data at all locations. While this method simplifies the model’s parameters, it overlooks the uniqueness of local areas in the image and fails to precisely locate disease features. Therefore, using standard convolution has certain limitations. To address this issue, this study employs RFCA Conv [32] in the RFMD Module of the RFMD-C2f module. RFCA Conv combines Receptive-Field Attention (RFA) and CA module. Receptive-Field Attention calculates attention at the receptive field level for each convolution operation, adjusting the weights of feature processing for each local area and weighting the features within the receptive field based on the calculation results. This highlights important features and overcomes the performance limitations caused by parameter sharing in traditional convolution, making it more effective for complex or fine-grained visual tasks. The CA module simultaneously calculates attention in both channel and spatial dimensions, better capturing dependencies between features. By coordinating spatial and channel attention, it comprehensively integrates important feature information and enhances the feature representation ability of mobile networks. The structure is shown in Figure 4.
RFCA Conv processes each input channel individually with grouped convolution, expanding each channel spatially for receptive field expansion, resulting in an output feature map of size C K 2 × H × W . Batch normalization and ReLU activation enhance nonlinearity. The dimensions adjust to C × K H × K W for independent feature processing within each receptive field. RFCA Conv captures attention in height and width dimensions, encoding precise positional information. Global average pooling along height and width, followed by concatenation and 1 × 1 convolution, produces an intermediate feature map f of size C × ( K H + K W ) × 1 , integrating global information. f is split along vertical and horizontal directions, processed with 1 × 1 convolution, and Sigmoid activation to obtain attention maps in height and width. These maps reweight the original expanded feature map via element-wise multiplication, highlighting important features. Finally, a convolution layer with stride K produces a final output size C × H × W , reducing parameter sharing issues and focusing on receptive field-specific outputs.

2.3.3. Lightweight Down-Sampling Structure ADown

In CNN-based object detection methods, down-sampling images is a key operation to reduce data dimensions and complexity while preserving important feature information. The original YOLOv8 employs 3 × 3 convolution kernels with a stride of 2, batch normalization, and SiLU activation functions for down-sampling. However, in real-world applications, devices often have limited computational power, which can slow down the model’s performance. This study replaces the original down-sampling method with the lightweight down-sampling structure ADown [33]. ADown combines various down-sampling techniques, including average pooling, max pooling, and convolution operations, to extract and retain critical information from different perspectives. This approach avoids information loss that may result from a single down-sampling strategy. By splitting the input feature map along the channel dimension and processing each part separately, ADown reduces the spatial size of feature maps while extracting richer feature information through different paths. This structure helps improve the model’s learning ability while reducing computational complexity. The specific structure is depicted in Figure 5.
First, ADown applies average pooling with a 2 × 2 kernel and a stride of 1, preserving background information while reducing feature map size. The output is then split along the channel dimension into two parts, x 1 and x 2 . A 3 × 3 convolution with a stride of 2 and padding of 1 is applied to x 1 , capturing spatial information and achieving further down-sampling. Meanwhile, x 2 undergoes max pooling with a 3 × 3 kernel, a stride of 2, and padding of 1, followed by a 1 × 1 convolution to adjust feature channels. The Concat method merges x 1 and x 2 along the channel dimension, forming the final output. ADown effectively combines multiple down-sampling and feature processing strategies, reducing computational complexity while enhancing feature extraction and model generalization performance.

2.3.4. Normalized Wasserstein Distance Loss Function

YOLOv8 originally utilizes CIOU as its coordinate loss function, which considers center point distance, overlap, and aspect ratio consistency. However, traditional evaluation metrics based on IoU are highly sensitive to localization errors, especially for small targets, leading to performance degradation. To address this issue, we employed the NWD [34] loss function to enhance the detection precision of small targets, abandoning the original loss function.
NWD models bounding boxes as 2D Gaussian distributions and uses the Normalized Wasserstein Distance to compute their similarity. This metric can measure similarity even with minimal or no overlap, providing scale invariance and smoother handling of positional deviations. For the bounding box R = ( c x , c y , w , h ) , its 2D Gaussian distribution’s mean μ is at the center ( c x , c y ) , and the covariance matrix is determined by width w and height h, modeled as N ( μ , ) .
The Wasserstein Distance between two Gaussian distributions N ( μ A , A ) and N ( μ B , B ) is
W 2 2 ( N A , N B ) = μ A μ B 2 2 + T r ( A + B 2 ( A 1 / 2 B A 1 / 2 ) 1 / 2 )
Here, μ A μ B 2 2 is the Euclidean distance between centers, and T r is the trace of the covariance matrices, reflecting shape differences.
To convert the Wasserstein Distance into a similarity measure, we define the Normalized Wasserstein Distance (NWD):
N W D ( N A , N B ) = exp ( W 2 2 ( N A , N B ) C )
where C is a constant to normalize NWD values between 0 and 1, indicating higher similarity for values closer to 1. The NWD loss function is then defined as
L N W D = 1 N W D ( N p , N g )
where N p and N g are the Gaussian models of the predicted and ground truth bounding boxes. The NWD loss tackles the problem where traditional IoU loss does not yield gradients for optimizing the network in scenarios without overlap or complete containment.

2.4. Training Environment and Evaluation Metrics

2.4.1. Training Environment

The key parameters of the training platform utilized in this experiment were as follows: a 1TB solid-state drive (Yangtze Memory Technology Corp, Wuhan, China), Nvidia GeForce RTX 3060Ti with 8GB of memory (Colorful Group, Shenzhen, China), an Intel Core i5-12600KF CPU with a clock speed of 3.7 GHz (Intel Corporation, Chengdu, China), 16 GB of memory, CUDA version 12.1, and Python version 3.8. The experiment was conducted on the Windows operating system, using the PyTorch deep learning framework (version 2.1.2) for model building, training, and evaluation.
The training parameters were set as follows: the input image size was 640 × 640, the batch size was 8, multithreading was set to 4, the optimizer used was stochastic gradient descent (SGD), the number of training epochs was set to 400, the initial learning rate was 0.01, the weight decay rate was set to 0.0005, and the momentum was set to 0.937.

2.4.2. Evaluation Metrics

To precisely evaluate the model’s performance, this study used several evaluation metrics: precision (P), recall (R), mean Average Precision (mAP), model size, and Giga Floating-Point Operations per Second (GFLOPs).
The experimental results are measured using the mean Average Precision (mAP, %) to evaluate the precision of model detection. Mean Average Precision is related to the model’s precision (P, %) and recall (R, %), where precision P represents the proportion of samples correctly detected as mulberry leaf diseases out of the samples classified as mulberry leaf diseases by the classifier, as shown in Equation (6):
P = T P T p + F P × 100 %
The recall rate (R) represents the proportion of samples correctly detected as mulberry leaf diseases out of all actual mulberry leaf disease samples, as shown in Equation (7):
R = T P T p + F N × 100 %
The mAP is the mean of the Average Precision (AP), where AP represents the area under the precision–recall (P-R) curve for a specific mulberry leaf disease, as depicted in Equation (8):
m A P = 1 N i = 1 N 0 1 P ( R ) d R × 100 %
We used two metrics for mAP: mAP values at a 50% IoU threshold (mAP50) and mAP values in the 50%–95% IoU threshold range (mAP50:95). Then, we used model size and GFLOPs to measure the model’s complexity. The smaller the model size and GFLOPs, the lower the model’s complexity, making it more suitable for deployment on embedded or other low-computing-power devices.

3. Results

3.1. Performance Comparison of Various Object Detection Models

The improved model YOLOv8-RFMD, based on YOLOv8, was compared with mainstream object detection models including YOLOv8n, YOLOv7-tiny, YOLOv5s, Faster R-CNN, SSD, RetinaNet [35], YOLOV9-S, and RT-DETR-R18 [36] in this study to demonstrate its effectiveness in object detection tasks, as depicted in Table 2. The experiment adopted the same dataset and parameter settings for 400 iterations of training and testing. The table lists the precision, recall rate, mAP50, mAP50:95, model size, and GFLOPs for different models.
The comparative experiment results demonstrate that the detection precision, recall, mAP50, and mAP:95 of the YOLOv8-RFMD model are the highest compared to other networks. The mAP50 of the YOLOv8-RFMD model is 2.9%, 2.1%, 2.7%, 7.9%, 33.6%, 29.8%, 0.6%, and 0.3% higher than the other eight models, respectively, while the mAP50:95 is 4.3%, 11.7%, 6.0%, 8.3%, 24.3%, 21.5%, 0.4%, and 0.3% higher than the other eight models, respectively. The improved model in this paper is relatively small, with a size of only 5.45 MB, which is 0.53 MB smaller than the YOLOv8n model, making it the smallest model among all other models except YOLOv5s. The computational resources required for the YOLOv8-RFMD model are also lower, with GFLOPs of only 7.8, which is 0.3 less than the already lower YOLOv8n model, making it suitable for deployment on embedded mobile devices. The computational efficiency of the YOLOv8-RFMD model far exceeds that of classic models such as RetinaNet, SSD, and Faster R-CNN, with RetinaNet having 19 times more GFLOPs, SSD 20 times more, and Faster R-CNN even 120 times more, which is far from the computing efficiency of the YOLOv8-RFMD model. Considering the real-time detection requirements of mulberry leaf diseases, YOLOv7-tiny is inferior to the YOLOv8-RFMD model in terms of precision, model size, and GFLOPs. Although the model size and GFLOPs of YOLOv5s are slightly lower, its mAP50 and mAP50:95 are much higher than those of YOLOv5s. The single-stage detection network SSD has the lowest detection precision, the Faster R-CNN, which has two-stage detection, has too many GFLOPs and the model size is too large, and, although the RetinaNet network model has high model size and GFLOPs, the detection precision is still very low. SSD, Faster R-CNN, and RetinaNet cannot meet the real-time detection requirements of practical scenarios for disease detection. Compared to the latest object detection models YOLOv9-S and RT-DETR-R18, although the detection accuracy of YOLOv8-RFMD is only 0.3% to 0.6% higher, its model size and GFLOPs are smaller. This indicates that YOLOv9-S and RT-DETR-R18 still require substantial computational resources, which limits their deployment on resource-constrained devices.
In conclusion, the YOLOv8-RFMD model proposed in this research can guarantee relatively high precision for mulberry leaf disease detection while reducing the introduction of more parameters during inference, improving inference speed. The improved YOLOv8 model has a smaller scale and requires less computational resources, making it suitable for deployment on embedded devices to help detect diseases in mulberry orchards and take measures to prevent the further spread of diseases.

3.2. Different Attention Module Detection Performance Comparison

To assess the efficacy of the MDFA module introduced in this paper for improving detection precision, another series of experiments was designed. Five types of attention modules, including Mixed Local Channel Attention (MLCA) [37], Efficient Multi-Scale Attention (EMA) [38], (LSKA) Large Separable Kernel Attention [39], SE, ECA, and CBAM, were, respectively, added or replaced with the MDFA at the same positions in this model, as shown in Table 3 for comparison.
From Table 3, it is evident that the size and GFLOPs of the model remain largely unchanged after the replacement. The main improvement is seen in the detection precision, where the MDFA attention module outperforms the other attention modules in terms of precision, recall, mAP50, and mAP50:95. Compared to the relatively new attention modules MLCA, EMA, and LSKA, the MDFA attention module improves precision by 1.0%, 0.2%, and 0.1%, respectively, recall by 0.9%, 1.7%, and 0.7%, respectively, mAP50 by 0.5%, 0.7%, and 0.4%, respectively, and mAP50:95 by 1.2%, 1.0%, and 0.9%, respectively. Compared to the classic attention modules SE, ECA, and CBAM, MDFA improves mAP50 by 0.5%, 0.7%, and 0.5%, respectively, and mAP50:95 by 1.7%, 1.1%, and 0.8%, respectively. Therefore, the MDFA attention module exhibits superior feature selection capability, surpassing the compared attention modules in identifying pathological features of mulberry leaves, thereby effectively enhancing the model’s precision in disease recognition and detection.
To further validate the superiority of the proposed MDFA attention module for mulberry leaf disease detection, seven types of attention modules were separately visualized using heat maps to demonstrate the focus of different attention modules on mulberry leaf disease features. By applying RandomCAM and renormalizing the images, one can generate a heatmap that focuses on the target within the detection box. The heatmap is used to display the network’s attention to each part of the image, with red areas indicating higher attention and blue areas indicating lower attention.
From Figure 6, it can be observed that MDFA can more precisely locate the positions of different types of diseases and focus on disease areas that closely match the actual shape of the diseases compared to other attention modules.

3.3. The Results before and after Improvement of the YOLOv8 Model

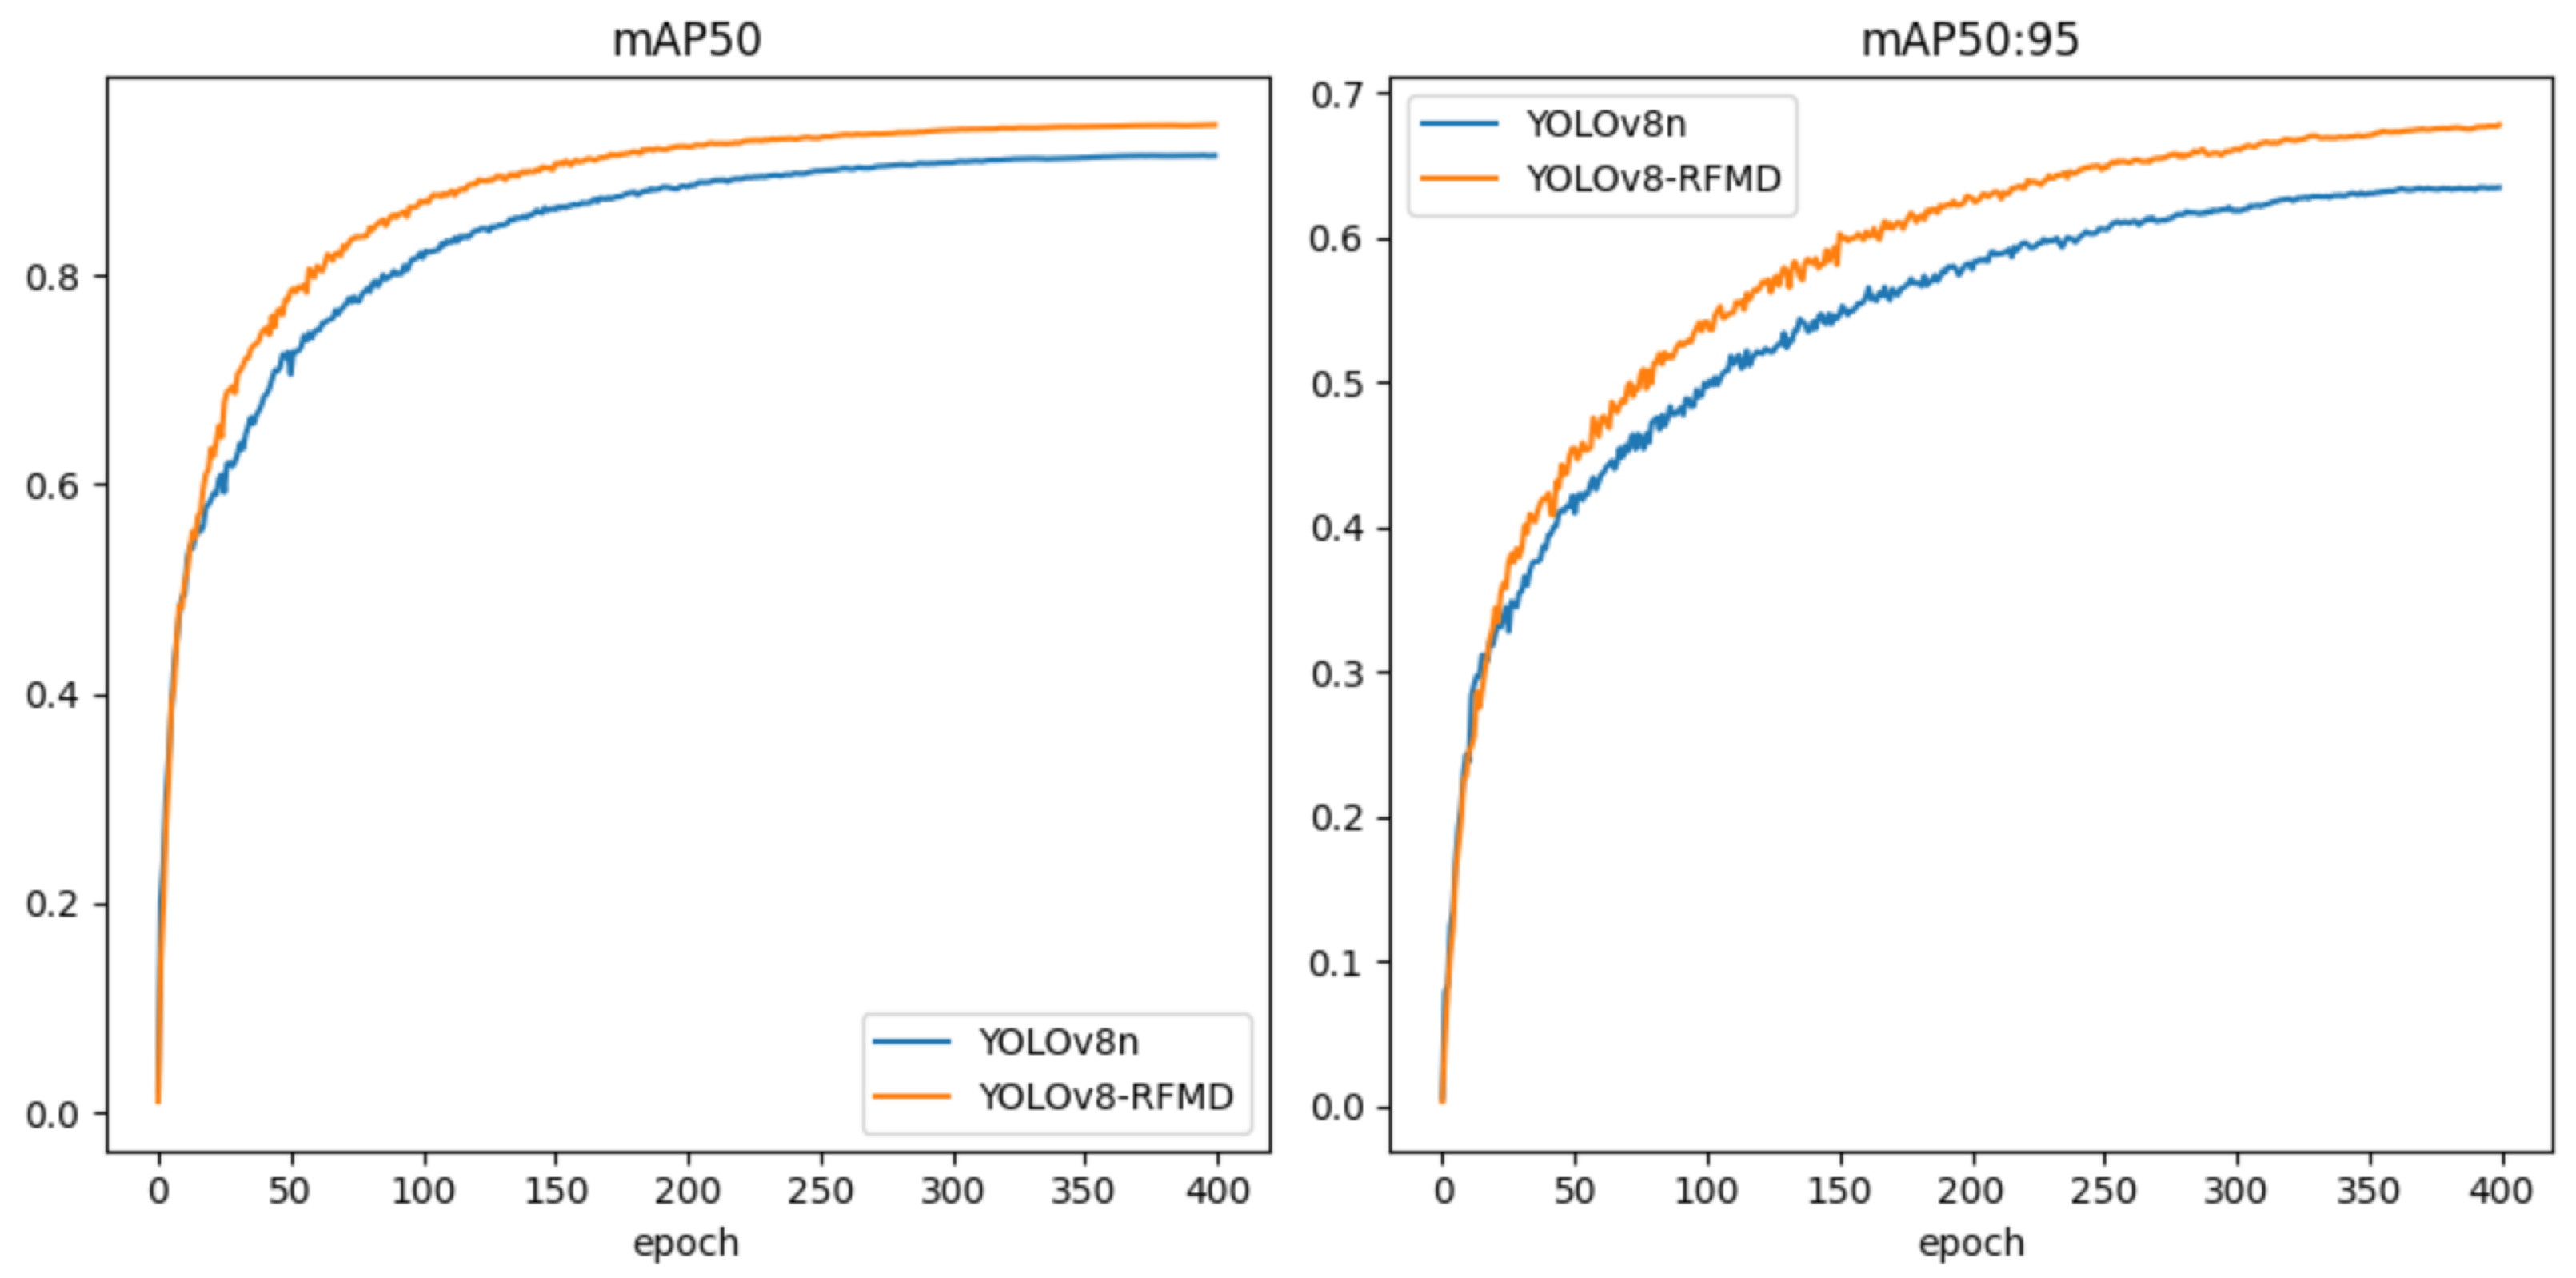
3.3.1. The Comparison of mAP50 and mAP50:95 before and after Improvement

Using the YOLOv8-RFMD algorithm from this experiment and comparing it with the YOLOv8n trained for 400 iterations, the visualization of the mAP is shown in Figure 7. From the graph, it is evident that the mAP of YOLOv8-RFMD is superior to that of the original YOLOv8n. At 200 training iterations, both the mAP50 and mAP50:95 curves continue to rise but tend to plateau.

3.3.2. Confusion Matrix

The confusion matrix is a two-dimensional matrix where the rows represent the predicted classes by the model, and the columns represent the actual labels’ classes. From the confusion matrix in Figure 8, it can be observed that, both before and after improvement, the model achieves the highest precision in detecting healthy mulberry leaves, reaching 99%. After improvement, the detection precision of brown spot disease and powdery mildew disease both exceed 94%. However, the detection precision of sooty leaf spot disease is slightly lower due to variations in lesion size and the dense pathological features typically present. All images were captured in natural environments, resulting in complex backgrounds, which led to some diseases being missed. However, the improved model effectively reduces the probability of missed detections.

3.4. Performance Comparison of Ablation Experiments

To validate the impact of each improvement on model precision and lightweighting and demonstrate the feasibility of the lightweight optimization strategy proposed in this study, ablation experiments were designed. Table 4 presents the results of the ablation experiments.
Experiment 1 showcases the YOLOv8n model in its original, unmodified form. In Experiment 2, we introduced the MDFA module proposed in this paper into the Bottleneck of the original C2f. This module focuses on crucial features across pixel-level, spatial, and channel dimensions. This contributes to precisely focusing on disease areas, resulting in improvements in mAP50 and mAP50:95 with negligible changes in model size. Experiment 3 replaced the second convolution in the Bottleneck of the original C2f with RFCA Conv, which not only focuses on important local information at the receptive field level but also addresses the problem of parameter sharing in traditional convolutions, leading to more precision localization of disease positions. Despite the increase in model size and GFLOPs, the detection precision has been slightly improved. Experiment 4 combined MDFA and RFCA Conv to form the RFMD Module, further improving mAP50 and mAP50:95 without reducing GFLOPs or model size. In the presence of potential interference from complex environmental backgrounds in mulberry orchards, Experiment 4 demonstrates the performance of adding the RFMD Module to enhance disease detection precision. Experiment 5 introduced the ADown down-sampling structure, replacing the CBS modules in the backbone network’s P3, P4, and P5 layers, as well as the CBS module in the neck network. This combines multiple down-sampling methods to avoid the loss of important feature information during down-sampling, significantly reducing model size and GFLOPs while maintaining precision, achieving model lightweighting. In Experiment 6, the CIOU loss function was replaced with the NWD loss function, improving the model’s ability to detect smaller disease features while maintaining model size and GFLOPs, thereby enhancing detection precision.
Experiment 7 incorporated all improvements into YOLOv8, achieving precision and recall rates of 92.6% and 89.5%, respectively, reaching the highest level among all experiments, indicating that the model achieves a high level of recognition and prediction precision for positive samples.The original YOLOv8n model itself has relatively small model size and GFLOPs. YOLOv8-RFMD further reduces model complexity, with reductions in model size and GFLOPs by 0.53 MB and 0.3, respectively, while increasing mAP50 from 91.4% to 94.3% and mAP50:95 from 63.5% to 67.8%. In summary, Experiment 7 achieved a comprehensive improvement in multiple metrics, significantly enhancing detection precision while achieving model lightweighting.

3.5. Different Models Detection Visualization Results Analysis

Based on Table 2, Faster R-CNN, SSD, and RetinaNet models not only have a lower mAP but also have larger model sizes and GFLOPs compared to the YOLO series. They cannot meet the requirements for mulberry leaf disease detection and deployment on mobile embedded devices. Although the latest object detection models YOLOv9-S and RT-DETR-R18 have higher mAPs, their model size and GFLOPs are still relatively large. Therefore, further visual validation of these models was not performed.
To test the actual effectiveness of the YOLOv8-RFMD model in detecting mulberry leaf diseases, the pre-trained YOLOv8-RFMD, YOLOv8n, YOLOv7-tiny, and YOLOv5s models are used to detect complex diseases on mulberry leaves. Specifically, they are tested for scenarios where brown spot disease and powdery mildew disease coexist, where sooty leaf spot disease and powdery mildew disease coexist, and where all three diseases (sooty leaf spot, brown spot, and powdery mildew) coexist. In the visualizations, blue bounding boxes represent sooty leaf spot disease, red bounding boxes represent brown spot disease, and orange bounding boxes represent powdery mildew disease.
Figure 9 shows the detection of mulberry leaves with both brown spot and powdery mildew by four models. As can be seen from Figure 9a, YOLOv8-RFMD has learned and detected various disease characteristics well, while YOLOv8n has several missed detections, one false detection, and one case of overlapping detection boxes. YOLOv7-tiny has false detections and missed detections, and YOLOv5s has several missed detections and overlapping boxes. This indicates that YOLOv8-RFMD has learned the subtle features of several diseases well, and can still precisely identify them, even under complex detection conditions, significantly reducing the occurrences of missed and false detections.
Figure 10 shows the detection of mulberry leaves with both powdery mildew and sooty leaf spot by four models. On leaves with both powdery mildew and sooty leaf spot, YOLOv8n, YOLOv7-tiny, and YOLOv5s show insufficient recognition ability for the small spots of sooty leaf spot, all exhibiting missed detections. YOLOv7-tiny and YOLOv5s miss a case of powdery mildew with less distinct features, YOLOv7-tiny falsely detects a case of powdery mildew, and YOLOv5s fails to properly recognize the characteristics of a case of powdery mildew, resulting in overlapping detection boxes.
Figure 11 shows the detection of mulberry leaves with three diseases present simultaneously by four models. On leaves with all three diseases present, YOLOv8n exhibits false detections, missed detections, and overlapping detection boxes. YOLOv7-tiny has missed detections, and YOLOv5s has missed detections, false detections, and overlapping detection boxes.
Based on the comparison of different model detections in the aforementioned scenarios, it is evident that YOLOv8-RFMD exhibits fewer issues with overlapping detection boxes, missed detections, and false detections, whereas the other models frequently encounter these problems. In our comparative experiments, the object confidence threshold was uniformly set to 0.3, and the input size was fixed at 640 × 640. The results showed that the mAP50 of YOLOv8-RFMD was 94.3%, while the other three models achieved 91.4%, 92.2%, and 91.6%, respectively. YOLOv8-RFMD demonstrated the highest detection precision for mulberry leaf diseases.This indicates that YOLOv8-RFMD has effectively learned the characteristics of diseases of various scales and shapes, demonstrating higher confidence in disease recognition and detection on mulberry leaves, more precision target localization, stronger model robustness, and better detection performance. It effectively resolves the issues of poor early disease recognition and imprecise localization faced by existing models in natural environments.

4. Discussion

Under natural environmental conditions, changes in light intensity, weather, and other factors can alter the color and texture of lesions on mulberry leaves. Mulberry brown spot disease typically thrives under weak light conditions and exhibits the most rapid growth in environments with temperatures ranging from 20 to 28 °C and high humidity. Mulberry powdery mildew, on the other hand, is inhibited by strong light and spreads rapidly at temperatures between 15 and 25 °C and relative humidity of 40%–80%. Mulberry sooty leaf spot disease prefers low light conditions and tends to outbreak at temperatures ranging from 20 to 30 °C and relative humidity above 80%. Additionally, during the early stages of disease onset, lesion sizes can vary, and multiple diseases may coexist on the same leaf. Given these complexities, the performance of YOLOv8n often fails to meet the requirements of our subsequent research. Therefore, we have implemented several enhancements to the YOLOv8 model.
To improve the model’s precision in detecting diseases of various sizes and enhancing localization capabilities, we replaced the Bottleneck in the original C2f module with the RFMD Module, incorporating the RFCA Conv and MDFA module. This replacement significantly increased the model’s mAP50 to 92.6% and mAP50:95 to 65.4%. However, it also increased the model size and GFLOPs, necessitating further optimizations.
Next, to prepare the algorithm for deployment on mobile embedded devices, we focused on making the model lightweight and simpler. We replaced CBS modules in the backbone network’s P3, P4, and P5 layers, as well as in the neck network, with ADown modules. This adjustment improved precision while reducing the model size and GFLOPs. After these changes, the model size decreased to 5.20 MB, with GFLOPs reduced to 7.4, achieving a lightweight configuration.
Lastly, recognizing that some lesions on mulberry leaves are initially small and challenging for the original model to effectively detect, we replaced the CIOU loss function with the NWD loss function. This modification notably enhanced the model’s ability to detect small targets. Through these improvements, we established the YOLOv8-RFMD model for mulberry leaf disease detection. Comprehensive comparisons with various mainstream models have demonstrated YOLOv8-RFMD’s superior performance in detection precision and model complexity.
In future research, we will first further improve the quality of the mulberry leaf disease dataset. We will capture and annotate images of other mulberry leaf diseases from different angles, varieties, and weather conditions as much as possible to enhance the generalization ability of this study’s mulberry leaf disease detection. Next, we plan to deploy the YOLOv8-RFMD model to mobile embedded devices and test its detection performance. This will provide more reliable technical support for the automated application of pesticides in mulberry plantations. Lan et al. [40] successfully deployed a ginger leaf pest detection model on Jetson Orin NX and tested and analyzed its performance, providing an effective reference for our future implementation. Finally, to further improve practical application capabilities, considering the actual needs of mulberry plantations, we also plan to develop an intelligent mulberry leaf disease monitoring system. This system will be able to call real-time video feeds from surveillance cameras, mobile phones, and drones into the YOLOv8-RFMD algorithm, enabling timely and precise feedback on mulberry leaf disease monitoring to management personnel.

5. Conclusions

In this study, we proposed a target detection model for mulberry leaf diseases in natural environments based on the YOLOv8 model, named YOLOv8-RFMD. Our hypothesis was that incorporating advanced feature extraction and loss functions into the YOLOv8 model would enhance detection precision and efficiency while being lightweight enough for mobile deployment. The results of our experiments support this hypothesis. The main findings are as follows:
(1)
The Multi-Dimension Feature Attention (MDFA) module successfully integrated important features at the pixel-level, spatial, and channel dimensions, enhancing the extraction of effective information.
(2)
The RFMD Module, composed of the CBS module, RFCA Conv, and MDFA, effectively replaced the Bottleneck in the Residual block, improving the model’s ability to capture local and global disease features.
(3)
The ADown down-sampling structure effectively reduced the model size and computational load while maintaining high precision.
(4)
Replacing the CIOU loss function with the NWD loss function significantly enhanced the detection of small disease features.
Comparative experiments demonstrated that the YOLOv8-RFMD model increased the mAP50 by 2.9% and mAP50:95 by 4.3% relative to the original model, with a reduction in model size by 0.53 MB and GFLOPs by 0.3. These improvements confirm our hypothesis, showing that the YOLOv8-RFMD model is a more efficient and precise detection tool for mulberry leaf diseases, suitable for deployment on mobile devices. This study provides technical support for intelligent spraying equipment and offers more precise disease diagnosis for mulberry gardens, contributing to the sustainable development of the sericulture industry.

Author Contributions

Methodology, M.Z. (Ming Zhang); validation, X.Q., M.Z. (Mengdi Zhao) and H.L.; investigation, C.Y.; data curation, C.Y. and H.L.; writing—original draft preparation, M.Z. (Ming Zhang); writing—review and editing, X.Q.; visualization, M.Z. (Ming Zhang) and Q.L.; funding acquisition, Q.L. and M.Z. (Mengdi Zhao); supervision, Q.L. All authors have read and agreed to the published version of the manuscript.

Funding

This research was funded by the Postgraduate Research & Practice Innovation Program of Jiangsu Province (SJCX24_2495), Natural Science Foundation of Jiangsu Province for Youths (BK20230662) and The Earmarked Fund for CARS-18.

Data Availability Statement

Data are contained within the article.

Conflicts of Interest

The authors declare no conflicts of interest.

Abbreviations

The following abbreviations are used in this paper:
YOLOv8You Only Look Once version 8
MDFAMulti-Dimension Feature Attention
CBSConv-BatchNomalization-SiLU
C2fFaster Implementation of CSP Bottleneck with two convolutions
C3CSP Bottleneck with three convolutions
NWDNormalized Wasserstein Distance
IoUIntersection over Union
mAPMean Average Precision
mAP50MAP values at the 50% loU threshold
mAP50:95MAP values in the 50-95% loU threshold range
VGGVisual Geometry Group
CNNConvolutional neural network
Faster R-CNNFaster region-based convolutional neural networks
SSPSpatial pyramid pooling
CSPCross Stage Partial
ELANEfficient Layer Aggregation Network
SPPFSpatial pyramid pooling fusion
PANPath aggregation network
FPNFeature pyramid network
DF LossDistribution focal loss
CIOUComplete Intersection over Union
BCEBinary cross-entropy
SESqueeze-and-excitation
ECAEfficient Channel Attention
CBAMConvolutional Block Attention Module
UNAPUn average pooling
RFCAReceptive-Field Coordinated Attention
CACoordinated Attention
SSDSingle Shot Multibox Detector
MLCAMixed Local Channel Attention
EMAEfficient Multi-Scale Attention
LSKALarge Separable Kernel Attention
GFLOPsGiga Floating-Point Operations Per second

References

  1. Rohela, G.K.; Shukla, P.; Kumar, R.; Chowdhury, S.R. Mulberry (Morus spp.): An ideal plant for sustainable development. Trees For. People 2020, 2, 100011. [Google Scholar] [CrossRef]
  2. Reddy, M.P.; Deeksha, A. Mulberry leaf disease detection using yolo. Int. J. Adv. Res. Ideas Innov. Technol. 2021, 7, 3. [Google Scholar]
  3. Gnanesh, B.N.; Arunakumar, G.S.; Tejaswi, A.; Supriya, M.; Pappachan, A.; Harshitha, M.M. Molecular Diagnostics of Soil-Borne and Foliar Diseases of Mulberry: Present Trends and Future Perspective. In The Mulberry Genome; Springer International Publishing: Cham, Switzerland, 2023; pp. 215–241. [Google Scholar]
  4. Andreychev, A.V. A new methodology for studying the activity of underground mammals. Biol. Bull. 2018, 45, 937–943. [Google Scholar] [CrossRef]
  5. Xie, Y.; Yu, W. Remote Monitoring of Amur Tigers in Forest Ecosystems Using Improved YOLOX Algorithm. Forests 2023, 14, 2000. [Google Scholar] [CrossRef]
  6. Ngugi, H.N.; Ezugwu, A.E.; Akinyelu, A.A.; Abualigah, L. Revolutionizing crop disease detection with computational deep learning: A comprehensive review. Environ. Monit. Assess. 2024, 196, 302. [Google Scholar] [CrossRef] [PubMed]
  7. Javidan, S.M.; Banakar, A.; Vakilian, K.A.; Ampatzidis, Y. Diagnosis of grape leaf diseases using automatic K-means clustering and machine learning. Smart Agric. Technol. 2023, 3, 100081. [Google Scholar] [CrossRef]
  8. Sladojevic, S.; Arsenovic, M.; Anderla, A.; Culibrk, D.; Stefanovic, D. Deep neural networks based recognition of plant diseases by leaf image classification. Comput. Intell. Neurosci. 2016, 2016, 3289801. [Google Scholar] [CrossRef]
  9. Krizhevsky, A.; Sutskever, I.; Hinton, G.E. ImageNet classification with deep convolutional neural networks. Commun. ACM 2017, 60, 84–90. [Google Scholar] [CrossRef]
  10. Rangarajan, A.K.; Purushothaman, R.; Ramesh, A. Tomato crop disease classification using pre-trained deep learning algorithm. Procedia Comput. Sci. 2018, 133, 1040–1047. [Google Scholar] [CrossRef]
  11. Simonyan, K.; Zisserman, A. Very deep convolutional networks for large-scale image recognition. arXiv 2014, arXiv:1409.1556. [Google Scholar]
  12. Nahiduzzaman, M.; Chowdhury, M.E.H.; Salam, A.; Nahid, E.; Ahmed, F.; AL-Emadi, N.; Ayari, M.A.; Khandakar, A.; Haider, J. Explainable deep learning model for automatic mulberry leaf disease classification. Front. Plant Sci. 2023, 14, 1175515. [Google Scholar] [CrossRef] [PubMed]
  13. Waheed, A.; Goyal, M.; Gupta, D.; Khanna, A.; Hassanien, A.E.; Pandey, H.M. An optimized dense convolutional neural network model for disease recognition and classification in corn leaf. Comput. Electron. Agric. 2020, 175, 105456. [Google Scholar] [CrossRef]
  14. Wen, C.; He, W.; Wu, W.; Liang, X.; Yang, J.; Nong, H.; Lan, Z. Recognition of mulberry leaf diseases based on multi-scale residual network fusion SENet. PLoS ONE 2024, 19, e0298700. [Google Scholar]
  15. Xue, Z.; Xu, R.; Bai, D.; Lin, H. YOLO-tea: A tea disease detection model improved by YOLOv5. Forests 2023, 14, 415. [Google Scholar] [CrossRef]
  16. Ren, S.; He, K.; Girshick, R.; Sun, J. Faster r-cnn: Towards real-time object detection with region proposal networks. IEEE Trans. Pattern Anal. Mach. Intell. 2017, 39, 1137–1149. [Google Scholar] [CrossRef] [PubMed]
  17. Liu, W.; Anguelov, D.; Erhan, D.; Szegedy, C.; Reed, S.; Fu, C.Y.; Berg, A.C. Ssd: Single shot multibox detector. In Proceedings of the European Conference on Computer Vision, Amsterdam, The Netherlands, 11–14 October 2016. [Google Scholar]
  18. Li, Y.; Sun, S.; Zhang, C.; Yang, G.; Ye, Q. One-stage disease detection method for maize leaf based on multi-scale feature fusion. Appl. Sci. 2022, 12, 7960. [Google Scholar] [CrossRef]
  19. Hou, Q.; Zhou, D.; Feng, J. Coordinate attention for efficient mobile network design. In Proceedings of the IEEE/CVF Conference on Computer Vision and Pattern Recognition, Nashville, TN, USA, 20–25 June 2021. [Google Scholar]
  20. Nie, X.; Wang, L.; Ding, H.; Xu, M. Strawberry verticillium wilt detection network based on multi-task learning and attention. IEEE Access 2019, 7, 170003–170011. [Google Scholar] [CrossRef]
  21. Dwivedi, R.; Dey, S.; Chakraborty, C.; Tiwari, S. Grape disease detection network based on multi-task learning and attention features. IEEE Sens. J. 2021, 21, 17573–17580. [Google Scholar] [CrossRef]
  22. Redmon, J.; Divvala, S.; Girshick, R.; Farhadi, A. You only look once: Unified, real-time object detection. In Proceedings of the IEEE Conference on Computer Vision and Pattern Recognition, Las Vegas, NV, USA, 27–30 June 2016. [Google Scholar]
  23. Bochkovskiy, A.; Wang, C.Y.; Liao, H.Y.M. Yolov4: Optimal speed and accuracy of object detection. arXiv 2020, arXiv:2004.10934. [Google Scholar]
  24. Wang, C.Y.; Bochkovskiy, A.; Liao, H.Y.M. YOLOv7: Trainable bag-of-freebies sets new state-of-the-art for real-time object detectors. In Proceedings of the IEEE/CVF Conference on Computer Vision and Pattern Recognition, Vancouver, BC, Canada, 17–24 June 2023. [Google Scholar]
  25. Liu, S.; Qi, L.; Qin, H.; Shi, J.; Jia, J. Path aggregation network for instance segmentation. In Proceedings of the IEEE Conference on Computer Vision and Pattern Recognition, Salt Lake City, UT, USA, 18–23 June 2018. [Google Scholar]
  26. Lin, T.Y.; Dollár, P.; Girshick, R.; He, K.; Hariharan, B.; Belongie, S. Feature pyramid networks for object detection. In Proceedings of the IEEE Conference on Computer Vision and Pattern Recognition, Honolulu, HI, USA, 21–26 July 2017. [Google Scholar]
  27. Zheng, Z.; Wang, P.; Liu, W.; Li, J.; Ye, R.; Ren, D. Distance-IoU loss: Faster and better learning for bounding box regression. In Proceedings of the AAAI Conference on Artificial Intelligence, New York Hilton Midtown, New York, NY, USA, 7–12 February 2020. [Google Scholar]
  28. Hu, J.; Shen, L.; Sun, G. Squeeze-and-excitation networks. In Proceedings of the IEEE Conference on Computer Vision and Pattern Recognition, Salt Lake City, UT, USA, 18–23 June 2018. [Google Scholar]
  29. Wang, Q.; Wu, B.; Zhu, P.; Li, P.; Zuo, W.; Hu, Q. ECA-Net: Efficient channel attention for deep convolutional neural networks. In Proceedings of the IEEE/CVF Conference on Computer Vision and Pattern Recognition, Seattle, WA, USA, 13–19 June 2020. [Google Scholar]
  30. Woo, S.; Park, J.; Lee, J.Y.; Kweon, I.S. CBAM: Convolutional Block Attention Module. In Proceedings of the European Conference on Computer Vision (ECCV), Munich, Germany, 8–14 September 2018. [Google Scholar]
  31. Yang, L.; Zhang, R.Y.; Li, L.; Xie, X. Simam: A simple, parameter-free attention module for convolutional neural networks. In Proceedings of the 38th International Conference on Machine Learning, Virtual, 18–24 July 2021. [Google Scholar]
  32. Zhang, X.; Liu, C.; Yang, D.; Song, T.; Ye, Y.; Li, K.; Song, Y. Rfaconv: Innovating spatital attention and standard convolutional operation. arXiv 2023, arXiv:2304.03198. [Google Scholar]
  33. Wang, C.Y.; Yeh, I.H.; Liao, H.Y.M. YOLOv9: Learning What You Want to Learn Using Programmable Gradient Information. arXiv 2024, arXiv:2402.13616. [Google Scholar]
  34. Wang, J.; Xu, C.; Yang, W.; Yu, L. A normalized Gaussian Wasserstein distance for tiny object detection. arXiv 2021, arXiv:2110.13389. [Google Scholar]
  35. Lin, T.Y.; Goyal, P.; Girshick, R.; He, K.; Dollár, P. Focal loss for dense object detection. In Proceedings of the IEEE International Conference on Computer Vision, Venice, Italy, 22–29 October 2017. [Google Scholar]
  36. Zhao, Y.; Lv, W.; Xu, S.; Wei, J.; Wang, G.; Dang, Q.; Liu, Y.; Chen, J. Detrs beat yolos on real-time object detection. In Proceedings of the IEEE/CVF Conference on Computer Vision and Pattern Recognition, Seattle, WA, USA, 17–21 June 2024. [Google Scholar]
  37. Wan, D.; Lu, R.; Shen, S.; Xu, T.; Lang, X.; Ren, Z. Mixed local channel attention for object detection. Eng. Appl. Artif. Intell. 2023, 123, 106442. [Google Scholar] [CrossRef]
  38. Ouyang, D.; He, S.; Zhang, G.; Luo, M.; Guo, H.; Zhan, J.; Huang, Z. Efficient multi-scale attention module with cross-spatial learning. In Proceedings of the ICASSP 2023—2023 IEEE International Conference on Acoustics, Speech and Signal Processing (ICASSP), Rhodes Island, Greece, 4–10 June 2023. [Google Scholar]
  39. Lau, K.W.; Po, L.M.; Rehman, Y.A.U. Large separable kernel attention: Rethinking the large kernel attention design in cnn. Expert Syst. Appl. 2024, 236, 121352. [Google Scholar] [CrossRef]
  40. Lan, Y.; Sun, B.; Zhang, L.; Zhao, D. Identifying diseases and pests in ginger leaf under natural scenes using improved YOLOv5s. Trans. Chin. Soc. Agric. Eng. (Trans. CSAE) 2024, 40, 210–246. [Google Scholar]
Figure 1. Mulberry leaf diseases.
Forests 15 01188 g001
Figure 2. Schematic diagram of the improved YOLOv8 model.
Forests 15 01188 g002
Figure 3. Structure diagram of the MDFA module.
Forests 15 01188 g003
Figure 4. Schematic diagram of RFCA Conv.
Forests 15 01188 g004
Figure 5. Structure of the ADown module.
Forests 15 01188 g005
Figure 6. Heatmaps of different attention modules.
Forests 15 01188 g006
Figure 7. Visualization comparison of mAP50 and mAP50:95 before and after improvement of YOLOv8.
Forests 15 01188 g007
Figure 8. Confusion matrix.
Forests 15 01188 g008
Figure 9. Brown spot and powdery mildew.
Forests 15 01188 g009
Figure 10. Sooty leaf spot and powdery mildew.
Forests 15 01188 g010
Figure 11. Three diseases.
Forests 15 01188 g011
Table 1. Characteristics and origins of diseases in the dataset.
TypesCharacteristicsOrigin and Geographical Location
Brown spotThe pathogen is Septogleum mori Bri et Cav, brown spots of varying shapes and sizes on both sides of the leaves.
Powdery mildewThe pathogen is Pbllactinia moricola (P. Henn.) Homma, a layer of white powdery mildew spots often appears on the surface of the diseased leaves.Mulberry gardens in Mirganj, Bagha, Rajshahi, and Vodra, Rajshahi, in Rajshahi city, Bangladesh
Sooty leaf spotThe pathogen is Sirosporium mori (H. & P. Syb.) M. B. Ellis, which initially manifests as small coal dust-like black spots. In this study, it is referred to as sooty leaf spot.
Table 2. Different model training results comparison.
ModelPrecision (%)Recall (%)mAP50 (%)mAP50:95 (%)Model Size (MB)GFLOPs
YOLOv8-RFMD92.689.594.367.85.457.8
YOLOv8n90.184.891.463.55.988.1
YOLOv7-tiny90.888.192.256.111.713.2
YOLOv5s90.185.191.661.85.047.1
Faster R-CNN79.483.286.459.5314954
SSD59.157.360.743.560.3162
RetinaNet64.261.764.546.3338150
YOLOv9-S91.888.693.767.419.427.3
RT-DETR-R1892.589.194.067.577.262.4
Table 3. Training results of different attention modules.
AttentionPrecision (%)Recall (%)mAP50 (%)mAP50:95 (%)Model Size (MB)GFLOPs
MDFA92.689.594.367.85.457.8
MLCA91.688.693.866.65.467.8
EMA92.487.893.666.85.497.8
LSKA92.588.893.966.95.607.8
SE92.388.393.866.15.477.8
ECA92.488.093.666.75.457.8
CBAM91.788.893.867.05.497.8
Table 4. Ablation experiments of different modules.
TestMDFARFCA
Conv
ADownNWD
Loss
Precision
(%)
Recall
(%)
mAP50
(%)
mAP50:95
(%)
Model Size
(MB)
GFLOPs
1----90.184.891.463.55.988.1
2---90.786.392.464.35.998.1
3---9086.592.464.96.228.5
4--90.586.292.665.46.238.5
5---90.486.292.364.95.207.4
6---91.486.292.463.95.988.1
792.689.594.367.85.457.8
The experiment is based on the YOLOv8n. ‘✓’ denotes addition or improvement, while ‘-’ indicates no change.
Disclaimer/Publisher’s Note: The statements, opinions and data contained in all publications are solely those of the individual author(s) and contributor(s) and not of MDPI and/or the editor(s). MDPI and/or the editor(s) disclaim responsibility for any injury to people or property resulting from any ideas, methods, instructions or products referred to in the content.

