Article

Quantitative Analysis of Physiological and Psychological Impacts of Visual and Auditory Elements in Wuyishan National Park Using Eye-Tracking

1
School of Design, Fujian University of Technology, Fuzhou 350118, China
2
Design Innovation Research Center of Humanities and Social Sciences Research Base of Colleges and Universities, Fuzhou 350118, China
3
College of Landscape Architecture and Art, Fujian Agriculture and Forestry University, Fuzhou 350002, China
4
Department of Electronic Information Science, Fujian Jiangxia University, Fuzhou 350108, China
*
Author to whom correspondence should be addressed.
Forests 2024, 15(7), 1210; https://doi.org/10.3390/f15071210
Submission received: 24 April 2024 / Revised: 14 May 2024 / Accepted: 10 July 2024 / Published: 12 July 2024
(This article belongs to the Special Issue Forest Bathing and Forests for Public Health—Series II)

Abstract

:
Amidst rapid societal changes and increasing urbanization, human connectivity with nature has declined, exacerbating public health concerns. This study assesses the efficacy of Shinrin-yoku, or ‘forest bathing’, in Wuyishan National Park as a simple and effective method to counteract the adverse health effects of contemporary lifestyles. Employing repeated-measures analysis of variance, forty-one participants were observed over three days across eight distinct forest settings. Techniques included eye-tracking for visual attention and soundscape perception assessments via questionnaires. Physiological responses were gauged through heart rate variability and skin conductance, while psychological evaluations utilized the Profile of Mood States (POMS) and Positive and Negative Affect Schedule (PANAS). Findings revealed that (1) natural soundscapes—especially birdsong, flowing water, wind, and bamboo raft sounds—and visual elements, such as distant mountains, streams, trees, Danxia landforms, tea gardens, and bamboo views, play pivotal roles in regulating heart rate variability, reducing arousal, and enhancing stress adaptation. Additionally, cultural landscapes, such as classical music and ancient structures, bolster parasympathetic activity. (2) Natural and cultural auditory stimuli, including flowing water and classical music, coupled with visual features, such as Danxia landforms, streams, distant mountains, lawns, and guide signs, effectively induce positive mood states, regulate mood disturbances, and enhance psychological well-being across diverse forest settings. These findings underscore the significant health benefits of immersive natural experiences and advocate for integrating forest-based wellness programs into public health strategies, offering compelling evidence for enriching life quality through nature engagement.

1. Introduction

Rapid societal changes and urban growth are diminishing human–nature interactions [1], which negatively affects both physical and mental health [2]. The World Health Organization (WHO) reports that depression significantly contributes to the global suicide burden, affecting millions each year, and represents the largest share of the global mental health burden, along with anxiety—37.4% and 22.9%, respectively [3]. The prevalence of major depressive disorder and anxiety disorders increased during the COVID-19 pandemic, with notable rises among women and youth [4]. Additionally, with its population expected to age rapidly—surpassing 420 million by 2035 [5]—China faces increasing mental health challenges, such as depression and anxiety [6], thereby amplifying the need for enhanced public health strategies.
Shinrin-yoku, also known as forest bathing, a natural therapy engaging all five senses in a forest setting, has been academically validated to boost both physiological and psychological health. Physiologically, it reduces blood pressure and heart rate [7,8], improves metabolic markers [9,10], and enhances immune function [11,12]. Psychologically, it decreases stress and anxiety [13], boosts emotional stability [14], improves sleep [15], and reduces depressive symptoms [16]. These benefits highlight Shinrin-yoku as a simple, cost-effective method for health promotion in modern life.
Wuyishan National Park is renowned for its dual status as a ‘World Cultural and Natural Heritage’ site and a ‘World Biosphere Reserve’. It boasts a world-class ecosystem and rich biodiversity, making it an ideal location for exploring the impacts of natural environments on public health. The study aims to analyze the effects of forest landscape perception on physiological and psychological responses, thereby deepening our understanding of how forest environments influence human health. The study will offer scientific guidance for forest therapy programs and forest resource development.

1.1. Advances in Psychophysiological Studies on Visual Perception

Recent research emphasizes the significant role of visual perception in enhancing psychological recovery, reducing stress, and improving health. Seminal work by Ulrich demonstrated that viewing natural landscapes, through photographs or videos, markedly elevates positive emotions, increases alpha brain wave activity, and stimulates the parasympathetic nervous system [17,18]. Grahn and Stigsdotter outlined various elements that enhance the restorative potential of nature, including serenity, space, social interaction, species richness, refuge, and cultural aspects [19]. Research by Nordh et al. emphasized the importance of grass cover in small green spaces and the scale of parks for restorative effects [20], while Deng and colleagues showed that diverse landscape types within urban parks significantly improve psychophysiological health, especially wooded landscapes [21]. Moreover, blue spaces are associated with stronger positive emotions and greater perceived restorativeness [22].
Advances in eye-tracking and virtual reality (VR) technologies have furthered our understanding of landscape impacts on cognitive functions, aesthetic preferences, and subjective restorativeness. Studies indicate that natural settings boost children’s attention task performance [23], and foliate forests reduce cognitive load [24]. Urban greenery, through varied plant colors and natural elements, significantly affects health outcomes [25], with certain leaf colors in indoor plants enhancing visual attention and mood [26]. Eye-tracking has also been employed to develop a quantitative model assessing the psychological restoration provided by landscapes, highlighting the benefits of complexity, color, and dynamic properties [27].

1.2. Advances in Psychophysiological Studies on Soundscape Perception

According to the definition provided by the International Organization for Standardization (ISO) 12913-1, a soundscape is the acoustic environment as perceived, experienced, or understood by an individual, group, or community within a specific context [28]. This definition extends beyond the physical aspects of acoustic phenomena, placing a primary focus on human perception and involving interactions among sounds, users, the environment, and society.
Physiological and neurophysiological research highlights how individual traits and emotional responses significantly influence the restorative qualities of soundscapes [29]. Studies by Alvarsson et al. have shown that natural sounds can more effectively reduce stress compared to artificial noises, enhancing psychological recovery [30]. Additionally, bird songs help about 35% of individuals alleviate stress and restore attention [31]. Eye-tracking studies in classic Chinese gardens have explored how sounds affect visual attention and emotions [32]. Studies in virtual environments suggest that rural settings, particularly those with water elements and natural soundscapes, are more effective at promoting psychophysiological recovery than urban environments [33]. Bird songs and water sounds are identified as particularly restorative in urban parks [34,35]. Annerstedt et al. used VR technology to demonstrate how forest soundscapes activate the parasympathetic nervous system and aid in stress recovery [36]. Liu et al. highlighted the stress-reducing effects of bird songs, insect sounds, and flowing water [37]. Hong et al. confirmed the restorative impact of these sounds through neural network models, especially in bamboo forests [38]. Zhu et al. highlighted the benefits of incorporating natural sounds, such as bird songs and water flows, in forest environments for enhancing health [39,40].

1.3. Advancements in Empirical Research on Audio–Visual Interaction Experiences

Recent empirical studies highlighted the synergistic effects of visual and auditory elements on human perception, emotion, and physiological states, particularly in urban green spaces and restorative environments. Carles et al. found that a harmonious alignment between images and sounds significantly amplifies feelings of pleasure [41]. Similarly, Jahncke et al. showed that combining natural sounds with visual impressions of urban nature enhances the perceived restorative potential of environments [42]. Zhao et al. highlighted the critical role of integrating bird calls with visually soothing scenes, such as flat terrains, in promoting mental recovery [43]. Liu’s study highlighted the positive effects of natural and musical sounds on recreational experiences and the negative impacts of disruptive noises, such as construction sounds [37]. Shao et al. discovered that soundscape comfort is influenced by the nature and intensity of sound sources and visual attributes [44]. Wang et al. found that blending natural sounds with various visual landscapes improves aesthetic enjoyment [45]. These findings underscore the importance of integrating sensory elements in urban parks and green spaces to enhance psychological health and quality of life.

1.4. Current Research

Although there has been some progress in the field, current research still faces several limitations. First, while many studies emphasize the effects of individual sensory stimuli in natural settings, they often overlook the comprehensive impacts of multisensory experiences. Second, the diversity of forest environments is frequently ignored, with many studies assuming uniform effects across different types of forests on health outcomes. Third, the methodology used to link physiological and psychological outcomes with perceptual attributes, such as heart rate (HR) and skin conductance level (SCL), often suffers from inconsistencies. These inconsistencies impede the generalizability and comparability of findings [46]. In response to these issues, our study delves into the combined influence of visual and auditory elements in Wuyishan National Park on individual health. We have accordingly designed our research hypotheses and objectives.
Hypothesis 1.
The visual and auditory elements in forest environments have a significant positive impact on individuals’ physiological responses, promoting autonomic nervous system balance and reducing levels of emotional arousal.
Hypothesis 2.
The visual and auditory components of forest environments contribute to enhancing individual mood states by increasing positive emotions and decreasing negative emotions and overall mood disturbances.

2. Materials and Methods
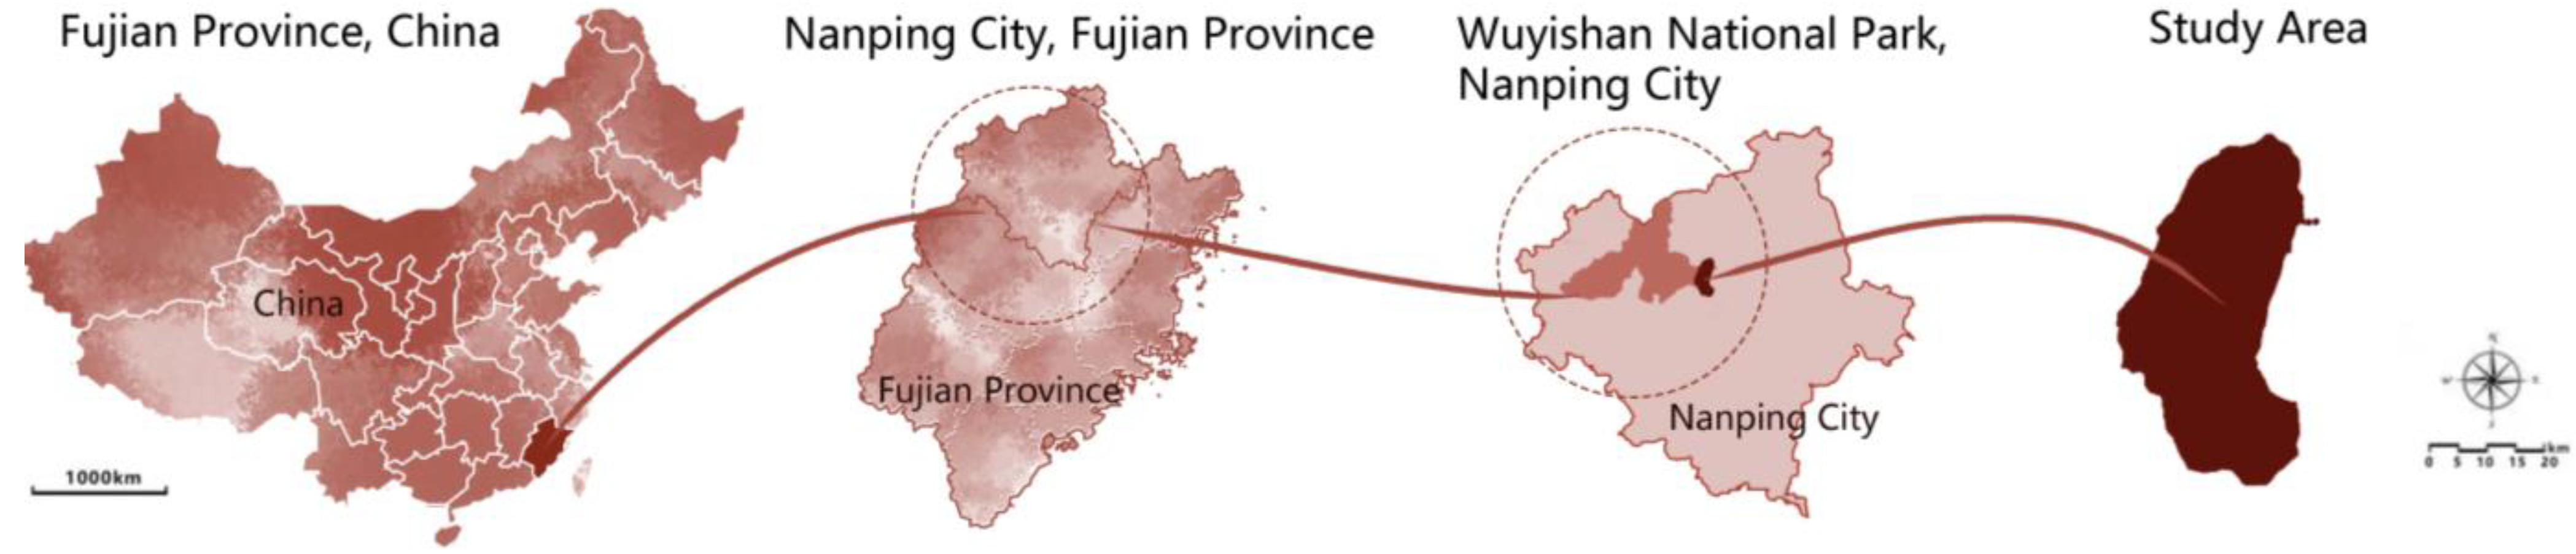
2.1. Study Area

The study area, defined by the coordinates 117°24′13″ E to 117°59′19″ E and 27°31′20″ N to 27°55′49″ N, is located in the northwest of Wuyishan National Park, Fujian Province, China, as shown in Figure 1. Wuyishan is renowned for its unique Danxia landform and rich geological history, characterized by an average elevation of 1200 m. The region experiences a mid-subtropical-humid monsoon climate, with average annual temperatures ranging from 8.5 °C to 18 °C, relative humidity of 78%–84%, and annual rainfall of approximately 1800 mm. Wuyishan is not only the source of the Min River but also features a unique hydrological landscape along the 8.95 km stretch of the Jiuqu Stream’s downstream segment within its core scenic area. Ecologically, Wuyishan National Park encompasses all vegetation types of the mid-subtropical region of China, with a forest cover rate of 80.44%. In summary, the unique geographical location, diverse ecosystems, and significant geomorphological features make Wuyishan National Park an ideal place for nature conservation and scientific research.
This study primarily focuses on the core tourist areas in the eastern region of Wuyishan National Park, as depicted in Figure 2. To ensure comprehensive coverage of all forest landscape types within the core area, Fisher’s order cluster analysis was employed to segment landscape sections. This method aimed to obtain segments where the differences between similar landscape types were minimal, while maximizing the differences between different categories of landscapes. This research methodology has been previously applied in linear landscape segmentation studies [47]. Initially, five experts in the field of landscape architecture jointly assessed the primary factors influencing the classification of trail types. They identified 3 main categories (terrain, vegetation type, and land use type) and 18 sub-items of landscape observation factors. Using DPS software (Data Processing System, version 15.10), we assigned numerical values to 58 sample units across 4 trails, with each unit spanning 500 m. By defining the clustering diameter and computing the minimum function error matrix, the optimal segmentation scheme, comprising eight segments, was ultimately determined, each characterized by unique natural features and specific geographical locations: Grassland Slopes, Valley Broadleaf Forests, Valley Mixed Broadleaf–Coniferous Forests, Ridge Broadleaf Forests, Slope Mixed Broadleaf–Coniferous Forests, Valley Tea Gardens, Streamside Broadleaf Forests, and Rock-Bedded Streamscapes. For each major forest type, representative plots (labeled S1–S8) were selected for in-depth study. Detailed descriptions of these plots are presented in Table 1.

2.2. Participants

To determine the appropriate sample size for our repeated-measures ANOVA, we utilized G*Power software version 3.1.9.2. [48,49]. We set the effect size (f) at 0.25 based on preliminary studies that suggested a medium effect size [33]. The alpha level was set at 0.05, with a statistical power of 0.95. Specifically, our analysis aimed to detect main effects of time (within-subjects factor), which required managing both the number of groups and the number of measurements, set respectively at 1 and 9. This setup was chosen based on the design of our experiment, which involved repeated measurements over a single group to assess changes over time without the interaction of different experimental conditions or groups. Considering these parameters, the G*Power analysis suggested a minimum sample size of 22 participants to achieve a statistical power of 0.95. This size was calculated to ensure sufficient power to detect significant within-subjects effects, assuming the specified effect size and measurement structure.
To enhance the reliability of the study, we conducted a public recruitment of volunteers to participate in the experiment. To ensure sample diversity, we established the following inclusion criteria: (1) Participants must be in good health, with no history of neurological, cardiovascular, or metabolic disorders. (2) They must not have taken any medications in the week prior to the experiment, and (3) they were required to abstain from alcohol and coffee the day before the experiment, and to avoid intense physical activity. (4) They should have normal vision, with myopic individuals needing a prescription weaker than −4.00 diopters, and no color vision deficiencies or auditory impairments. (5) Participants should have no prior experience in similar studies, and (6) they must not have any work experience related to forestry or landscape architecture. (7) All participants signed an informed consent form, and the study was conducted in strict adherence to the ethical standards of the Declaration of Helsinki.
Initially, we recruited 47 volunteers; however, due to dropouts or data anomalies, 6 were excluded from the final analysis. Therefore, the final sample comprised 41 individuals, with ages ranging from 21 to 55 years, and a mean of 32.17 years. Males comprised 51% of the sample, with a mean age of 31.95 years (standard deviation = 7.86 years), while females made up the remaining 49%, with a mean age of 32.40 years (standard deviation = 8.30 years). The demographic data are presented in Table 2.

2.3. Study Design

In this study, we employed a repeated-measures ANOVA design, with visual and auditory perceptions in various forest environments acting as independent variables, alongside a range of physiological and psychological indices as dependent variables. To promote data accuracy and reliability, all experimental equipment was calibrated and checked prior to the experiments. Through a computer-generated sequence, participants were randomly assigned to one of four predetermined walking paths (Paths A, B, C, and D, as shown in Figure 1) that covered all experimental locations. This approach was chosen to help reduce selection bias and equalize baseline characteristics across the groups. Portable meteorological stations and noise meters were used to monitor environmental conditions, striving for basic consistency in weather, temperature, and noise levels within the experimental zones. Additionally, measures were taken to minimize external interferences, such as setting up privacy barriers around the experimental areas and mandating that on-site personnel mute their mobile phones. Any unforeseen disruptions were carefully documented to evaluate their nature, extent, and potential impact on the study’s findings, aiming to support the experiment’s integrity.

2.4. Measurements

2.4.1. Visual Indicators

In recent years, eye-tracking technology has proven invaluable for investigating human visual perception processes. Specifically, in the field of landscape visual cognition, this technology enables the examination of focal points and areas of visual attention in human observers. Pioneering this application, Lucio et al. (1996) proposed the use of eye-tracking in landscape perception studies [50], establishing eye movement metrics as reliable indicators of visual attention that have been extensively validated by subsequent research [51,52]. In eye-tracking research, it is customary for investigators to delineate areas of interest (AOIs) in accordance with their study objectives, such as identifying trees, shrubs, or buildings within a scene. Eye movement metrics serve as foundational elements for quantifying the processes and attributes of visual perception. Diverse research aims necessitate the adoption of varying eye movement metrics.
In this study, visual attention data were recorded using the Dikablis Glass 3 eye-tracking glasses (Ergoneers GmbH, Egling, Germany). The device is equipped with a sampling rate of 60 Hz and supports high-definition video recording at a resolution of 1920 × 1080 pixels. To ensure data accuracy, a four-point calibration method was employed. The definition of AOIs was refined by adapting and expanding classification methods from previous research [25,53,54,55]. This approach resulted in a framework that categorizes observation targets into static and dynamic types. Static targets consisted of vegetation, paths, man-made objects, and terrain, while dynamic targets included water, pedestrians, vehicles, and transient landscapes, as detailed in Table 3. Using this framework, the research identified eight primary categories and twenty subcategories to evaluate the visual appeal of various landscapes. The study specifically focused on eye-tracking metrics, such as the number of glances (NG) and mean glance duration (MGD). These metrics are pivotal for accurately analyzing participants’ visual attention patterns toward different landscape elements, with fundamental interpretations provided in Table 4.

2.4.2. Auditory Indicators

In this study, the equivalent continuous A sound level (LAeq) was used as the objective evaluation metric. Noise level measurements were conducted using the TES-1350A sound level meter from Taiwan TES, adhering strictly to the International Organization for Standardization’s (ISO)/TS 12913-2 standards [56] for sound pressure level monitoring.
Subjective evaluation questionnaires were employed to assess participants’ auditory experiences, focusing on the perceptual dominance of 12 typical sound sources identified through field surveys. These sources were categorized into natural and artificial sounds, with five subtypes, as detailed in Table 5, based on prior research [57,58]. To quantify the perceptual dominance of sound sources within soundscapes, we introduced the Sound Dominance Degree (SDD) index [57,59]. The SDD is calculated using the formula:
SDD = PLS × POS
where PLS stands for perceived loudness of individual sounds, and POS indicates perceived occurrences of individual sounds. Participants were asked to rate, on a five-point Likert scale, from 1 to 5, the frequency at which they heard each sound in the current environment and their perceived dominance of each sound in the soundscape. This questionnaire design aimed to deepen our understanding of how the perceived frequency and loudness of various sound sources interact to influence the perception of dominance in soundscapes.

2.4.3. Physiological Indices

In this study, we utilized the ErgoLAB Smart Wearable Ergonomic Recorder (Beijing Kingfar Technology Co., Ltd., Beijing, China, version 3.16) to collect key physiological indices from participants, including heart rate variability (HRV) and skin conductance level (SCL). HRV, a quantifiable measure of the variability in the intervals between consecutive heartbeats (R-R intervals) found in an electrocardiogram, serves as an indirect marker of the autonomic nervous system’s balance and the activities of the sympathetic and parasympathetic nervous systems [60]. The HRV measurement parameters selected included the time-domain feature RMSSD (root mean square of successive differences between adjacent R-R intervals), which primarily reflects short-term parasympathetic nerve activity, crucial during rest and digestion, and the frequency-domain feature LF/HF ratio. The LF/HF ratio provides insight into the overall regulatory balance of the autonomic nervous system, where the LF component measures the activity intensity of the sympathetic nerves, and the HF component measures the regulatory capacity of the parasympathetic nerves. SCL, critical for assessing the intensity of individual emotional responses and stress levels, reflects changes in sympathetic nerve activity and levels of emotional arousal, independent of the parasympathetic nerves [61]. Previous research indicates that certain stimuli can enhance sympathetic nerve activity within two minutes [62]. To ensure the comparability of our results, we normalized the SCL data using the formula:
X0 = Xemotion − Xcalm,
where X0 represents the normalized SCL data, Xemotion is the SCL data following the landscape experience, and Xcalm is the baseline value under calm conditions.

2.4.4. Psychological Indices

We used two psychological assessment tools—the Profile of Mood States (POMS) and the Positive and Negative Affect Schedule (PANAS)—to explore the effects of forest environments on participants’ mood states. The POMS, developed by McNair et al. in 1971, evaluates six primary emotional dimensions: anger, confusion, depression, fatigue, tension, and vigor. Each dimension is assessed through 30 items, each scored on a Likert scale ranging from 0 (not at all) to 4 (extremely). This scale is specifically designed to quantify short-term mood states, crucial for assessing immediate psychological impacts [63]. The total mood disturbance (TMD), calculated using the formula below, acts as an indicator of the overall emotional burden participants experience. The Chinese version of the scale has demonstrated good reliability and validity in assessing these emotional states, with a Cronbach’s α coefficient ranging from 0.62 to 0.82, reflecting variations across different dimensions [64]:
TMD = (T + F + A + C + D) − V
The Positive and Negative Affect Schedule (PANAS), proposed by Watson, Clark, and Tellegen in 1988, comprises 20 items split into 2 dimensions: positive and negative affect, each containing 10 items [65]. It employs a Likert scale from 1 (strongly disagree) to 5 (strongly agree) to effectively measure states of positive emotions, including enthusiasm, active engagement, and alertness, as well as negative emotions, including anger, shame, disgust, guilt, fear, and tension. The reliability of the Chinese version is supported by a Cronbach’s α of 0.82 [66].

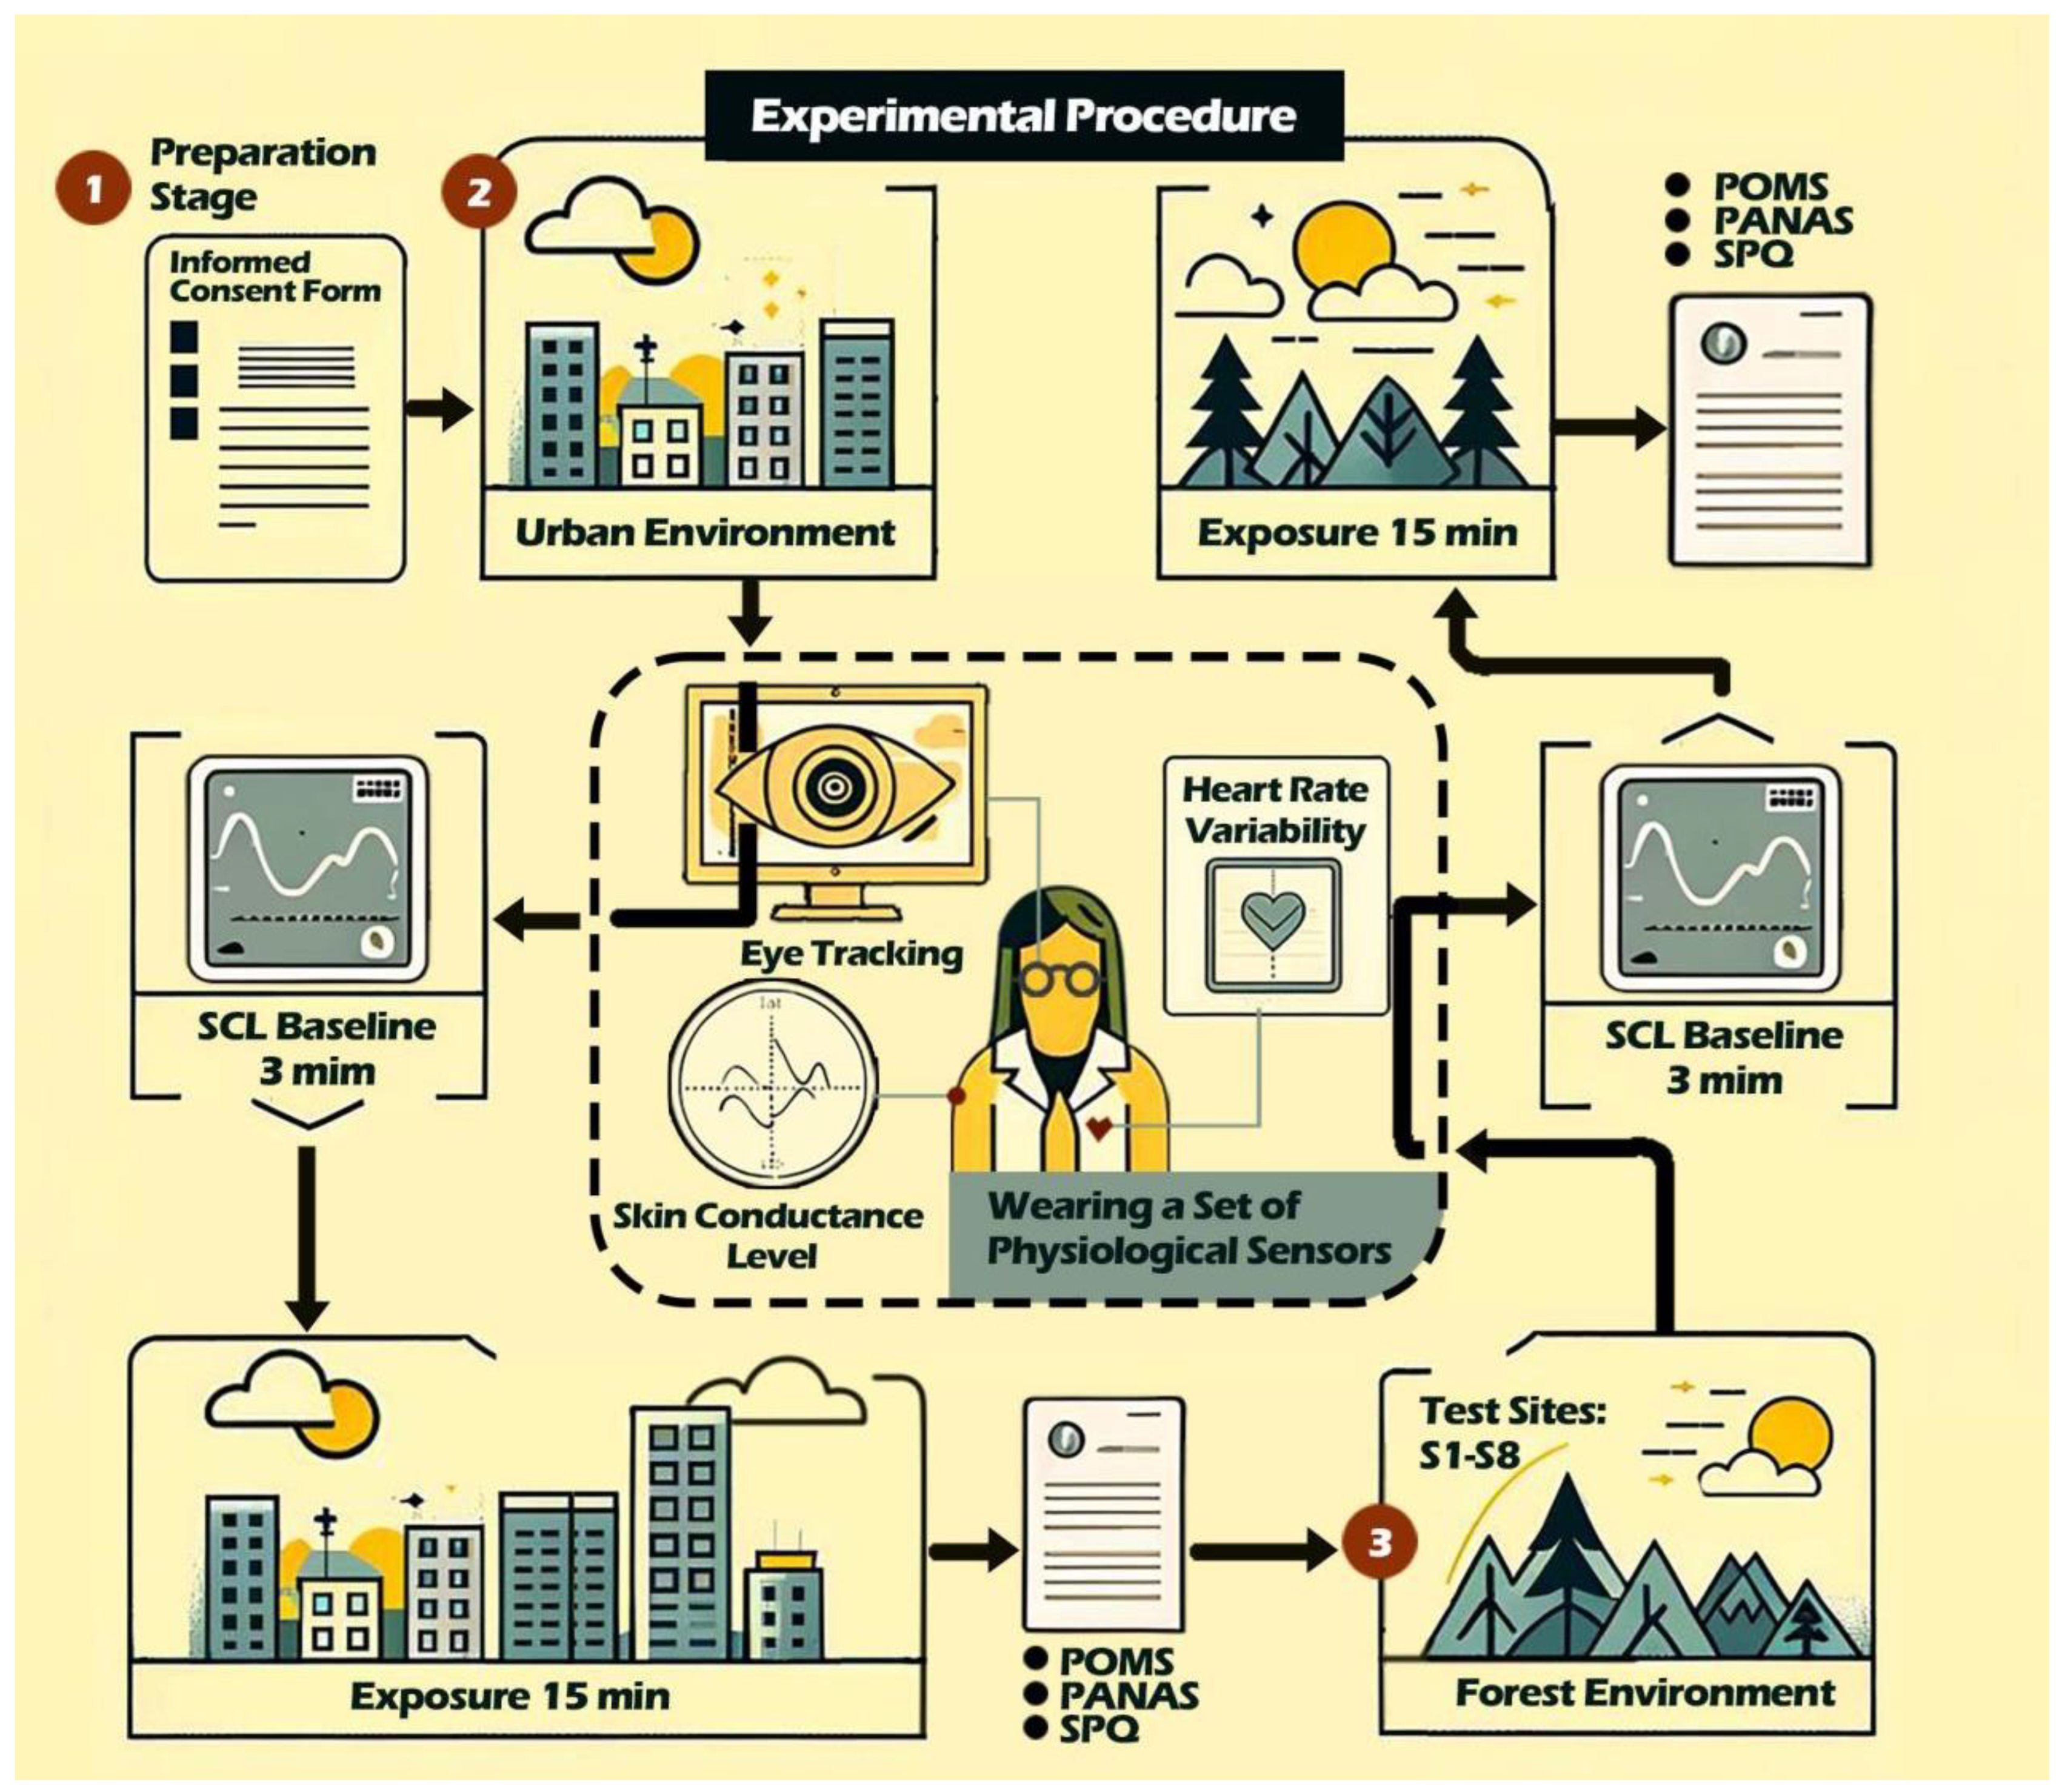
2.5. Experimental Procedure

The study was carried out from September to November, a period during which temperatures ranged between 16.5 °C and 26.1 °C. These conditions were characterized by predominantly cloudy or clear skies, providing optimal weather conditions for outdoor activities. The experimental sessions were scheduled daily from 8:30 AM to 4:30 PM, spanning three days and two nights. Each session included no more than six volunteers.
(1) In the preparatory phase, participants received briefings on the study’s objectives and procedures, as well as instructions regarding the equipment to be used. Following informed consent, demographic information and self-assessed health status were collected. (2) On the first morning, participants were escorted to the urban experimental area and equipped with eye-trackers and human factor recorders. After a 5 min period of calm, we collected the baseline skin conductance level (SCL) data for 3 min, during which participants were instructed to relax and refrain from speaking. Subsequently, participants engaged in a 15 min observation session of the environment. Following this, the equipment was removed, and participants filled out psychological assessment scales and a soundscape perception questionnaire. (3) After lunch, this procedure was replicated in a forest experimental area, continuing with identical protocols until 4:30 PM. These steps were repeated directly in the forest area on the second and third days. The experimental procedure is illustrated in Figure 3.
The study utilized a Latin square design across four experimental trials (A, B, C, and D) to ensure rational path selection and minimize potential environmental biases. Strict ethical standards were maintained throughout the study, ensuring all participation was fully informed and all potential risks were clearly communicated.

2.6. Data Preprocessing and Analysis

In this study, D-Lab v3.55 was employed to analyze and export eye-tracking data. The procedures involved playback of recordings, creation and editing of areas of interest (AOIs), and subsequent data export. AOIs were meticulously defined on a frame-by-frame basis using video materials. Additionally, ErgoLAB software (version 3.16) facilitated the extraction of signal characteristics and the export of other physiological data. The analysis focused on a 5 min segment of high-quality signal data collected from each participant. Data processing was performed using SPSS software version 23 (IBM, Armonk, NY, USA). Descriptive statistical analyses summarized the basic trends and distributions of the physiological, psychological, eye movement, and auditory indicators. Furthermore, stepwise multiple linear regression analyses were applied to investigate the impact of visual and soundscape elements on physiological and psychological indicators. Differences in the analyzed variables were considered statistically significant at a p-value of less than 0.05.

3. Results

3.1. Overview of Baseline Data

3.1.1. Visual Elements

This section presents an analysis of visual attention data, revealing the distribution characteristics of visual attention across various forest environments. Descriptive statistics for the number of gazes and mean gaze duration indicators are displayed in Table 6. At the Grassland Slopes (S1), observers predominantly focused on trees and rocks, with trees drawing an average of 19.93 glances and rocks receiving 18.76 glances. In the Broadleaf Forest Valley (S2), trees and buildings emerged as the primary focal points, with trees attracting 37.17 glances on average and buildings 29.27. Significantly, guide signs had the longest gaze duration, averaging 0.91 s, reflecting the visitors’ navigational and informational needs. The Mixed Broadleaf and Coniferous Forest Valley (S3) featured tea gardens as significant centers of visual interest, attributed to their unique cultural and aesthetic values. Here, tea gardens garnered an average of 27.05 glances, each with a duration of 0.40 s, demonstrating their strong visual and cultural appeal. Similarly, the Tea Gardens in the Valley (S6) attracted considerable attention, with 39.76 glances, each lasting 0.57 s. Broadleaf Ridge Forest (S4) was distinguished by the visual prominence of both distant mountains and bamboo rafts, both of which exhibited strong visual attraction. The distant mountains attracted the most attention, averaging 40.27 glances with a duration of 0.68 s, while the bamboo rafts maintained an average gaze duration of 1.04 s, emphasizing the appeal of dynamic landscape elements. In the Mixed Broadleaf and Coniferous Forest Slopes (S5), the interplay between trees and buildings significantly enhanced visual attraction, with trees and buildings attracting average gazes of 32.49 and 22.39 times, respectively, and durations of 0.55 and 0.52 s. This interaction further underscores the significant role that man-made elements play in enhancing the visual appeal of natural landscapes. The Broadleaf Forest Streamside (S7) and the Rock-Bedded Streamscape (S8) focused on streams, distant mountains, and cliff inscriptions as principal visual attractors. In S7, streams dominated visual attention, with an average of 38.83 glances and a duration of 0.55 s, while distant mountains provided crucial natural backdrops, attracting 20.27 glances with a duration of 0.43 s. In S8, streams and cliff inscriptions drew an average of 31.80 and 30.85 glances, respectively, with durations of 0.52 and 0.49 s.

3.1.2. Soundscape

This study evaluated the soundscape across various types of forest environments. Field measurements revealed that average sound levels, measured as LeqA, ranged from 33.73 dB to 48.34 dB. Notably, the Mixed Broadleaf and Coniferous Forest Valley (S3) exhibited the lowest sound levels, with an average LeqA of 38.01 dB. In contrast, the Broadleaf Ridge Forest (S4) recorded the highest sound levels, at an average of 48.34 dB, demonstrating significant dynamic variations. The ranking of sound levels across all sampled sites was as follows: S4 > S1 > S7 > S5 > S2 > S8 > S6 > S3. Importantly, sound levels at all sites remained below the daytime national noise limits of 50 dB for class 0 functional areas, such as sanatoriums and upscale residential zones.
Soundscape perception analysis revealed that the dominant soundscapes at the Grassland Slopes (S1) included: bird songs, human conversations, insect sounds, rustling leaves, and wind, encompassing both natural and human activity noises. In the Broadleaf Forest Valley (S2) and Mixed Broadleaf and Coniferous Forest Valley (S3), as well as the Tea Gardens of the Valley (S6), natural sounds predominated, with high perceptual dominance of insect sounds, bird songs, wind, rustling leaves, and water flows. Due to intense visitor activities, the Broadleaf Ridge Forest (S4) featured high perceptual frequencies of human-generated sounds, such as conversations and children playing, followed by bird songs, footsteps, and vendors’ calls. In the Mixed Broadleaf and Coniferous Forest Slopes (S5), soundscape perception analysis ranked soundscapes from highest to lowest dominance as follows: bird songs, conversations, insect sounds, flowing water, and children playing. The Broadleaf Forest Streamside (S7) and Rock-Bedded Streamscape (S8) near the Jiuqu Stream were primarily dominated by water flow and bamboo raft sounds, which highlighted the unique auditory characteristics of these areas, while other predominant soundscapes included bird songs, insect sounds, and wind. These results reflect the complexity and diversity of the soundscape within the study area. For a detailed analysis of soundscape perception, refer to Figure 4.

3.1.3. Physiological and Psychological Indicators

Table 7 presents the descriptive statistics for autonomic nervous system activities, specifically the low-frequency to high-frequency ratio (LF/HF) and root mean square of successive differences (RMSSD), along with skin conductance level (SCL), positive affect (PA), negative affect (NA), and total mood disturbance (TMD), measured across diverse forest settings.

3.2. Psychophysiological Effects of Visual and Soundscape Elements

3.2.1. Impact of Visual and Soundscape Elements on Physiological Responses

This section explores the effects of visual and auditory elements in natural settings on human physiological markers. Using stepwise regression analysis, we assessed how variables such as sound dominance degree (SDD), number of gazes (NG), and mean gaze duration (MGD) impacted autonomic nervous system activities, specifically LF/HF and RMSSD, as well as skin conductance levels (SCL).
Table 8 provides detailed results. In the Valley Broadleaf Forest (S2), the sounds of the wind and the number of gazes directed at buildings had a positive effect on RMSSD, accounting for 33.6% of the variance. These elements appeared to promote relaxation and stress reduction. Furthermore, visual attention to trees and streams significantly enhanced the skin conductance level, with an R2 of 0.203, highlighting the essential role of natural visual and auditory stimuli in modulating physiological arousal. In the Mixed Broadleaf and Coniferous Forest Valley (S3), birdsong and gazes toward distant mountains negatively influenced LF/HF, whereas the sounds of footsteps and prolonged gazes on distant mountains positively affected it, collectively accounting for 44.0% of the variance changes in LF/HF. In the Ridge Broadleaf Forest (S4), the sounds of wind and broadcasts, along with prolonged gazes at rocks, significantly negatively impacted LF/HF, explaining 33.5% of the variance. In contrast, visual attention to footsteps, streams, trees, and bamboo rafts had a notably positive effect on RMSSD (R2 = 0.499), demonstrating the vital importance of combining auditory and visual elements in natural settings to enhance psychophysiological health. The analysis in the Broadleaf Stream Forest (S7) revealed significant negative effects of bamboo raft audio-visual experiences on LF/HF (R2 = 0.359), further emphasizing the role of this unique tourist resource in balancing the autonomic nervous system. In the Rocky Stream Forest (S8), visual stimuli from the stream landscape significantly benefited RMSSD (R2 = 0.245), enhancing parasympathetic nerve activity. Additionally, auditory elements (such as the sound of the stream, children playing, footsteps, and bamboo rafts) and visual elements (such as rocks) significantly influenced the skin conductance level (R2 = 0.678), emphasizing how the landscapes, natural sounds, and anthropogenic noises in these specific forest environments contribute to lowering physiological arousal levels and fostering relaxation.
Furthermore, in the Grassland Slopes (S1), prolonged gazes at rocky landscapes significantly negatively impacted LF/HF ratios, while human speech notably decreased the parasympathetic activity index, RMSSD. These findings suggest that auditory disturbances could impede relaxation in this environment. In similar studies conducted in both the Mixed Broadleaf and Coniferous Forest Slopes (S5) and the Valley’s Tea Gardens (S6), bird songs were found to have a beneficial effect on reducing stress, as indicated by their positive impact on lowering LF/HF ratios and enhancing SCL. In the Valley Tea Gardens (S6), visual engagement with tea garden landscapes significantly enhanced RMSSD, highlighting the positive effects of visual stimuli on parasympathetic nerve activity. While the results have certain limitations in terms of explaining variations in the model, they still offer insightful observations on the intricate ways that sensory elements in various forest settings influence human physiological responses.

3.2.2. Impact of Visual and Soundscape Elements on Psychological Responses

This section explores the impact of various natural and anthropogenic sounds, along with visual elements of the landscape, on mood states. Detailed findings are presented in Table 9. In the Mixed Broadleaf and Coniferous Forest Valley (S3), visual stimuli from distant mountains significantly reduced total mood disturbance, highlighting the importance of expansive views in modulating mood and enhancing psychological health. In contrast, visual attention to walking trails appeared to aggravate mood disorders. Collectively, these factors accounted for 29.5% of the variance in total mood disturbance. At the Broadleaf Forest Streamside (S7), the sound of flowing water significantly uplifted positive affect, whereas the sound of footsteps significantly diminished it, together explaining 34.0% of the changes in positive affect. This underscores the pivotal role of natural sounds in promoting positive emotions and psychological well-being. In the Rock-bedded Streamscape (S8), both the sounds of flowing water and the visual attention to rocks significantly boosted positive affect (R2 = 0.299), further confirming the effectiveness of natural environmental elements in improving individual psychological health.
Furthermore, although R2 provides limited explanatory utility, the study still revealed further insights. In the Grassland Slopes (S1), broadcast sound coupled with visual attention to the grass significantly reduced negative affect. In the Broadleaf Forest Valley (S2), visual focus on streams and guide signs notably enhanced positive affect. Similarly, in the Mixed Broadleaf and Coniferous Forest Slopes (S5), conversational voices significantly increased negative affect. In the Tea Gardens of the Valley (S6), the sound of flowing water profoundly increased positive affect. Meanwhile, airplane noise led to an increase in total mood disturbance.

4. Discussion

4.1. Audio-Visual Perception and Physiological Responses

This study confirmed Hypothesis 1, demonstrating the significant regulatory effects of visual and auditory elements in natural settings on the autonomic nervous system and physiological arousal levels. The Stress Reduction Theory posits that specific natural features, such as vegetation and water, capture individual attention and effectively block negative thoughts. This focus reduces stress levels and fosters the development of positive emotions, positively affecting physiological health. Previous studies have indicated that high biodiversity enhances nature connectedness, which significantly improves the emotional and psychological health benefits for individuals in green spaces [67]. Moreover, experiences of natural visual and auditory elements, such as bird songs and the sounds of flowing water, markedly promote stress recovery and health benefits [18,25,30,68]. The synergy between visual and auditory elements in natural environments is crucial for public health benefits [37,40]. This study not only supports the theoretical framework of SRT and its associated academic achievements but also expands existing research. The findings indicated that visual elements in natural settings, such as majestic distant mountains, Danxia landforms, lush trees, and clear streams, alongside soundscapes featuring pleasing bird calls, soft water flows, bamboo raft sounds, and the rustling of leaves, significantly lowered physiological arousal levels. These elements also positively regulated heart rate variability and enhanced the body’s capacity to adapt to stress and quicken mood recovery.
In previous studies, we established that, compared to urban environments, the Tea Gardens of the Valley (S6) and the Broadleaf Forest Streamside (S7) significantly positively impacted autonomic nervous balance. Similarly, the Rock-Bedded Streamscape (S8) was notably effective in maintaining a calm and relaxed state of low arousal, as documented in [69]. This study further investigated the effects of these environments. Notably, in S6, the landscape of the tea garden, characterized by its unique cultural and ecological aesthetic values, was identified as a critical factor in activating the parasympathetic nervous system, demonstrating its substantial potential as a therapeutic landscape. Additionally, the auditory and visual experiences of streams, rocks, flowing water, and bamboo rafts were crucial in enhancing physiological health in riparian forest recreational settings. These findings provide valuable insights into the complex mechanisms by which natural water features contribute to promoting health and well-being.
Although artificial landscape elements frequently receive negative evaluations [70], empirical studies demonstrate that features associated with Chinese culture significantly enhance visitors’ sense of place attachment and identity. These include heritage trees, bamboo groves, historical buildings, poetic scenery walls, and pavilions, all of which incorporate traditional architectural styles and unique cultural characteristics. These elements also significantly contribute to enhancing subjective restoration [21,32,71]. Moreover, these elements serve not only as vessels of cultural legacy but also as pivotal components in enriching environmental aesthetics and elevating visitor satisfaction. Our study revealed that specific artificial features, such as the broadcast of classical music, temples, and historical pavilions, can effectively stimulate the parasympathetic nervous system. This underscores not only the profound influence of traditional Chinese aesthetic sensibilities but also underscores the imperative of integrating humanistic and audio-visual landscape elements within the management and planning frameworks of national parks and other conservation zones. Through meticulous design and strategic planning, these artificial landscape components not only elevate the holistic visitor experience but also foster psychological and physiological well-being. Furthermore, it is posited that the backgrounds and preferences of participants may influence their perceptions and responses to these artificial elements. The cultural milieu, life experiences, and individual predilections may shape how these specific landscape features are perceived and evaluated. Hence, recognizing and accommodating the diversity among the target visitor demographic is crucial in the design of these cultural elements. By thoroughly considering these factors, we can more effectively meet the varied needs of a broad spectrum of visitors, while also preserving and enhancing the cultural and historical integrity of the setting.
In terms of visual processing, especially observed within the Rock-Bedded Streamscape (S8), the number of gazes at these landscapes inversely correlated with the activation of the parasympathetic nervous system, while directly correlating with the average duration of each gaze. This pattern supports the perspective that viewing natural landscapes typically results in longer gaze durations and fewer instances of gazing [24,27,72]. The efficiency of this visual processing implies a reduced cognitive effort in managing visual information, thereby aiding in attentional restoration.
On the impact of soundscapes, our research underscores that in the context of Sloped Grasslands (S1), conversational sounds may reduce parasympathetic nervous activity. This observation contrasts with previous studies suggesting that human voices within forested settings can impart a sense of security [37]. We posit that this variance stems from the distinct characteristics of different environmental settings. In the tranquil setting of sloped grasslands, where the background noise measures only 40 dBA, sudden human voices can be noticeably disruptive. Conversely, in denser, more natural forest environments, these voices might foster a sense of security and mitigate safety concerns. This finding highlights the critical importance of considering the interplay between sound and its environmental context. The influence of a soundscape extends beyond the mere acoustic properties of the sound—it is also shaped by the environmental context and the psychological state of the individual.

4.2. Audio-Visual Perception and Psychological Restoration

Our research has identified specific visual elements in natural environments, such as streams and rocks—particularly those characteristic of the Danxia landforms. These elements significantly foster the formation of positive emotions. These elements are valued not only for their aesthetic appeal but also for their capacity to evoke deep emotional resonance with nature, thereby enhancing psychological health and emotional recovery. Furthermore, visual attention to lawns has been demonstrated to markedly alleviate negative emotions, highlighting the critical role of green spaces in maintaining psychological balance and facilitating emotional restoration. This aligns with the findings of Cao et al. [73]. Our further analysis suggested a significant relationship between visual attention and mood states. Specifically, we found that prolonged gazes on walking trails might induce mood disturbances. Conversely, enhanced focus on guide signs correlated closely with the emergence of positive emotions. We posit that this difference arises from the cognitive and emotional mechanisms underlying the gazing behavior: attention to walking trails likely indicates a need for spatial orientation within complex natural settings, accompanied by a minor cognitive load, while focus on guide signs provides emotional security, reduces the burden of navigation, and may even stimulate the enjoyment of exploration and learning, thus fostering positive emotions. Moreover, we have discovered that particular visual elements, such as distant mountains and streams, can lead individuals to experience profound tranquility and peace, aiding in the regulation and balancing of mood states. These observations support the Prospect-Refuge Theory proposed by Appleton, which posits an innate human preference for habitats that provide good visibility and concealment opportunities, such as hills, high mountains, and the canopies of tall trees [74].
In terms of soundscape, we found that the soothing sounds of flowing water in riparian forest recreational areas facilitated psychological healing and enhanced positive emotions. This finding corroborates previous studies [21,22,33,35,58], which have demonstrated the positive effects of natural audio-visual experiences on mental health. Notably, certain artificial sounds, such as classical music played on Grassland Slopes (S1), have shown potential in mitigating negative emotions and enhancing positive ones, supporting the notion that classical music can significantly boost the restorative power of green spaces [43]. Conversely, exposure to airplane noise may intensify mood disturbances, highlighting the stark contrast in emotional dynamics between natural sounds and intrusive artificial noises.
Overall, these findings affirmed Hypothesis 2, enriching our understanding of how visual and auditory elements regulate emotions and contribute to mental health in natural settings. Additionally, these findings may provide some insights into the design of therapeutic forest settings, advocating for the incorporation of diverse sensory elements that cultivate positive emotions and facilitate attentional recharging.

4.3. Design Strategies

The above results validated that forest environments are able to enhance health benefits, such as regulating heart rate and mood, via human visual and auditory perception. Drawing from empirical research findings, this section proposes specific key design points and strategies to amplify visual and auditory perception. Further details are provided in Table 10.

5. Limitations and Future Studies

While our study provides some insights, it is important to acknowledge its inherent limitations. (1) Due to time, budget, and design constraints, this study was limited to participants aged 21 to 55, which may narrow the scope of the findings. Future research should include a broader age range, from children to the elderly, to fully assess the impact of natural environments across different life stages. (2) This study was conducted in autumn and did not consider how seasonal changes might affect plant coloration and landscape attractiveness. Future research should include seasonal variations to fully understand the benefits of nature therapy throughout the year. (3) Although this research investigated various visual and auditory elements, it did not sufficiently analyze their interactive or synergistic impacts. Future studies should use more approaches, such as simulated laboratory experiments or field studies, to assess the combined effects of these elements and their interactions within different forest environments. (4) The study used stepwise multivariate linear regression analyses to explore variable associations yet failed to fully elucidate complex causal relationships. Future research should employ diverse methodologies, including randomized controlled trials (RCTs) for causality, structural equation modeling (SEM) for direct and indirect relationships, and systemic dynamic models for long-term intervention effects’ prediction.

6. Conclusions

This study provided initial observations for forest therapy management, public green space planning, and tourism resource development, particularly in terms of optimizing natural visual and auditory elements. The main conclusions are as follows:
(1)
Natural visual and auditory stimuli significantly improved autonomic nervous system regulation and reduce emotional arousal. For example, in the Broadleaf Forest Valley, the sound of wind notably increased the heart rate variability index, RMSSD, and visual interactions with trees and streams led to a marked decrease in the skin conductance level. Birdsong demonstrated a significant stress-reduction effect on the LF/HF ratio and skin conductance level in the Mixed Broadleaf and Coniferous Forest Valley, the slopes of the Mixed Broadleaf and Coniferous Forest, and the Tea Gardens of the Valley. Additionally, visual focus on distant mountains in the Mixed Broadleaf and Coniferous Forest Slopes notably decreased the LF/HF ratios. Likewise, in the Rock-Bedded Streamscape, visual stimuli from the stream landscape significantly enhanced the RMSSD, and extended observation of rocky landscapes in the Grassland Slopes substantially reduced LF/HF ratios.
(2)
Natural visual and auditory elements significantly promoted positive mood states. For instance, the sound of flowing water significantly boosted positive affect in locations such as the Tea Gardens of the Valley, Broadleaf Forest Streamside, and Rock-bedded Streamscape. Visual focus on the grassland in the Grassland Slopes notably reduced negative affect. Attention to distant mountains in the Mixed Broadleaf and Coniferous Forest Valley significantly mitigated total mood disturbance.
(3)
Specific artificial elements within forest environments played a promotive role in enhancing positive mood states and physiological well-being. In the Broadleaf Forest Valley, visual attention to architectural features, such as temples and ancient pavilions, as well as to guide signs, positively impacted the physiological and mood states of visitors. This suggests that artificial elements can also augment experiences within natural settings.
(4)
Distinctive cultural landscapes and ecological resources had a significant positive impact on the regulation of autonomic nervous system balance and emotional arousal. For example, auditory and visual experiences with bamboo rafts in locations such as the Broadleaf Ridge Forest, Broadleaf Forest Streamside, and Rock-bedded Streamscape significantly influenced physiological indices, such as RMSSD, LF/HF, and the skin conductance level. Moreover, viewing tea plantation landscapes in the Tea Gardens of the Valley significantly heightened parasympathetic nervous activity, as indicated by RMSSD.
(5)
Artificial noises such as aircraft and conversational sounds negatively impacted mood states and physiological responses, while broadcasts of classical music and sounds of children playing may alleviate negative affect and reduce physiological stress.

Author Contributions

Conceptualization, Y.W. and J.D.; methodology, Y.W. and Y.Z.; investigation, Y.W., Y.Z., Q.C., S.M. and M.W.; formal analysis, Y.W.; visualization, Y.W. and Q.C.; writing—original draft preparation, Y.W., Q.C., Y.Z. and K.L.; writing—review and editing, Y.W., Y.Z., Q.C., S.M. and K.L.; supervision, J.D.; funding acquisition, Y.W. and J.D. All authors have read and agreed to the published version of the manuscript.

Funding

This research was funded by the Scientific Research Project of the Fujian Provincial Department of Education, grant number JAT220225, the 2024 Open Research Project of the Design Innovation Research Center of Humanities and Social Sciences Research Base of Colleges and Universities in Fujian Province, grant number KF-20-24115, and the Fujian University of Technology’s Research Start-up Fund Project, grant number GY-Z220220.

Data Availability Statement

The data presented in this study are available on request from the corresponding author due to the involvement of on-going research.

Acknowledgments

We sincerely express our heartfelt gratitude to all the volunteers for their precious time and efforts devoted to this research. The contributions of everyone involved have been pivotal in advancing our research.

Conflicts of Interest

The authors declare no conflict of interest.

References

  1. Cox, D.T.C.; Shanahan, D.F.; Hudson, H.L.; Fuller, R.A.; Gaston, K.J. The Impact of Urbanisation on Nature Dose and the Implications for Human Health. Landsc. Urban Plan. 2018, 179, 72–80. [Google Scholar] [CrossRef]
  2. Corvalan, C.; Gray, B.; Villalobos Prats, E.; Sena, A.; Hanna, F.; Campbell-Lendrum, D. Mental health and the global climate crisis. Epidemiol. Psychiatr. Sci. 2022, 31, e86. [Google Scholar] [CrossRef] [PubMed]
  3. Ferrari, A.; Santomauro, D.; Herrera, A.; Shadid, J.; Ashbaugh, C.; Erskine, H.; Charlson, F.; Degenhardt, L.; Scott, J.; McGrath, J.; et al. Global, Regional, and National Burden of 12 Mental Disorders in 204 Countries and Territories, 1990–2019: A Systematic Analysis for the Global Burden of Disease Study 2019. Lancet Psychiatry 2022, 9, 137–150. [Google Scholar] [CrossRef]
  4. Santomauro, D.; Mantilla Herrera, A.; Shadid, J.; Zheng, P.; Ashbaugh, C.; Pigott, D.; Cristiana, A.; Adolph, C.; Amlag, J.; Aravkin, A.; et al. Global prevalence and burden of depressive and anxiety disorders in 204 countries and territories in 2020 due to the COVID-19 pandemic. Lancet 2021, 398, 1700–1712. [Google Scholar] [CrossRef] [PubMed]
  5. Zhao, Y.; Smith, J.; Strauss, J. Can China age healthily? Lancet 2014, 384, 723–724. [Google Scholar] [CrossRef]
  6. Abdoli, N.; Salari, N.; Darvishi, N.; Jafarpour, S.; Solaymani, M.; Mohammadi, M.; Shohaimi, S. The Global Prevalence of Major Depressive Disorder (MDD) Among the Elderly: A Systematic Review and Meta-Analysis. Neurosci. Biobehav. Rev. 2022, 132, 1067–1073. [Google Scholar] [CrossRef]
  7. Huang, R.; Li, A.; Li, Z.; Chen, Z.; Zhou, B.; Wang, G. Adjunctive Therapeutic Effects of Forest Bathing Trips on Geriatric Hypertension: Results from an On-Site Experiment in the Cinnamomum camphora Forest Environment in Four Seasons. Forests 2022, 14, 75. [Google Scholar] [CrossRef]
  8. Tsao, T.-M.; Hwang, J.-S.; Lin, S.-T.; Wu, C.; Tsai, M.-J.; Su, T.-C. Forest Bathing Is Better than Walking in Urban Park: Comparison of Cardiac and Vascular Function between Urban and Forest Parks. Int. J. Environ. Res. Public Health 2022, 19, 3451. [Google Scholar] [CrossRef] [PubMed]
  9. Li, Q.; Otsuka, T.; Kobayashi, M.; Wakayama, Y.; Inagaki, H.; Katsumata, M.; Hirata, Y.; Li, Y.; Hirata, K.; Shimizu, T.; et al. Acute Effects of Walking in Forest Environments on Cardiovascular and Metabolic Parameters. Eur. J. Appl. Physiol. 2011, 111, 2845–2853. [Google Scholar] [CrossRef]
  10. Oomen-Welke, K.; Schlachter, E.; Hilbich, T.; Naumann, J.; Mueller, A.; Hinterberger, T.; Huber, R. Spending Time in the Forest or the Field: Investigations on Stress Perception and Psychological Well-Being—A Randomized Cross-Over Trial in Highly Sensitive Persons. Int. J. Environ. Res. Public Health 2022, 19, 15322. [Google Scholar] [CrossRef]
  11. Song, C.; Ikei, H.; Kagawa, T.; Miyazaki, Y. Effects of Walking in a Forest on Young Women. Int. J. Environ. Res. Public Health 2019, 16, 229. [Google Scholar] [CrossRef] [PubMed]
  12. Li, Q.; Morimoto, K.; Kobayashi, M.; Inagaki, H.; Katsumata, M.; Hirata, Y.; Hirata, K.; Suzuki, H.; Li, Y.J.; Wakayama, Y.; et al. Visiting a Forest, but Not a City, Increases Human Natural Killer Activity and Expression of Anti-Cancer Proteins. Int. J. Immunopathol. Pharmacol. 2008, 21, 117–127. [Google Scholar] [CrossRef] [PubMed]
  13. Zhang, S.; Tan, Y.; Yuan, J. Psychophysiological Effects of a Natural Forest Environment on Chinese University Students Aged 19–25 Years. J. Sustain. For. 2022, 42, 986–1003. [Google Scholar] [CrossRef]
  14. McEwan, K.; Potter, V.; Kotera, Y.; Jackson, J.; Greaves, S. ‘This Is What the Colour Green Smells Like!’: Urban Forest Bathing Improved Adolescent Nature Connection and Wellbeing. Int. J. Environ. Res. Public Health 2022, 19, 15594. [Google Scholar] [CrossRef] [PubMed]
  15. Li, Q.; Ochiai, H.; Ochiai, T.; Takayama, N.; Kumeda, S.; Miura, T.; Aoyagi, Y.; Imai, M. Effects of Forest Bathing (Shinrin-Yoku) on Serotonin in Serum, Depressive Symptoms and Subjective Sleep Quality in Middle-Aged Males. Environ. Health Prev. Med. 2022, 27, 44. [Google Scholar] [CrossRef] [PubMed]
  16. Furuyashiki, A.; Tabuchi, K.; Norikoshi, K.; Kobayashi, T.; Oriyama, S. A Comparative Study of the Physiological and Psychological Effects of Forest Bathing (Shinrin-Yoku) on Working Age People With and Without Depressive Tendencies. Environ. Health Prev. Med. 2019, 24, 46. [Google Scholar] [CrossRef] [PubMed]
  17. Ulrich, R. Natural Versus Urban Scenes: Some Psychophysiological Effects. Environ. Behav. 1981, 13, 523–556. [Google Scholar] [CrossRef]
  18. Ulrich, R.; Simons, R.; Losito, B.; Fiorito, E.; Miles, M.; Zelson, M. Stress Recovery During Exposure to Natural and Urban Environments. J. Environ. Psychol. 1991, 11, 201–230. [Google Scholar] [CrossRef]
  19. Grahn, P.; Stigsdotter, U. The Relation Between Perceived Sensory Dimensions of Urban Green Space and Stress Restoration. Landsc. Urban Plan. 2010, 94, 264–275. [Google Scholar] [CrossRef]
  20. Nordh, H.; Hartig, T.; Hägerhäll, C.; Fry, G. Components of Small Urban Parks That Predict the Possibility for Restoration. Urban For. Urban Green. 2009, 8, 225–235. [Google Scholar] [CrossRef]
  21. Deng, L.; Li, X.; Luo, H.; Fu, E.-K.; Ma, J.; Sun, L.-X.; Huang, Z.; Cai, S.-Z.; Jia, Y. Empirical Study of Landscape Types, Landscape Elements, and Landscape Components of the Urban Park Promoting Physiological and Psychological Restoration. Urban For. Urban Green. 2019, 48, 126488. [Google Scholar] [CrossRef]
  22. White, M.; Smith, A.; Humphryes, K.; Pahl, S.; Cracknell, D.; Depledge, M. Blue Space: The importance of water for preferences, affect and restorativeness ratings of natural and built scenes. J. Environ. Psychol. 2010, 30, 482–493. [Google Scholar] [CrossRef]
  23. Stevenson, M.; Dewhurst, R.; Schilhab, T.; Bentsen, P. Cognitive Restoration in Children Following Exposure to Nature: Evidence From the Attention Network Task and Mobile Eye Tracking. Front. Psychol. 2019, 10, 42. [Google Scholar] [CrossRef] [PubMed]
  24. Franěk, M.; Petruzalek, J.; Šefara, D. Eye Movements in Viewing Urban and Natural Images Across Diverse Vegetation Periods. Urban For. Urban Green. 2019, 46, 126477. [Google Scholar] [CrossRef]
  25. Nordh, H.; Hägerhäll, C.; Holmqvist, K. Tracking Restorative Components: Patterns in Eye Movements as a Consequence of a Restorative Rating Task. Landsc. Res. 2012, 38, 101–116. [Google Scholar] [CrossRef]
  26. Elsadek, M.; Sun, M.; Fujii, E. Psycho-Physiological Responses to Plant Variegation as Measured Through Eye Movement, Self-Reported Emotion and Cerebral Activity. Indoor Built Environ. 2016, 26, 758–770. [Google Scholar] [CrossRef]
  27. Fei, X.; Zhang, Y.; Kong, D.; Huang, Q.; Wang, M.; Dong, J. Quantitative Model Study of the Psychological Recovery Benefit of Landscape Environment Based on Eye Movement Tracking Technology. Sustainability 2023, 15, 11250. [Google Scholar] [CrossRef]
  28. ISO 12913-1:2014; Acoustics-Soundscape-Part 1: Definition and Conceptual Framework. British Standards Institution: London, UK, 2014.
  29. Kang, J.; Ma, H.; Xie, H.; Zhang, Y.; Li, Z. Research Progress on the Acoustic Environments of Healthy Buildings. Chin. Sci. Bull. 2020, 65, 288–299. [Google Scholar] [CrossRef]
  30. Alvarsson, J.; Wiens, S.; Nilsson, M. Stress Recovery during Exposure to Nature Sound and Environmental Noise. Int. J. Environ. Res. Public Health 2010, 7, 1036–1046. [Google Scholar] [CrossRef]
  31. Ratcliffe, E.; Gatersleben, B.; Sowden, P. Bird Sounds and Their Contributions to Perceived Attention Restoration and Stress Recovery. J. Environ. Psychol. 2013, 36, 221–228. [Google Scholar] [CrossRef]
  32. Sun, M.; Dong, L. Impact of the Classic Chinese Garden Soundscape With Focus on Physiological and Psychological Effects, Tested Through Eye-Tracking, and Subjective Evaluation. Front. Psychol. 2022, 13, 902630. [Google Scholar] [CrossRef] [PubMed]
  33. Park, S.H.; Lee, P.; Jung, T.; Swenson, A. Effects of the Aural and Visual Experience on Psycho-Physiological Recovery in Urban and Rural Environments. Appl. Acoust. 2020, 169, 107486. [Google Scholar] [CrossRef]
  34. Uebel, K.; Marselle, M.; Dean, A.; Rhodes, J.; Bonn, A. Urban Green Space Soundscapes and Their Perceived Restorativeness. People Nat. 2021, 3, 756–769. [Google Scholar] [CrossRef]
  35. Liu, J.; Guo, X.; Hong, X.; Zhang, X. The Impact of Individual Factors on Perceived Soundscape Restorativeness in Urban Parks. Chin. Landsc. Archit. 2022, 38, 40–45. [Google Scholar] [CrossRef]
  36. Annerstedt, M.; Jönsson, P.; Wallergård, M.; Johansson, G.; Karlson, B.; Grahn, P.; Hansen, Å.M.; Währborg, P. Inducing Physiological Stress Recovery With Sounds of Nature in a Virtual Reality Forest—Results From a Pilot Study. Physiol. Behav. 2013, 118, 240–250. [Google Scholar] [CrossRef] [PubMed]
  37. Liu, Y.; Mengjun, H.; Zhao, B. Audio-Visual Interactive Evaluation of Forest Landscapes Based on Eye-Tracking Experiments. Urban For. Urban Green. 2019, 46, 126476. [Google Scholar] [CrossRef]
  38. Hong, X.-C.; Cheng, S.; Liu, J.; Dang, E.; Wang, J.-B.; Cheng, Y. The Physiological Restorative Role of Soundscape in Different Forest Structures. Forests 2022, 13, 1920. [Google Scholar] [CrossRef]
  39. Zhu, Y.; Huang, N.; Weng, Y.; Tong, H.; Wang, X.; Chen, J.; Liu, J.; Chen, Z.; Dong, J.; Wang, M. Does Soundscape Perception Affect Health Benefits, as Mediated by Restorative Perception? Forests 2023, 14, 1798. [Google Scholar] [CrossRef]
  40. Zhu, Y.; Weng, Y.; Fu, W.; Dong, J.; Wang, M. Effects of Soundscape Perception on Health Benefits of Forest Parks: A Case Study of Fuzhou National Forest Park. Sci. Silvae Sin. 2021, 57, 9–17. [Google Scholar] [CrossRef]
  41. Carles, J.L.; Barrio, I.L.; de Lucio, J.V. Sound influence on landscape values. Landsc. Urban Plan. 1999, 43, 191–200. [Google Scholar] [CrossRef]
  42. Jahncke, H.; Eriksson, K.; Naula, S. The Effects of Auditive and Visual Settings on Perceived Restoration Likelihood. Noise Health 2015, 17, 1–10. [Google Scholar] [CrossRef] [PubMed]
  43. Zhao, J.; Xia, T. Effects of Soundscape on Mental Restoration in Urban Green Space. Landsc. Archit. 2019, 26, 83–88. [Google Scholar] [CrossRef]
  44. Shao, Y.; Hao, Y.; Yin, Y.; Meng, Y.; Xue, Z. Improving Soundscape Comfort in Urban Green Spaces Based on Aural-Visual Interaction Attributes of Landscape Experience. Forests 2022, 13, 1262. [Google Scholar] [CrossRef]
  45. Wang, R.; Zhao, J. A Good Sound in the Right Place: Exploring the Effects of Auditory-Visual Combinations on Aesthetic Preference. Urban For. Urban Green. 2019, 43, 126356. [Google Scholar] [CrossRef]
  46. Erfanian, M.; Mitchell, A.; Kang, J.; Aletta, F. The Psychophysiological Implications of Soundscape: A Systematic Review of Empirical Literature and a Research Agenda. Int. J. Environ. Res. Public Health 2019, 16, 3533. [Google Scholar] [CrossRef] [PubMed]
  47. Zhang, L.; Shao, L.; Feng, S. Classification of Natural Landscape along the Linear Heritage—A Case Study of Chinese Eastern Railway. Chin. Landsc. Archit. 2016, 32, 84–88. [Google Scholar]
  48. Kang, H. Sample size determination and power analysis using the G*Power software. J. Educ. Eval. Health Prof. 2021, 18, 17. [Google Scholar] [CrossRef] [PubMed]
  49. Faul, F.; Erdfelder, E.; Lang, A.-G.; Buchner, A. G*Power 3: A flexible statistical power analysis program for the social, behavioral, and biomedical sciences. Behav. Res. Methods 2007, 39, 175–191. [Google Scholar] [CrossRef] [PubMed]
  50. De Lucio, J.V.; Mohamadian, M.; Ruiz, J.P.; Banayas, J.; Bernaldez, F.G. Visual landscape exploration as revealed by eye movement tracking. Landsc. Urban Plan. 1996, 34, 135–142. [Google Scholar] [CrossRef]
  51. Dupont, L.; Antrop, M.; Van Eetvelde, V. Eye-tracking Analysis in Landscape Perception Research: Influence of Photograph Properties and Landscape Characteristics. Landsc. Res. 2014, 39, 417–432. [Google Scholar] [CrossRef]
  52. Cottet, M.; Vaudor, L.; Tronchère, H.; Roux-Michollet, D.; Augendre, M.; Brault, V. Using gaze behavior to gain insights into the impacts of naturalness on city dwellers’ perceptions and valuation of a landscape. J. Environ. Psychol. 2018, 60, 9–20. [Google Scholar] [CrossRef]
  53. Liu, B.; Fan, R. Experiment and Analysis of Visual Attraction Mechanism in Landscape Space. Chin. Landsc. Archit. 2014, 30, 33–36. [Google Scholar]
  54. Weng, Y.; Zhu, Y.; Dong, J.; Wang, M.; Dong, J. Effects of Soundscape on Emotion and Attention on Campus Green Space—A Case Study of Fujian Agriculture and Forestry University. Chin. Landsc. Archit. 2021, 37, 88–93. [Google Scholar] [CrossRef]
  55. Amati, M.; Ghanbari Parmehr, E. How Eye-catching are Natural Features When Walking Through a Park? Eye-tracking Responses to Videos of Walks. Urban For. Urban Green. 2018, 31, 67–78. [Google Scholar] [CrossRef]
  56. ISO/TS 12913-2:2018; Acoustics—Soundscape Part 2: Data collection and reporting requirements. International Organization for Standardization (ISO): Geneva, Switzerland, 2018.
  57. Liu, J.; Yang, L.; Huang, L. Research on the Influential Factors of Soundscape Experience in Urban Ecological Park. Landsc. Archit. 2019, 26, 89–93. [Google Scholar] [CrossRef]
  58. Xu, X.; Guo, X.; Han, F.; Guo, G. Research of Soundscape Perception in Wulingyuan World Heritage Site and Influence Factor. Landsc. Archit. 2019, 26, 97–102. [Google Scholar] [CrossRef]
  59. Liu, J.; Wang, Y.; Kang, J.; Yu, T.; Zimmer, C. Factors Associated with Soundscape Experiences in Urban Green Spaces: A Case Study in Rostock, Germany. Urban For. Urban Green. 2017, 37, 135–146. [Google Scholar] [CrossRef]
  60. Fujimura, T.; Okanoya, K. Heart Rate Variability Predicts Emotional Flexibility in Response to Positive Stimuli. Psychology 2012, 3, 578–582. [Google Scholar] [CrossRef]
  61. Ge, Y.; Chen, Y.; Liu, Y.F.; Li, W.; Sun, X. Electrophysiological Measures Applied in User Experience Studies. Adv. Psychol. Sci. 2014, 22, 959–967. [Google Scholar] [CrossRef]
  62. Mark, A.L.; Victor, R.; Nerhed, C.; Wallin, G. Microneurographic Studies of the Mechanisms of Sympathetic Nerve Responses to Static Exercise in Humans. Circ. Res. 1985, 57, 461–469. [Google Scholar] [CrossRef]
  63. Searight, H.R.; Montone, K. Profile of Mood States. In Encyclopedia of Personality and Individual Differences; Zeigler-Hill, V., Shackelford, T.K., Eds.; Springer International Publishing: Cham, Switzerland, 2020; pp. 4057–4062. [Google Scholar]
  64. Zhu, B. Brief Introduction of POMS Scale and Its Model for China. J. Tianjin Univ. Sport 1995, 10, 35–37. [Google Scholar] [CrossRef]
  65. Watson, D.; Clark, L.; Tellegen, A. Development and Validation of Brief Measures of Positive and Negative Affect: The PANAS Scales. J. Pers. Soc. Psychol. 1988, 54, 1063–1070. [Google Scholar] [CrossRef] [PubMed]
  66. Huang, L.; Yang, T.; Ji, Z. Applicability of the Positive and Negative Affect Scale in Chinese. Chin. Ment. Health J. 2003, 17, 54–56. [Google Scholar]
  67. Gong, C.; Yang, R.; Li, S. The Role of Urban Green Space in Promoting Health and Well-Being Is Related to Nature Connectedness and Biodiversity: Evidence from a Two-Factor Mixed-Design Experiment. Landsc. Urban Plan. 2024, 245, 105020. [Google Scholar] [CrossRef]
  68. Medvedev, O.; Shepherd, D.; Hautus, M. The Restorative Potential of Soundscapes: A Physiological Investigation. Appl. Acoust. 2015, 96, 20–26. [Google Scholar] [CrossRef]
  69. Weng, Y.; Zhu, Y.; Huang, Y.; Chen, Q.; Dong, J. Empirical Study on the Impact of Different Types of Forest Environments in Wuyishan National Park on Public Physiological and Psychological Health. Forests 2024, 15, 393. [Google Scholar] [CrossRef]
  70. De Vries, S.; De Groot, M.; Boers, J. Eyesores in Sight: Quantifying the Impact of Man-Made Elements on the Scenic Beauty of Dutch Landscapes. Landsc. Urban Plan. 2012, 105, 118–127. [Google Scholar] [CrossRef]
  71. Xie, J.; Luo, S.; Furuya, K.; Kagawa, T.; Yang, M. A Preferred Road to Mental Restoration in the Chinese Classical Garden. Sustainability 2022, 14, 4422. [Google Scholar] [CrossRef]
  72. Berto, R.; Massaccesi, S.; Pasini, M. Do Eye Movements Measured Across High and Low Fascination Photographs Differ? Addressing Kaplan’s Fascination Hypothesis. J. Environ. Psychol. 2008, 28, 185–191. [Google Scholar] [CrossRef]
  73. Cao, S.; Song, C.; Jiang, S.; Luo, H.; Ping, Z.; Huang, Y.; Yu, J.; Li, K.; Li, N.; Guo, B.; et al. Effects of Urban Greenway Environmental Types and Landscape Characteristics on Physical and Mental Health Restoration. Forests 2024, 15, 679. [Google Scholar] [CrossRef]
  74. Appleton, J. The Experience of Landscape; John Wiley and Sons: Chichester, UK, 1986. [Google Scholar]
Figure 1. Location of the study area.
Forests 15 01210 g001
Figure 2. Location of the experimental sites S1–S8, with the boundary of the Wuyishan National Park tour area indicated by a red dashed line.
Forests 15 01210 g002
Figure 3. Three-day outdoor experiment flowchart. Day one: Experiment initiation—participants undergo a preparatory phase ①, arrive at the urban experimental area for equipment setup and baseline data collection ②, and then proceed to observation and assessment in designated environments ③. Days two and three: In forested areas, participants repeat step ③ from the first day, immersing themselves in and evaluating the effects of the natural environment.
Forests 15 01210 g003
Figure 4. Soundscape perception analysis across sites S1–S8: (a) S1 Grassland Slopes, (b) S2 Broadleaf Forest Valley, (c) S3 Mixed Broadleaf and Coniferous Forest Valley, (d) S4 Broadleaf Ridge Forest, (e) S5 Mixed Broadleaf and Coniferous Forest Slopes, (f) S6 Tea Gardens of the Valley, (g) S7 Broadleaf Forest Streamside, and (h) S8 Rock-Bedded Streamscape. “POS” means perceived occurrence scale, “PLS“ means perceived loudness scale, and “SDD” means source dominance degree.
Forests 15 01210 g004aForests 15 01210 g004bForests 15 01210 g004c
Table 1. Detailed environmental characteristics of sites S1–S8.
Test
Sites
CD
(%)
SPL
(dB)
Ill
(LUX)
Site Characteristics
S1
Grassland Slopes
2040.03 ± 5.017904.32 ± 3742.08S1 is characterized by its natural micro-topography and lawn landscapes, which offer expansive views and opportunities for visitors to closely interact with nature. The canopy layer is dominated by several key tree species, including Phyllostachys edulis, Schima superba, Cyclobalanopsis chungii, Ficus microcarpa, and Pinus massoniana. The understory is primarily composed of Rhododendron championae and Loropetalum chinense var. rubrum, among others.
S2
Broadleaf Forest Valley
7538.01 ± 3.995907.42 ± 2860.59S2 is flanked by an ancient pavilion to the north and a temple to the south, with a mountain stream running through the valley. The canopy layer is primarily composed of Castanopsis fargesii, Phyllostachys edulis, Schima superba, Castanopsis sclerophylla, and Lithocarpus glaber. The understory is somewhat diverse, predominantly formed by Ilex pubescens, Schima superba, Maesa japonica, and Eurya nitida. The herbaceous layer is sparse, consisting mainly of Cibotii rhizoma and Dicranopteris pedata.
S3
Mixed Broadleaf and Coniferous Forest valley
6533.73 ± 1.795711.36 ± 2305.11S3 is situated in a narrow valley, surrounded by extensive tea fields, where the sound of the wind can be heard rustling through the leaves. This area is predominantly composed of Pinus massoniana, which grows on steep slopes and rocky cliffs. Scattered among them are a few broad-leaved tree species, such as Schima superba, Symplocos sumuntia, Castanopsis carlesii, and Syzygium buxifolium. The shrub layer has a low vegetation cover, while the herbaceous layer is dominated by species such as Dicranopteris pedata, Miscanthus floridulus, Blechnum orientale, and Drynaria roosii.
S4
Broadleaf Ridge Forest
1548.34 ± 4.6512,950.45 ± 3293.77S4 is located at the summit of a mountain, at an elevation of 408.8 m, with a relative elevation difference of 215 m. The site offers expansive views, making it a popular destination for visitors to ascend and enjoy the landscape. The canopy layer is dominated by several tree species, such as Cyclobalanopsis chungii, Castanopsis fabri, Castanopsis eyrei, Engelhardtia fenzlii, and Pinus hwangshanensis. The shrub layer is primarily composed of Schima superba, Pleioblastus amarus, and Ilex pubescens.
S5
Mixed Broadleaf and Coniferous Forest Slopes
7038.23 ± 4.407721.14 ± 2042.44S5 is situated on the southwest side of Jiuqu Stream, adjacent to the footpaths, and is noted for its rich biodiversity. The canopy layer is predominantly composed of Cunninghamia lanceolata, Metasequoia glyptostroboides, Cupressus funebris, Cyclobalanopsis glauca, and Phyllostachys edulis. In the shrub layer, dominant species include Aucuba japonica, Michelia figo, Lophatherum gracile, and Rhododendron championae. The herbaceous layer features species such as Ophiopogon bodinieri, Microsorum fortunei, and Mahonia fortunei.
S6
Tea Gardens of the Valley
6534.42 ± 2.114501.36 ± 1555.05S6 is located within a tea plantation nestled in a valley with a unique ecological setting. One side of the site borders a stream, creating a moist microenvironment with an average humidity of 47.91 ± 3.85%. The canopy layer is primarily composed of Pinus massoniana, Cunninghamia lanceolata, Castanopsis eyrei, Litsea cubeba, and Schima superba. The shrub layer is predominantly occupied by tea plants, while the herbaceous layer primarily consists of ferns, such as Cibotii Rhizoma, Dicranopteris pedata, and Smilax china. Notably, the site features a thick humus layer beneath the forest canopy.
S7
Broadleaf Forest Streamside
3538.34 ± 4.788109.39 ± 2960.48S7 is characterized by typical monocline Danxia landforms flanking both sides, featuring numerous remarkable peaks and rock formations. The foothills and summit are covered with lush vegetation, creating a unique natural landscape in conjunction with Jiuqu Stream. Additionally, the area features bamboo rafts navigating the waters. The canopy layer is predominantly composed of Cyclobalanopsis glauca, with scattered associates, such as Celtis sinensis, Ulmus changii, Diospyros kaki var. silvestris, and Prunus zippeliana. The rocky vegetation in the shrub layer includes species such as Oreocnide frutescens, Microsorum fortunei, and Hemiboea henryi.
S8
Rock-bedded Streamscape
3537.16 ± 3.159668.64 ± 3068.39S8 is located at the Shaibu Rock attraction along Jiuqu Stream in Wuyishan, flanked by the distinctive Danxia red cliffs typical of the area, creating an exquisite landscape where water and stone intermingle. The canopy layer is dominated by tree species, such as Phyllostachys edulis, Engelhardtia fenzlii, and Castanopsis eyrei. The shrub layer mainly comprises Indocalamus tessellatus, Litsea elongata, Michelia maudiae, and Rhododendron adenopodum. The ground layer features a community of plants, including Millettia dielsiana, Microsorum fortunei, and Cyperus maculata.
Note. CD: canopy density; SPL: sound pressure level; Ill: illuminance.
Table 2. Demographic information of study participants.
ParameterValue (Mean ± SD)
AllMaleFemale
Sample number412120
Age (years)32.17 ± 8.0831.95 ± 7.8632.4 ± 8.30
Height (m)1.68 ± 0.091.76 ± 0.031.60 ± 0.04
Weight (kg)59.27 ± 8.2865.71 ± 4.8552.5 ± 5.12
BMI20.84 ± 1.9821.14 ± 1.7320.51 ± 2.17
Note. BMI: body mass index; SD: standard deviation.
Table 3. Division of interest areas.
Type of Gaze TargetArea of InterestLandscape Element
Static targetsAOI 1: PlantsTree, shrub, lawn, tea garden
AOI 2: RoadsWalking path
AOI 3: Terrain/landformsRock, shoal, distant mountain
AOI 4: Man-made structuresBuilding, pavilion, cliff inscription, seat, informational sign, bridge, trash bin
Dynamic targetsAOI 5: WaterStream
AOI 6: PeoplePedestrian
AOI 7: VehiclesBamboo raft
AOI 8: Ephemeral landscapesAnimals (flying birds, insects, etc.), weather phenomena
Table 4. The basic meanings of eye movement indexes.
Eye Movement IndexesAbbreviationBasic Meaning
Number of glances (n)NGThe total number of fixations on an area of interest (AOI) reflects the subject’s attention to and preference for that specific AOI.
Mean glance duration (s)MGDThe average duration of each fixation within an area of interest (AOI) suggests that longer average fixation durations are indicative of the necessity for extended observation time to extract information for scene understanding. It can also be interpreted as a measure of the subject’s interest in the area, where longer average fixation durations imply greater attraction.
Table 5. Typical sound source composition of Wuyishan National Park.
Major CategorySubcategorySound Source
Natural soundsBiological soundsBirdsong, insect chirping
Geophysical soundsFlowing water sound, sound of wind in the leaves, wind sound
Anthropogenic soundsHuman activity soundsVendor’s call, children’s playful noise, footsteps, talking voices
Transportation soundsAirplane noise, bamboo raft sound
Mechanical soundsBroadcast sound
Table 6. Descriptive statistics for number of gazes and mean gaze duration in areas of interest (n = 41).
Test
Sites
Area of InterestSubcategoryNumber of Gazes (n)Mean Gaze Duration (s)
MeanMedianRankMeanMedianRank
S1
Grassland Slopes
PlantTrees19.932110.490.361
Lawn16.051430.210.206
Tea garden6.20560.260.224
RoadWalking paths7.90850.240.225
Terrain/topographyRocks18.761920.450.452
Man-madeBuildings13.201140.380.303
S2
Broadleaf Forest Valley
PlantTrees37.173710.450.464
Shrubs7.68870.230.218
RoadWalking paths11.661250.290.306
Man-madeBuildings29.272720.710.752
Pavilions18.511730.520.343
Bridges6.02580.250.227
Guide signs11.371260.910.831
WaterStreams13.051240.330.325
S3
Mixed Broadleaf and Coniferous Forest valley
PlantTrees22.122030.310.284
Tea garden27.052510.400.391
RoadWalking paths10.49950.260.215
Terrain/topographyRocks11.93940.390.332
Distant mountains26.902520.340.353
Man-madeSeats6.07760.180.166
S4
Broadleaf Ridge Forest
PlantTrees19.661950.310.186
RoadWalking paths4.29470.140.147
Terrain/topographyRocks26.242820.410.335
Distant mountains40.274010.680.762
Man-madePavilions10.15760.450.414
WaterStreams22.562340.570.593
TransportationBamboo raft23.342331.041.051
S5
Mixed Broadleaf and Coniferous Forest Slopes
PlantTrees32.493010.550.561
Shrubs19.441630.450.433
Lawn8.66750.230.195
RoadWalking paths12.341240.290.234
Man-madeBuildings22.392020.520.512
Seats7.59660.180.116
S6
Tea Gardens of the Valley
PlantTrees27.662620.400.412
Shrubs10.12840.310.263
Tea garden39.764110.570.581
RoadWalking paths12.881130.210.194
S7
Broadleaf Forest Streamside
PlantTrees20.121930.300.294
Terrain/topographyRocks10.441150.240.225
Distant mountains20.271920.430.413
WaterStreams38.834010.550.472
TransportationBamboo raft18.711741.040.951
S8
Rock-Bedded Streamscape
PlantTrees20.801950.460.485
Shrubs6.15570.290.247
Terrain/topographyRocks28.512930.660.603
Man-madePavilions7.15660.410.336
Cliff carvings30.853220.860.782
WaterStreams31.803210.520.464
TransportationBamboo raft25.662341.071.041
Table 7. Descriptive statistical analysis of physiological and psychological indicators across different environments (n = 41).
Test
Sites
LF/HFRMSSDSCLPANATMD
MeanSDMeanSDMeanSDMeanSDMeanSDMeanSD
S10.770.4227.756.591.240.8521.514.4311.491.72−0.246.14
S20.750.3830.018.551.190.8621.154.1411.411.260.296.32
S30.750.4428.819.041.050.7421.684.5211.051.30−3.105.26
S40.650.3828.195.501.610.9624.054.8611.241.18−2.984.59
S50.750.4027.557.151.201.0320.373.5311.461.32−1.006.14
S60.580.3831.809.470.910.9822.784.1911.371.37−2.505.60
S70.530.3731.037.000.870.6923.494.3411.221.33−3.325.45
S80.680.3628.806.541.000.6021.954.8910.680.85−4.204.51
Note. LF/HF: low frequency/high frequency; RMSSD: root mean square of successive differences between adjacent R-R intervals; SCL: skin conductance level; PA: positive affect; NA: negative affect; TMD: total mood disturbance.
Table 8. Physiological results of stepwise regression analysis (n = 41).
Test
Sites
Dependent VariableIndependent VariableUnstandardized
Coefficients (B)
Standardized Coefficients (β)t-Valuep-ValueAdj. R2F-Value
BStandard Error
S1
Grassland Slopes
LF/HFConstant1.0040.131-7.6780.000 **0.0734.173
Rocks (MGD)−0.5160.253−0.311−2.0430.048 *
RMSSDConstant30.9751.762-17.5800.000 **0.0884.863
Talking voices−0.3490.158−0.333−2.2050.033 *
S2
Broadleaf Forest Valley
RMSSDConstant15.5913.479-4.4820.000 **0.3019.604
Wind sound0.6920.2650.3452.6070.013 *
Buildings (NG)0.3150.0870.4803.6300.001 **
SCLConstant2.4910.437-5.7030.000 **0.1614.833
Trees (NG)−0.0210.008−0.400−2.6910.011 *
Streams (MGD)−1.5570.736−0.314−2.1150.041 *
S3
Mixed Broadleaf and Coniferous Forest valley
LF/HFConstant1.1060.270-4.0900.000 **0.3787.082
Birdsong−0.0410.017−0.314−2.4660.019 *
footsteps0.0480.0220.2792.2070.034 *
Distant mountains (NG)−0.0160.004−0.462−3.6990.001 **
Distant mountains (MGD)1.0440.4220.3112.4770.018 *
SCLConstant1.6780.312-5.3740.000 **0.0834.614
Tea garden (MGD)−1.5650.728−0.325−2.1480.038 *
S4
Broadleaf Ridge Forest
LF/HFConstant1.3110.161-8.1470.000 **0.2816.202
Wind sound−0.0220.009−0.335−2.4080.021 *
Broadcast sound−0.0250.011−0.302−2.2140.033 *
Rocks (MGD)−0.9530.254−0.530−3.7560.001 **
RMSSDConstant20.0732.964-6.7710.000 **0.4438.952
footsteps0.3390.1540.2662.2000.034 *
Streams (NG)0.2950.0880.4023.3310.002 **
Trees (MGD)9.8732.5180.4803.9210.000 **
Bamboo raft (MGD)−3.9251.708−0.274−2.2970.028 *
SCLConstant1.1660.232-5.0250.000 **0.1085.824
Children’s playful noise0.0500.0210.3602.4130.021 *
S5
Mixed Broadleaf and Coniferous Forest Slopes
LF/HFConstant1.0530.132-7.9830.000 **0.1236.599
Birdsong−0.0230.009−0.380−2.5690.014 *
S6
Tea Gardens of the Valley
LF/HFConstant0.9220.138-6.6790.000 **0.1397.472
Birdsong−0.0240.009−0.401−2.7340.009 **
RMSSDConstant18.6694.714-3.9610.000 **0.1578.468
Tea garden (MGD)23.0957.9360.4222.9100.006 **
SCLConstant1.7750.356-4.9800.000 **0.1306.951
Birdsong−0.0610.023−0.389−2.6360.012 *
S7
Broadleaf Forest Streamside
LF/HFConstant1.1020.137-8.0710.000 **0.32610.653
Bamboo raft sound−0.0190.006−0.415−3.0910.004 **
Bamboo raft (NG)−0.0160.006−0.341−2.5400.015 *
S8
Rock-Bedded Streamscape
RMSSDConstant33.7273.885-8.6820.000 **0.2066.182
Streams (NG)−0.3180.122−0.384−2.6150.013 *
Streams (MGD)10.0023.3520.4382.9840.005 **
SCLConstant2.6490.293-9.0470.000 **0.6099.906
Flowing water sound−0.0510.012−0.446−4.4550.000 **
Wind sound0.0480.0140.3573.3220.002 **
Children’s playful noise−0.0440.02−0.239−2.1920.036 *
footsteps−0.0630.018−0.374−3.4380.002 **
Bamboo raft sound−0.030.009−0.383−3.3940.002 **
Rocks (MGD)−0.6280.183−0.358−3.4320.002 **
Note. LF/HF: low frequency/high frequency; RMSSD: root mean square of successive differences between adjacent R-R intervals; SCL: skin conductance level; NG: number of gazes; MGD: mean gaze duration; * and ** denote statistical significance at the 0.05 and 0.01 levels (two-tailed), respectively.
Table 9. Psychological results of stepwise regression analysis (n = 41).
Test
Sites
Dependent VariableIndependent VariableUnstandardized
Coefficients (B)
Standardized Coefficients (β)t-Valuep-ValueAdj. R2F-Value
BStandard Error
S1
Grassland slopes
NAConstant13.3690.649-20.5910.000 **0.1644.921
Broadcast sound−0.3890.181−0.313−2.1540.038 *
Lawn (MGD)−5.572.254−0.359−2.4710.018 *
S2
Broadleaf forest valley
PAConstant15.8981.726-9.2110.000 **0.1755.230
Streams (NG)0.2580.0960.3872.6810.011 *
Guide signs (MGD)2.0861.0080.2992.0690.045 *
S3
Mixed broadleaf and coniferous forest valley
TMDConstant0.422.332-0.1800.8580.2587.967
Walking paths (MGD)9.5974.0830.3212.3500.024 *
Distant mountains (MGD)−17.0975.609−0.416−3.0480.004 **
S5
Mixed broadleaf and coniferous forest slopes
NAConstant10.4220.47-22.1890.000 **0.1105.947
Talking voices0.1010.0410.3642.4390.019 *
S6
Tea gardens of the valley
PAConstant18.1391.847-9.8230.000 **0.1327.092
Flowing water sound0.4680.1760.3922.6630.011 *
TMDConstant−7.2391.743-−4.1530.000 **0.18710.190
Airplane noise2.1810.6830.4553.1920.003 **
S7
Tea gardens of the valley
PAConstant18.3791.79-10.2670.000 **0.3059.775
Flowing water sound0.3920.10.5233.9080.000 **
footsteps−0.4560.169−0.361−2.7010.010 *
TMDConstant1.1131.846-0.6030.5500.1327.103
Streams (MGD)−8.0083.005−0.393−2.6650.011 *
S8
Rock-Bedded Streamscape
PAConstant12.4032.531-4.9000.000 **0.2628.095
Flowing water sound0.3070.1280.3282.4060.021 *
Rocks (NG)0.1870.0550.4683.4320.001 **
Note. PA: positive affect; NA: negative affect; TMD: total mood disturbance; NG: number of gazes; MGD: mean gaze duration; * and ** denote statistical significance at the 0.05 and 0.01 levels (two-tailed), respectively.
Table 10. Design strategies for improving public physiological and psychological benefits through visual and auditory perception.
Environmental PerceptionDesign Key PointsDesign Strategies
Visual PerceptionEnhancement of visual attraction in plant landscapes① Enhancement of the visual effects of seasonal changes within forest communities can be achieved by introducing colorful foliage and flowering tree species.
② Scientific thinning and tending measures, along with the removal of underbrush, are implemented in forest stands with a canopy closure greater than 0.7, to optimize the visual experience.
③ The integration of tea culture interpretive educational services within tea garden landscapes allows visitors to deeply experience the beauty of these gardens.
Enhancement of visual attraction in rock landscapes① Guiding visitors to appreciate the ecological and cultural narratives associated with unique geological features and formations is recommended.
② Engaging activities, such as ‘Exploring Caves’, could effectively disseminate knowledge about distinctive geological formations, such as Danxia landforms, increasing visitor participation and enriching educational experiences.
Guiding the appreciation of the forest’s overall beauty from a distanceConstructing observation decks enables visitors to gaze from elevated viewpoints, providing a comprehensive view of the magnificent forest scenery.
Optimized road signage systemDesign road signs and guideposts to ensure clarity and easy recognition, thereby improving visitors’ navigational skills and spatial awareness.
Auditory PerceptionEnhancement of birdsong① Installing nesting boxes and birdhouses to increase bird habitats.
② Introducing additional fruit-bearing and nectar-producing plants for avian species can augment bird attraction rates. Examples of such plants include Toxicodendron succedaneum, Broussonetia papyrifera, Cinnamomum camphora, Ilex chinensis, Sapium sebiferum, Sapindus, Melia azedarach, Cerasus campanulata, Michelia figo, and Yulania denudata.
Noise maskingControlling and minimizing sources of noise—such as loudspeakers from tour guides, vendors’ calls, and traffic noise—is crucial for maintaining the integrity of the natural acoustic environment.
Audio-visual InteractionEnhancing the audio-visual experience of water landscapes① Incorporate water-friendly infrastructure, including natural revetments, stone slab bridges, and stepping stones, to enhance visitor engagement with aquatic environments.
② Facilitate the implementation of aquatic-centered forest therapy, including bamboo rafting, meditation, and water-based sensory awareness, under the guidance of certified forest therapy practitioners.
③ The configuration of a narrow gorge traversed by a stream fosters an ideal internal acoustic environment that markedly enhances the water’s auditory presence. Forest therapists can leverage this unique setting to encourage visitors to prolong their stay within such spaces.
Disclaimer/Publisher’s Note: The statements, opinions and data contained in all publications are solely those of the individual author(s) and contributor(s) and not of MDPI and/or the editor(s). MDPI and/or the editor(s) disclaim responsibility for any injury to people or property resulting from any ideas, methods, instructions or products referred to in the content.

