Article

Predicting the Future Distribution and Habitat Suitability of Ilex latifolia Thunb. in China under Climate Change Scenarios

1
School of Biological Sciences, Guizhou Education University, Guiyang 550018, China
2
School of Geography and Resources, Guizhou Education University, Guiyang 550018, China
3
Agricultural College, Guizhou University, Guiyang 550025, China
4
State Power Investment Corporation Power Station Operation Technology (Beijing) Co., Ltd., Beijing 100032, China
5
Guizhou Institute of Forest Inventory and Planning, Guiyang 550003, China
*
Authors to whom correspondence should be addressed.
Forests 2024, 15(7), 1227; https://doi.org/10.3390/f15071227
Submission received: 25 June 2024 / Revised: 10 July 2024 / Accepted: 11 July 2024 / Published: 15 July 2024
(This article belongs to the Section Forest Ecology and Management)

Abstract

:
Ilex latifolia Thunb., a plant of significant economic and medicinal value, is both edible and medicinal. Assessing the climate suitability for I. latifolia has profound implications for advancing medical progress and enhancing the quality of human life. This study comprehensively utilized data on the field distribution of I. Latifolia, as well as corresponding climatic, topographical, and soil data at these distribution points, with the aid of future climate data predicted by global climate models, and employed the MaxEnt model to predict and analyze the climate suitability areas of I. latifolia under three greenhouse gas emission scenarios (SSP126, SSP245, and SSP585). The research covers the spatiotemporal distribution characteristics, suitable growth range, and influencing factors from the present to the end of the 21st century (2041–2100). The predictive results of the MaxEnt model indicate that, under current climatic conditions, the main suitable growth areas for I. latifolia are concentrated in the southeastern part of China, especially in the provinces of Fujian and Zhejiang. However, facing the challenges of future climate change, it is expected that the moderately high suitable growth areas for I. latifolia will show a trend of gradual reduction. The primary climatic factors crucial for I. latifolia’s growth are annual precipitation (1469.05 to 4499.50 mm), the lowest temperature in the coldest month (−18.72 to 3.88 °C), seasonal precipitation changes (11.94 to 64.69 mm), and topographic slope (0.37 to 3.00°), with annual precipitation being the most influential. The findings of this study provide a scientific basis for the introduction of I. latifolia and offer important reference information for the artificial cultivation, resource development, and achievement of sustainable industrial development of this species.

1. Introduction

Ilex latifolia Thunb., an evergreen arboreal species of the holly family, grows in evergreen broadleaf forests, shrubs, or bamboo groves on hillsides at altitudes ranging from 250 to 1500 m. With the rise in health consciousness, the demand for I. latifolia has been continuously increasing, as it is not only a popular tea beverage but also plays a significant role in the medical field. Since the 21st century, the aging of the population in China has accelerated. It is projected that, by 2033, the elderly population will account for more than 20% of the total population, forming a superaged society. Against this backdrop, “three highs” symptoms (high blood sugar, high blood pressure, and high blood lipids) have become common health issues among the elderly and are gradually affecting younger individuals. Triterpenoids, flavonoids, and other phytochemical components contained in I. latifolia have significant effects on lowering blood pressure, blood lipids, and promoting overall metabolism, while also possessing multiple functions such as quenching thirst, clearing heat, detoxification, antioxidation, and anticancer [1]. I. latifolia has specific requirements for its growing environment, preferring warm and fertile sandy loam, and it is mainly distributed in the southeastern region of China. In addition, I. latifolia plays a significant role in its ecosystem, providing important services such as food for wildlife and contributing to habitat complexity. While the fruits of Ilex species may have limited direct use for humans, their ecological value is substantial, supporting a variety of species and ecosystem functions. Due to the impact of global climate change, the living space of some species is being compressed, and they even face the risk of extinction [2]. As a healthy tea beverage, wild resources of I. latifolia are scarce and rapidly depleting, urgently necessitating the expansion of artificial cultivation [3]. In this context, analyzing the spatiotemporal distribution characteristics of the climate suitability area of I. latifolia under current and future climatic conditions is of great significance for avoiding resource shortages, guiding cultivation introduction, and formulating protection strategies.
Since the Industrial Revolution, global warming has become increasingly severe. The Sixth Assessment Report (AR6) of the Intergovernmental Panel on Climate Change (IPCC) predicts that the global average temperature will rise by more than 1.5 °C in the next 20 years [4]. This trend will lead to more frequent extreme weather events, such as droughts, floods, heavy rains, and high temperatures [5], posing challenges to the growth and distribution of species, affecting the balance of ecosystems, and potentially triggering a series of problems for agricultural production, water resources, and ecological disasters, which will severely impact human life and economic development [6]. With the intensification of global warming, suitable areas for species are continuously shrinking and migrating northward or to higher altitudes [7], drawing attention to the response of species to climate change [8]. Species Distribution Models (SDMs) have become important tools for predicting the potential distribution areas of animals and plants [9,10,11,12]. These models estimate the ecological niche of species by analyzing field distribution information and environmental variables, projecting them onto the landscape, and reflecting species’ habitat preferences in the form of probabilities. The MaxEnt maximum entropy model, as a commonly used discriminant model, has shown excellent performance in species distribution prediction with high predictive accuracy and flexibility [13,14,15]. The MaxEnt model utilizes the principle of maximum entropy, combined with species distribution data and environmental variables, to simulate the geographical distribution of species and their response to climate change, maintaining high predictive accuracy even when the sample size is insufficient or data are incomplete [14]. However, it is important to recognize the limitations of MaxEnt and other SDMs. These models typically exclude biotic interactions and human-induced changes, which can be critical factors influencing species distributions. This study aimed to use the MaxEnt model, in conjunction with new SSP climate scenario data, to simulate and analyze the future suitable area distribution of I. latifolia in China. Utilizing ArcGIS software (Version 10.8), we were able to calculate the area of suitable habitats and observe the distribution characteristics of the suitable areas of I. latifolia and the changes in suitable areas during different periods. The specific objectives were: (1) to predict the current and future distribution of the potential suitable growth areas of I. latifolia; (2) to explore the dominant environmental factors affecting the growth and distribution of I. latifolia; (3) to simulate the future trend of changes in the suitable areas for I. latifolia, providing a scientific basis for ecological protection and resource utilization.

2. Materials and Methods

2.1. Species Occurrence Records and Sample Collection

In the MaxEnt model, the required species distribution data mainly refers to the precise latitude and longitude information of the target species’ distribution points. For I. latifolia, we collected and processed the distribution data through the following steps: (1) Online Resource Collection: We first collected the distribution data of I. latifolia through online resources, including the Chinese Virtual Herbarium (CVH, http://www.cvh.ac.cn/, accessed on 18 March 2024) and the Global Biodiversity Information Facility (GBIF, http://www.gbif.org/, accessed on 22 March 2024). (2) Literature Search: In addition, we conducted a literature search through the China National Knowledge Infrastructure (CNKI, www.cnki.net, accessed on 30 March 2024) to gather more scientific literature and records on the distribution of I. latifolia. (3) Data Screening and Processing: To avoid the issue of model overfitting caused by spatial autocorrelation, we strictly screened the collected distribution points. In each environmental variable grid (with a spatial resolution of approximately 2.5 arc minutes), we retained only one data point and randomly removed multiple coordinates falling within the same grid using ArcGIS software to ensure the uniqueness of data within each grid cell. Ultimately, we stored the screened data as a CSV format file. (4) Sample Data Quantity: A total of 686 sample data points were initially collected in this study. During the rigorous data screening process, we removed 521 incomplete records, no study area entries, and duplicates. Ultimately, a total of 165 I. latifolia specimen records were obtained for the study (Figure 1), with the sample collection times ranging from 1980 to 2020. (5) Map Production: The administrative division map of China (Map Approval Number: GS(2023)2762) used as the base map was obtained from the Standard Map Service website (http://bzdt.ch.mnr.gov.cn/, accessed on 2 January 2024).

2.2. Environmental Variables

The environmental variables mainly used in this study included bioclimatic, soil, and topographic factors (Table 1). The climate data were sourced from the WorldClim (Version 2.1) database (http://www.worldclim.org/, accessed on 2 January 2024), which includes both current and future (2041–2100) climate data. The future climate data were based on the sixth phase of the Coupled Model Intercomparison Project (CMIP6), utilizing the BCC-CSM2-MR climate system model developed by the National Climate Center. To avoid uncertainties caused by a single climate scenario, we selected three typical concentration emission scenarios: SSP1RCP26 (SSP126), SSP2RCP45 (SSP245), and SSP5RCP85 (SSP585). SSP126 denotes minimal hurdles for both mitigation and adaptation in the context of SSP1, characterized by reduced carbon dioxide emissions [16]. SSP245 represents midlevel greenhouse gas emissions, considered a suitable and highly credible scenario [17], while SSP585 is the optimal scenario for CO2 emissions up to the midcentury under current policies, with emissions levels in 2100 that are still considered highly plausible [18]. Soil factor data were derived from the World Soil Database (http://www.fao.org/soilsportal/so, accessed on 2 January 2024). Multicollinearity among variables can lead to overfitting of the model and misinterpretation of the model results [19]; hence, we excluded highly correlated environmental variables. First, we imported the distribution data of I. latifolia and 37 environmental variables into the MaxEnt model, set default parameters, used a bootstrap method for repeated calculations, and employed the jackknife method to obtain the percentage contribution of each environmental variable [14]. Second, we conducted a Pearson correlation analysis on the environmental variables using SPSS 26.0 software [20], selecting one factor with a higher contribution rate when the correlation coefficient between two factors exceeded 0.75, which is more closely related to species distribution, that is, highly correlated environmental variables or |r| ≥ 0.75 [21]. If the contribution rate was low, it was considered biologically insignificant and disregarded [22]. The results of correlation analysis showed that there were 16 environmental factors with |r| ≥ 0.75, including six bioclimatic factors: Bio2 (Mean diurnal range), Bio6 (Minimum temperature of the coldest month), Bio10 (Mean temperature of the warmest quarter), Bio12 (Annual precipitation), Bio15 (Precipitation seasonality), and Bio18 (Precipitation of the warmest quarter); eight soil factors: T_BD (Topsoil Bulk Density), T_BS (Topsoil Basic Saturation), T_CEC_Clay (Topsoil Cation Exchange Capacity of clay), T_CEC_Soil (Topsoil Cation Exchange Capacity of Soil), T_Clay (Topsoil Clay Fraction), T_Gravel (Topsoil Gravel Content), T_OC (Topsoil Organic Carbon), and T_Sand (Topsoil Sand Fraction); and two topographic factors: Slope and Aspect.

2.3. Model Simulation and Evaluation for I. latifolia

The distribution point data of I. latifolia in CSV format and the screened environmental factor data in ASCII format were imported into the MaxEnt model. A random selection of 75% of the distribution point data was used as the training set to establish and train the model, while the remaining 25% served as the test set for validation. The model was run repeatedly 10 times according to the 10-fold cross validation method to verify the accuracy of the predictive precision [23]. Other settings were kept at default parameters, and calculations were performed sequentially for the three future climate scenarios. The output format was Logistic, with the final results being outputted as ASCII format files [24]. In ArcGIS 10.8, the computed results were combined with cartographic data to simulate and map the current and future potential suitable habitats for I. latifolia. We assessed the performance of MaxEnt using the area under the curve (AUC) and True Skill Statistics (TSS). Typically, the AUC value ranges from 0 to 1, with higher values indicating better model performance. It is generally considered that an AUC value less than 0.7 is poor, a value between 0.7 and 0.9 is moderately useful, and a value greater than 0.9 is considered excellent [25].

2.4. Division of Potential Suitable Habitat Grades for I. latifolia

The results from the MaxEnt 3.4.3 model in ASCII format were utilized along with ArcGIS 10.8 format conversion tools to transform these results into raster files, thereby enabling the acquisition of the habitat suitability areas for I. latifolia. Suitability (P) varies between 0 and 1, with values closer to 1 indicating that a species is well-suited to grow in a particular area. Utilizing the spatial analysis tools, specifically the reclassify command (Reclassify), and employing the Jenks’ natural breaks method, the ecological suitability map for I. latifolia based on the main ecological factors was created. Consequently, the suitable habitat for I. latifolia could be divided into four categories: highly suitable (0.50 ≤ p ≤ 1.0), moderately suitable (0.30 ≤ p < 0.50), low suitability (0.14 ≤ p < 0.30), and unsuitable (p < 0.14).

2.5. Dynamic Analysis of the Suitable Habitat for I. latifolia

In this study, we utilized the ArcGIS 10.8 software platform to import binary distribution layers of I. latifolia for both the current and future periods under various climate scenarios [26]. By employing the SDM toolbox, an extension specifically designed for the analysis of species distribution models, we further analyzed these distribution layers. Specifically, we made use of the “Distribution changes between binary SDMs” tool within the SDM toolbox, which allowed us to compare and quantify changes in species distribution between two different time points or scenarios. This tool not only calculates changes in the areas of suitable habitats but also assesses the migration of the centroid, an effective method for measuring shifts in the central location of species distribution. Through this method, we were able to obtain dynamic changes in the suitable habitats of I. latifolia under different climate scenarios for the future period, such as the SSP126, SSP245, and SSP585 scenarios. This includes expansion, contraction, or shifts in suitable habitats, as well as displacement of the centroid, thereby revealing the potential impact of climate change on the distribution of I. latifolia. These analytical results are of significant importance for understanding the response patterns of species to climate change, assessing their conservation status, and formulating corresponding conservation strategies. Furthermore, the methodology of this study provides a replicable framework for dynamic distribution studies of other species, contributing to the in-depth development of research on biodiversity and ecosystem services. By conducting in-depth analyses of the distribution dynamics of species such as I. latifolia, we can better predict and respond to the potential threats of climate change to biodiversity.

3. Results

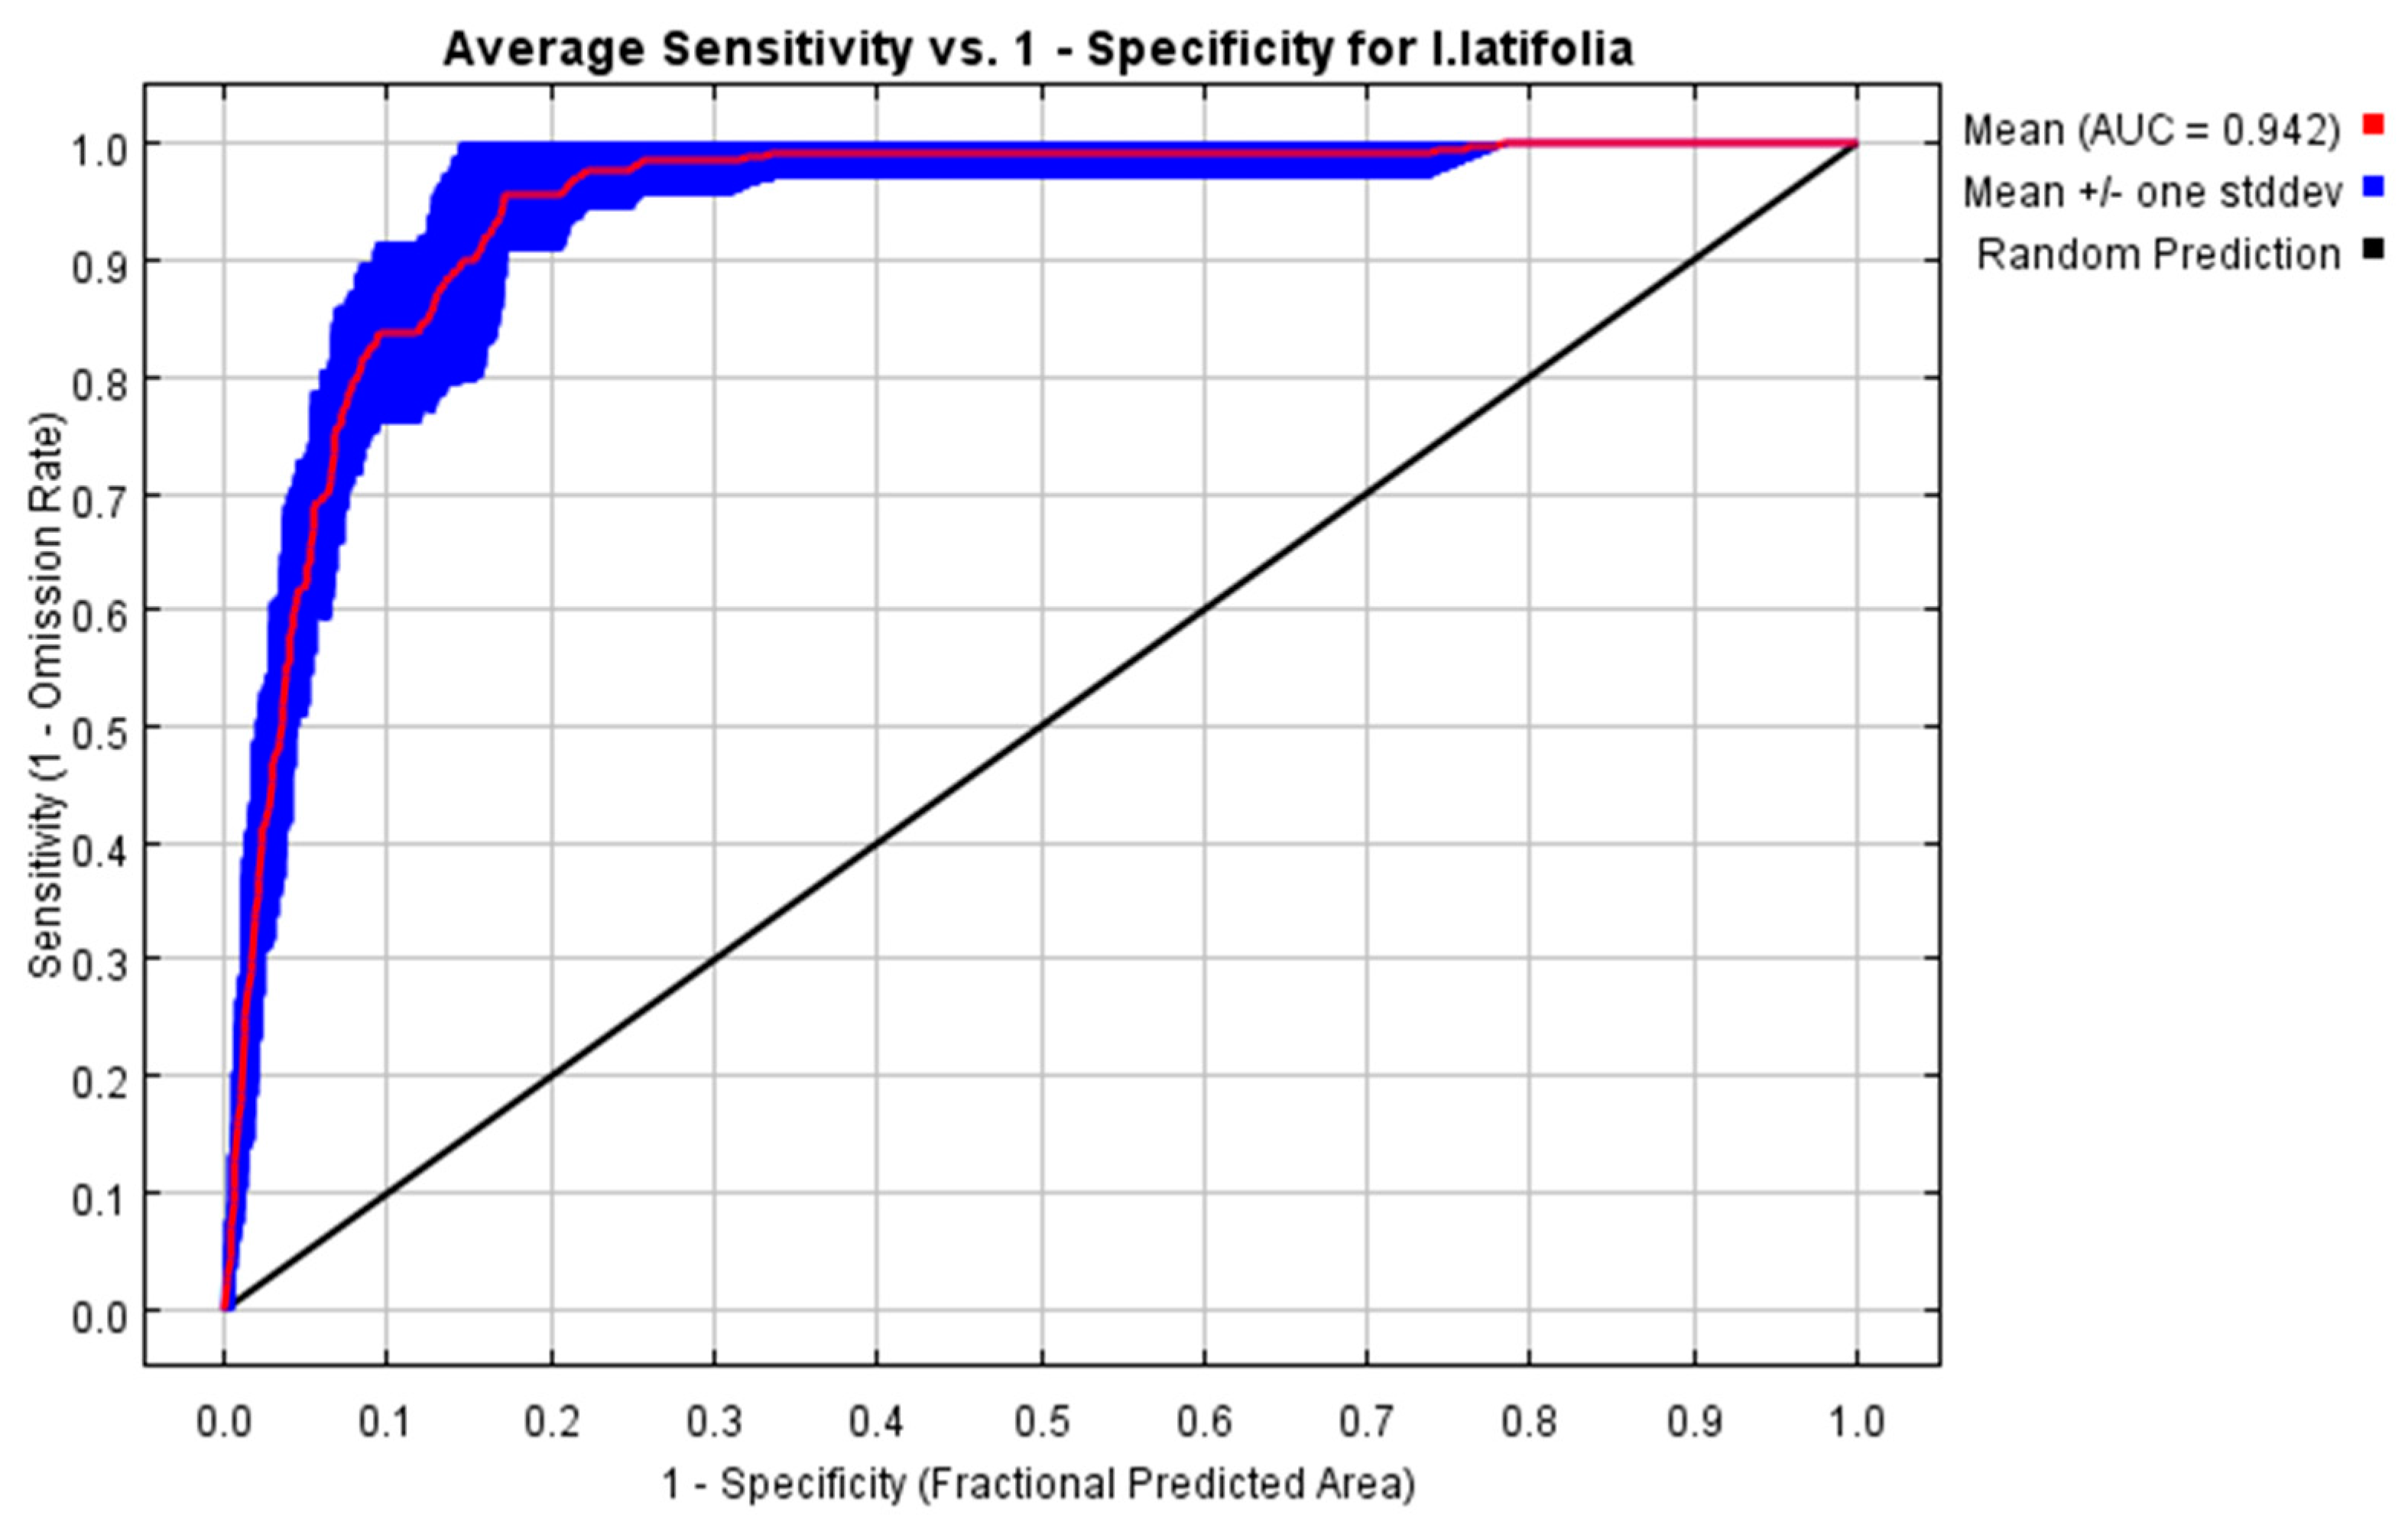
3.1. The Accuracy of MaxEnt Model

The accuracy of the results was evaluated based on the area under the receiver operating characteristic curve (AUC) value, which ranges from 0 to 1, with higher values indicating better predictive performance of the model [27]. The results show that the AUC value is 0.942 (Figure 2), indicating that the simulation results of the model are excellent and can reflect the future suitable habitat distribution of I. latifolia.

3.2. Environmental Variables Analysis

Sixteen environmental factors were selected for simulating and predicting the distribution of I. latifolia (Table 2). According to Table 2, Bio12 (annual precipitation), Bio6 (minimum temperature of the coldest month), Bio15 (precipitation seasonality), and slope have a cumulative contribution rate of 91.6% and a ranked importance of 75.3%, indicating that these four environmental factors have a relatively significant impact on I. latifolia. As for the Regularized Training Gain (RTG) in the jackknife test (Figure 3), when a single factor is used for model simulation, Bio12 achieves the highest RTG, followed by Bio18 (precipitation of the warmest quarter) and Bio2 (mean diurnal range). When simulating with the remaining variables, excluding certain factors, T_BS (topsoil basic saturation) obtains the highest RTG, followed by T_BD (topsoil bulk density) and T_Sand (topsoil sand fraction), indicating that the growth of I. latifolia is also influenced by these factors. We determined the dominant environmental factors by integrating the modeling contribution rate with the results of the jackknife test. This approach allowed us to comprehensively evaluate the importance of each environmental variable, both independently and within the context of the overall model performance. In summary, the dominant factors affecting the suitable habitat of I. latifolia are bioclimatic factors (annual precipitation, minimum temperature of the coldest month, and precipitation seasonality) and topographic factors (slope), which are more closely related to the growth of I. latifolia. Additionally, other temperature factors (monthly averages), precipitation factors (precipitation in the warmest season), and soil factors (topsoil sand components, soil bulk density, and basic saturation) also have a certain degree of impact on the growth and reproduction of I. latifolia.
To more intuitively demonstrate the impact of various factors on the growth of I. latifolia, we derived response curves between environmental factors and distribution probability using the MaxEnt model (Figure 4). Studies have shown that when the distribution probability exceeds 0.5, the range of that environmental factor is suitable for the species’ growth [28]. Therefore, we used 0.5 as the threshold to determine the range of environmental factors suitable for the distribution of I. latifolia. The annual precipitation (Figure 4a) ranges from 1469.05 to 4499.50 mm; the minimum temperature of the coldest month (Figure 4b) ranges from 18.72 to 3.88 °C; seasonal precipitation (Figure 4c) ranges from 11.94 to 64.69 mm; and the topographic slope (Figure 4d) ranges from 0.37 to 3.00°.

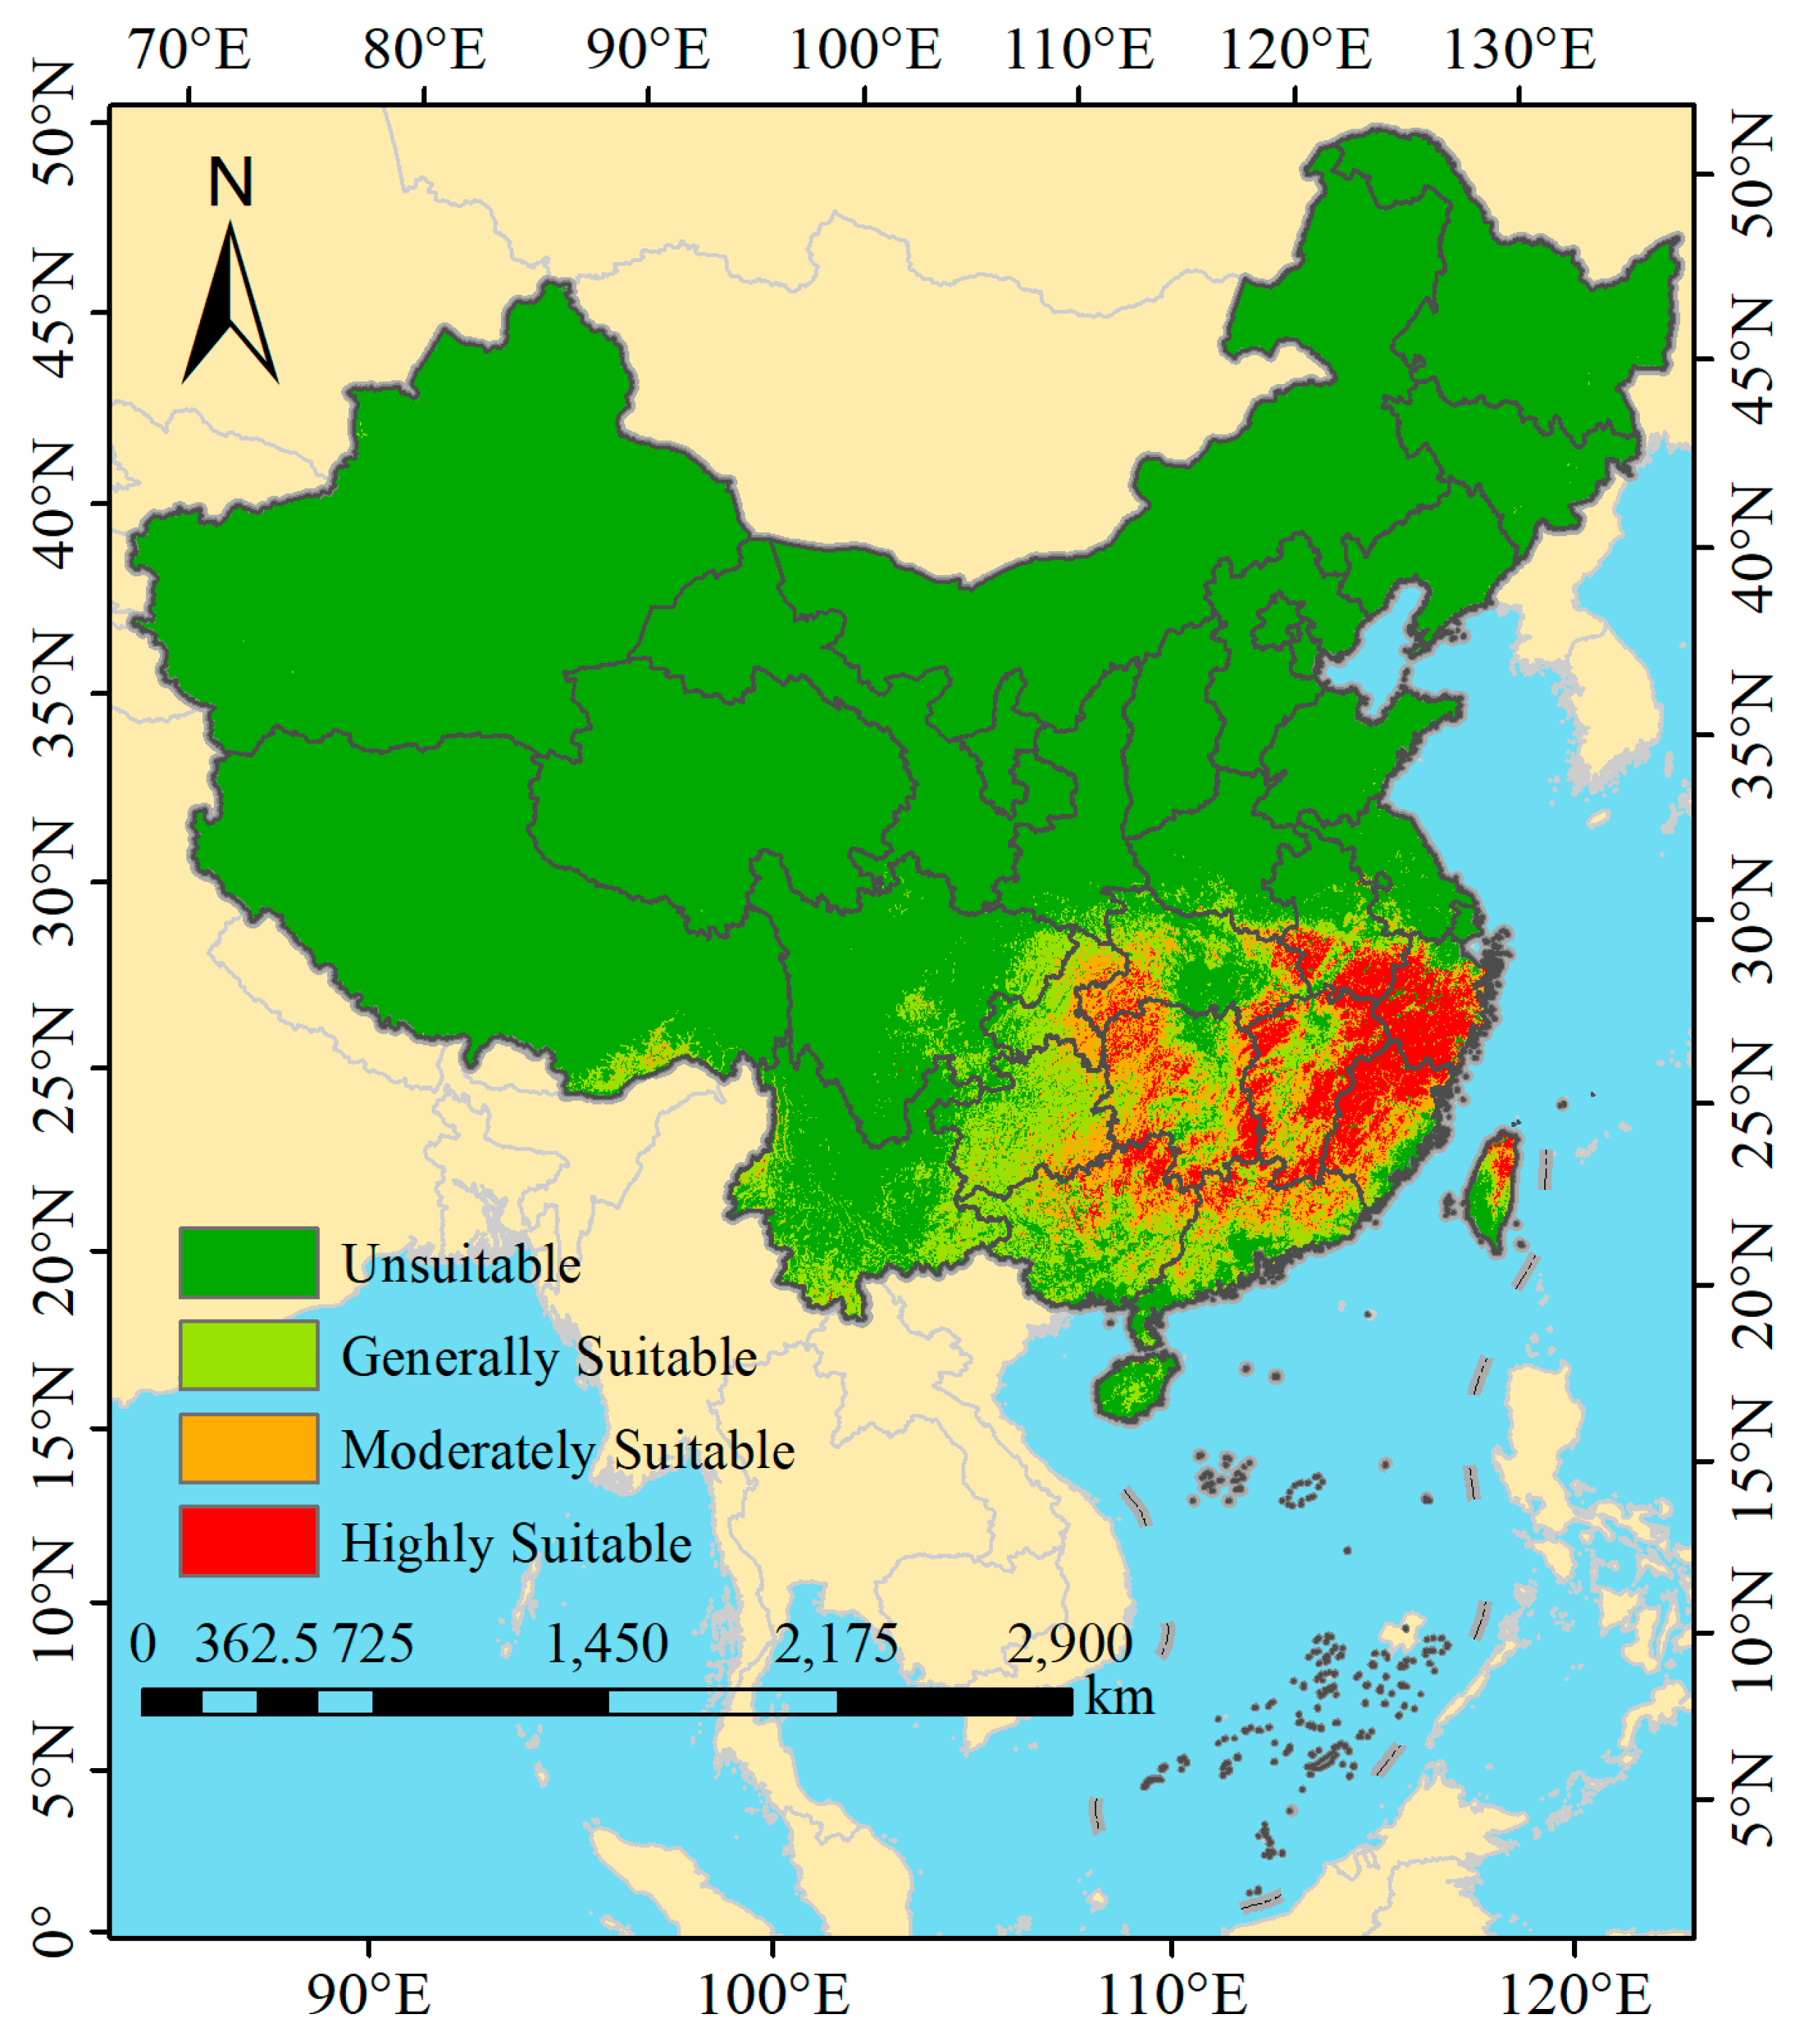
3.3. Potential Distribution under Current Climate

Under current climatic conditions, the suitable habitat distribution for I. latifolia is divided into four grades (Figure 5), with a total suitable habitat area of 137.09 × 10⁴ km2 (Figure 6), distributed from the southeastern to the southwestern regions of China. The highly suitable areas account for 34.08 × 10⁴ km2, representing 24.8% of China’s total land area, primarily located in the central and western parts of Zhejiang, the central and southwestern parts of Fujian, areas in Jiangxi except the central region, the northern part of Guangdong, the northeastern part of Guangxi, the northwestern, eastern, and southern parts of Hunan, the northern part of Taiwan, the southern part of Anhui, and the southwestern part of Hubei. The moderately suitable area covers 42.47 × 10⁴ km2, constituting 30.9% of China’s total land area, mainly in the southern part of Fujian, the northern part of Guangdong, the central part of Jiangxi, the central part of Hunan, the northern part of Guangxi, the southeastern part of Guizhou, the southeastern part of Chongqing, and the southwestern part of Hubei. The low suitability area amounts to 60.73 × 10⁴ km2, accounting for 44.2% of China’s total land area, predominantly in the southern part of Guangdong, the southern part of Guangxi, the central part of Guizhou, the central part of Chongqing, the central and northern parts of Hunan, the central part of Jiangxi, the central part of Anhui, the southern part of Yunnan, the southwestern part of Tibet, the eastern part of Sichuan, and some regions of Hainan and Taiwan. The spatial scope of the suitable habitats gradually extends from the central areas of high suitability to the low suitability areas in the southwestern region.

3.4. Potential Distribution under Future Climate

This study employs three climate scenarios, namely SSP126, SSP245, and SSP585, with the timeframes selected being the present, 2041–2060, 2061–2080, and 2081–2100. We investigated the distribution of suitable habitats for I. latifolia under these three future climate scenarios and obtained the growth distributions under future climate conditions (Figure 7), spatial changes in suitable habitats (Figure 8), and detailed information on the shift in the centroid of distribution (Figure 9), presenting them graphically.

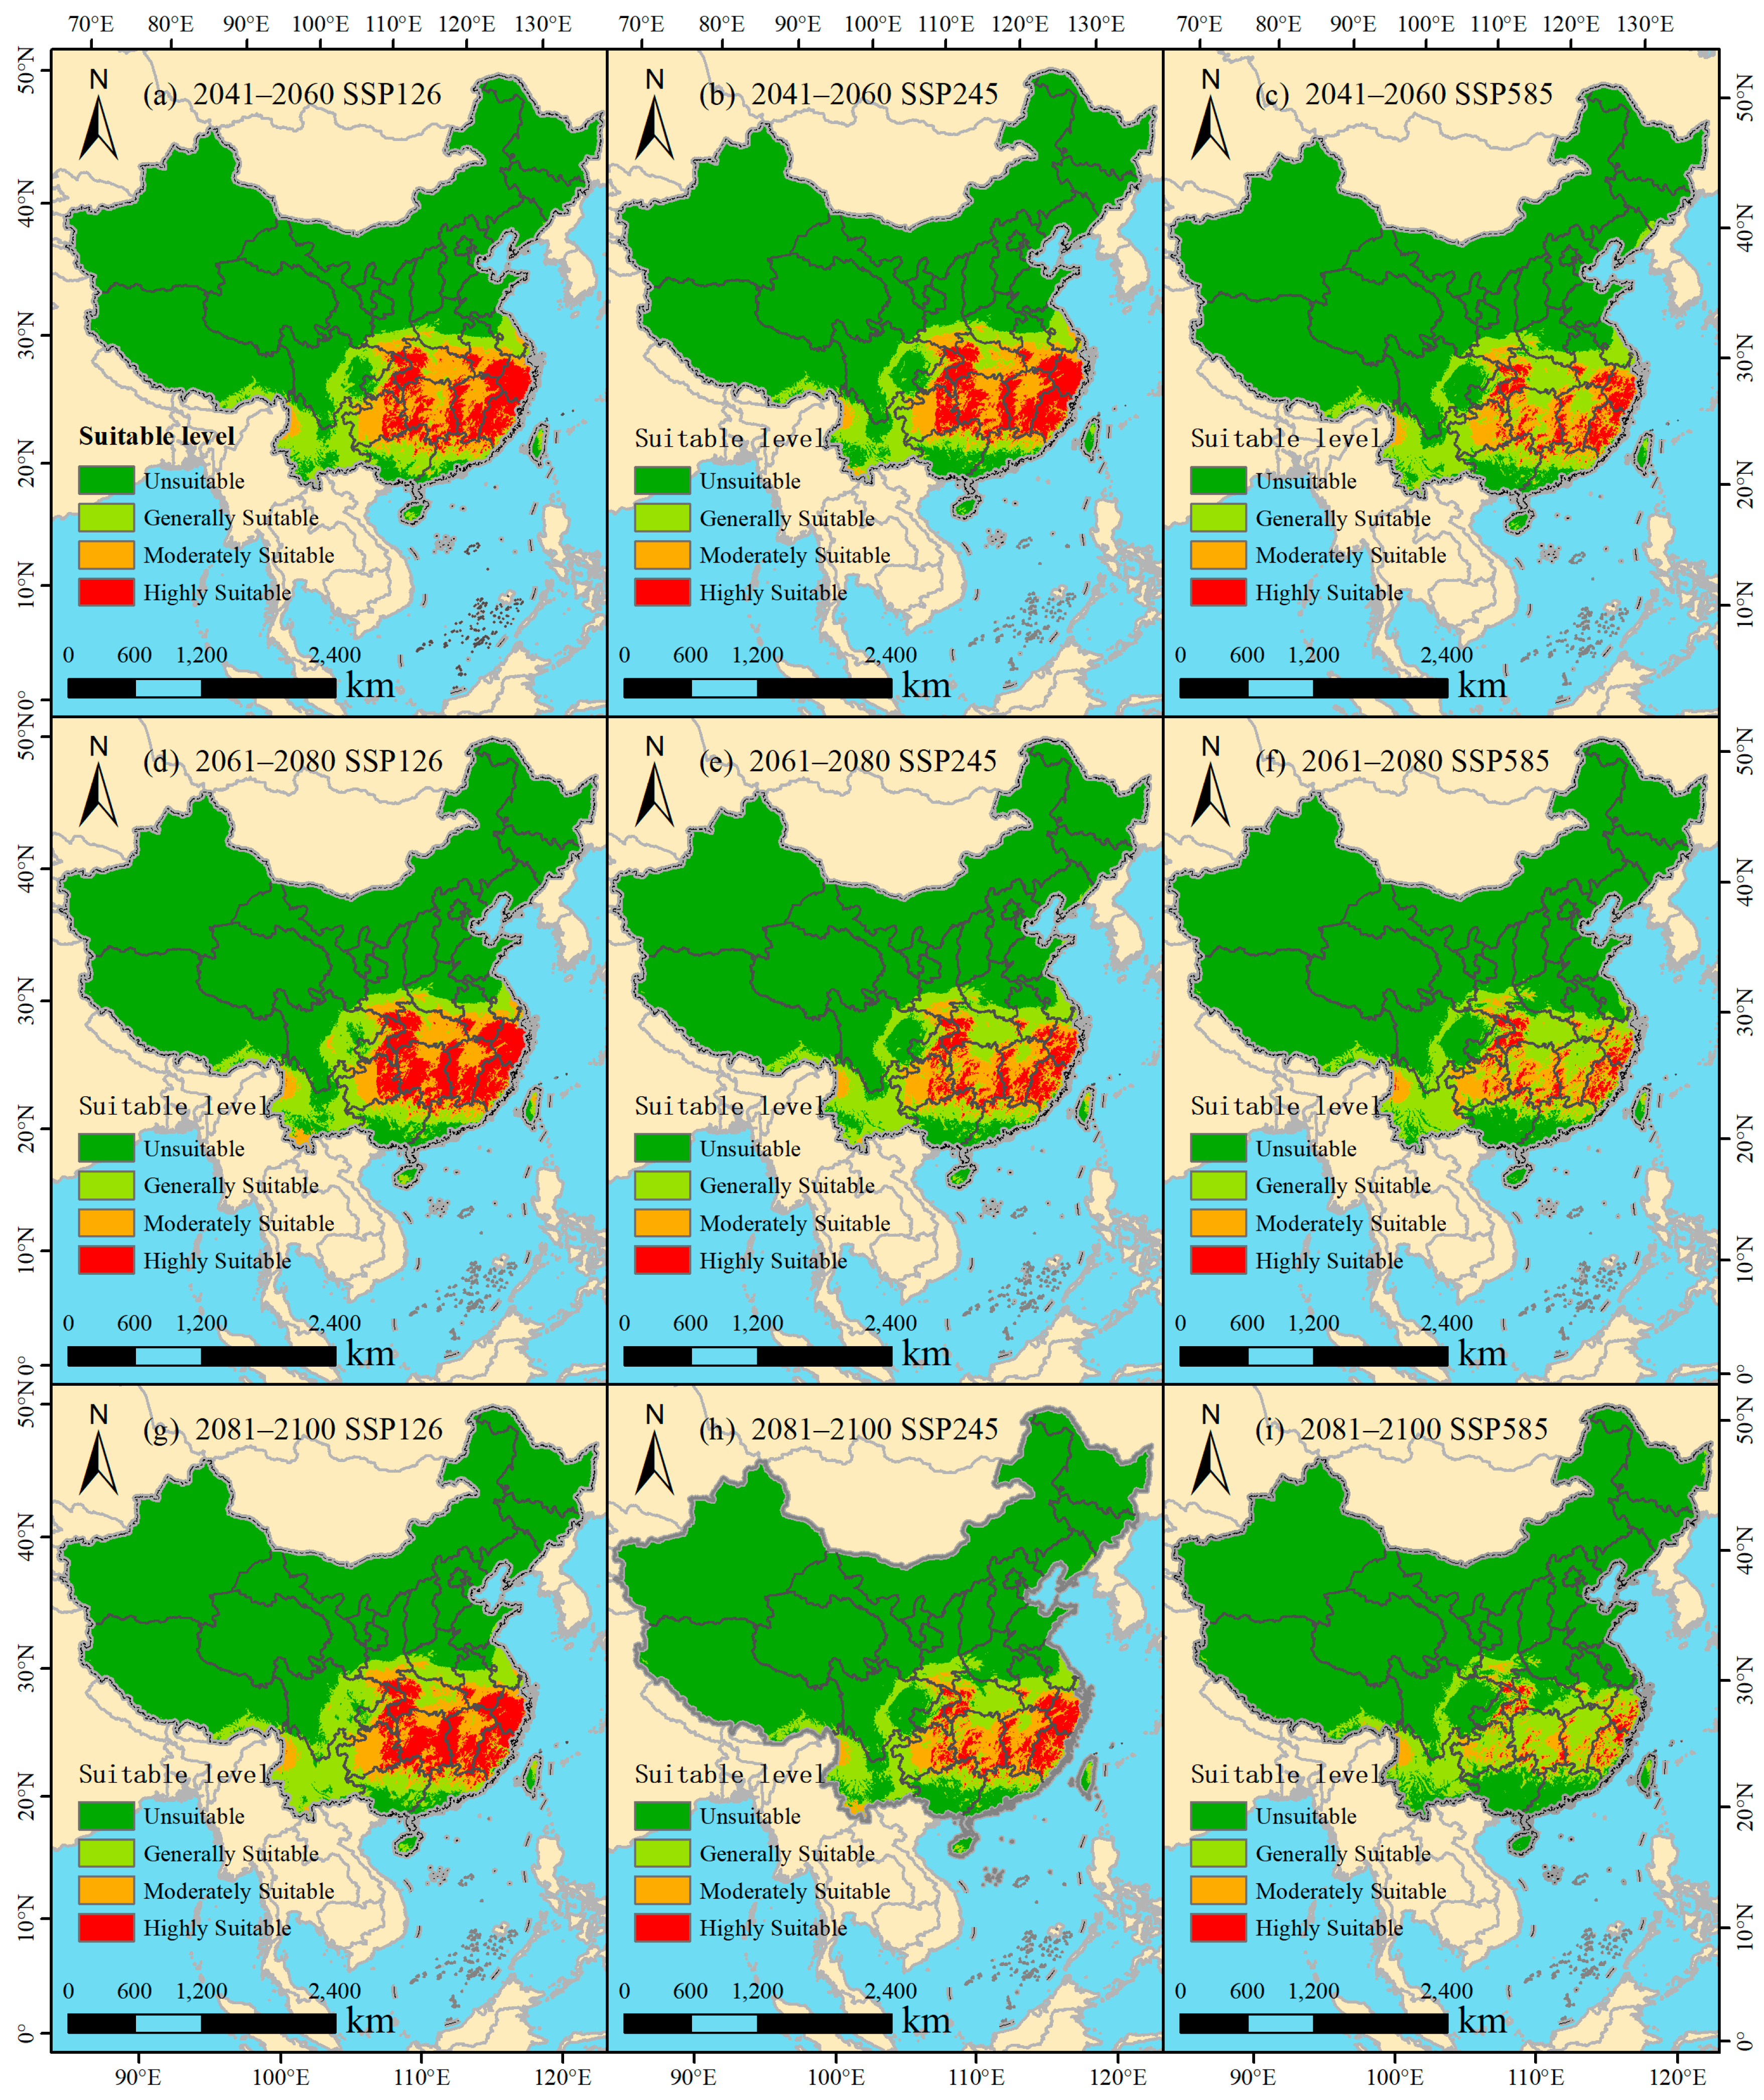
3.4.1. Potential Distribution of I. latifolia Based on Different Future Climate Scenarios

In the spatial layout (Figure 7), under the three future climate scenarios, the distribution range of suitable habitats shows relatively little change, whereas highly suitable areas under the (2081–2100) SSP585 scenario decrease significantly. In addition, the potential distributions and areas of highly suitable and moderately to low suitable habitats are slightly different across various periods and climate scenarios, with distinct characteristics of change.
Under the SSP126 scenario, I. latifolia habitats in the southeast expand, reaching 200.31 × 10⁴ km2 by 2041–2060, with highly suitable areas growing to 63.13 × 10⁴ km2. By 2061–2080, the highly suitable habitat further expands to 61.29 × 10⁴ km2, mainly in central Hubei. During 2081–2100, there is a slight decrease to 55.88 × 10⁴ km2, with moderately suitable areas expanding in southern regions. Despite a total decrease to 212.66 × 10⁴ km2, the habitat remains larger than under current conditions, indicating the adaptability of I. latifolia under this scenario. Under the SSP245 scenario, despite an overall habitat increase of 34.51 × 10⁴ km2, suitable habitats of I. latifolia show a long-term decline. During 2041–2060, a peak in suitable areas occurs, with 52.88 × 10⁴ km2 of highly suitable areas, concentrated in Guizhou East and Hubei West. However, by 2081–2100, a significant reduction is seen, particularly in Guizhou East and Hunan West, with a total decrease of 5.77 × 10⁴ km2 in highly suitable habitats. This suggests that I. latifolia faces substantial survival challenges under these climate conditions. Under the SSP585 scenario, I. latifolia faces a significant reduction in suitable habitats, potentially threatening its survival. Despite a temporary increase in total suitable area to 185.92 × 10⁴ km2 by 2041–2060, highly suitable regions shrink, particularly in the northern part of Guangdong and other areas. During 2081–2100, highly suitable habitats plummet to 10.15 × 10⁴ km2, a 24.13 × 10⁴ km2 decrease from the present, underlining the adverse effects of tripled CO2 emissions on I. latifolia. The SSP245 scenario, while more credible, also shows a general decline in suitable habitats. Collectively, these results indicate a high risk to the future survival of I. latifolia, necessitating attention and action regarding its habitat and cultivation.

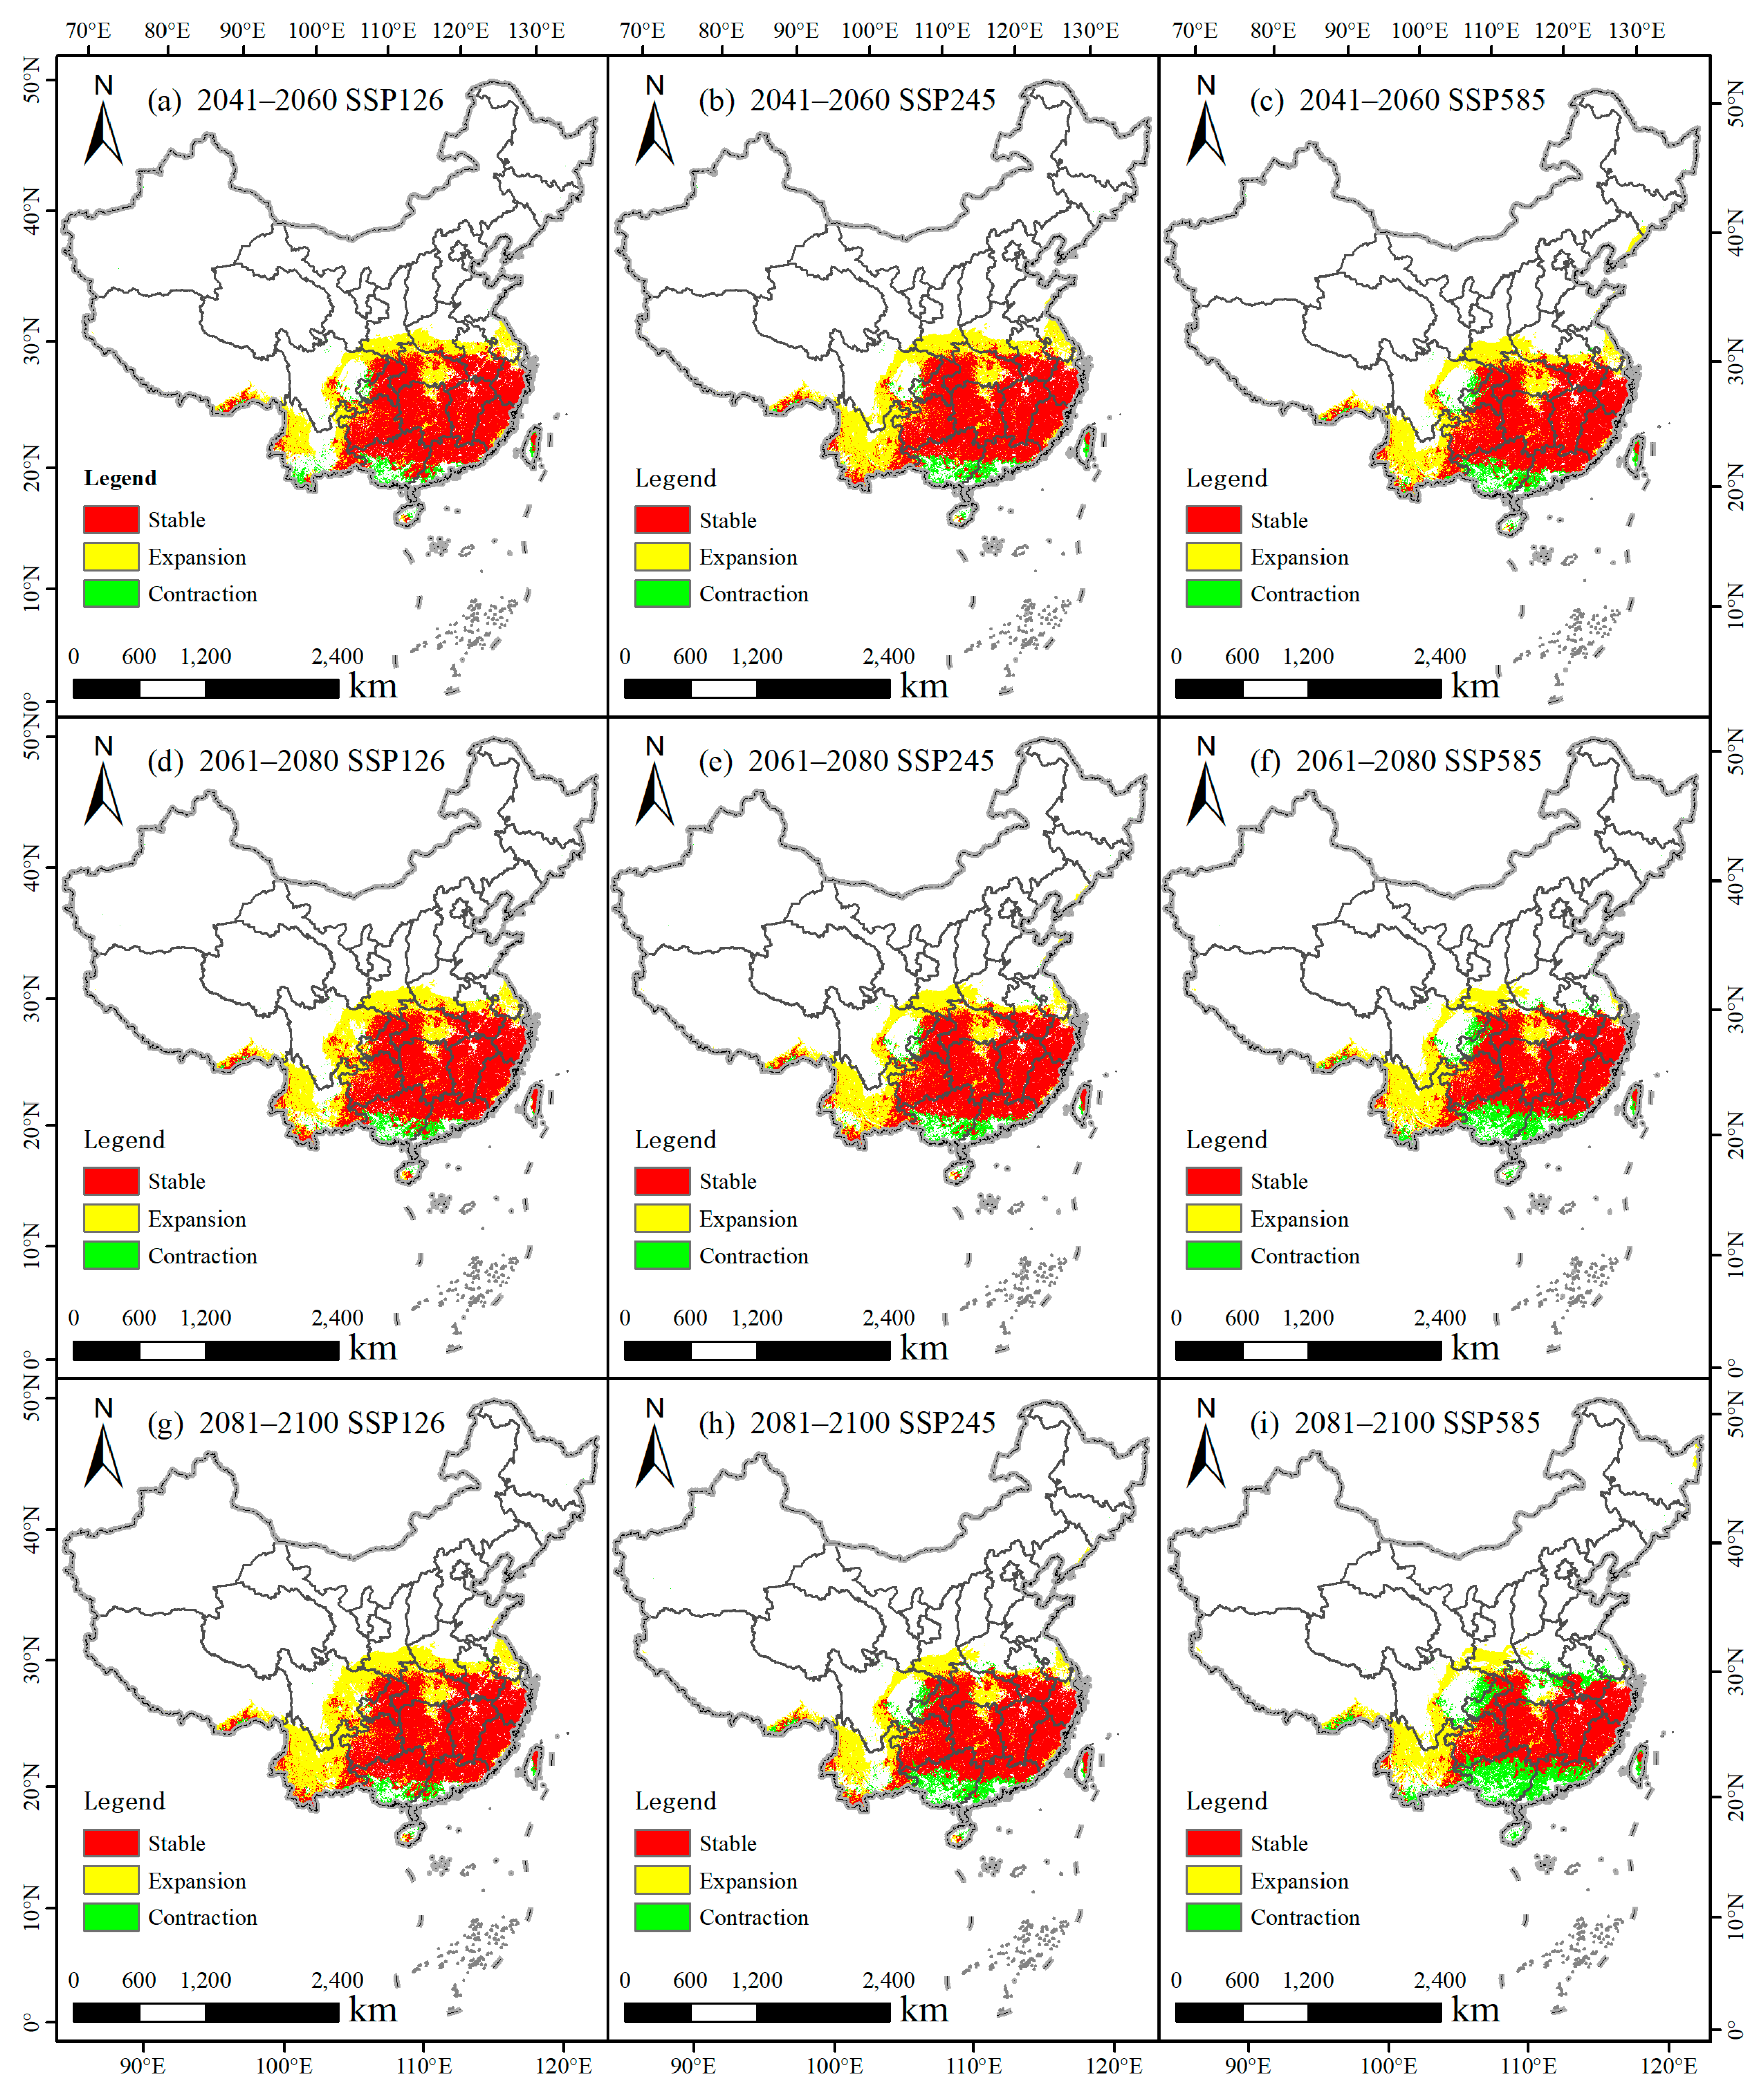
3.4.2. Dynamic Change of the Predicted Potentially Suitable Area for I. latifolia

The predictions made using the MaxEnt model indicate that, under the three future climate scenarios, I. latifolia will experience changes not only in the suitability of its habitats but also in its spatial distribution (Figure 8) and area changes (Table 3) as the climate scenarios evolve. From 2041 to 2100, under the three climate scenarios, I. latifolia remains stably distributed in the southeastern region of China, including Guizhou, Fujian, Zhejiang, Hunan, Jiangxi, Chongqing, the northern part of Guangxi, the northern part of Guangdong, southern Anhui, and the eastern and western parts of Hubei, with only minor increases or decreases in certain areas.
Under the low greenhouse gas emission scenario (SSP126), during 2041–2060, the expansion area of I. latifolia is 66.42 × 10⁴ km2, with expansion regions located in the southeastern part of Xinjiang, western Yunnan, eastern Sichuan, southern Shaanxi, southern Henan, central Hubei, central Anhui, and Jiangxi, among other places, increasing the area by 29.11% compared to the present; during 2061–2080, the expansion area further increases to 79.92 × 10⁴ km2, mainly distributed in the southeastern part of Xinjiang, Yunnan, eastern Sichuan, southern Shaanxi, southern Henan, central Hubei, central Anhui, and Jiangxi; during 2081–2100, the expansion area increases by 37.31% compared to the present, with the main expansion regions being the southeastern part of Xinjiang, Yunnan, southern Shaanxi, southwestern Henan, central Hunan, and Jiangsu. Under this scenario, the growth area of I. latifolia expands from 66.42 × 10⁴ km2 to 96.30 × 10⁴ km2, an increase of 29.88 × 10⁴ km2, with a total reduction area of 3.64 × 10⁴ km2.
Under the moderate greenhouse gas emission scenario (SSP245), during 2041–2060, the expansion area of I. latifolia is 86.53 × 10⁴ km2, mainly in the southern part of Xinjiang, Yunnan, central Guizhou, southern Shaanxi, central Hubei, western Henan, northern Anhui, Jiangxi, and other regions, with a reduction area of 13.57 × 10⁴ km2, mainly in the southern part of Yunnan, southwestern Guangxi, southern Guangdong, and northeastern Hainan. During 2061–2080, the expansion and reduction areas are 73.38 × 10⁴ km2 and 15.48 × 10⁴ km2, respectively, changing by 31.2% and 6.58% compared to the present, with the main expansion in Yunnan, eastern Guizhou, southern Shaanxi, southwestern Henan, central Hubei, central Anhui, and Jiangsu, and the main reduction areas in the southern part of Guangxi and southern Guangdong. By 2100, the expansion area decreases to 62.85 × 10⁴ km2, a change of 27.98%, showing a significant change, and the growth area of I. latifolia gradually decreases in the southern part of Guangdong, southwestern Guangxi, and the border area between Sichuan and Chongqing, with the reduction area showing an increasing trend, potentially decreasing to 23.46 × 10⁴ km2 in the future, indicating that the growth area of I. latifolia is greatly affected, presenting a survival crisis.
Under the high greenhouse gas emission scenario (SSP585), the growth area of I. latifolia expands in Yunnan, central Guizhou, southern Shaanxi, central Hubei, and other regions, but the expansion area, similar to the SSP245 scenario, shows a gradually decreasing trend, with a total reduction of 19.98 × 10⁴ km2, significantly reduced in Guangxi and Guangdong and slightly reduced in the eastern part of Guizhou, the junction of Henan and Hubei, and the southern part of Anhui. During 2041–2060, the expansion area of I. latifolia is 74.87 × 10⁴ km2, with a change rate of 31.64%, slightly less than the expansion area under the SSP245 scenario, with the main reduction areas in the northern part of Jiangsu and the southeastern part of Henan. Compared to the present, there are increases in the southern part of Xinjiang, Yunnan, central Guizhou, southern Shaanxi, southwestern Henan, central Hubei, and southern Jiangsu, with a stable area of 142.92 × 10⁴ km2, a change rate of 60.39%, indicating that under the SSP585 scenario, the growth of I. latifolia is relatively stable during this period, with more increases than decreases. From 2061–2080 to 2081–2100, the expansion area of I. latifolia changes from 68.16 × 10⁴ km2 to 54.90 × 10⁴ km2, gradually decreasing over time, while the reduction area shows the opposite trend, increasing from 29.49 × 10⁴ km2 to 48.51 × 10⁴ km2, with the main change areas being in the southern part of Guangxi, southern Guangdong, central Hubei, central Anhui, southern Henan, southern Taiwan, and other regions. Considering the dynamic changes in the areas of I. latifolia under the three climate scenarios for each time period, I. latifolia is more suitable for the SSP126 scenario, where the expansion and stable areas of I. latifolia continue to increase. Compared with the other two scenarios, its growth situation is the ideal scenario for the current scarcity of I. latifolia.

3.4.3. The Core Distributional Shifts of I. latifolia

The trend of the centroid shift in the distribution of I. latifolia, as indicated in Figure 9, shows that under current climate conditions, the center of distribution for I. latifolia is located near Lingguandian Village, Zhaoyang City, Hunan Province, at 111°39′ E, 27°11′ N. Under the SSP126 climate scenario, during 2041–2060, the centroid of I. latifolia distribution is projected to be in Xupu County, Huaihua City, Hunan Province, at 110°36′ E, 28°5′ N. During 2061–2080, the centroid is expected to move to Yuanling County, Huaihua City, Hunan Province, at 110°27′ E, 28°10′ N. By 2081–2100, the centroid is forecasted to be in Luxi County, Xiangxi Tujia and Miao Autonomous Prefecture, Hunan Province, at 110°5′ E, 28°9′ N. The data suggest that, under a scenario with low greenhouse gas emission concentrations, the centroid of I. latifolia generally experiences minor changes within Hunan Province, moving westward and shifting from lower to higher altitudes.
Under the SSP245 climate scenario, during 2041–2060, the centroid of I. latifolia is located in Yuanling County, Huaihua City, Hunan Province, at 110°23′ E, 28°10′ N. During 2061–2080, the centroid remains in Yuanling County, Huaihua City, Hunan Province, but shifts to 110°32′ E, 28°9′ N. During 2081–2100, the centroid is expected to be in Xupu County, Huaihua City, Hunan Province, at 110°41′ E, 28°9′ N. The centroid migration in this scenario shows an eastward movement in the horizontal gradient and a descent to lower altitudes in the vertical gradient.
Under the SSP585 climate scenario, during 2041–2060, the distribution center of I. latifolia is projected to be in Anhua County, Yiyang City, Hunan Province, at 110°47′ E, 28°18′ N. During 2061–2080, the distribution center is expected to move to Luxi County, Xiangxi Tujia and Miao Autonomous Prefecture, Hunan Province, at 110°4′ E, 28°2′ N. By 2081–2100, the distribution center is forecasted to be in Luxi County, Xiangxi Tujia and Miao Autonomous Prefecture, Hunan Province, at 110°10′ E, 28°11′ N. The distribution center remains primarily within the boundaries of Hunan Province, showing a westward migration trend and an ascent to higher altitudes.

4. Discussion

4.1. MaxEnt Model Performance

In this study, we utilized the MaxEnt model in conjunction with ArcGIS software to simulate the potentially suitable growth areas for I. latifolia, based on 165 sample distribution points and 39 environmental factors. The MaxEnt model, known for its powerful analytical capabilities, has successfully predicted the potential distribution areas of various species in previous studies, such as soybeans [29]. The advantage of the MaxEnt model lies in its ability to generate response curves of target species to environmental factors and quantitatively analyze the environmental factors of suitable habitats, without being limited by the size of the sample volume [30,31]. Moreover, the model is not only applicable to the prediction of suitable areas for endangered species but also for predicting the trends of invasive species, providing a scientific basis for the formulation of control strategies. To further improve the accuracy of predictions, follow-up studies can focus on the following aspects: First, optimize MaxEnt model parameters, including sampling bias correction, threshold determination, model testing, and complexity adjustment [32]. Appropriate parameter adjustment can result in smoother response curves for species, more accurately reflecting their response to environmental changes. Second, employ a multimodel ensemble analysis approach, compare the predictions from different models, and select the optimal predictions to enhance the overall accuracy of the forecasts.

4.2. Major Climate Factors Affecting the Distribution of I. latifolia in China

The impact of climate change on species distribution is becoming increasingly evident. Through MaxEnt analysis in this study, the main bioclimatic factors affecting the distribution of I. latifolia were identified, including annual precipitation, minimum temperature of the coldest month, seasonal precipitation, and slope. Variations in annual precipitation and seasonal precipitation directly affect the water supply for plants, and I. latifolia may prefer a certain range of precipitation [33]. Temperature is a key factor in determining plant survival, especially for tropical and subtropical plants. The minimum temperature of the coldest month may determine the survival ability of I. latifolia during the cold season [34]. Slope indirectly affects plant distribution by influencing environmental conditions such as soil erosion, drainage, and sunlight exposure. Understanding the impact of these bioclimatic factors on the distribution of I. latifolia helps to predict the possible migration trends and habitat changes of the species under future climate change scenarios, providing a scientific basis for the formulation of conservation measures. It is crucial to acknowledge that species distributions are influenced by a myriad of biotic interactions within their ecosystems. These interactions include competition, symbiotic relationships such as those with mycorrhizal fungi, and dependencies on pollinators, which can significantly impact species distributions. The dynamic interplay of biotic and abiotic factors, particularly under varying future climate scenarios, adds layers of complexity that our current model does not capture. Future research should aim to integrate these biotic factors to provide a more holistic understanding of species responses to climate change.

4.3. Species Habitat Suitability Mapping Applications and Centroids

Habitat suitability mapping, through the integration of the MaxEnt model with ArcGIS software, combines the current habitat conditions of species with their future habitat distribution, providing a scientific basis for the conservation of biodiversity [35,36]. This habitat suitability mapping helps to identify areas that are crucial for the conservation of biodiversity, offering a reference for regional planning and ecological spatial management. Additionally, this technique can be part of environmental impact assessments, aiding in evaluating the potential effects of new development projects on biodiversity and taking measures to mitigate negative impacts during the project planning phase. Against the backdrop of global climate change, habitat suitability mapping can be utilized to predict the possible migration trends and habitat changes of species under future climate conditions, providing a scientific foundation to address the threats to biodiversity posed by climate change [37,38]. By simulating different climate scenarios, it is possible to forecast potential habitat contractions or expansions of species, thereby enabling the formulation of adaptive management measures. Under SSP126, SSP245, and SSP585 scenarios, the centroid of the suitable area for I. latifolia will migrate toward the northwest under the three climate scenarios during 2041–2060, which is similar to previous studies [39,40]. The possible reason is that global warming may make the temperatures in higher latitude areas more suitable for the growth of Ilex latifolia. In addition, global warming may also affect precipitation patterns and seasonal climate characteristics. These changes can alter the ecological needs of Ilex latifolia, further prompting its distribution centroid to migrate towards the northwest and other directions. Climate change is not just about the rise in temperature; it also includes changes in precipitation patterns and an increase in extreme weather events, among other things. The combined effects of these factors may be responsible for the opposite trend of movement of the range centroid for scenario SSP245.

4.4. Limitations of This Study

This study has some limitations. First, the selected influencing factors mainly considered environmental elements such as climate and soil and did not fully account for the impact of human activities and interactions between species. This may limit the accuracy of the predictions made by the MaxEnt model [41,42]. Future research should consider additional environmental factors related to the growth habits of the species to enhance the accuracy of the model’s predictions. Second, the study only used distribution point data for I. latifolia within China, which may not fully reflect the species’ response to the environment, especially its adaptability to distribution areas on a global scale. Moreover, there may be errors in the process of collecting distribution point data, although we have collected as much distribution data as possible to reduce errors. Despite the aforementioned shortcomings, the predicted changes in the suitability of I. latifolia in China under climate change in this study can still provide a theoretical basis for the introduction, cultivation, and industrial development of the species. While our MaxEnt model offers important insight into potential shifts in temperature-related habitats, the results should be viewed as indicative of broad ecological trends rather than specific guidelines for species management. The inherent limitations of single-species models, including the exclusion of biotic interactions and other subtle ecological factors, necessitate a cautious interpretation of the results.

5. Conclusions

This study applied the MaxEnt model and ArcGIS to predict the habitat suitability and distribution of Ilex latifolia under future climate scenarios. Key environmental factors affecting its growth include annual precipitation, the lowest temperature of the coldest month, seasonal rainfall, and slope. Under the lower-emission scenario (SSP126), suitable habitats showed an initial decrease followed by an increase. By contrast, under the mid-level emission scenario (SSP245) and the high-emission scenario (SSP585), suitable habitats indicated a continuous decline, suggesting a potential survival crisis for I. latifolia.
The study also predicted the migration of the I. latifolia distribution center. Under the lower-emission scenario (SSP126) and the high-emission scenario (SSP585), a westward and upward shift is expected. Conversely, under the mid-level emission scenario (SSP245), an opposite trend was observed. These findings provide valuable insight for conservation strategies, emphasizing the importance of further research on ecological adaptability and effective management to mitigate the impact of climate change on I. latifolia. Ensuring biodiversity and ecosystem services preservation remains a critical priority.

Author Contributions

Conceptualization, Y.M., Y.L. and X.G.; Data curation, Y.L., J.H. and X.G.; Formal analysis, J.H.; Funding acquisition, Y.L.; Investigation, Y.M.; Methodology, Y.M., Y.L. and Y.X.; Project administration, Y.L., J.H. and X.G.; Software, Y.M., Y.L., Y.X. and L.Z.; Supervision, Y.M., Y.L., Y.X. and L.Z.; Validation, Y.L. and J.H.; Writing—original draft, Y.M., Y.L., Y.X. and L.Z.; Writing—review & editing, Y.M., Y.L., Y.X. and X.G. All authors have read and agreed to the published version of the manuscript.

Funding

This research was funded by the Guizhou Province Ordinary Colleges and Universities Youth Science and Technology Talent Growth Project (QJHKYZ [2022]304), Fundamental Research Funds for the Guizhou Provincial Science and Technology Project (QKHJC-ZK [2022] YB335), and Guizhou Education University Scientific Research Fund Project (2024YB002; 2024BSKQ003).

Data Availability Statement

The original contributions presented in this study are included in this article. Further inquiries can be directed to the corresponding author.

Conflicts of Interest

Author Ling Zhao was employed by the company State Power Investment Corporation Power Station Operation Technology (Beijing) Co., Ltd. The remaining authors declare that the research was conducted in the absence of any commercial or financial relationships that could be construed as a potential conflict of interest.

References

  1. Li, L.; Xu, L.J.; Ma, G.Z.; Dong, Y.M.; Peng, Y.; Xiao, P.G. The large-leaved Kudingcha (Ilex latifolia Thunb and Ilex kudingcha C.J. Tseng): A traditional Chinese tea with plentiful secondary metabolites and potential biological activities. J. Nat. Med. 2013, 67, 425–437. [Google Scholar] [CrossRef] [PubMed]
  2. Avaria-Llautureo, J.; Venditti, C.; Rivadeneira, M.M.; Inostroza-Michael, O.; Rivera, R.J.; Hernández, C.E.; Canales-Aguirre, C.B. Historical warming consistently decreased size, dispersal and speciation rate of fish. Nat. Clim. Change 2021, 11, 787793. [Google Scholar] [CrossRef]
  3. Gao, J.S.; Zhuang, S.Y.; Qian, Z.Z. Effects of Canopy Closure on Photosynthetic Characteristics of Ilex latifolia Thunb. in Phyllostachys pubescens Forests. Res. Ecol. 2020, 2, 16–22. [Google Scholar] [CrossRef]
  4. Masson-Delmotte, V.P.; Zhai, P.; Pirani, S.L.; Connors, C.; Péan, S.; Berger, N.; Caud, Y.; Chen, L.; Goldfarb, M.I.; Scheel Monteiro, P.M. IPCC, Summary for Policymakers, in Climate Change 2021—The Physical Science Basis: Working Group I Contribution to the Sixth Assessment Report of the Intergovernmental Panel on Climate Change; Intergovernmental Panel on Climate Change, Ed.; Cambridge University Press: Cambridge, UK, 2023; pp. 467–544. [Google Scholar]
  5. Zhou, B.T.; Qian, J. Changes of weather and climate extremes in the IPCC AR6. Clim. Change Res. 2021, 17, 713–718. [Google Scholar]
  6. Bellard, C.; Bertelsmeier, C.; Leadley, P.; Thuiller, W.; Courchamp, F. Impacts of climate change on the future of biodiversity. Ecol. Lett. 2012, 15, 365–377. [Google Scholar] [CrossRef]
  7. Boisvert Marsh, L.; de Blois, S. Unravelling potential northward migration pathways for tree species under climate change. J. Biogeogr. 2021, 48, 10881100. [Google Scholar] [CrossRef]
  8. Lenoir, J.; Bertrand, R.; Comte, L.; Bourgeaud, L.; Hattab, T.; Murienne, J.; Grenouillet, G. Species better track climate warming in the oceans than on land. Nat. Ecol. Evol. 2020, 4, 10441059. [Google Scholar] [CrossRef]
  9. Ohashi, H.; Hasegawa, T.; Hirata, A.; Fujimori, S.; Takahashi, K.; Tsuyama, I.; Nakao, K.; Kominami, Y.; Tanaka, N.; Hijioka, Y.; et al. Biodiversity can benefit from climate stabilization despite adverse side effects of landbased mitigation. Nat. Commun. 2019, 10, 5240. [Google Scholar] [CrossRef]
  10. Shi, J.; Xia, M.; He, G.; Gonzalez, N.C.T.; Zhou, S.; Lan, K.; Ouyang, L.; Shen, X.; Jiang, X.; Cao, F.; et al. Predicting Quercus gilva distribution dynamics and its response to climate change induced by GHGs emission through MaxEnt modeling. J. Environ. Manag. 2024, 357, 120841. [Google Scholar] [CrossRef] [PubMed]
  11. Ye, X.; Zhang, M.; Yang, Q.; Ye, L.; Liu, Y.; Zhang, G.; Chen, S.; Lai, W.; Wen, G.; Zheng, S.; et al. Prediction of Suitable Distribution of a Critically Endangered Plant Glyptostrobus pensilis. Forests 2022, 13, 257. [Google Scholar] [CrossRef]
  12. Zhao, G.; Cui, X.; Sun, J.; Li, T.; Wang, Q.; Ye, X.; Fan, B. Analysis of the distribution pattern of Chinese Ziziphus jujuba under climate change based on optimized biomod2 and MaxEnt models. Ecol. Indic. 2021, 132, 108256. [Google Scholar] [CrossRef]
  13. Elith, J.H.; Graham, C.P.; Anderson, R.; Dudík, M.; Ferrier, S.; Guisan, A.J.; Hijmans, R.; Huettmann, F.R.; Leathwick, J.; Lehmann, A.; et al. Novel methods improve prediction of species’ distributions from occurrence data. Ecography 2006, 29, 129–151. [Google Scholar] [CrossRef]
  14. Phillips, S.J.; Anderson, R.P.; Schapire, R.E. Maximum entropy modeling of species geographic distributions. Ecol. Model. 2006, 190, 231–259. [Google Scholar] [CrossRef]
  15. Hernandez, P.A.; Graham, C.H.; Master, L.L.; Albert, D.L. The effect of sample size and species characteristics on performance of different species distribution modeling methods. Ecography 2006, 29, 773–785. [Google Scholar] [CrossRef]
  16. Farooq, Z.; Sjödin, H.; Semenza, J.C.; Tozan, Y.; Sewe, M.O.; Wallin, J.; Rocklöv, J. European projections of West Nile virus transmission under climate change scenarios. One Health 2023, 16, 100509. [Google Scholar] [CrossRef]
  17. Li, S.Y.; Miao, L.J.; Jiang, Z.H.; Wang, G.J.; Gnyawali, K.R.; Zhang, J.; Zhang, H.; Fang, K.; He, Y.; Li, C. Projected drought conditions in Northwest China with CMIP6 models under combined SSPs and RCPs for 2015–2099. Adv. Clim. Change Res. 2020, 11, 210–217. [Google Scholar] [CrossRef]
  18. Schwalm, C.R.; Glendon, S.; Duffy, P.B. RCP8.5 tracks cumulative CO2 emissions. Proc. Natl. Acad. Sci. USA 2020, 117, 19656–19657. [Google Scholar] [CrossRef] [PubMed]
  19. Sillero, N. What does ecological modelling model? A proposed classification of ecological niche models based on their underlying methods. Ecol. Model. 2011, 222, 1343–1346. [Google Scholar] [CrossRef]
  20. Rong, Z.; Zhao, C.; Liu, J.; Gao, Y.; Zang, F.; Guo, Z.; Mao, Y.; Wang, L. Modeling the Effect of Climate Change on the Potential Distribution of Qinghai Spruce (Picea crassifolia Kom.) in Qilian Mountains. Forests 2019, 10, 62. [Google Scholar] [CrossRef]
  21. Xu, L.; Fan, Y.; Zheng, J.; Guan, J.; Lin, J.; Wu, J.; Liu, L.; Wu, R.; Liu, Y. Impacts of climate change and human activity on the potential distribution of Aconitum leucostomum in China. Sci. Total Environ. 2024, 912, 168829. [Google Scholar] [CrossRef]
  22. Kong, F.; Tang, L.; He, H.; Yang, F.; Tao, J.; Wang, W. Assessing the impact of climate change on the distribution of Osmanthus fragrans using MaxEnt. Environ. Sci. Pollut. Res. 2021, 28, 34655–34663. [Google Scholar] [CrossRef]
  23. Guisan, A.; Thuiller, W. Predicting species distribution: Offering more than simple habitat models. Ecol. Lett. 2005, 8, 993–1009. [Google Scholar] [CrossRef] [PubMed]
  24. Feng, X.; Park, D.S.; Liang, Y.; Pandey, R.; Papeş, M. Collinearity in ecological niche modeling: Confusions and challenges. Ecol. Evol. 2019, 9, 10365–10376. [Google Scholar] [CrossRef] [PubMed]
  25. Pearce, J.; Ferrier, S. Evaluating the predictive performance of habitat models developed using logistic regression. Ecol. Model. 2000, 133, 225245. [Google Scholar] [CrossRef]
  26. Bai, J.; Wang, H.; Hu, Y. Prediction of Potential Suitable Distribution of Liriodendron chinense (Hemsl.) Sarg. in China Based on Future Climate Change Using the Optimized MaxEnt Model. Forests 2024, 15, 988. [Google Scholar] [CrossRef]
  27. Zhang, Q.; Shen, X.; Jiang, X.; Fan, T.; Liang, X.; Yan, W. MaxEnt Modeling for Predicting Suitable Habitat for Endangered Tree Keteleeria davidiana (Pinaceae) in China. Forests 2023, 14, 394. [Google Scholar] [CrossRef]
  28. Guo, J.; Liu, X.; Zhang, Q.; Zhang, D.; Xie, C.; Liu, X. Prediction for the potential distribution area of Codonopsis pilosula at global scale based on MaxEnt model. Chin. J. Appl. Ecol. 2017, 28, 992–1000. [Google Scholar]
  29. Feng, L.; Wang, H.; Ma, X.; Peng, H.; Shan, J. Modeling the current land suitability and future dynamics of global soybean cultivation under climate change scenarios. Field Crops Res. 2021, 263, 108069. [Google Scholar] [CrossRef]
  30. Elith, J.; Phillips, S.J.; Hastie, T.; Dudík, M.; Chee, Y.E.; Yates, C.J. A statistical explanation of MaxEnt for ecologists. Divers. Distrib. 2011, 17, 43–57. [Google Scholar] [CrossRef]
  31. Gebrewahid, Y.; Abrehe, S.; Meresa, E.; Eyasu, G.; Abay, K.; Gebreab, G.; Kidanemariam, K.; Adissu, G.; Abreha, G.; Darcha, G. Current and future predicting potential areas of Oxytenanthera abyssinica (A. Richard) using MaxEnt model under climate change in Northern Ethiopia. Ecol. Process. 2020, 9, 6. [Google Scholar] [CrossRef]
  32. Zhu, G.; Qiao, H. Effect of the MaxEnt model’s complexity on the prediction of species potential distributions. Biodivers. Sci. 2016, 24, 1189–1196. [Google Scholar] [CrossRef]
  33. Zhao, P.; Sun, G.; Ni, G.; Zeng, X. Seasonal differences in the leaf hydraulic conductance of mature Acacia mangium in response to its leaf water use and photosynthesis. Chin. J. Appl. Ecol. 2013, 24, 4956. [Google Scholar]
  34. Xia, P.; Wu, J.; Qiao, J.; Su, J. Physiological responses of broadleaf holly leaves under drought stress. J. Henan Agric. Univ. 2010, 44, 47–51. [Google Scholar]
  35. Wang, F.; Yuan, X.; Sun, Y.; Liu, Y. Species distribution modeling based on MaxEnt to inform biodiversity conservation in the Central Urban Area of Chongqing Municipality. Ecol. Indic. 2024, 158, 111491. [Google Scholar] [CrossRef]
  36. Lian, Y.; Bai, Y.; Huang, Z.; Ali, M.; Wang, J.; Chen, H. Spatio-Temporal Changes and Habitats of Rare and Endangered Species in Yunnan Province Based on MaxEnt Model. Land 2024, 13, 240. [Google Scholar] [CrossRef]
  37. Shi, X.; Wang, J.; Zhang, L.; Chen, S.; Zhao, A.; Ning, X.; Fan, G.; Wu, N.; Zhang, L.; Wang, Z. Prediction of the potentially suitable areas of Litsea cubeba in China based on future climate change using the optimized MaxEnt model. Ecol. Indic. 2023, 148, 110093. [Google Scholar] [CrossRef]
  38. Zhong, X.; Zhang, L.; Zhang, J.; He, L.; Sun, R. MaxEnt Modeling for Predicting the Potential Geographical Distribution of Castanopsis carlesii under Various Climate Change Scenarios in China. Forests 2023, 14, 1397. [Google Scholar] [CrossRef]
  39. Liu, L.; Wang, R.; Zhang, Y.; Mou, Q.; Gou, Y.; Liu, K.; Huang, N.; Ouyang, C.; Hu, J.; Du, B. Simulation of potential suitable distribution of Alnus cremastogyne Burk. In China under climate change scenarios. Ecol. Indic. 2021, 133, 108396. [Google Scholar] [CrossRef]
  40. Xu, X.; Zhang, H.; Yue, J.; Xie, T.; Xu, Y.; Tian, Y. Predicting Shifts in the Suitable Climatic Distribution of Walnut (Juglans regia L.) in China: Maximum Entropy Model Paves the Way to Forest Management. Forests 2018, 9, 103. [Google Scholar] [CrossRef]
  41. Cosentino, F.; Seamark, E.C.J.; Van Cakenberghe, V.; Maiorano, L. Not only climate: The importance of biotic interactions in shaping species distributions at macro scales. Ecol. Evol. 2023, 13, e9855. [Google Scholar] [CrossRef]
  42. Zhao, D.; Wang, J.; Dai, W.; Ye, K.; Chen, J.; Lai, Q.; Li, H.; Zhong, B.; Yu, X. Effects of climate warming and human activities on the distribution patterns of Fritillaria unibracteata in eastern Qinghai-Tibetan Plateau. Sci. Rep. 2023, 13, 15770. [Google Scholar] [CrossRef]
Figure 1. Distribution records of I. latifolia in China.
Forests 15 01227 g001
Figure 2. Receiver operating characteristic curve with the area under the curve (AUC).
Forests 15 01227 g002
Figure 3. Jackknife test for the environmental variables.
Forests 15 01227 g003
Figure 4. Response curves of the occurrence probability of I. latifolia to annual precipitation (Bio12) (a), min temperature of coldest month (Bio6) (b), precipitation seasonality (Bio15) (c), and slope (d) in China. The blue horizontal dotted line represents a logistic output of 0.5. The interval between the two vertical pink dotted lines represents the appropriate range of environmental factors.
Forests 15 01227 g004
Figure 5. Predictions of potentially suitable areas for I. latifolia under current climate conditions.
Forests 15 01227 g005
Figure 6. Changes in the predicted distribution coverages of I. latifolia under different climate scenarios (units: 104 km2).
Forests 15 01227 g006
Figure 7. Potential distribution of I. latifolia based on different future climate scenarios.
Forests 15 01227 g007
Figure 8. Dynamic change maps of the predicted potentially suitable areas for I. latifolia (compared to the current range).
Forests 15 01227 g008
Figure 9. The trend of centroid distribution transfer of I. latifolia.
Forests 15 01227 g009
Table 1. Environmental variables for modeling the potentially suitable habitat of I. latifolia.
FactorsVariablesDescriptionsUnit
ClimateBio1Annual Mean Temperature°C
Bio2Mean Temperature Diurnal Range °C
Bio3Isothermality (Bio2/Bio7) (×100)
Bio4Temperature Seasonality (standard deviation ×100)
Bio5Max Temperature of Warmest Month°C
Bio6Min Temperature of Coldest Month°C
Bio7Temperature Annual Range°C
Bio8Mean Temperature of Wettest Quarter°C
Bio9Mean Temperature of Driest Quarter°°C
Bio10Mean Temperature of Warmest Quarter°C
Bio11Mean Temperature of Coldest Quartermm
Bio12Annual Precipitationmm
Bio13Precipitation of Wettest Monthmm
Bio14Precipitation of Driest Monthmm
Bio15Precipitation Seasonality (Coefficient of Variation)
Bio16Precipitation of Wettest Quartermm
Bio17Precipitation of Driest Quartermm
Bio18Precipitation of Warmest Quartermm
Bio19Precipitation of Coldest Quartermm
SoilT_BDTopsoil Bulk Densityg/cm3
T_BSTopsoil Basic Saturation%
T_CaCO3Topsoil Calcium Carbonate Content%
T_CaSO4Topsoil Calcium Sulfate Content%
T_CEC_CLAYTopsoil Cation Exchange Capacity of Claymmol/kg
T_CEC_SOILTopsoil Cation Exchange Capacity of Soilmmol/kg
T_CLAYTopsoil Clay Fraction%
T_ECETopsoil Salinity (Elco)dS/m
T_ESPTopsoil Sodicity (Exchangeable Sodium Percentage)%
T_GRAVELTopsoil Gravel Content%
T_OCTopsoil Organic Carbon%
T_pH_H2OTopsoil pH (H2O)1
T_SANDTopsoil Sand Fraction%
T_SiltTopsoil Silt Fraction%
T_TEB Topsoil Total Exchangeable Basescmol/kg
TerrainAltitudeAltitudem
SlopeSlope°
AspectAspect
Table 2. Percent contribution and permutation importance of each environmental variable of I. latifolia.
VariablePercent ContributionPermutation Importance
Bio1277.956.5
Bio65.710.1
Bio154.94.8
Slope3.13.9
Aspect1.62.6
T_BS10.6
T_Gravel0.91.5
Bio20.93.2
Bio180.75.4
T_CEC_clay0.63.1
T_CEC_soil0.60.4
T_Clay0.50.7
T_BD0.50.2
Bio100.53.8
T_Sand0.20.3
T_OC0.12.9
Table 3. Changes in the potential suitable habitats area of I. latifolia under different climate scenarios (compared to the current range).
PeriodArea (104 km2) Change (%)
StableExpansionContractionStable RateExpansion RateContraction Rate
(2041–2060) SSP126149.1966.4212.6165.3729.115.53
(2061–2080) SSP126150.9279.9210.8762.4433.064.50
(2081–2100) SSP126152.8296.308.9759.2137.313.48
(2041–2060) SSP245148.2286.5313.5759.6934.855.47
(2061–2080) SSP245146.3273.3815.4862.2231.206.58
(2081–2100) SSP245138.3462.8523.4661.5827.9810.44
(2041–2060) SSP585142.9274.8718.8860.3931.647.98
(2061–2080) SSP585132.3168.1629.4957.5429.6412.82
(2081–2100) SSP585113.2954.9048.5152.2825.3322.39
Disclaimer/Publisher’s Note: The statements, opinions and data contained in all publications are solely those of the individual author(s) and contributor(s) and not of MDPI and/or the editor(s). MDPI and/or the editor(s) disclaim responsibility for any injury to people or property resulting from any ideas, methods, instructions or products referred to in the content.

