Article

Full-Length Transcriptome Assembly of Platycladus orientalis Root Integrated with RNA-Seq to Identify Genes in Response to Root Pruning

College of Forestry, Henan Agricultural University, Zhengzhou 450002, China
*
Authors to whom correspondence should be addressed.
Forests 2024, 15(7), 1232; https://doi.org/10.3390/f15071232
Submission received: 30 June 2024 / Revised: 12 July 2024 / Accepted: 13 July 2024 / Published: 15 July 2024

Abstract

:
Platycladus orientalis (P. orientalis) is a common tree used for vegetation restoration in northern China, and its large area propagation helps to improve site conditions. However, under harsh conditions such as poor land, the survival rate of P. orientalis is very low. Numerous studies have shown that root pruning can promote the formation of lateral roots in seedlings, enhancing the roots’ capacity to absorb soil nutrients and water, and thereby improving the survival rate of seedlings. In this study, a one-third root pruning treatment was applied to P. orientalis seedlings, and the whole transcriptome of seedlings subjected to both control (CK) and root pruning treatments was sequenced to analyze their gene expression profiles. This study investigated the regulatory mechanisms of lateral root development in response to root pruning damage at the molecular level. Using nine cells, 15.28 Gb of clean data were obtained, which yielded 101,688 high-quality full-length transcript sequences and 22,955 low-quality full-length transcript sequences after clustering. Redundancy was then removed using CD-HIT, and Illumina RNA-seq sequencing produced 139.26 Gb of clean data. A total of 2025 differentially expressed genes (DEGs) were identified at three time points following root pruning treatment. Enrichment analysis revealed that the peroxidase gene family plays a significant role in lateral root proliferation. Furthermore, the expression levels of the peroxidase gene family were notably upregulated in comparison to the control group. Pathway enrichment analysis identified 22 relevant genes, which appeared to be highly associated with root growth and resilience to stress. Through examining the expression patterns and correlations of these genes, five central genes emerged as key players. The findings of this research suggest that the peroxidase gene family plays a crucial role in the stress response and root development of P. orientalis, providing reference and guidance for root development in other plant species.

1. Introduction

Plant root development is closely related to the survival and growth of plants [1,2], as roots are the organs directly in contact with the soil [3]. They serve not only to absorb water and nutrients [4] but also to reflect trees’ utilization of site conditions [5], playing crucial roles in tree growth, biodiversity conservation, and ecological restoration of degraded ecosystems [6]. The quality of seedling growth directly influences subsequent growth and yield, thereby becoming an important concern in agricultural production [7]. Nutrient bowl seedling [8] cultivation is widely recognized as an effective method of seedling cultivation. While it maintains the relative integrity of the root system, nutrient bowl seedlings also exhibit drawbacks such as root circling and deformities. Hence, bare-root seedling transplantation [9] remains widely practiced, with root pruning being a common technique to facilitate seedling transplantation and transportation. A well-developed root system plays a vital role not only in nutrient uptake and plant physiological functions but also in helping seedlings adapt to complex environmental conditions [10,11]. Root pruning, a common root disturbance technique in seedling cultivation, involves cutting off a portion of the seedling’s primary roots during cultivation, followed by transplanting them into containers or fields [12]. Root-pruned seedlings can conserve seed resources, ensure uniform seedling growth, facilitate management, and increase seedling survival rates [13]. Du et al. [14] suggested that an appropriate proportion of root pruning could improve indicators such as root length, root diameter, and total stem mass in Carya illinoinensis graft seedlings, thus enhancing seedling quality indices. Therefore, root pruning is often considered an effective method to increase fruit tree yield [15,16,17] and to improve seedling survival rates [18,19]. However, the molecular mechanisms by which root pruning promotes lateral root development and affects seedling quality require further investigation. In terms of vegetation restoration, the rapid formation of seedlings suitable for this purpose is crucial for enhancing the competitiveness of forestry resources.
P. orientalis is a commonly used tree species for vegetation restoration in northern China [20], mainly found on low mountain sunny slopes and semi-sunny slopes. Due to its evergreen nature and beautiful shape, it is known as the “longevity among the woods”. Additionally, P. orientalis also yields certain economic benefits [21]. Extracts from the leaves of P. orientalis can promote local blood circulation, enhance hair follicle metabolism, and have expectorant effects [22]. However, under harsh conditions such as poor land, the survival rate of P. orientalis is very low [23]. Preliminary studies have revealed the effects of root pruning damage on the root development of P. orientalis seedlings at the morphological, physiological, and biochemical levels through different root cutting treatments. Pruning the main root inhibited its growth, promoted the emergence of primary lateral roots, and resulted in seedlings with a greater quantity and total length of primary lateral roots after root pruning as contrasted with those with whole roots. The number and growth of primary lateral roots are related to the proportion of main root pruning, with a more significant increase observed in the 1/3 root pruning treatment as contrasted with the 1/2 root pruning treatment [24]. Nonetheless, the molecular mechanisms of how 1/3 root pruning affects seedling resilience require further research.
Illumina RNA sequencing, a form of next-generation sequencing, is capable of producing quantitative digital gene expression profiles that are not constrained by the need for predetermined probes [25]. This technology has been employed extensively for assembling reference genomes for various plant species such as Arabidopsis thaliana [26], Oryza sativa [27], and Zea mays [28], as well as for the de novo assembly of many organisms, including animals and plants. However, the incomplete and low-quality transcripts often obtained through Illumina RNA sequencing limit the analysis of alternative splicing variants and the correction of annotations [29]. This integration improves genome databases and provides a scientific basis for molecular breeding. The advent of Pacific Biosciences (PacBio) single-molecule real-time (SMRT) sequencing technology [30,31] has unlocked the potential to capture long-read sequences or entire transcriptomes, granting the ability to gather extensive long-read transcripts that encompass full coding sequences and to delineate gene families (with PacBio SMRT sequencing yielding average read lengths exceeding 10 kb, and maximum lengths reaching up to 60 kb). However, there have been instances where SMRT sequencing has delivered gene data that may be inaccurate or suffer from low gene coverage, resulting in elevated error frequencies [32]. To mitigate these issues, the integration of Illumina RNA sequencing reads and circular-consensus sequencing (CCS) reads has been used to enhance accuracy. The recent trend of merging SMRT sequencing with Illumina RNA sequencing at the transcriptomic level has led to a more robust compilation of data, enabling the detection of a broader range of gene isoforms, and shedding light on functional diversity. This synthesis of technologies not only refines genome databases but also lays a foundation for advancements in molecular breeding.
This study aims to explore the regulatory mechanisms of lateral root cutting damage on the root development of P. orientalis at the molecular level, which is of great scientific significance for revealing the molecular mechanisms that promote lateral root development by removing part of the main root and for providing important scientific data for the reproduction of woody plants. This study sequenced the whole transcriptome of P. orientalis seedlings subjected to control (CK) and root pruning treatments using Illumina RNA sequencing and combined the second-generation sequencing data to ensure the accuracy and integrity of the sequences as much as possible. The objective of this dataset is to identify new genes related to lateral root seedling formation and to gain a deeper understanding of the reproductive mechanisms of lateral root seedlings. Based on the data obtained, the research identified many potential key transcripts for each developmental stage through pairwise comparison. According to the functions of these transcripts, the status of root development at different time points was proposed. Concurrently, this study provides an important data foundation for the molecular regulation of woody plant reproduction.

2. Materials and Methods

2.1. Selection of Experimental Materials

The study took place in the third residential zone of the Science and Education Park at Henan Agricultural University, situated in Zhengzhou, Henan Province, China, positioned near 113°42′ East and 34°43′ North. P. orientalis seeds used in the experiment were collected in early October 2022 from Dagou River Forestry Farm, Jiyuan City, and were brought back to the laboratory. They were stored in a refrigerator at 4 °C. On 20 March 2023, seeds were cleansed to remove impurities and hollow grains through the water separation method. Afterward, they were air-dried in the shade and underwent a sand stratification treatment. Once they had turned white, they were ready for sowing. The seeds had an average thousand-grain weight of approximately 3690 ± 112 g. Taking 200 imbibition seeds, longitudinally halved them along the center line of the seed embryo using a blade. Placed half of them in 2 Petri dishes, with each dish containing 100 half seeds, and added an appropriate amount of 0.5% TTC to cover the seeds. Subsequently, placed it in a 30 °C incubator for 0.5 to 1 h. As a result, any embryos stained red is a live seed. The other half is boiled in boiling water for five minutes to kill the embryos. With the same staining treatment as the control observation, the results showed that the germination rate was about 92%. This involved using nutrient bowls with an inner diameter of 30 cm and a height of 35 cm. Before seedling cultivation, the substrate was prepared by mixing sand and vermiculite in a 3:1 volume ratio. The prepared nutrient bowls were placed in trays. P. orientalis seeds, which had undergone sand stratification treatment and whitening, were sown on 21 April 2023, with four seeds per hole, covered with soil, and placed in plastic greenhouses. Normal field management was carried out thereafter, including regular irrigation, weeding, and observation and recording of plant growth. To prevent the influence of other chemicals on the experimental outcomes, fertilizers and pesticides were not used at any point during the seedling cultivation experiment.
Prior to root pruning, scissors were prepared along with a disinfectant solution of 75% alcohol. The primary roots were trimmed to 1/3 of their original length, while the entire root system was preserved for the control group. The experimental design included two groups: the control group and the root-pruned group, each group took 200 seedlings with basically the same growth as the test samples, and each with three replicates for each treatment. Sampling of test samples: at 1 day, 20 days, and 60 days after the root pruning treatment, root and leaf tissues of P. orientalis seedlings in the treatment and control groups were sampled. To avoid the influence of plant physiological cycles on the experimental results, sampling was conducted between 9:00 and 11:00 A.M. each time. Twenty seedlings were selected as sampling materials for each repetition. The sampled tissues were wrapped in aluminum foil, placed in a liquid nitrogen tank for 10 to 15 min, and then stored in a −80 °C ultra-low temperature freezer until RNA extraction.

2.2. RNA Extraction, RNA-Seq, and PacBio Full-Length ISO-Seq Library Preparation and Sequencing

RNA samples from various stages of root development in both the root pruning treatment group and the control group were extracted using the Polysaccharide Polyphenol Plant Total RNA Rapid Extraction Kit (Tiangen, Beijing, China) as per the manufacturer’s protocol. Subsequently, the samples were treated with RNase-free DNase I at 37 °C for 1 h to eliminate any genomic DNA contamination. The quality of the RNA was determined using 0.8% agarose gel electrophoresis and assessed with a NanoDrop ND-1000 spectrophotometer (Thermo, Waltham, MA, USA). Additionally, the integrity of the mRNA, with a required integrity value of over 6.0, was measured using the Agilent 2100 Bioanalyzer (Agilent Technologies, Palo Alto, CA, USA). RNA samples with A260/A280 ratios between 1.9 and 2.1, a 28S:18S ratio of 2:1, and RNA integrity numbers ≥ 6 were deemed suitable for subsequent analyses.
RNA-Seq libraries were constructed using the Illumina TruSeq™ RNA Sample Prep Kit (Illumina, San Diego, CA, USA), adhering strictly to the manufacturer’s instructions. This process involved the removal of ribosomal RNA (rRNA) from purified total RNA, purification of the remaining RNA, fragmentation, first-strand cDNA synthesis, second-strand cDNA synthesis, end repair, 3′ end adenylation, adapter ligation, enrichment, and other steps to complete library construction for sequencing samples. The quality of the constructed high-throughput sequencing libraries was assessed by quantification using a Qubit® 2.0 Fluorometer (Thermo, Waltham, MA, USA) and size evaluation using an Agilent 2100 Bioanalyzer (Agjilent, Santa Clara, CA, USA). This was followed by sequencing on the Illumina HiSeq platform for second-generation transcriptome sequencing.
The initial long-read ISO-Seq dataset from PacBio was processed using the prescribed ISO-Seq method (SMRT Analysis 2.3). We filtered out the raw reads that were below 50 base pairs in length or had a quality score under 0.75. We extracted the reads of insert (ROI) from the circular consensus sequences (CCS) by identifying both the 5′ and 3′ ends and the poly(A) tails. We then categorized the sequences into full-length and non-full-length cDNA reads, and eliminated any chimeric sequences that contained sequencing primers. The remaining full-length non-chimeric reads were aligned, and those with similar sequences were grouped into clusters at the isoform level using the iterative clustering for error correction (ICE) process. The respective cluster was labeled as a distinct isoform. Following this, we applied non-full-length cDNA reads to refine each cluster. Isoform sequences that reached a predicted accuracy of over 99% were classified as high-quality, while others were categorized as low-quality.
We enhanced the precision of the lesser-quality isoforms by incorporating Illumina short-read data using the LSC software (LSC 2.0, available at http://augroup.org, accessed on 10 December 2023). By merging these refined low-quality isoforms with the high-quality ones, we generated a set of high-quality, complete transcripts. To reduce this set to a non-redundant collection, we employed the CD-HIT-EST tool (version 4.6, accessible at http://www.bioinformatics.org/cd-hit, accessed on 10 December 2023), with the settings: clustering threshold = 99%, thread count = 6, memory limit = 1 GB, length difference cutoff = 10, sequence identity threshold = 99.9%, description length = 40, and accurate mode = on. This curated set of transcripts then formed the basis of our reference transcriptome for subsequent examinations.

2.3. SSR Analysis

The program MISA v1.0 (accessible at http://pgrc.ipk-gatersleben.de/misa, accessed on 11 December 2023), was employed utilizing standard settings to locate Simple Sequence Repeats (SSRs) within all distinct transcripts of over 500 base pairs. SSR-specific primers were generated employing the primer3 software (version 2.3.6), adhering to its preset configurations.

2.4. Prediction of lncRNAs

Pfam (http://pfam.Xfam.org/, accessed on 11 December 2023), CPAT v1.2 (http://lilab.research.bcm.edu, accessed on 11 December 2023), CNCI v2.0 (https://github.com/www-bioinfo-org/CNCI, accessed on 11 December 2023), and CPC v1.0 (http://cpc.cbi.pku.edu.cn/, accessed on 11 December 2023) were employed to identify unique transcripts lacking protein-coding potential as candidate lncRNAs, using default parameters. Subsequently, EMBOSS getorf v6.1.063 predicted open reading frames (ORFs) for all candidate lncRNAs selected by at least one tool; sequences with ORF lengths greater than 100 bp were discarded.

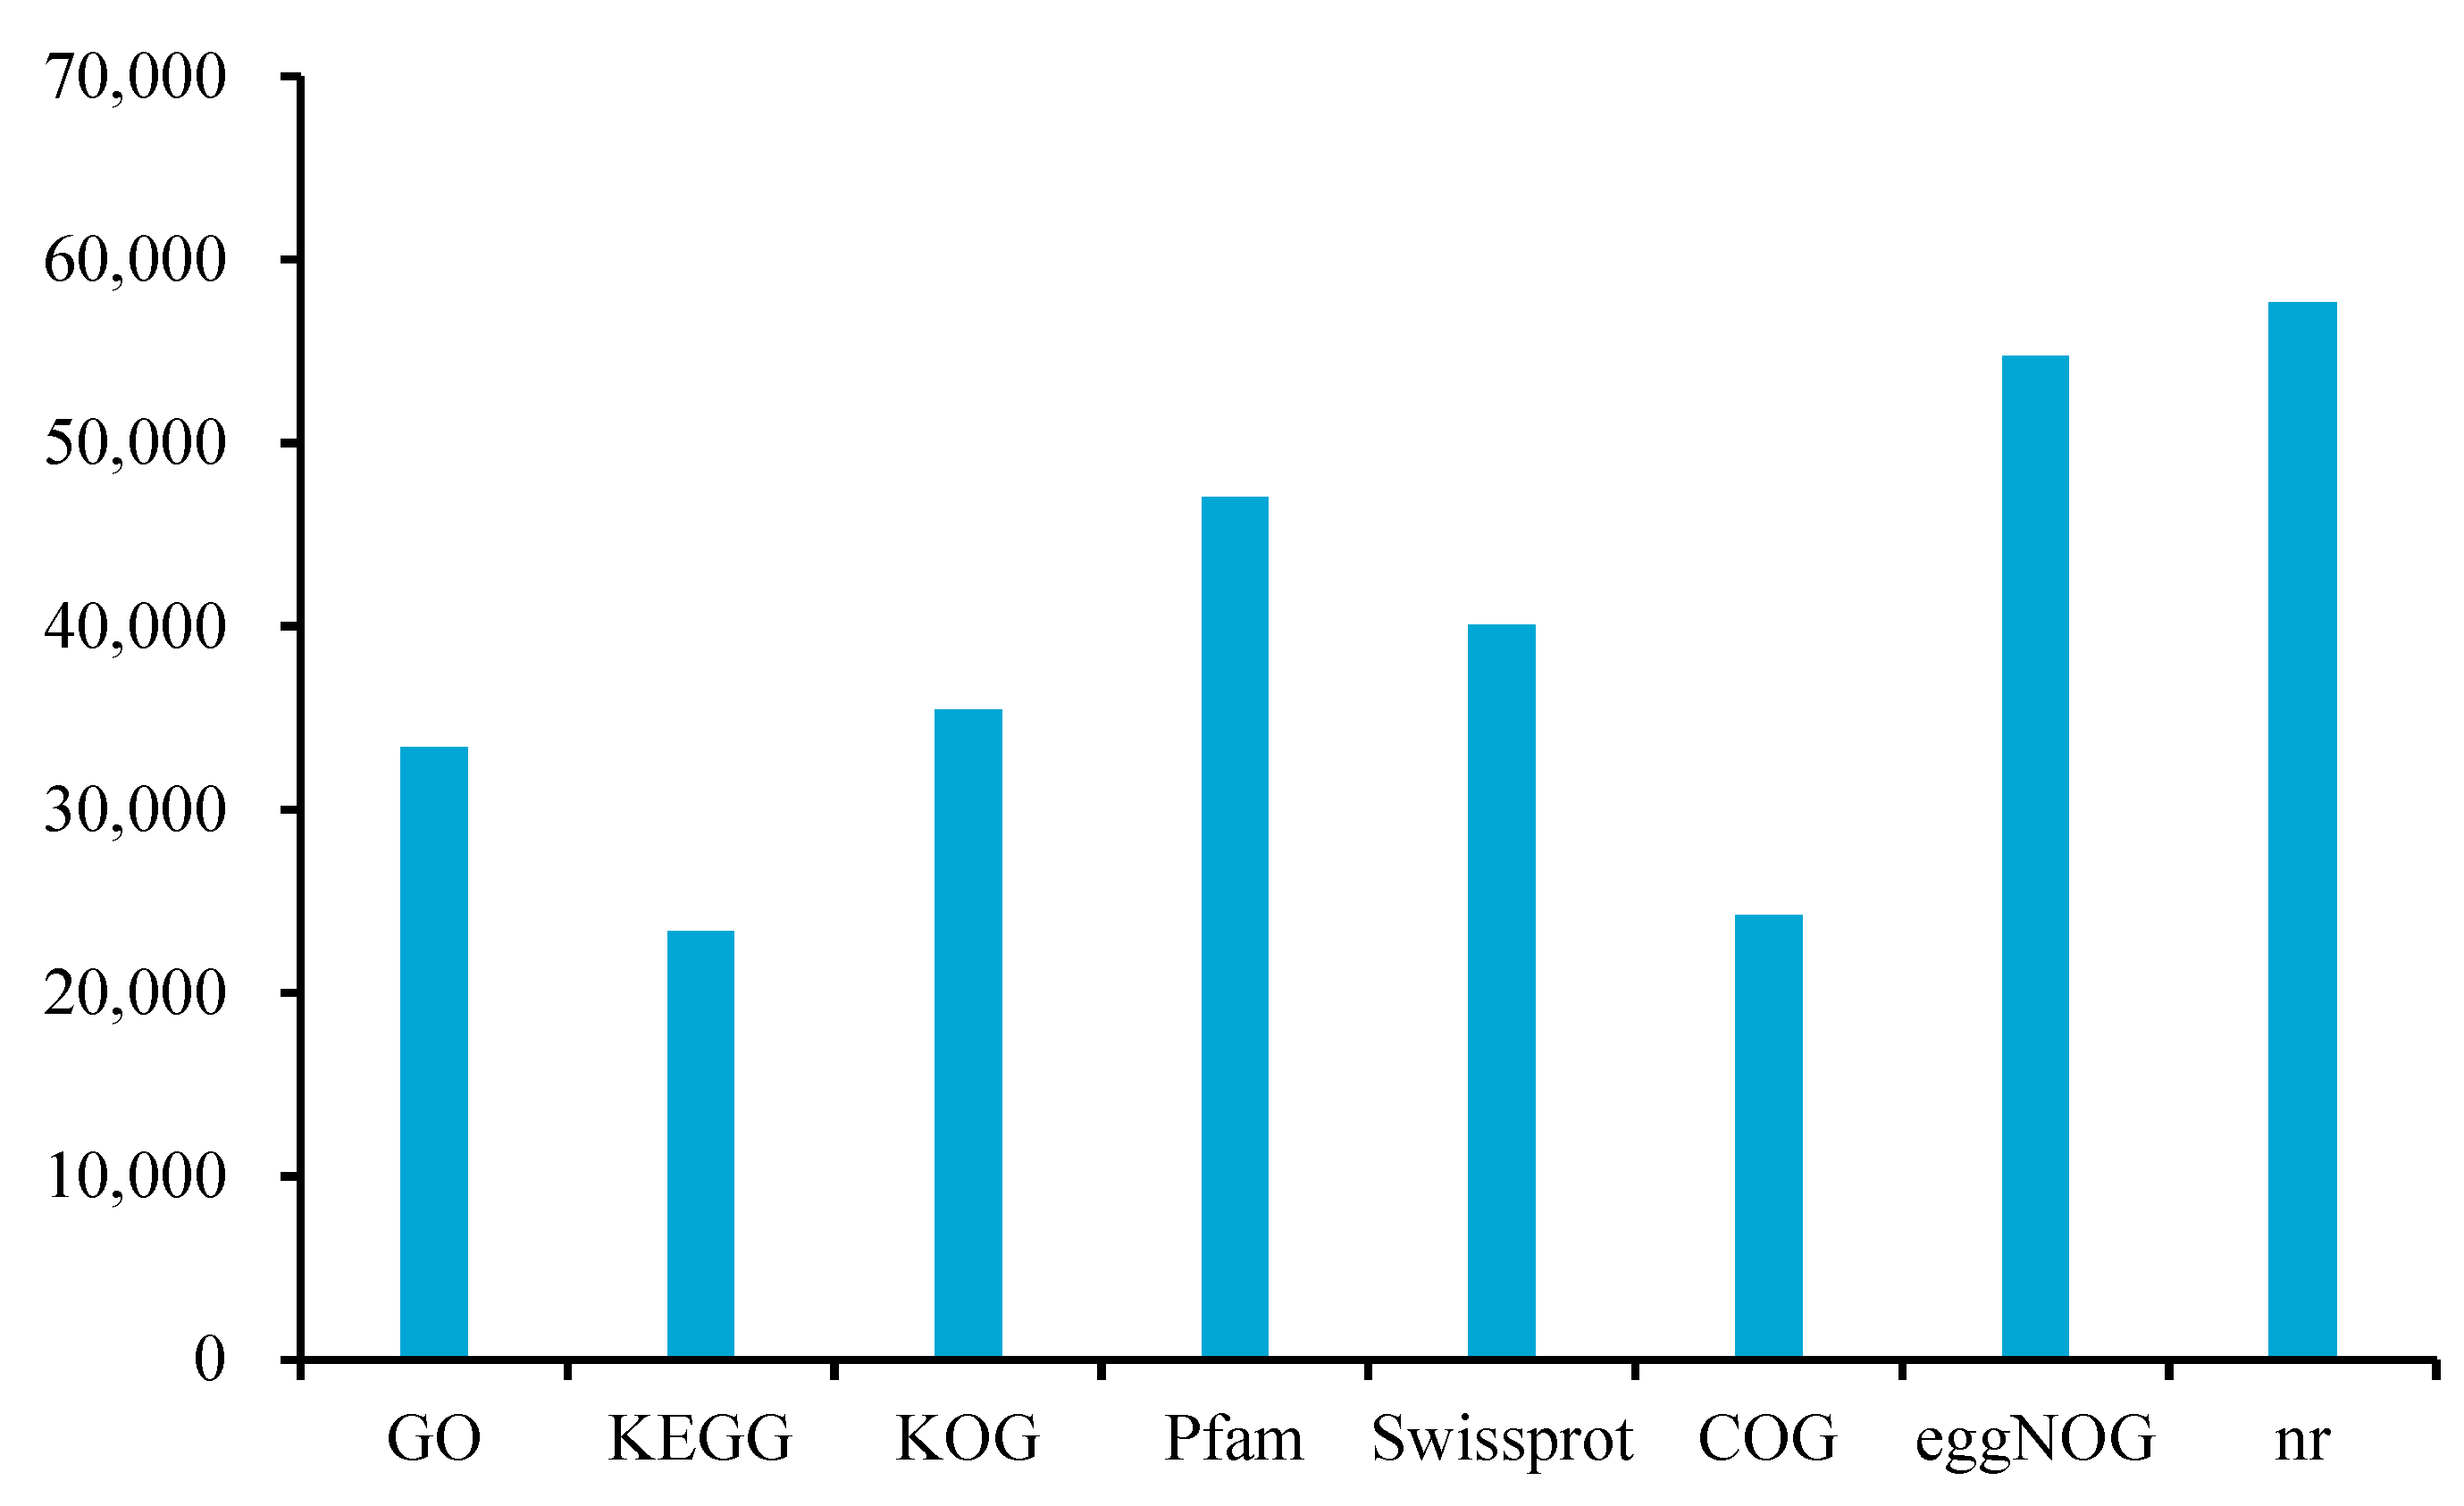
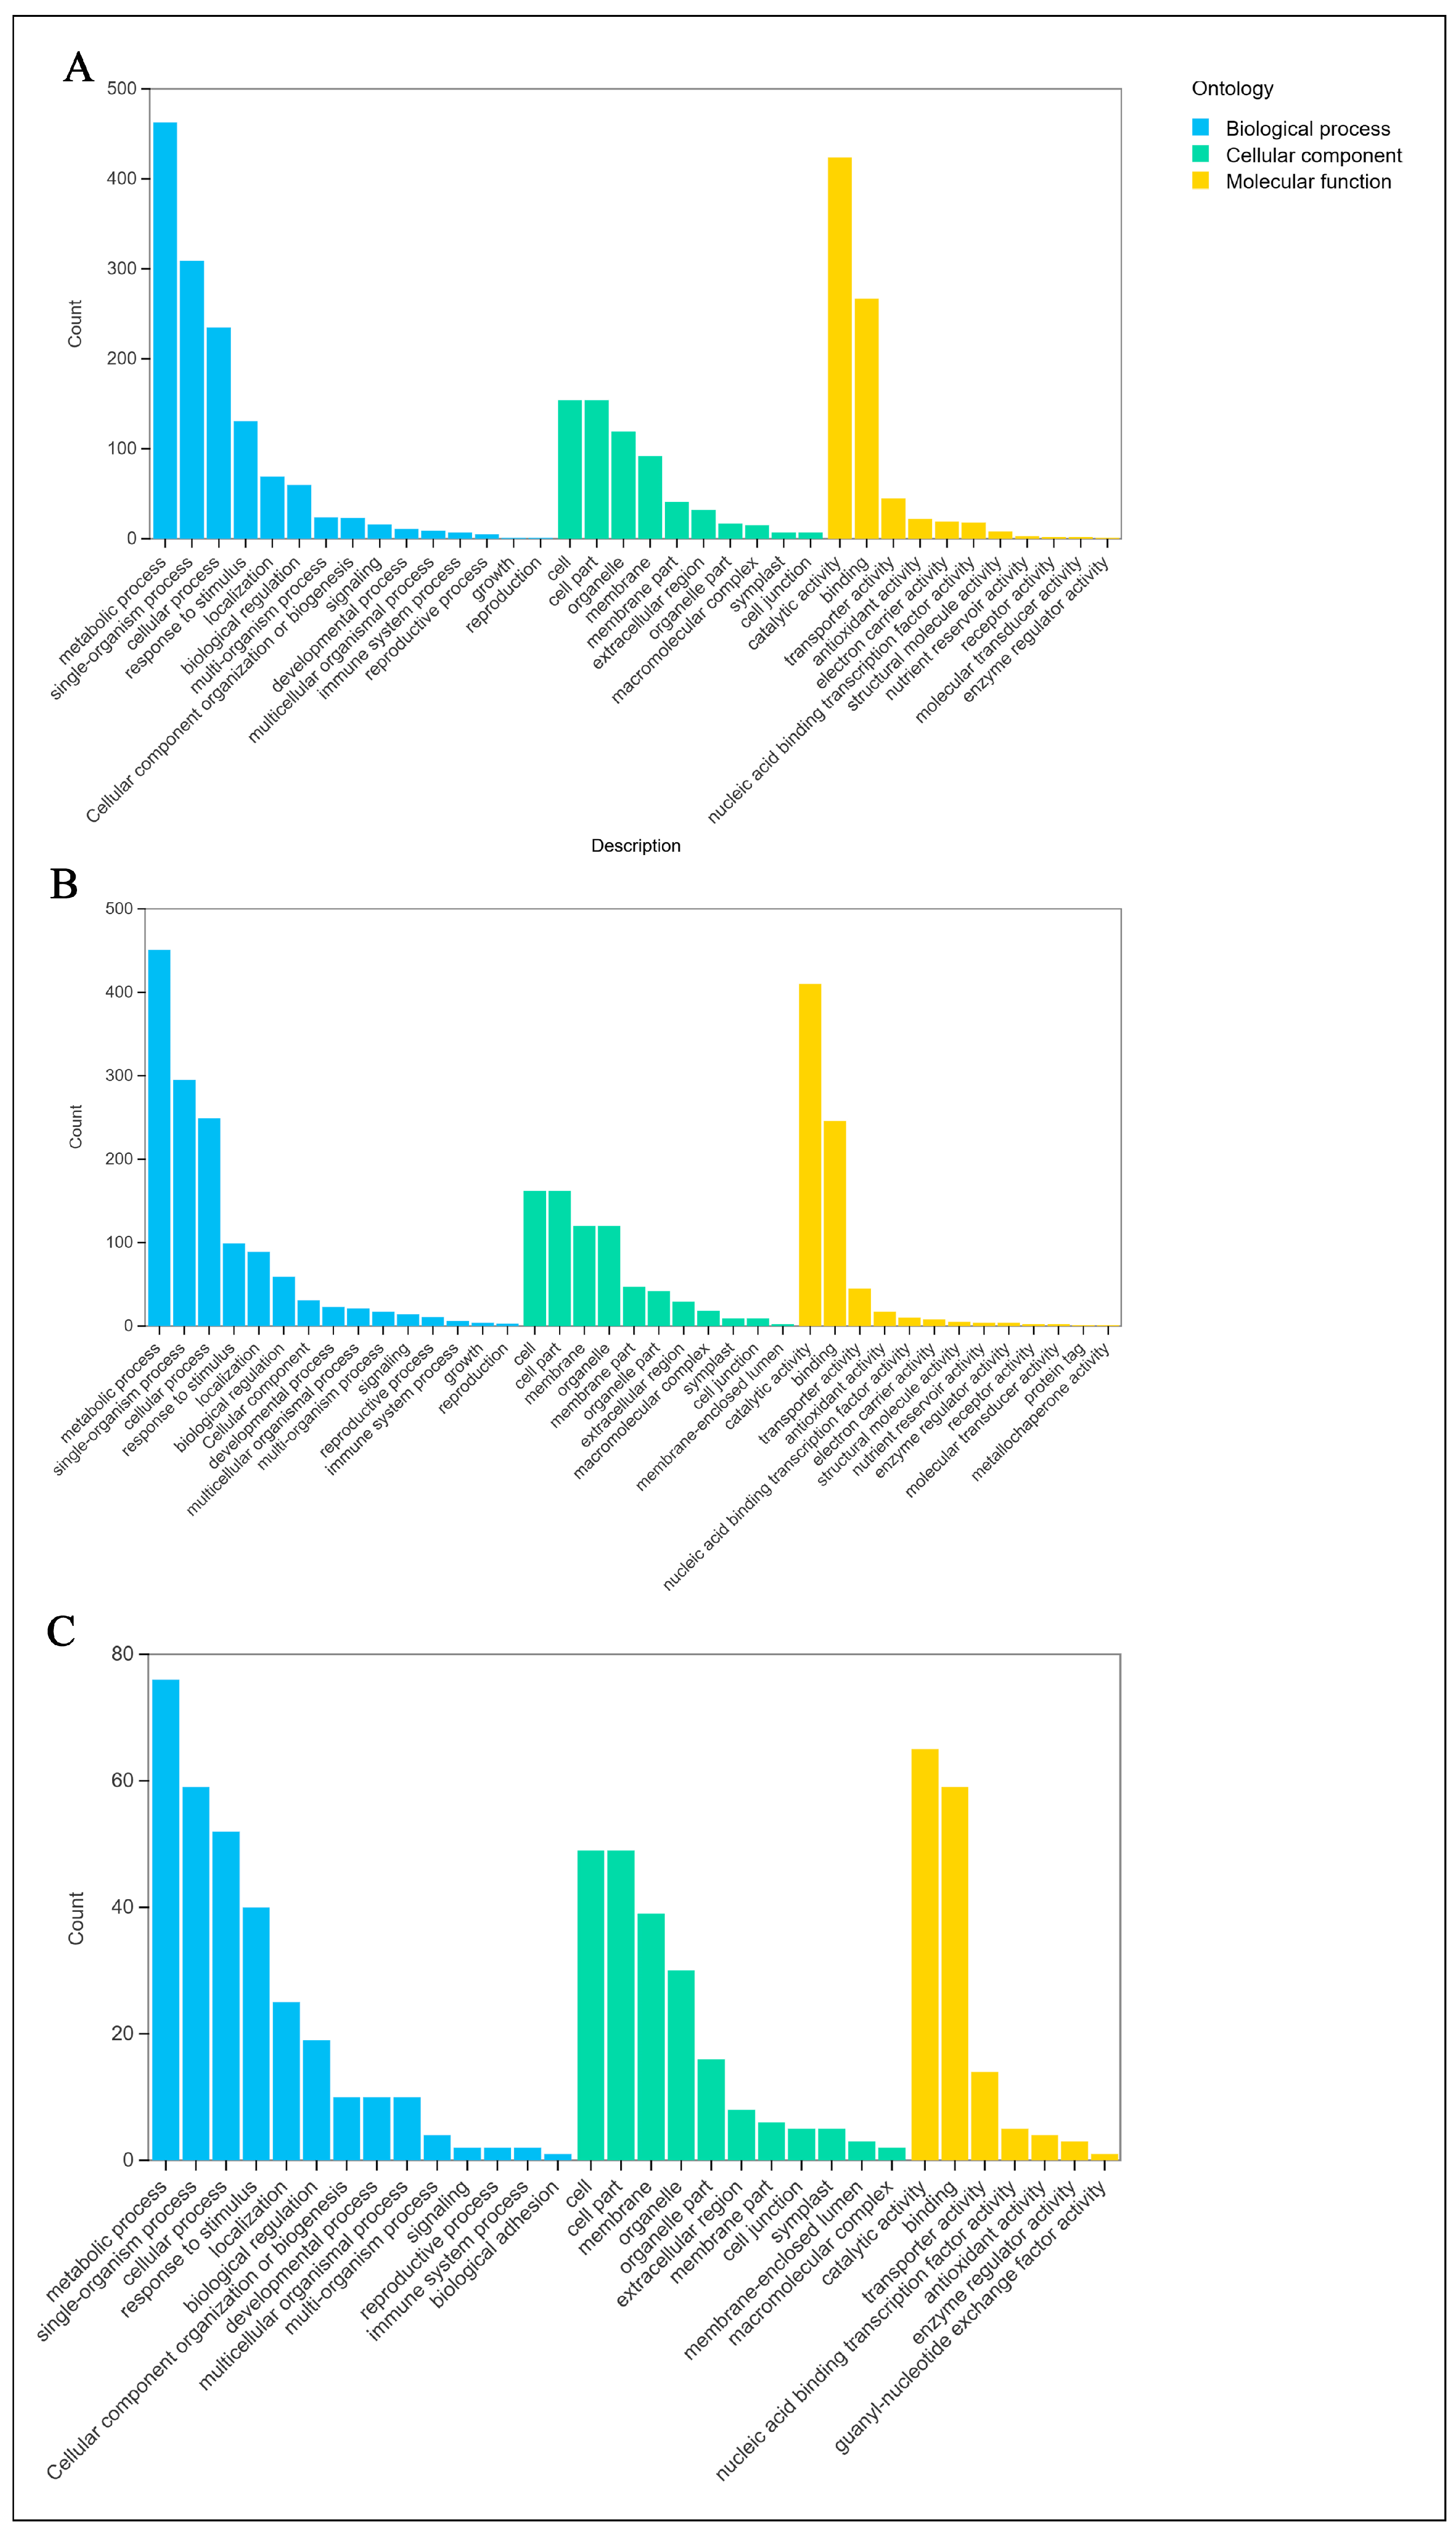
2.5. Gene Function Annotation

TransDecoder (TransDecoder 3.0.0, https://github.com/TransDecoder, accessed on 12 December 2023) was used to predict protein-coding sequences (CDS) for all transcripts under default settings. For each transcript, we computed the coding probability score of six ORFs that extended beyond 100 amino acids in length. We then selected the ORF with the top score, referred to as ORF [33], to represent the CDS. Functional annotation was performed on the deduplicated transcripts by aligning them with the KEGG, Pfam, KOG, COG, GO, SwissProt, and NR databases using BLAST software (version 2.2.26).

2.6. Transcript Expression Analysis

We utilized Bowtie2 for mapping the sequencing reads from every sample against the transcript sequences. The quantification of expression levels was carried out using RSEM. The calculated FPKM (Fragments Per Kilobase of transcript per Million mapped reads) values were indicative of the relative expression levels of the transcripts.

2.7. Differential Gene Expression Analysis and Enrichment Evaluation

The edgeR software (version 4.0) was used to analyze known and new genes, adjusting p-values for multiple hypothesis testing. Genes with a fold change of ≥2 and an FDR < 0.01 were considered differentially expressed [34]. The STEM software (version 1.3.13) analyzed the expression trends of these differentially expressed genes (DEGs), considering a minimum fold change of 2 and a p-value < 0.05 as significant.
This study conducted GO enrichment analysis using the topGO R package (version 2.24.0) to assess the functionality of DEGs. KEGG pathway enrichment analysis was performed using KOBAS software (version 2.0) to identify biochemical metabolic and signaling transduction pathways.

2.8. Screening of Key Genes

Important pathways were selected for further investigation, identifying notably active genes. Subsequently, using R version 3.5.1, we analyzed gene expression levels over time. Pearson correlation coefficient was used for correlation analysis, and the threshold of correlation analysis was set as 0.8, and the threshold of p-value was set as 0.5. Visualization was accomplished using Cytoscape software (version 3.10.1), which helped identify key genes.

2.9. Validation of DEGs with Real-Time Fluorescence Quantitative PCR (RT-qPCR)

RT-qPCR experiments were conducted on the same samples as those used for the sequencing. Total RNA was extracted using RNAiso Plus (Takara, Dalian, China) and subjected to the same quality inspection methods described in Section 2.2. Reverse transcription was performed using the PrimeScript™ RT reagent Kit with gDNA Eraser (TaKaRa), following the manufacturer’s instructions, which include a step to remove genomic DNA. RT-qPCR was conducted using the SYBR® Premix Ex Taq™ II kit (Takara), and quantitative analysis was performed using a fluorescence quantitative PCR instrument. Gene expression levels were calculated using the 2−ΔΔCt method, with the Actin gene serving as the internal reference gene (Table S1), and each treatment was replicated three times. Each column value represents mean ± SE. Statistical analysis was conducted using SPSS software (Version 21.0) with the t-test method, considering p ≤ 0.05 as statistically significant. To validate the reliability of the transcriptome sequencing results, the correlation between the rooting-related candidate gene expression profiles obtained from RT-qPCR and RNA-seq was evaluated using an R package. The reaction system had a total volume of 25 μL, including: 2.0 μL (~100 ng) of cDNA sample, forward and reverse primers at 10 μM each, and 12.5 μL of SYBR Premix Ex Taq II (including Taq DNA polymerase, reaction buffer, and deoxynucleotide triphosphate mix). The RT-qPCR amplification program consisted of 40 cycles: 95 °C for 12 s, followed by 61 °C for 40 s, and 72 °C for 30 s.

3. Results

3.1. Root Development of P. orientalis in Different Periods

Observations were made on the root systems of P. orientalis at each time point. The results indicated that after performing a 1/3 root pruning on the main root, there was an increasing trend in the number of lateral roots in the treatment group as contrasted with the control group, consistent with the experimental expectations (Figure 1).

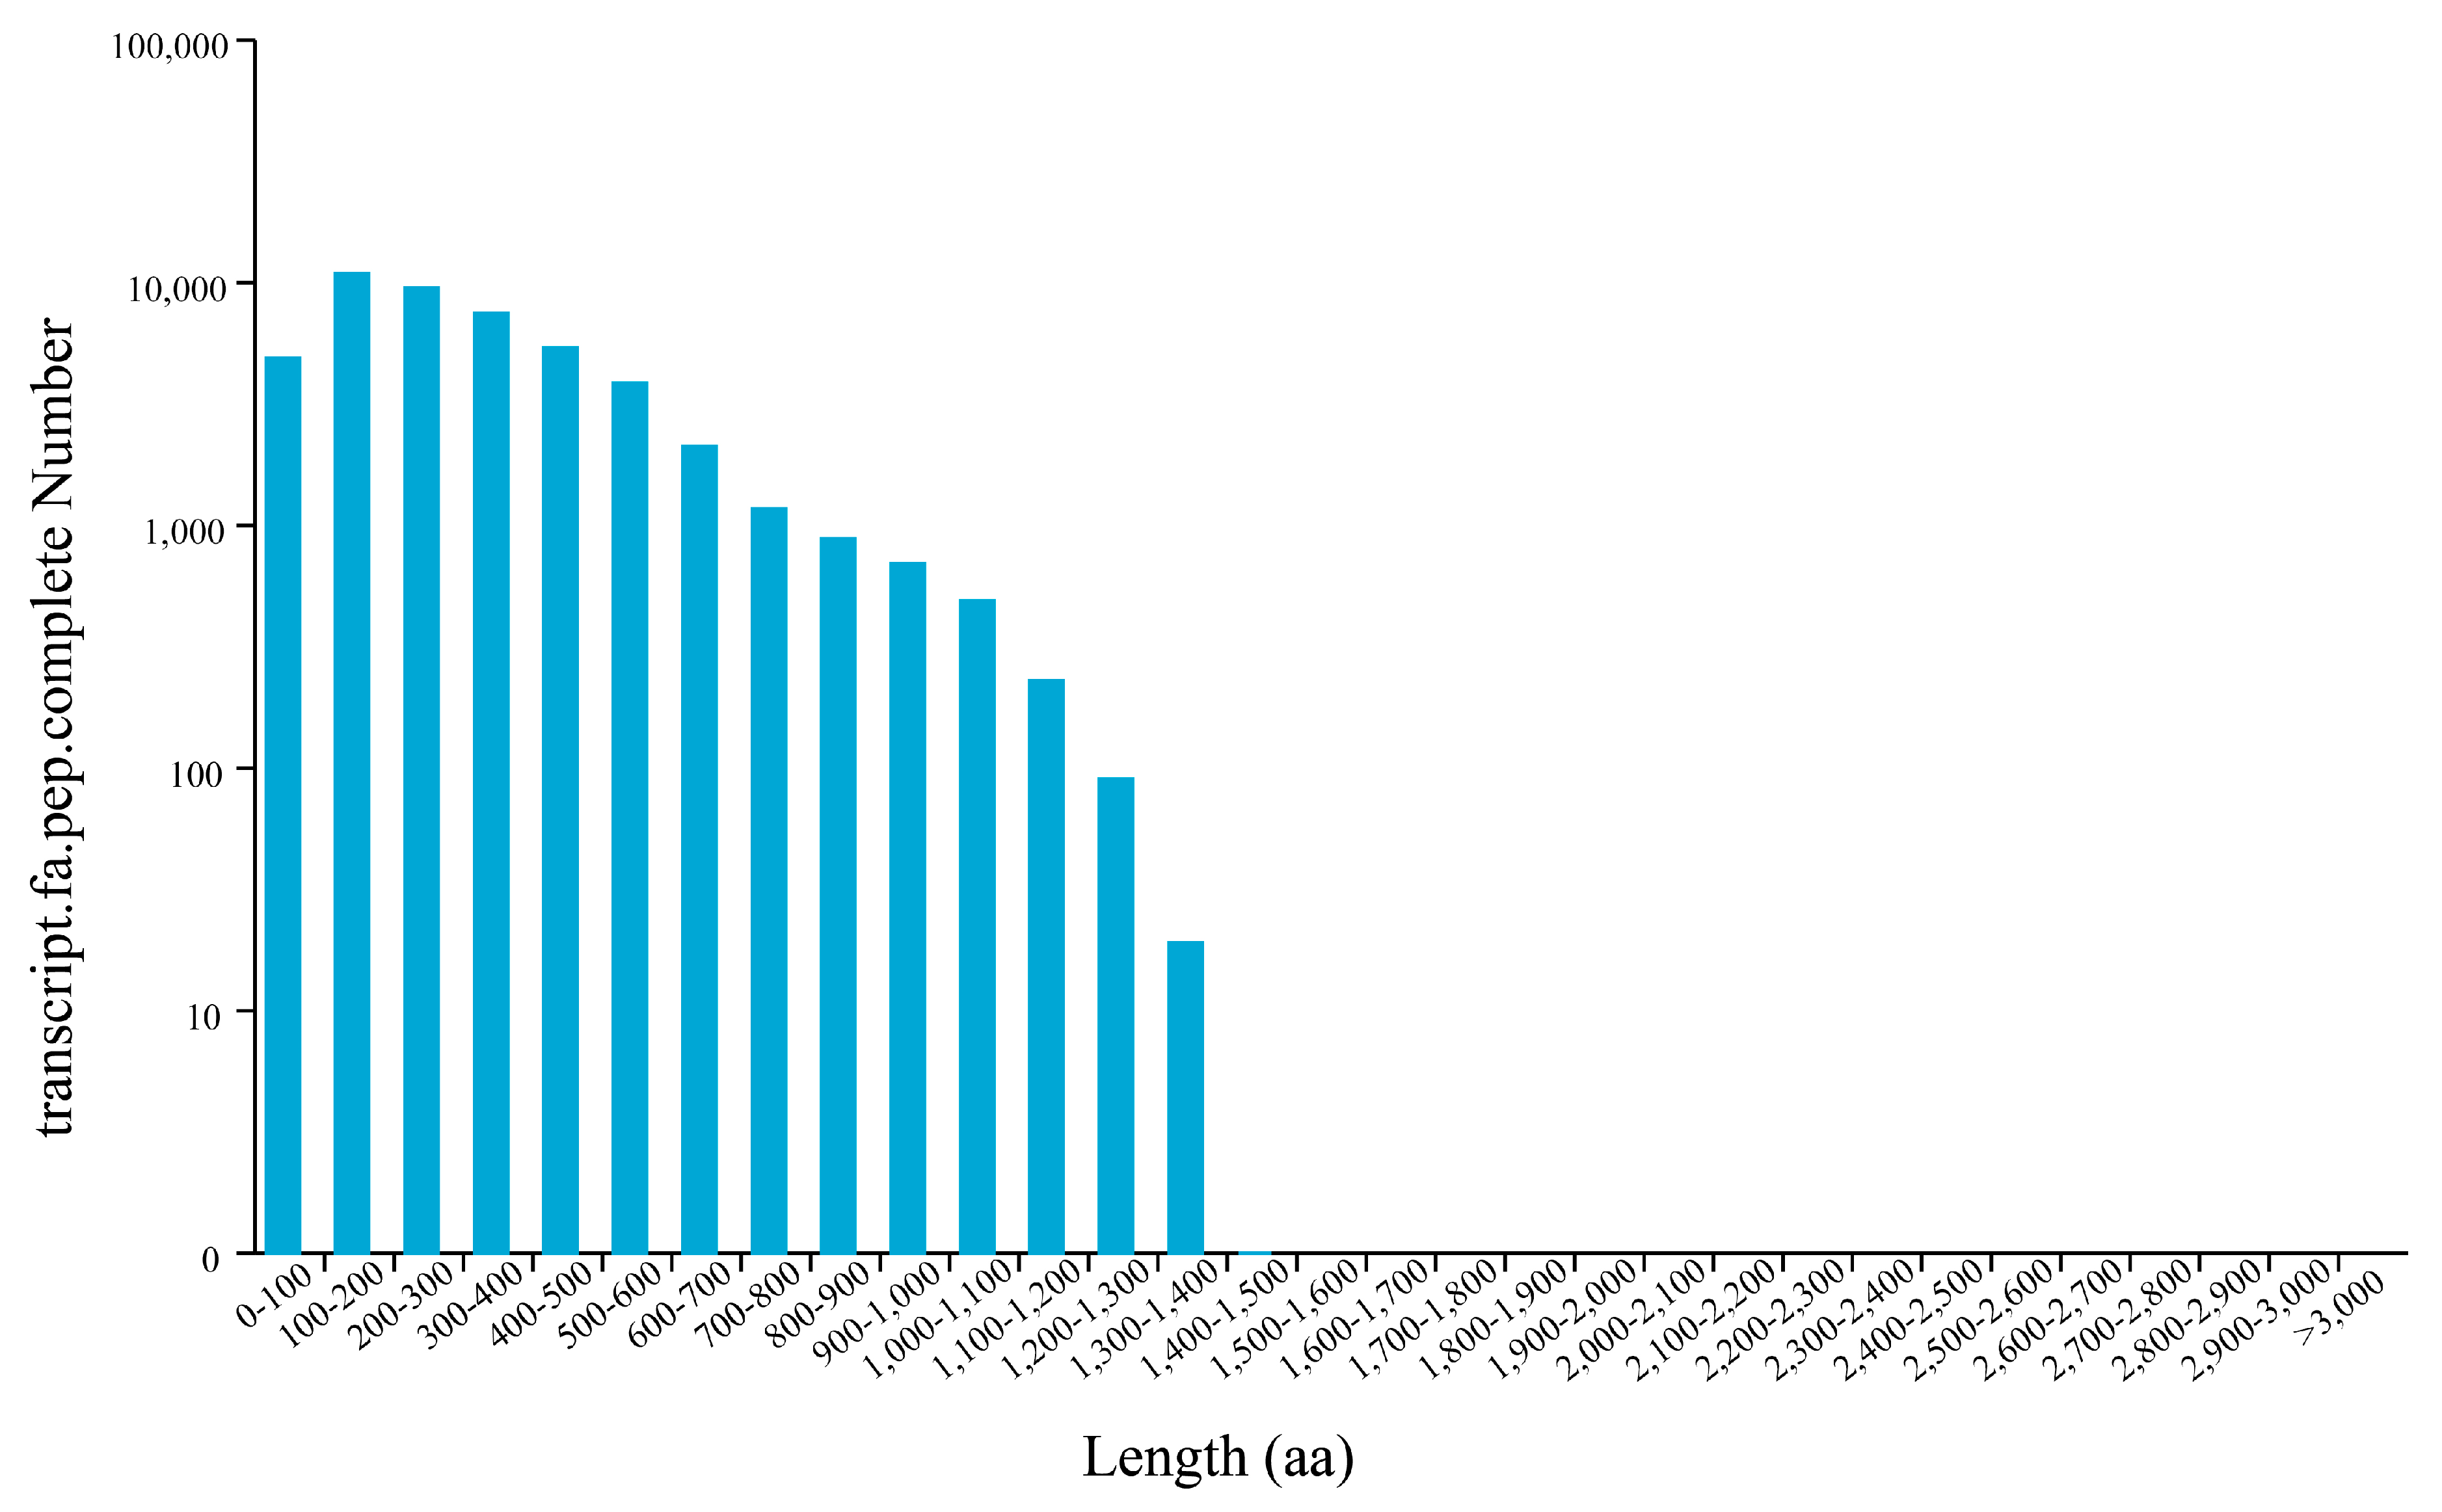
3.2. Construction of P. orientalis Full-Length Transcriptome Database

To further explore the potential molecular mechanisms occurring before and after root pruning, the research initially conducted full-length transcriptome sequencing on three differently-sized fragments (1–2 K, 2–3 K, and 3–6 K) of libraries using the PacBio RS II system on eight cells (Table S2). A total of 452,065 ROIs were obtained, including 169,813 from four SMRT cells for the 1–2 K fragments, 169,813 from three SMRT cells for the 2–3 K fragments, and 121,645 from two SMRT cells for the 3–6 K fragments. After CCS generation and filtering, a total of 294,901 full-length non-chimeric (FLNC) reads were obtained. Subsequently, Illumina RNA-Seq sequencing was performed on 18 cDNA libraries, yielding 139.26 Gb of clean data after trimming and filtering, with a Q30 value reaching 89.49% (Table S3). The RS_IsoSeq module of SMRT Analysis software (version 13.1) was used for clustering analysis of the full-length sequences, resulting in 124,643 consensus transcript sequences. After correction using non-full-length sequences, 101,688 high-quality full-length transcript sequences and 22,955 low-quality full-length transcript sequences were obtained. The 22,955 low-quality sequences were further corrected using Illumina RNA-Seq data. CD-HIT was then employed to remove redundancy from the high-quality sequences and the corrected low-quality sequences of each sample, resulting in a total of 62,876 unique P. orientalis full-length transcript sequences. TransDecoder (v3.0.0) was used to identify 47,740 complete ORFs, and the lengths of the coding protein CDS are shown in Figure 2. Among these CDSs, only a few exceeded 1300 amino acids (aa), with the majority ranging from 100 to 500 aa. The obtained transcript sequences were aligned with the NR, SwissProt, GO, COG, KOG, Pfam, and KEGG databases using BLAST software (version 2.2.26) to obtain annotation information for the transcripts. The results showed that 58,073 transcripts were annotated (Figure 3). Among the annotated transcripts, 33,397, 23,379, 35,474, 47,058, 40,118, 24,228, 54,765, and 57,646 corresponded to GO, KEGG, KOG, Pfam, SwissProt, COG, eggNOG, and NR, respectively. The NR database was the most comprehensive, with 97.74% of unigenes annotated there, indicating its integral role in functional annotation. Further analysis of the NR database revealed that the sequences most closely matching P. orientalis were from Abies grandis (31.25%), followed by Cinnamomum (9.64%), Pinus massoniana (8.53%), Nelumbo nucifera (7.40%), Vitis vinifera (3.07%), and Theobroma cacao (1.5%). Overall, the highest homology was observed with coniferous plants, suggesting a relatively accurate assembly and annotation of the P. orientalis transcriptome obtained in this study.

3.3. SSR Analysis

Using MISA software (version 2.1), the transcriptome sequence analysis identified seven types of SSR motifs: compound SSRs, Hexa-nucleotide, Penta-nucleotide, Tetra-nucleotide, Tri-nucleotide, Di-nucleotide, and Mono-nucleotide (where two SSRs are less than 100 bp apart). After filtering for transcripts longer than 500 bp, SSR analysis was conducted using MISA software. The overall results are summarized in Figure 4. In this study, a total of 21,040 SSR loci were identified in the P. orientalis full-length transcriptome, distributed across 3760 sequences. The number of SSRs present in compound form was 4225. Statistical analysis was performed on the density distribution of different SSR types. Mono-nucleotide repeats were the most prevalent, accounting for 71.02% of the total, followed by compound SSRs at 18.51%. Tri-nucleotide repeats were the third most common, comprising 17.61% of the total.

3.4. Prediction of lncRNAs

We used four different computational resources to pinpoint distinct transcripts with no potential for encoding proteins, categorizing them as possible lncRNAs. Applying the standard settings for each tool, we obtained the following outcomes: The Coding Potential Calculator (CPC) revealed 7280 lncRNA transcripts, the Coding-Non-Coding Index (CNCI) uncovered 4624, the Coding Potential Assessment Tool (CPAT) found 11,771, and the Pfam scan brought to light 13,160 lncRNAs. When synthesizing the findings from all four tools, we identified 2446 lncRNA transcripts as likely candidates (as depicted in Figure 5).

3.5. Identification of DEGs

Bowtie2 facilitated the alignment of sequencing reads from individual samples with the sequences of the transcriptome. The alignment results are shown in Table S4. Among all reads, 76.44%–80.12% were mapped to the transcriptome sequences, with 22.79%–23.01% identified as Uniq mapped Reads and 74.96%–77.47% as Multi mapped Reads. The alignment outcomes were integrated with RSEM to gauge transcription levels, utilizing FPKM metrics to signify the abundance of transcript expression. We excluded the clean reads that aligned with the reference transcriptome, which was constructed via PacBio ISO-seq from the Illumina RNA-seq data. We then assessed the expression levels across various time points using the edgeR package, applying a specific criterion (a fold change of 2 or greater and a false discovery rate below 0.01). After root pruning at 3 time points, a total of 2025 DEGs were obtained. At 1 d, there were 1023 DEGs in the treatment group as contrasted with the control group, with 640 DEGs notably up-regulated and 383 DEGs notably down-regulated. At 20 d, there were 1158 DEGs in the treatment group as contrasted with the control group, with 334 DEGs notably up-regulated and 824 DEGs notably down-regulated. At 60 D, there were 231 DEGs in the treatment group as contrasted with the control group, with 140 DEGs notably up-regulated and 91 DEGs notably down-regulated (Figure 6A,B). The largest number of DEGs was observed at 20 d, indicating that 10–20 d after root pruning is the most critical period for the root development process of P. orientalis after root pruning.
Trend analysis classified genes with similar expression patterns among DEGs. A total of 1652 DEGs with significant expression trends were identified, which could be classified into 8 expression patterns (Figure 6C). Profiles 0–3 indicated a negative expression trend overall, while Profiles 4–7 showed a positive expression trend overall. Profile 4 had the most enriched number of genes, with 400 genes exhibiting an expression trend of initially remaining unchanged and then increasing; Profile 5 had the fewest enriched genes, with an expression trend of initially increasing and then decreasing. Profile 0 and Profile 7 were the most distinctive, with Profile 0 showing a sustained negative expression over time and Profile 7 showing a sustained positive expression over time.

3.6. Identification of DEGs

DEGs generated at three time points underwent separate KEGG and GO enrichment analyses.
Regarding GO enrichment analysis, at 1 d (Figure 7A), among 1023 DEGs, 636 showed enrichment. These DEGs were predominantly involved in cellular, single-organism, and metabolic processes. Terms related to cellular components included membrane, cell part, and cell, while the majority of molecular function genes were associated with catalytic activity and binding. At the 20-day mark (as shown in Figure 7B), from a total of 1158 DEGs, 614 showed signs of enrichment. Echoing the findings from day 1, these DEGs predominantly pertained to metabolic activities, processes occurring within individual organisms, and various cellular functions. The terms related to cellular components encompassed entities such as cells, their parts, membranes, and organelles. A significant portion of the genes with molecular functions were related to catalysis and binding. Moving to day 60 (depicted in Figure 7C), of the 231 DEGs identified, 136 were found to be enriched. The majority of these DEGs were again connected to metabolic activities and processes specific to individual organisms, as well as to mechanisms for responding to external stimuli.
Regarding the enrichment analysis of KEGG pathways, on day 1 (illustrated in Figure 8A), 213 differentially expressed genes (DEGs) were significantly overrepresented in 86 distinct KEGG pathways. The pathways with the highest level of enrichment included those for Phenylalanine metabolism (ko00360) and Phenylpropanoid biosynthesis (ko00940), each with 36 DEGs showing enrichment. They were closely followed by pathways for Amino sugar and nucleotide sugar metabolism (ko00520) and for the Biosynthesis of amino acids (ko01230), each featuring 18 enriched DEGs. On day 20 (as depicted in Figure 8B), there were 253 DEGs identified as significantly overrepresented across 97 KEGG pathways. Mirroring the day 1 results, the pathways for Phenylalanine metabolism (ko00360) and Phenylpropanoid biosynthesis (ko00940) continued to be the most enriched, each with 25 DEGs. This was succeeded by pathways for Starch and sucrose metabolism (ko00500) and again for Biosynthesis of amino acids (ko01230), each with 18 enriched DEGs. By day 60 (presented in Figure 8C), there were 49 DEGs significantly enriched within 35 KEGG pathways. The pathways that stood out were Protein processing in the endoplasmic reticulum (ko04141) and Phenylalanine metabolism (ko00360), with 10 and 7 enriched DEGs, respectively. Overall, a predominant number of these DEGs were recurrently enriched in pathways related to Phenylalanine metabolism (ko00360) and Phenylpropanoid biosynthesis (ko00940). Further investigation revealed that the metabolites of these pathways are associated with the synthesis of lignin and secondary metabolites, closely related to plant root activities, aligning with the experimental observations. Therefore, to explore the molecular influences for promoting root proliferation in the treatment group, these pathways are the focal points of this study.

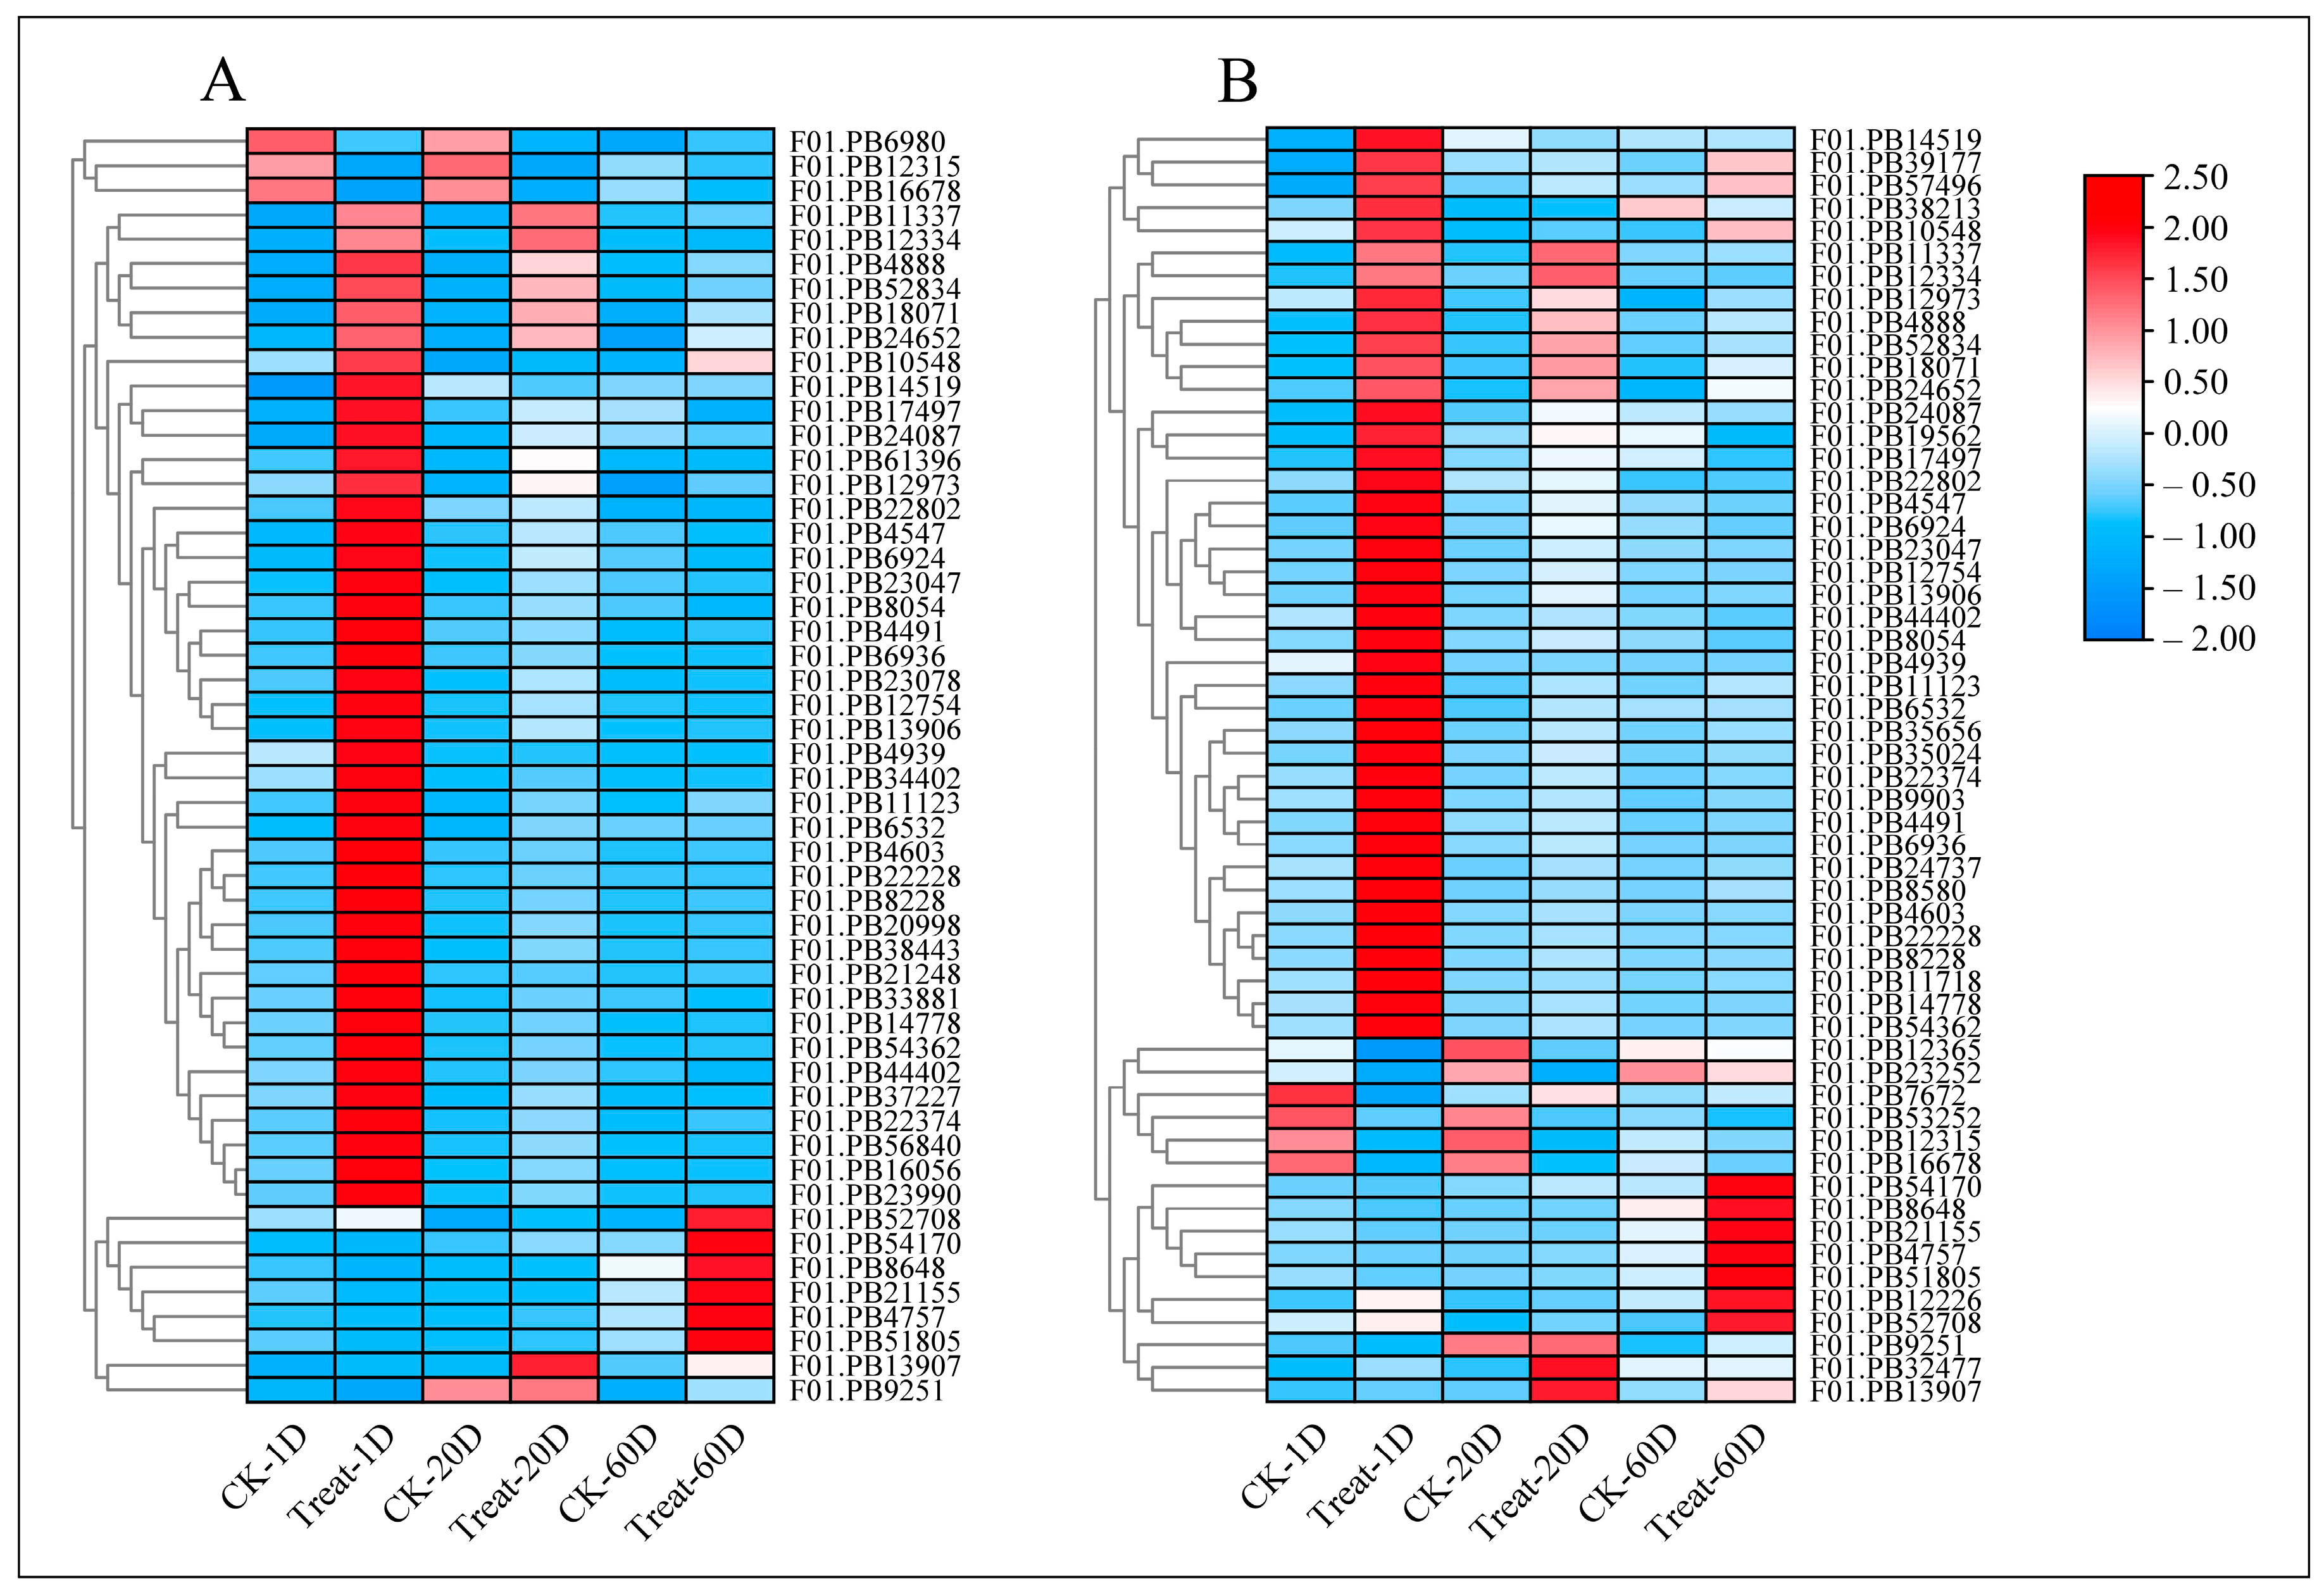
3.7. Expression Profiles and Functional Analysis of Genes Related to 2 Key Pathways

After conducting the KEGG pathway analysis, it was observed that across the three time intervals, a considerable number of DEGs were consistently overrepresented in the pathways for Phenylalanine metabolism (ko00360) and for the creation of Phenylpropanoids (ko00940). Consequently, this study conducted expression analysis on genes enriched in these two pathways, normalized gene expression levels to FPKM, and plotted expression heatmaps (Figure 9). The expression profiles of DEGs enriched in the Phenylalanine metabolism (ko00360) pathway across the three time points are shown in Figure 9A. The majority of genes in the treatment group exhibited upregulation as contrasted with the control group, with only three genes (F01.PB6980, F01.PB12315, and F01.PB16678) showing significant downregulation. A total of 41 genes showed significant upregulation after 1 d of treatment, 6 genes exhibited significant upregulation after 60 d of treatment, and a small subset of genes showed upregulation after 20 d of treatment. Similarly, the expression profiles of DEGs enriched in the Phenylpropanoid biosynthesis (ko00940) pathway across the three time points are depicted in Figure 9B, with the majority of genes in the treatment group being upregulated as contrasted with the control group, except for six genes (F01.PB12365, F01.PB23252, F01.PB7672, F01.PB53252, F01.PB12315, and F01.PB16678) which were downregulated.
To ascertain the genes implicated in the root’s response to pruning, the study performed an extensive gene analysis within both implicated pathways, pinpointing 40 genes that were enriched in each. Of these, 22 genes demonstrated a significant increase in expression (with a fold change greater than 10) following the pruning intervention. The study posits that these 22 genes are integral to the roots’ swift adaptive response after pruning. Consequently, the research included annotations and a functional examination of the sequences of these 22 genes, as shown in Table S5. The findings suggest that the majority of these candidate genes belong to the Peroxidase gene family. Further functional scrutiny suggested a strong involvement of nearly all these genes in lignin synthesis and breakdown, with a notable correlation to these processes. They also appear to play a part in the root’s reaction to environmental stressors, such as physical injury, pathogenic invasion, and oxidative stress, and some are active in auxin metabolism. Root development was observed to be enhanced through the root pruning treatment, which acts as a beneficial injury. Inferring from the functional analysis of these 22 genes, root pruning seems to act as a stress stressor, triggering the expression of genes related to the Peroxidase family. This activates lignin synthesis and metabolism, which alters the internal hormone concentrations within the plants. Such a sequence of events is conducive to positive root growth, which indirectly validates the accuracy of the selected genes in this study.

3.8. Identification of Hub Genes from Candidate Genes

Using R language, the correlation of expression levels of the 22 candidate genes was computed (Table S6). Except for F01.PB13907, the remaining 21 genes exhibited certain correlations (Figure 10A). Among the above-mentioned 21 genes, the connectivity was calculated based on the cytoHubba plugin in Cytoscape software, resulting in the identification of 5 hub genes. These hub genes are F01.PB13906, F01.PB12754, F01.PB6924, F01.PB23047, and F01.PB24087. A subnetwork graph of these hub genes was generated (Figure 10B). Based on annotation and correlation analysis, it is hypothesized that these are the primary drivers behind the increase in the number of lateral roots following the 1/3 root pruning.

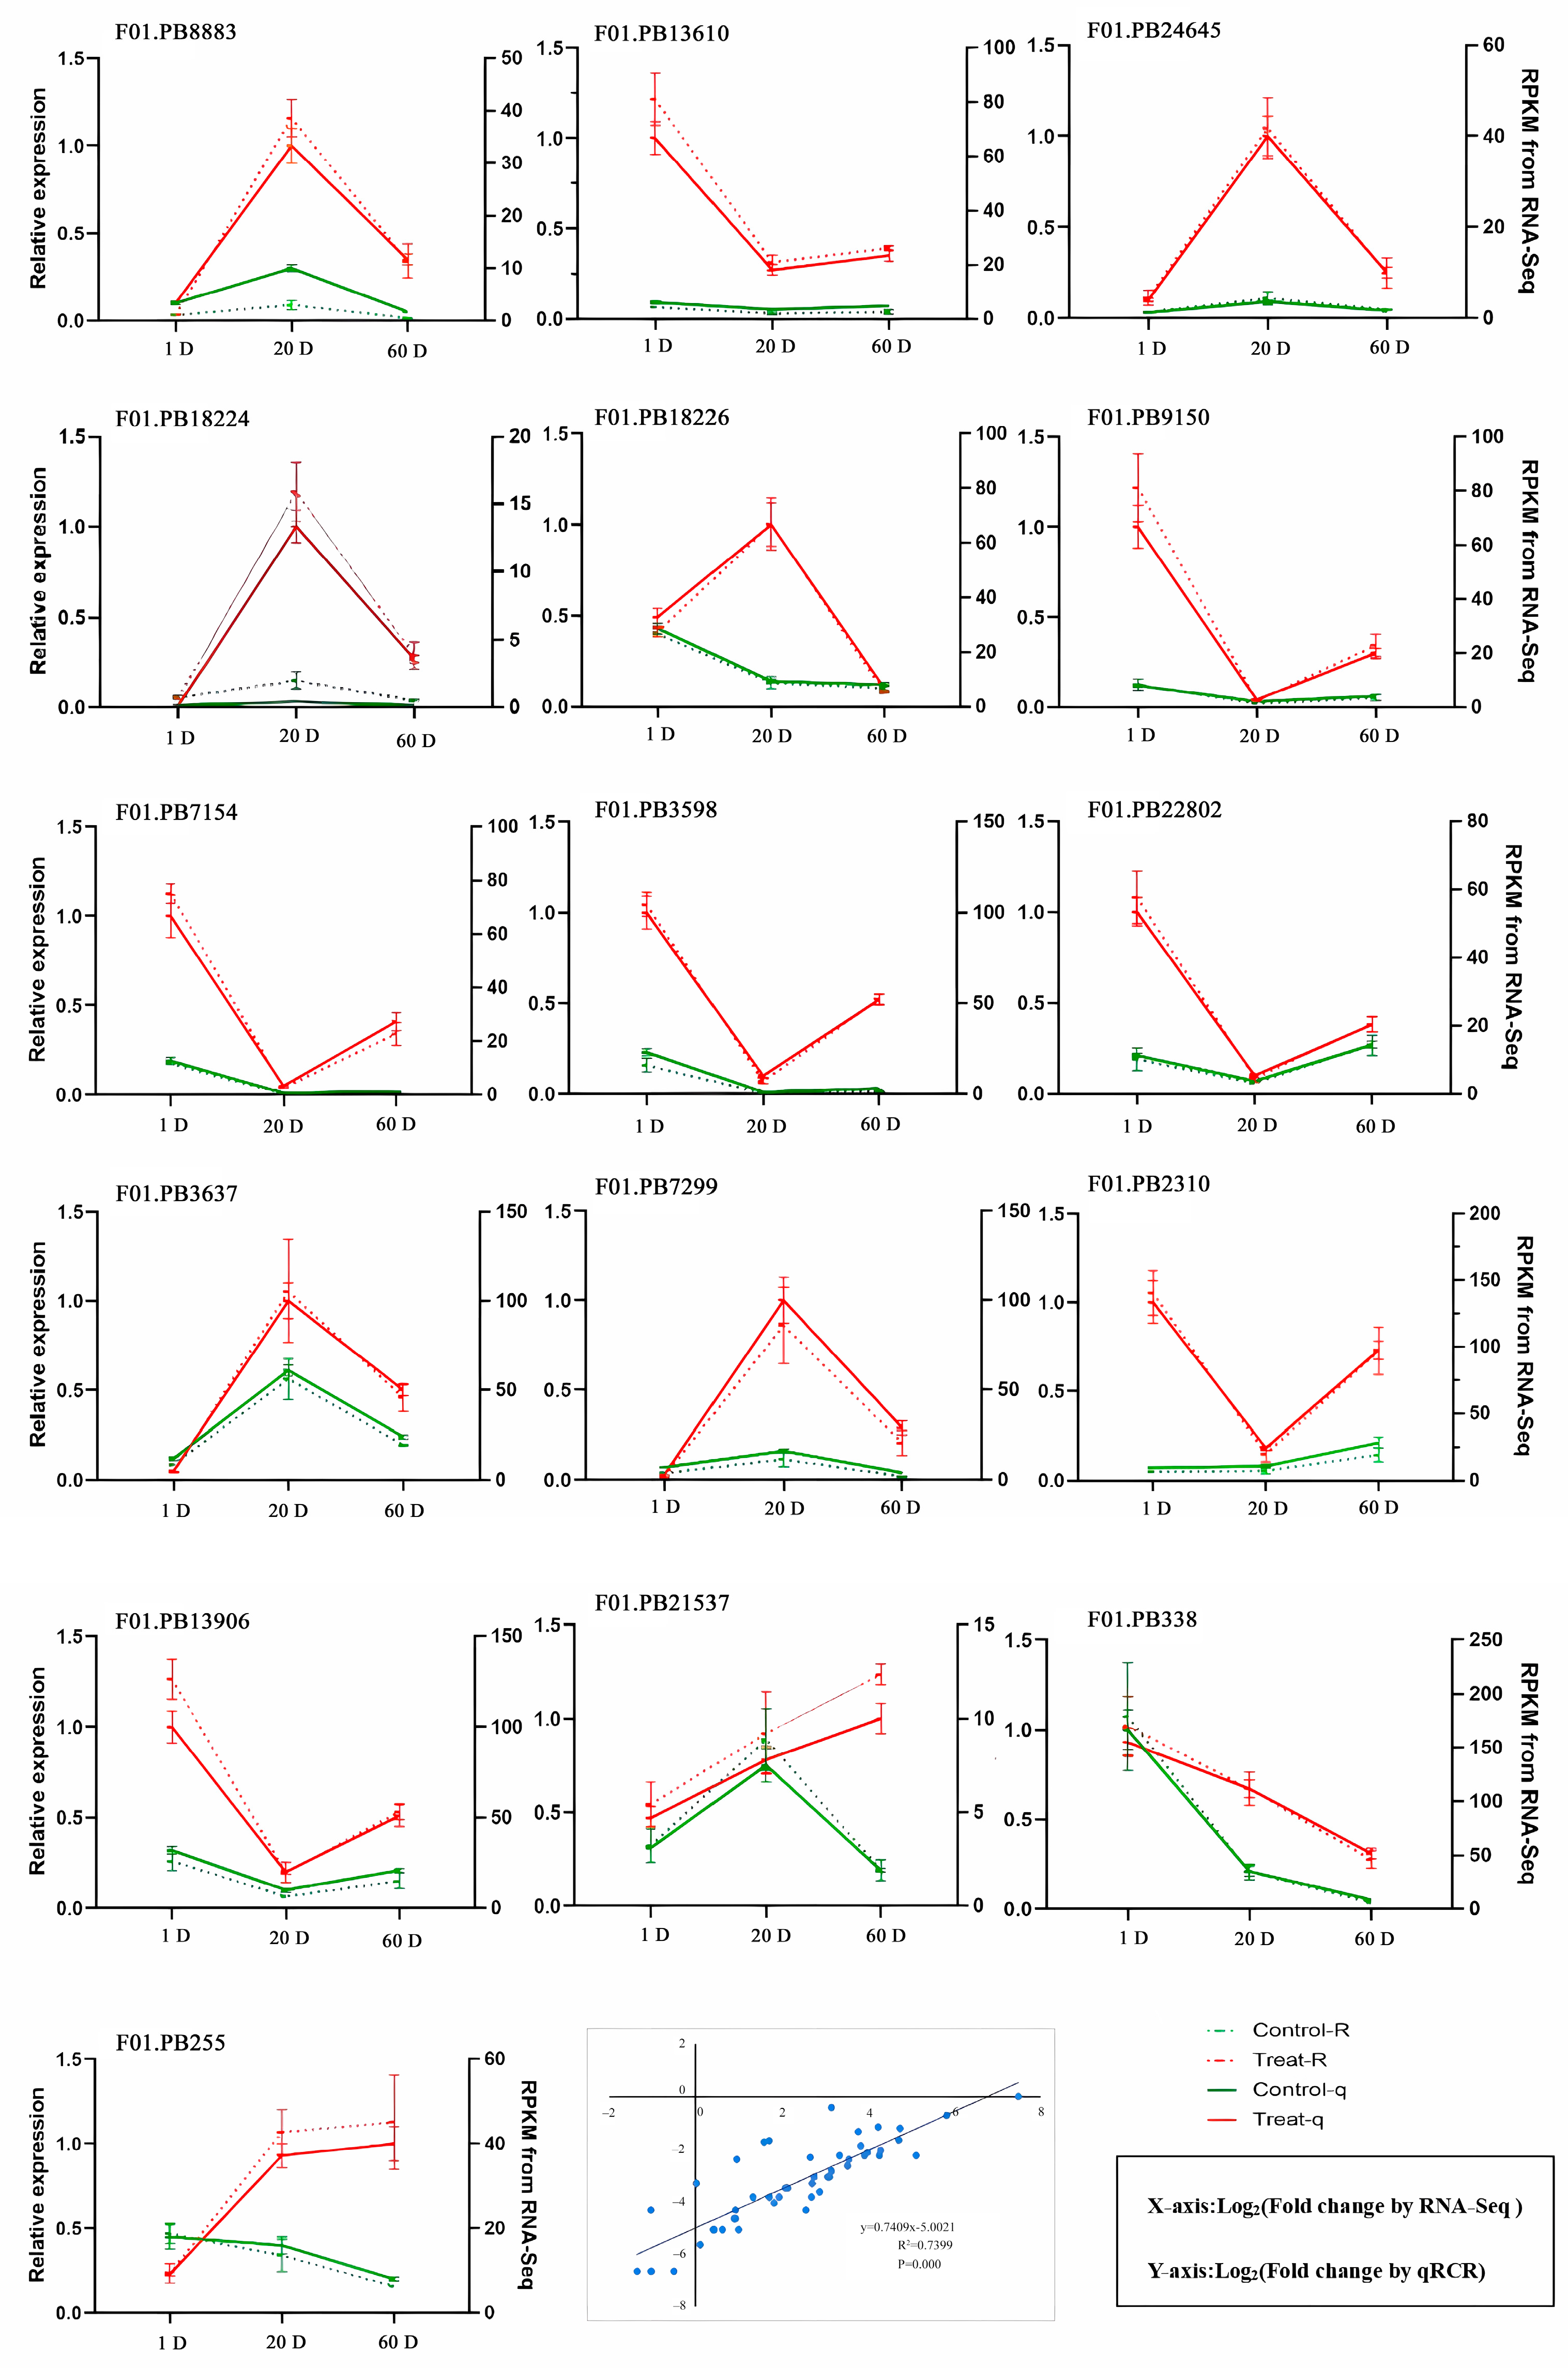
3.9. RT-qPCR Analysis

To confirm the RNA-Seq data, 16 DEGs chosen at random were tested using RT-qPCR for validation purposes. The results (Figure 11) showed a correlation coefficient of 0.7409 between the two methods, indicating that the gene expression patterns obtained aligned with the results of high-throughput sequencing analysis, suggesting the relative accuracy of RNA-Seq data.

4. Discussion

The most significant advantage of full-length transcriptome sequencing technology is its ability to directly obtain full-length transcripts without the need for assembly after sequencing. This feature makes it particularly suitable for species with polyploidy, highly repetitive sequences, and high heterozygosity [35]. For the first time, this study conducted full-length transcriptome sequencing on mixed samples of P. orientalis before and after root pruning and analyzed the gene expression profiles. The full-length transcriptome database of P. orientalis was developed using PacBio, resulting in 15.28 Gb of clean data from 9 cells, with a total of 452,065 ROIs and 294,901 FLNC sequences. After removing redundancy with CD-HIT, we obtained a total of 62,876 full-length transcripts. Subsequently, Illumina RNA-seq sequencing was performed on 18 samples, generating 139.26 Gb of clean data, and the expression levels of transcripts were calculated based on the deduplicated sequences to identify differentially expressed genes. In the three periods after root pruning, a total of 2025 DEGs were identified. The subsequent GO and KEGG enrichment analysis of differentially expressed transcripts revealed that many genes were enriched in the Phenylalanine metabolism (ko00360) and Phenylpropanoid biosynthesis (ko00940) pathways. From these pathways, certain highly expressed differential genes were identified. Upon annotation, it was found that these genes mostly belonged to the peroxidase family, indicating that peroxidase family genes played a role in increasing lateral roots after root pruning in P. orientalis.
Previous studies have shown that peroxidases are involved in various plant hormone signaling pathways and influence plant growth and development [36,37]. For example, salicylic acid (SA) can inhibit peroxidase activity by directly binding to peroxidases or by activating WRKY62/76 transcription repressors to suppress peroxidase expression, thereby maintaining the vitality of plant root meristems [38]. Treatment with H2O2 leads to a decrease in the expression levels of auxin-related proteins (DR5, AUX1, PIN1, and PIN2) in Arabidopsis thaliana, indicating an inhibitory effect of H2O2 on auxin synthesis and transport [39]. In this experiment, the number of lateral roots in the treated group was notably higher than that in the control group, accompanied by an increase in peroxidase expression and differences in root development. This suggests that peroxidases also play an important role in hormone signaling pathways.
Moreover, peroxidases play a role when plants are subjected to biological and physical damage factors. Receptors on the membrane receive and transmit stress signals, leading to oxidative bursts in the plasma membrane and organelles. Peroxidases promote the generation of reactive oxygen species (ROS) [40,41], which in turn change ion distribution and activate nuclear gene expression during signal transduction and amplification, enabling plants to tolerate various stresses [42,43,44,45]. Manganese deficiency leads to insufficient peroxidase activity and affects normal plant growth and development, while the exogenous addition of manganese can promote peroxidase expression and enhance peroxidase activity, increasing plant resistance to stress. Consistent performance between Cucumis sativus leaf peroxidase activity and cold resistance has been observed [46,47], as well as enhanced tolerance to low-temperature stress in Oryza sativa expressing wheat peroxidase genes [48,49]. These results align with the observations in this experiment. Root pruning is a form of injury stress to plants. According to the KEGG enrichment analysis of DEGs, P. orientalis responds to stress by expressing high levels of peroxidases, which affects root development. However, the detailed regulatory network of the peroxidase family still requires further exploration to fully understand the functional transition of peroxidase families under stress and non-stress conditions. This is of great significance for understanding how plants coordinate growth, development, and stress responses.

5. Conclusions

In this paper, we analyzed the transcriptome of P. orientalis from SSR and lncRNA, and found a total of 2025 DEGs in the three comparison periods. Enrichment analysis was subsequently performed on the differentially expressed transcripts. The results showed that there were significant differences in the peroxidase family before and after root cutting. Association analysis of these genes resulted in the identification of the five most critical genes. They were identified as F01.PB13906, F01.PB12754, F01.PB6924, F01.PB23047, and F01.PB2408, all of which were associated with plant growth and development. These results indicated that the expression of some key genes of peroxidase was different after root cutting, which resulted in changes in root physiology. These changes needed further experimental verification in further functional and expression analysis of peroxidase.

Supplementary Materials

The following supporting information can be downloaded at: https://www.mdpi.com/article/10.3390/f15071232/s1, Table S1: Upstream and downstream primers of 16 genes and internal reference genes for qRT-PCR; Table S2: The PacBio SMRT sequencing information of Platycladus orientalis; Table S3: Statistics of second-generation transcriptome sequencing data; Table S4: Statistical table of results of second-generation sequencing data and transcript sequence comparison; Table S5: Functional annotation of 22 related genes; Table S6: A table of correlations between genes.

Author Contributions

Conceptualization—methodology, J.Q. and H.D.; software—validation, H.S.; search. H.S. and X.F.; writing—original draft software, H.D.; validation, H.S. and X.F.; formal analysis, Y.W. and T.W.; research work, H.D.; data collection, J.Q. and H.D.; original manuscript drafting, H.D.; review preparation and editing, H.D.; guidance, J.Q. and X.Y.; administration, X.Y.; funding procurement, X.Y. and J.Q. All authors have read and agreed to the published version of the manuscript.

Funding

This research was funded by the National Natural Science Foundation of China, Grant Number 31700549, and the China Postdoctoral Science Foundation Project, Grant Number 2017M612401.

Data Availability Statement

The basic data for this article can be found in the article. However, some data are currently not shared and are also part of ongoing research. If necessary, they can be obtained from the corresponding author upon reasonable request.

Conflicts of Interest

The authors declare no conflicts of interest.

References

  1. Toca, A.; Oliet, J.A.; Villar-Salvador, P.; Martínez Catalán, R.A.; Jacobs, D.F. Ecologically distinct pine species show differential root development after outplanting in response to nursery nutrient cultivation. For. Ecol. Manag. 2019, 451, 117562. [Google Scholar] [CrossRef]
  2. Liangpeng, Y.; Jian, M.; Yan, L. Impact of salt stress on the features and activities of root system for three desert halophyte species in their seedling stage. Sci. China Ser. D 2007, 50, 97–106. [Google Scholar]
  3. Yang, X.T.; Yang, X.B.; Zeng, L.L.; Fan, Z.W. Ecological functions of root system of forest trees and factors affecting root distribution. J. Henan Agric. Univ. 2009, 43, 681–690. [Google Scholar]
  4. Lu, W.; Wang, X.; Wang, F. Adaptive minirhizotron for pepper roots observation and its installation based on root system architecture traits. Plant Methods 2019, 15, 29. [Google Scholar] [CrossRef] [PubMed]
  5. Li, Y.; Zhang, Y.; Zhang, Y.; Krehbiel, P.R. Analysis of the relationship between the morphological characteristics of lightning channels and turbulent dynamics based on the localization of VHF radiation sources. Geophys. Res. Lett. 2024, 51, e2023GL106024. [Google Scholar] [CrossRef]
  6. Zhou, B.Z.; Zhang, S.G.; Fu, M.Y. The origin, development and application of Minirhizotron, a new technology for plant root. J. Ecol. 2007, 2, 253–256. [Google Scholar]
  7. Cai, T.; Xu, H.; Peng, D.; Yin, Y.; Yang, W.; Ni, Y.; Chen, X.; Xu, C.; Yang, D.; Cui, Z.; et al. Exogenous hormonal application improves grain yield of wheat by optimizing tiller productivity. Field Crop Res. 2014, 155, 172–183. [Google Scholar] [CrossRef]
  8. Yu, H.; Hu, Y.; Qi, L.; Zhang, K.; Jiang, J.; Li, H.; Zhang, X.; Zhang, Z. Hyperspectral Detection of Moisture Content in Rice Straw Nutrient Bowl Trays Based on PSO-SVR. Sustainability. 2023, 15, 8703. [Google Scholar] [CrossRef]
  9. Löf, M.; Thomsen, A.; Madsen, P. Sowing and transplanting of broadleaves (Fagus sylvatica L., Quercus robur L., Prunus avium L. and Crataegus monogyna Jacq.) for afforestation of farmland. For. Ecol. Manag. 2004, 188, 113–123. [Google Scholar] [CrossRef]
  10. Agibalova, A.V. On the completeness of systems of root functions of differential operators of fractional order with matrix coefficients. Math. Notes 2010, 88, 287–290. [Google Scholar] [CrossRef]
  11. Ganin, H.; Kemper, N.; Meir, S.; Rogachev, I.; Ely, S.; Massalha, H.; Mandaby, A.; Shanzer, A.; Keren-Paz, A.; Meijler, M.M.; et al. Indole Derivatives Maintain the Status Quo between Beneficial Biofilms and Their Plant Hosts. Mol. Plant Microbe Interact. 2019, 32, 1013–1025. [Google Scholar] [CrossRef] [PubMed]
  12. Cao, X.D.; Luo, F.Q.; Qian, G.Q. Study on the cultivation of Pinus massoniana seedlings in containers by transplanting mycorrhizal roots. J. Fujian For. Coll. 1994, 2, 128–132. [Google Scholar]
  13. Yang, S.M.; Yang, B.C.; Jiang, L.Y.; Yang, P.; Lu, Y. Technology of cultivation and cultivation management of green Zanthoxylum zanthoxylum root transplanting seedlings. Hunan For. Sci. Technol. 2020, 47, 112–115. [Google Scholar]
  14. Du, Y.W.; Deng, X.Z.; Cheng, J.Y. Effect of root cutting on quality of thin shelled hickory stock. For. Sci. West. China 2021, 50, 92–98. [Google Scholar]
  15. Thomas, P.; Ravindra, M.B. Effect of pruning or removal of in vitro formed roots on ex vitro root regeneration and growth in micropropagated grapes. Plant Cell 1997, 51, 177–180. [Google Scholar] [CrossRef]
  16. Ma, S.C.; Xu, B.C.; Li, F.M.; Huang, Z.B. Effects of root pruning on root efficiency, water use and yield of winter wheat. J. Appl. Environ. Biol. 2009, 15, 606–609. [Google Scholar] [CrossRef]
  17. Wang, S.Y.; Wang, P.; Tu, G.Q.; Li, B.M.; Chen, Q.; Zhang, M.; Tao, H.H.; Chen, D.Y.; Jin, L.L. Effects of root cutting treatment on growth potential and fruit quality of kiwi fruit. Chin. Fruit Tree 2022, 12, 32–37. [Google Scholar]
  18. Hou, D.P.; Xu, Y.X.; Li, M.J.; Liu, H.S.; Xu, S.Z.; He, C.S. Experiment on the cultivation of Keeleria phyllosa seedlings by cutting root and matching matrix. Green Technol. 2018, 15, 87–89. [Google Scholar]
  19. Fan, G.Y.; Hu, L.D.; Zhou, Z.R. Study on the technology of osmanthus seedling cutting and transplanting. Mod. Hortic. 2017, 21, 78. [Google Scholar]
  20. Yan, M.; Cui, F.; Liu, Y.; Zhang, Z.; Zhang, J.; Ren, H.; Li, Z. Vegetation type and plant diversity affected soil carbon accumulation in a postmining area in Shanxi Province, China. Land Degrad. Dev. 2019, 31, 181–189. [Google Scholar] [CrossRef]
  21. Wang, R.X.; Kong, Q.Y.; Yu, H.; Guo, J.; Wu, D.; Xin, X.B. Study on multifunctional evaluation of Platycladus orientalis plantation in Mentougou district, Beijing. J. Cent. South Univ. For. Technol. 2016, 36, 58–62. [Google Scholar]
  22. Hu, Y.Z. The medicine of dark hair and hair—Platycypress leaf. All Things Rural 2017, 14, 54. [Google Scholar]
  23. Yang, X.; Yan, D.; Liu, C. Natural regeneration of trees in three types of afforested stands in the Taihang Mountains, China. PLoS ONE 2014, 9, e108744. [Google Scholar] [CrossRef] [PubMed]
  24. Yang, X.T.; Wang, G.L.; Zhao, N.; Fan, Z.W. Effects of different root cutting treatments on lateral root growth of tree seedlings. J. Henan Agric. Univ. 2010, 44, 155–159. [Google Scholar]
  25. Ayadi, L.; Motorin, Y.; Marchand, V. Quantification of 2′-O-Me Residues in RNA Using Next-Generation Sequencing (Illumina RiboMethSeq Protocol). Methods Mol. Biol. 2018, 1649, 29–48. [Google Scholar] [CrossRef]
  26. Sun, J.; Xu, Y.; Ye, S.; Jiang, H.; Chen, Q.; Liu, F.; Zhou, W.; Chen, R.; Li, X.; Tietz, O.; et al. Arabidopsis ASA1 is important for jasmonate-mediated regulation of auxin biosynthesis and transport during lateral root formation. Plant cell. 2019, 21, 1495–1511. [Google Scholar] [CrossRef] [PubMed]
  27. Li, X.; Mo, X.; Shou, H.; Wu, P. Cytokinin-mediated cell cycling arrest of pericycle founder cells in lateral root initiation of Arabidopsis. Plant Cell Physiol. 2006, 47, 1112–1123. [Google Scholar] [CrossRef] [PubMed]
  28. Wang, H.; Eyun, S.I.; Arora, K.; Tan, S.Y.; Gandra, P.; Moriyama, E.; Khajuria, C.; Jurzenski, J.; Li, H.; Donahue, M.; et al. Patterns of Gene Expression in Western Corn Rootworm (Diabrotica virgifera virgifera) Neonates, Challenged with Cry34Ab1, Cry35Ab1 and Cry34/35Ab1, Based on Next-Generation Sequencing. Toxins 2017, 9, 124. [Google Scholar] [CrossRef] [PubMed]
  29. Kumar, R.; Ichihashi, Y.; Kimura, S.; Chitwood, D.H.; Headland, L.R.; Peng, J.; Maloof, J.N.; Sinha, N.R. A High-Throughput Method for Illumina RNA-Seq Library Preparation. Frontiers in plant science. Front. Plant Sci. 2012, 3, 202. [Google Scholar] [CrossRef] [PubMed]
  30. Carneiro, M.O.; Russ, C.; Ross, M.G.; Gabriel, S.B.; Nusbaum, C.; DePristo, M.A. Pacific biosciences sequencing technology for genotyping and variation discovery in human data. BMC Genom. 2012, 13, 375. [Google Scholar] [CrossRef]
  31. Pan, L.; Dinh, H.Q.; Pawitan, Y.; Vu, T.N. Isoform-level quantification for single-cell RNA sequencing. Bioinformatics 2022, 38, 1287–1294. [Google Scholar] [CrossRef] [PubMed]
  32. Kainth, A.S.; Haddad, G.A.; Hall, J.M.; Ruthenburg, A.J. Merging short and stranded long reads improves transcript assembly. PLoS Comput. Biol. 2023, 19, e1011576. [Google Scholar] [CrossRef] [PubMed]
  33. Tian, J.; Feng, S.; Liu, Y.; Zhao, L.; Tian, L.; Hu, Y.; Yang, T.; Wei, A. Single-Molecule Long-Read Sequencing of Zanthoxylum bungeanum Maxim. Transcriptome: Identification of Aroma-Related Genes. Forests 2018, 9, 765. [Google Scholar] [CrossRef]
  34. Zhou, Y.; Tang, Q.; Wu, M.; Mou, D.; Liu, H.; Wang, S.; Zhang, C.; Ding, L.; Luo, J. Comparative transcriptomics provides novel insights into the mechanisms of selenium tolerance in the hyperaccumulator plant Cardamine hupingshanensis. Sci. Rep. 2018, 8, 2789. [Google Scholar] [CrossRef]
  35. Byrne, A.; Cole, C.; Volden, R.; Vollmers, C. Realizing the potential of full-length transcriptome sequencing. Philos. Trans. R. Soc. B Biol Sci. 2019, 374, 20190097. [Google Scholar] [CrossRef]
  36. Rhoads, D.M.; Subbaiah, C.C. Mitochondrial retrograde regulation in plants. Mitochondrion 2007, 7, 177–194. [Google Scholar] [CrossRef]
  37. Mhamdi, A.; Noctor, G.; Baker, A. Plant catalases: Peroxisomal redox guardians. Arch. Biochem. Biophys. 2012, 525, 181–194. [Google Scholar] [CrossRef]
  38. Xu, L.; Zhao, H.; Ruan, W.; Deng, M.; Wang, F.; Peng, J.; Luo, J.; Chen, Z.; Yi, K. ABNORMAL INFLORESCENCE MERISTEM1 Functions in Salicylic Acid Biosynthesis to Maintain Proper Reactive Oxygen Species Levels for Root Meristem Activity in Rice. Plant Cell 2017, 29, 560–574. [Google Scholar] [CrossRef]
  39. Zhu, X.F.; Lu, Y.N.; Wang, J.D.; Xu, Q. Investigation of the interactions between indole-3-acetic acid and catalase: A spectroscopic study in combination with second-order calibration and molecular docking methods. Anal. Methods 2013, 5, 6037–6044. [Google Scholar] [CrossRef]
  40. Anjum, N.A.; Sharma, P.; Gill, S.S.; Hasanuzzaman, M.; Khan, E.A.; Kachhap, K.; Mohamed, A.A.; Thangavel, P.; Devi, G.D.; Vasudhevan, P.; et al. Catalase and ascorbate peroxidase-representative H2O2-detoxifying heme enzymes in plants. Environ. Sci. Pollut. Res. Int. 2016, 23, 19002–19029. [Google Scholar] [CrossRef]
  41. Liu, C.; Dong, L.A.; Lin, J.Z.; Liu, X.M. Research Advances on Regulation Mechanism of Reactive Oxygen Species Metabolism under Stresses. Life Sci. Res. 2019, 23, 253–258. [Google Scholar]
  42. Del Río, L.A. ROS and RNS in plant physiology: An overview. J. Exp. Bot. 2015, 66, 2827–2837. [Google Scholar] [CrossRef] [PubMed]
  43. Gao, M.; He, Y.; Yin, X.; Zhong, X.; Yan, B.; Wu, Y.; Chen, J.; Li, X.; Zhai, K.; Huang, Y.; et al. Ca2+ sensor-mediated ROS scavenging suppresses rice immunity and is exploited by a fungal effector. Cell 2021, 184, 5391–5404.e17. [Google Scholar] [CrossRef] [PubMed]
  44. Ma, J.; Hu, W.Z.; Bi, Y.; Jiang, A.L. Effect of exogenous ethylene and methyl jasmonate (MeJA) on reactive oxygen metabolism in tissue of fresh-cut cabbage. Sci. Technol. Food Ind. 2013, 34, 336–339+343. [Google Scholar] [CrossRef]
  45. Saidi, I.; Nawel, N.; Djebali, W. Role of selenium in preventing manganese toxicity in sunflower (Helianthus annuus) seedling. S. Afr. J. Bot. 2014, 94, 88–94. [Google Scholar] [CrossRef]
  46. Zhang, M.; Li, Q.; Liu, T.; Liu, L.; Shen, D.; Zhu, Y.; Liu, P.; Zhou, J.M.; Dou, D. Two cytoplasmic effectors of Phytophthora sojae regulate plant cell death via interactions with plant catalases. Plant Physiol. 2015, 167, 164–175. [Google Scholar] [CrossRef]
  47. Mathioudakis, M.M.; Veiga, R.S.; Canto, T.; Medina, V.; Mossialos, D.; Makris, A.M.; Livieratos, I. Pepino mosaic virus triple gene block protein 1 (TGBp1) interacts with and increases tomato catalase 1 activity to enhance virus accumulation. Mol. Plant Pathol. 2013, 14, 589–601. [Google Scholar] [CrossRef] [PubMed]
  48. Yang, F.; Wang, Y.; Miao, L.F. Comparative physiological and proteomic responses to drought stress in two poplar species originating from different altitudes. Physiol. Plant 2010, 139, 388–400. [Google Scholar] [CrossRef]
  49. Rizhsky, L.; Hallak-Herr, E.; Van Breusegem, F.; Rachmilevitch, S.; Barr, J.E.; Rodermel, S.; Inzé, D.; Mittler, R. Double antisense plants lacking ascorbate peroxidase and catalase are less sensitive to oxidative stress than single antisense plants lacking ascorbate peroxidase or catalase. Plant J. 2002, 32, 329–342. [Google Scholar] [CrossRef]
Figure 1. Root morphology of P. orientalis control (CK) and treatment groups (Treat) at different time periods.
Forests 15 01232 g001
Figure 2. Length distribution of protein sequences encoded by complete ORF region.
Forests 15 01232 g002
Figure 3. Statistical number of transcripts annotated by each database.
Forests 15 01232 g003
Figure 4. Density distribution of different SSR types. (Note: c denotes the compound SSR, which contains at least 2 perfect SSRs with a distance of less than 100 bp; p1, p2, p3, p4, p5, and p6 denotes the perfect repeat sequence of Mono-nucleotide, Di-nucleotide, Tri-nucleotide, Tetra-nucleotide, Penta-nucleotide, as well as Hexa-nucleotide).
Forests 15 01232 g004
Figure 5. Venn diagram showing number of lncRNA transcripts identified by 4 analysis software.
Forests 15 01232 g005
Figure 6. Changes in differential genes of P. orientalis roots across 3 time periods: (A) Number of DEGs in pairwise comparisons between control (CK) and treatment groups at same time point; (B) Venn diagram showing intersection of DEGs between control (CK) and treatment groups at different time periods; (C) Gene expression trends of DEGs across 3 time series.
Forests 15 01232 g006
Figure 7. GO enrichment analysis of DEGs generated at 3 time points. (Note: (AC) represent the developmental stages of 1 d, 20 d, and 60 d).
Forests 15 01232 g007
Figure 8. KEGG enrichment analysis of DEGs generated at 3 time points. (Note: (AC) represent the developmental stages of 1 d, 20 d, and 60 d).
Forests 15 01232 g008
Figure 9. Expression profiles of genes related to 2 key pathways: (A) Expression pattern analysis of genes enriched in phenylalanine metabolism pathway (ko00360); (B) Expression pattern analysis of genes enriched in phenylpropanoid biosynthesis pathway (ko00940).
Forests 15 01232 g009
Figure 10. Expression correlation network of candidate genes: (A) Network of expression correlation among 21 candidate genes; (B) Sub-network of 5 hub genes.
Forests 15 01232 g010
Figure 11. Expression profiles of 16 DEGs by RT-qPCR and correlation with RNA-Seq results.
Forests 15 01232 g011
Disclaimer/Publisher’s Note: The statements, opinions and data contained in all publications are solely those of the individual author(s) and contributor(s) and not of MDPI and/or the editor(s). MDPI and/or the editor(s) disclaim responsibility for any injury to people or property resulting from any ideas, methods, instructions or products referred to in the content.

