Abstract
Our aim is to contribute to understanding the role of subtropical trees on carbon storage and CO2 removal in the city of Sao Paulo/Brazil, besides highlighting the surrounding environment implications to sibipiruna trees (Cenostigma pluviosum)’s performance. The case study was conducted with three trees, one planted on a sidewalk in Pinheiros neighborhood, a highly sealed area, and two in a green area, the Ibirapuera Park. To define the stem basal area growth and its pattern, local measurements were taken over a year and a segmented linear regression model was adjusted. The stem growth dependency on microclimate was tested by a Spearman Correlation. The trees’ active stem growth presented a similar pattern. The soil volumetric water content and soil temperatures were the variables with more impact. The total mean radial stem growth for the IBIRA1 and IBIRA2 trees was 1.2 mm year−1 and 3 mm year−1, while at PIN1 it was 1.3 mm year−1. The total biomass increment in IBIRA1 and IBIRA2 was 4.2 kg C year−1 and 12.8 kg C year−1, while in PIN it was 4.9 kg C year−1 and the removal was 15.3 C year−1, 47.1 kg CO2 year−1 and 17.9 kg CO2 year−1, respectively. The results indicated that the land cover difference implies a significant interference with the promotion of carbon fixation and CO2 removal, demonstrating that planting urban trees in soils with better water storage conditions is more efficient.
1. Introduction
The Intergovernmental Panel on Climate Change (IPCC) [1] considers urban forests an important priority for cities to mitigate climate change by carbon sequestration and CO2 removal, one of the proposed options for carbon offsetting approaches [2].
Urban green spaces are very important for promoting ecosystem services (ES), which are benefits that can be obtained from nature, as flows of materials and energy, combined with manufactured and human capital services to produce human welfare and represent part of the total economic value of the planet [3,4,5]. Overall, ES are constituents of human well-being by promoting security, basic material for a good life, and health [6]. According to the Common International Classification of Ecosystem Services (CICES) [7], ES are organized into three main categories: regulating, provisioning and maintenance, and cultural services.
In urban areas, the most studied ES are the regulating services [8,9,10], such as urban flood control by green areas [11,12], air pollution removal by trees and plant leaves [13], trees acting as a sink for carbon dioxide (CO2) by fixing carbon during photosynthesis and storing carbon (C) as biomass [14,15], and air temperature cooling by crown shade and evapotranspiration from vegetation leaves [16,17,18].
Some urban planning initiatives, such as the creation of urban green spaces, can have positive effects on urban microclimates [19,20,21], which receive even more attention due to the urban heat island effect (UHI) [22,23,24] caused by urbanization, resulting from differences in heat fluxes between urban and rural areas, with urban areas generally absorbing and storing more sensible heat than rural areas [25,26,27,28].
Urban vegetation promotes ES regulation and reduces some negative impacts of urbanization, such as higher temperatures, UHI, air pollution, noise pollution, and flooding [29,30,31]. Trees, because of their larger volume, can keep more biomass and have the potential to store relatively high amounts of carbon compared to other types of urban vegetation, such as shrubs and grass; they are therefore an important priority for cities in their task to mitigate climate change [30,32,33]. Bamboo also has a positive effect on microclimate characteristics and thermal comfort [34]; its different species can be considered as reducing the negative impacts of climate change as a large carbon sink in nature, playing a key role in adapting and improving human ecosystems [35].
The IPCC [1] indicated with high confidence that average temperatures are expected to increase in all Latin America and Caribbean subregions and will continue to rise at higher rates than the global average, as will the extreme precipitation events. The intensity of UHI in the Metropolitan Region of São Paulo (MRSP) was assessed by [36,37,38] and showed a maximum UHI intensity of about 5.5 °C in spring. Among other warming trends, heat waves are a natural phenomenon, a cycle of drought and extreme heat, and are expected in a warming climate. These significant trends are increasing in frequency, intensity, and duration, especially in large cities in southern Brazil and other areas [39].
As the largest city in Latin America and the Caribbean (LAC) [40], the city of São Paulo has an urban expansion process that has occurred in parallel with significant suppression of urban vegetation [41]. This implies several serious environmental and health problems, such as air pollution, flooding, and the UHI [36].
Another common aspect of this region is related to poverty and inequality, which is the most difficult challenge faced there, reflecting the environmental degradation observed [40,42] and the different spatial distribution of green areas in the city.
Brazil emitted 2.4 billion gross tons of greenhouse gases in 2021, an increase of 12.2% compared to 2020. The rise in deforestation, especially in the Amazon Rainforest, was mainly to blame for the increase in emissions [43].
A pressing environmental issue common to many cities is the amount of carbon dioxide (CO2) emitted by services and industry, as well as by people’s lifestyles and energy consumption [1,44], which, along with other gases, contributes to the greenhouse effect that causes the planet temperature to rise [1]. The same happens in the city of São Paulo; 2019 accounted for a total gross emission of 11.53 million tons of CO2 [42], most of which came from the energy sector, specifically from fossil fuel vehicles, such as cars, buses, motorcycles, and trucks [43,45,46].
Many studies have suggested that urban forests may act as a local sink within cities [47,48,49]. Nowak et al. [50] quantified the carbon (C) storage and sequestration by urban trees in United States urban areas; they estimated 643 million tons of C stored and 25.6 million tons of C annually sequestered per year. Zhao [51] quantified C storage and sequestration by urban forests in Hangzhou, China; the total was estimated at 11.74 million tons of C, and sequestration was 1,328,166.55 t C per year, annually representing an 18.57% offset of the amount of carbon emitted by industrial enterprises.
The ability of urban trees to retain and store carbon has also been studied in the LAC region [52,53,54]. CO2 sequestration is the most valuable service provided by the parks in Sao Paulo city [55]. Most LAC publications frequently deal with issues related to ecosystem services in relation to biodiversity conservation and the quantification of regulating services [56].
Carretero et al. [57] estimated the carbon storage of Morus alba trees as a dominant species in the urban forest of Mendoza city, Argentina, considering the total tree coverage; all city area, both urban and rural, accumulates 67,208 tons of carbon, evidencing the relevance of urban forestry for carbon storage. Reynolds [58] found 103.8 KgCO2 stored attributed to all the public trees at Aburra Valley, Colombia, and the same trees were estimated to remove 2 kg CO2 year−1.
Although some studies have linked the influence of green spaces on promoting ES to trees in the LAC region, little research has been conducted to quantitatively understand the effect of urban trees on carbon storage due to growth in a subtropical region, such as the city of São Paulo, and there is a need for studies that can help to better demonstrate this.
Urban trees are severely impacted by urban conditions [59], such as sealed surfaces that result in reduced water availability [60], limited nutrient availability [61], reduced soil aeration [62], reduced rooting space [63], and high soil compaction and high bulk density [64].
Many studies have indicated that tree growth patterns are influenced by the surrounding environment; the more sealed the site, the less water is absorbed, and the less photosynthesis takes place, resulting in less carbon (C) being produced for growth and metabolic functions, negatively affecting tree growth [65,66].
Regarding tree growth patterns, radial stem growth is a common response variable in forestry and ecological tree research, as it regards tree health, yield, and ecosystem functioning [67,68,69].
To better explore this mutual relationship, based on the influence of the environment on the growth of trees and the effect of trees on the environment, this paper investigates the potential of urban trees to retain carbon and their sequestration rate measured by stem growth and the influences that two distinct urban sites, a park and a neighborhood paved sidewalk, have on these variables in the city of São Paulo, Brazil.
The research addressed the following questions:
- A.
- How is the Cenostigma pluviosum trees’ growth pattern considering the trees’ surrounding environment interference?
- B.
- How does the stem radial growth of Cenostigma pluviosum depend on local meteorological parameters: air temperature (°C), air relative humidity (%), precipitation (mm), soil temperature (°C), and soil volumetric water content (%)?
- C.
- What are the estimates of the total carbon stored and CO2 annually sequestered by the trees studied?
2. Materials and Methods
2.1. Study Area
Brazil is the largest country in Latin America and the Caribbean (LAC), with 84.3% (160 million) of its population living in urban areas [70,71]. Its largest urban agglomeration is the Metropolitan Region of São Paulo (MRSP), with 39 municipalities totaling 22 million inhabitants [72].
São Paulo, the largest city in Brazil and the second largest in Latin America and the Caribbean (LAC), has an area of 1,521,110 km2 and is densely populated (7398 inhabitants/km2) [71]. The estimated population of the municipality is 11,451,245 inhabitants [72].
According to the Köppen-Geiger climate classification, the city of São Paulo has a Cwa climate (humid subtropical), presenting a dry winter (July, August, September) and a warm summer (January, February, March) [73]. From 1990 to 2019, the average rainfall per year was 1552 mm, mostly occurring in summer; the average minimum temperature was 13.8 °C, and the average maximum was 27.9 °C [74]. The city is located on a plateau of an escarpment that separates the metropolitan area from the coastline, and its sea breezes also influence climatic patterns [75,76].
After a dedicated field campaign, we selected two different areas in São Paulo, approximately 4.9 km away from each other, which had the same tree species compared in their different environmental conditions: the first one, Pinheiros neighborhood, is in an urbanized area, mixed with residential low-rise buildings and a commercial zone, where the trees were planted in the pavement area; and the second one in a green area, Ibirapuera Park, the largest urban park in the city, where the trees were surrounded by a permeable area, grass, and a parking lot over permeable soil (Figure 1 and Figure 2). In this paper, both areas will be identified as the TreeLabs PIN, for Pinheiros neighborhood, and IBIRA, for Ibirapuera Park.
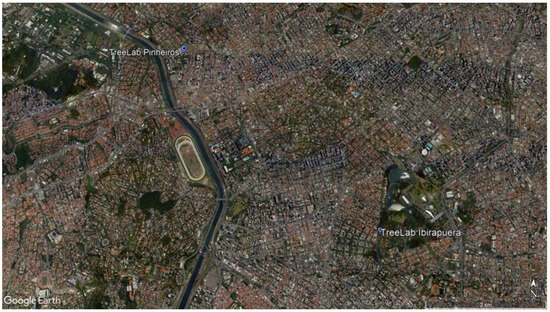
Figure 1.
TreeLabs location in São Paulo city: Pinheiros neighborhood and Ibirapuera Park. Source: Google Earth Pro 7.3.6, 2021.
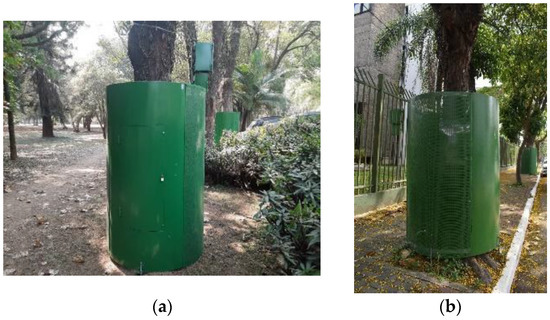
Figure 2.
TreeLabs installed in (a) the Ibirapuera Park (TreeLab IBIRA) and (b) the Pinheiros neighborhood sidewalk (TreeLab PIN). São Paulo, 2021. Julia R-Leite.
Another important aspect of the locations chosen was the security to protect the equipment from vandalism by the SABESP Headquarters (Basic Sanitation Company of the State of São Paulo-Sabesp) in the Pinheiros neighborhood and the Municipal Police Station in Ibirapuera Park. To reinforce this, we designed and built a solid iron casing to protect the equipment on each tree (Figure 2).
2.2. Tree Selection and Morphological Measurements
Due to the sensor availability, we selected three individual trees to study: two surrounded by grass in Ibirapuera Park (IBIRA1, IBIRA2) and one tree on the sidewalk at Pinheiros neighborhood (PIN1) and one tree, all of them of the species Sibipiruna (Cenostigma pluviosum) (Figure 3) [77], a common tree species in the city, which is very well adapted to urban areas and widely planted in the city, a native tree of the Brazilian Atlantic Forest. It is a yellow flowering ornamental tree, a semi-deciduous species that loses most of its leaves during the winter (June–August) [78,79]. The specific wood density is 654 kg/m3 [80], and the specific leaf area is 27.21 m2/kg [81].
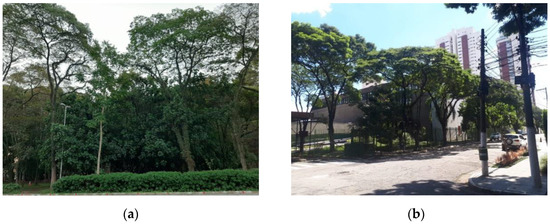
Figure 3.
(a)—Cenostigma pluviosum in Ibirapuera Park. (b)—Cenostigma pluviosum on the sidewalk in front of the SABESP headquarters in the Pinheiros neighborhood. São Paulo, 2021. Julia R-Leite.
All the trees have similar structural characteristics. Rahman et al.’s [82] methodology was used for the structural measurements and analyses. Stem diameter at breast height (DBH) was measured using a diameter tape at a height of 1.30 m. Tree height was calculated using a MileSeey PF3 pulse laser rangefinder. Crown radii were measured with a tape measure in eight intercardinal directions along the ground surface from the center of the trunk to the tip of the projection shoot and used to calculate the crown projection area (CPA).
The leaf area index (LAI) was obtained by hemispherical photography taken in October 2022, using a Canon EOS 6D camera with a fisheye lens (SIGMA 8mm F 3.5 DG circular), following Moser et al. [64]. Among several methods, LAI values were calculated using the LAI-2000G algorithm with WinSCANOPY 2009a software (Regent Instruments, Inc., Quebec, QC, Canada).
The surface sealing [%] was derived from the unsealed area (UA) and the maximum crown projection area influence (CPAmax). The mean crown radius (CR) was calculated by taking the average of the distance from the tree trunk to the widest measured crown extension in the cardinal and intercardinal directions (N-NE-E-SE-S-SW-W-NW) with a measuring tape (accuracy ± 0.1 m). The maximum crown projection area influence equals π multiplied by the 1.5-mean crown radius squared. In the same way, UA was calculated by the squared mean radius of the unsealed distances measured from the tree trunk to the sealed area in all cardinal and intercardinal directions and multiplied by π. The sealed area was calculated by deducting the unsealed area from the maximum crown projection area influence. The surface sealing [%] is the ratio between the sealed area and the maximum crown projection area influence.
2.3. Biomass Estimated by Allometric Relations
Carbon storage in urban forests depends on the accumulation of biomass in trees, which is affected by tree structural characteristics, such as canopy cover, LAI, wood density, photosynthesis rates, site conditions, and DBH [47,83,84]. Carbon sequestration is directly related to the annual rate of change in carbon stored in above- and belowground biomass over the course of one growing season [85,86].
To estimate the total biomass of the trees studied, we applied allometric equations systematized in the CityTree model [30] based on the relationship between DBH, tree height, crown start, and wood density [47,87,88]; these calculations can provide information about the volume of a tree (volumetric equations) and the dry weight of a tree (direct equations).
2.4. Meteorological Data Collection
The weather data used in the research were derived from the meteorological station of the LSF/IEE-USP [74]. The data included air temperature (°C) and relative humidity (%). Precipitation (mm) was obtained from FCTH [89]. All data were recorded continuously with a resolution of 10 min from 24 August 2021 to 15 October 2022.
2.5. Soil Volumetric Water Content and Temperature Measurements
The percentage of water in the soil and temperature were measured at both sites using the EM 36—Soil Volumetric Water Content (VWC) and Soil Temperature Sensor (Ecomatik GmbH, Dachau, Germany). Four sensors were installed horizontally at each site under the trees through the soil profile to a depth of 15 cm. Raw data were collected every 10 min from 24 August 2021 to 15 October 2022 and stored in a Campbell CR300 data logger equipped with a Campbell Logger Multiplexer DL 96.
In Ibirapuera Park, the sensors were installed under 20 cm of the unpaved area at a distance of 3 m around each of the trees. In Pinheiros, however, the unpaved area around the trunk is narrow, and it was difficult to create the space to install the sensors because the ground was full of stones. As the tree had almost no free space around its trunk, we chose two trees planted beside it to dig and install two sensors around each tree, at the furthest opening point from the trunk, about 25 cm away.
Two-sample t-tests were applied to verify the statistical difference in soil temperature and soil volumetric water content.
2.6. Stem Growth
Continuous measurements of stem growth were made on each tree, equipped with an automatic radius dendrometer type DR (Ecomatik, Dachau, Germany) at a height of approximately 1.80 m. The changes observed in the dataset corresponded to radial growth and water status in relation to diurnal diameter variation [90]. These were converted into an electrical signal [91,92].
Raw data were collected every 10 min from 24 August 2021 to 15 October 2022 and stored in a Campbell Scientific CR300 data logger equipped with a Campbell Logger Multiplexer DL 96. After data processing, the daily values recorded by the dendrometers at 6 a.m. were used for the analyses detailed as follows.
The growth analysis included the trees PIN1, IBIRA1, and IBIRA2. Dendrometer displacement was converted into micrometers, and daily radial growth curves were developed for each tree.
Based on the growth pattern, it was possible to assume that growth appears to occur at a constant rate for certain time intervals.
We have fit separate models for each one of the three trees. To account for different growth rates according to four different time periods, the models were based on a segmented regression methodology [93]. The time periods were specified a priori, and they depend on the tree. The model for tree i can be expressed as:
where STGij is the response (dependent) variable representing the average stem growth for tree i at time tij, the independent variable. Also, in Equation (2),
with kiℓ representing the ℓ-th (= 1, 2, 3) change-point defining each one of the four time periods in which changes in the rate of growth take place for tree i. The term εij represents the error, assumed to be normally distributed with mean 0 and variance σ2i.
Alternatively, the model in Expression (1) may also be written as:
All data analyses were performed in R software, version 4.3.1, using the programmable library segmented [94]. The standard errors (SE) and the confidence intervals with a 95% confidence coefficient for all growth rates of interest were calculated.
2.7. Biomass Increment, Carbon Storage, and CO2 Fixed
With the total stem growth defined for each tree and area studied, the biomass increment, carbon storage, and fixed CO2 were derived from the City Tree 3.1 model [30]. The tree species-specific parameters applied were wood density (kg dw/m3) and specific leaf area (m2/kg dw). Parameters to calculate stem biomass and foliage biomass were DBH (cm), height (m), crown start (m), crown diameter (m), and LAI (m2/m2). Branch biomass was estimated according to Forrester et al. [95]. The belowground biomass was estimated and corrected for tropical climate according to Cairns et al. [96]. The model calculated the total biomass (kg C) for the trees at the beginning of the measurement on 24 August 2021 and after 15 October 2022, which resulted in the C storage and fixed CO2 during this period.
2.8. Statistics
Further data analysis was developed with R version 4.3.1 (functions readr; readxl; lubridate, among others) [97]. Spearman’s rank correlation tests were applied to assess the influence of meteorological data, soil temperature, and volumetric water content on the trees’ daily growth value by cor.test function.
3. Results
3.1. Tree Morphological Characteristics
The trees at Ibirapuera presented similar morphological characteristics, except for the crown, where IBIRA2 had a lower CPA (27%) and LAI (50%).
PIN 1 is around 2.89 m shorter (23%) and has a crown with less volume than those in Ibirapuera Park (27%, 35%) (IBIRA). The crown projection area (CPA) in Pinheiros is larger (42%, 58%), and its degree of grass area within CPA was much smaller than the value found in Ibirapuera Park TreeLabs (0.29% against 100%) (Table 1). The trees at Ibirapuera do not have as much sunlight, being shaded by other trees, despite having 100% permeable soil around.

Table 1.
Average morphological characteristics of trees and degree of openness within the crown projection areas (CPAs). (±) Standard error of the mean.
PIN1 also had higher values of crown diameter (14.0 m) and DBH (49.4 cm).
3.2. Microclimatic Conditions
The microclimatic conditions along the studied period are presented in Figure 4.
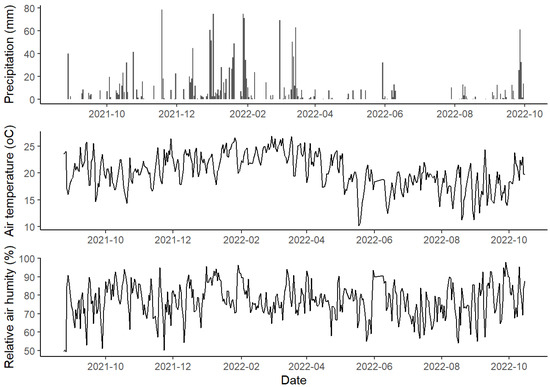
Figure 4.
Daily totals of precipitation, air temperature, and relative air humidity measured at the University of São Paulo between 24 August 2021 and 15 October 2022.
Concerning precipitation, we verified an initial rainy period with a monthly accumulation of 236 mm in October 2021, reaching its maximum in December 2021 (285 mm). In March 2022, a decrease was observed, when a monthly accumulation of 135 mm was registered, marking the beginning of a drier period, which reached the lowest monthly value in June 2022 (17 mm) and extended until September 2022. No higher values were presented in monthly accumulation (36 mm), but more frequent rainfall events occurred, which can characterize a change in the rainfall pattern.
Relative air humidity was the highest in January 2022, with a monthly average of 84% (±7.6), and the lowest in July 2022, 70% (±7.5), rising again from September 2022 with 80%. The air temperature started to rise in October 2021, corresponding to early spring, and had its peak in summer on 18 January 2022, at 35.06 °C; the highest monthly average air temperature was 24 °C, recorded in March 2022 (±2). In May 2002, the temperatures decreased; the lowest temperature was recorded on 5 May 2022, at 5.9 °C, with June 2022 being the month with the lowest average temperature at 17 °C (±2). It went back up with the beginning of spring, from October 2022, with a monthly average of 20 °C.
3.3. Soil Volumetric Water Content and Temperature Status
Given that the permeable area rate under the CPA in tree PIN is only 0.29% and that in trees IBIRA it is 100%, the results marked by the soil sensors indicate that soil permeability has a positive effect on the increase of soil moisture and a negative effect on soil temperature (Figure 5).
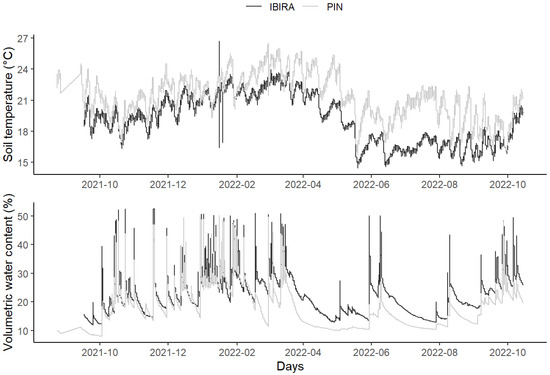
Figure 5.
Daily mean totals of soil temperatures (ST) (°C) and soil volumetric water content (VWC) (%) at two sites: TreeLabs IBIRA and TreeLabs PIN between 24 August 2021 and 15 October 2022.
Soil temperature was higher at PIN throughout the period. Yet, we observed the opposite situation for volumetric water content (VWC). In IBIRA, there was a higher percentage of water volume in the soil throughout the period.
The total soil temperature (ST) mean in PIN was 2.2 °C higher, registering 21.25 °C (±2.14), while in IBIRA it was 19.05 °C (±2.37) (t-value = −14.069, df = 823.48, p-value= 2.2 × 10⁻¹⁶). The plots showed similar behavior where the soil temperature increased gradually from October until March 2022, when they reached the highest monthly value for IBIRA, at 22.6 °C, and for PIN, at 24.3 °C. Afterward, the temperatures began to decrease, reaching lower temperatures; IBIRA in July 2022 (16.4 °C) and PIN in June (19.1 °C). In both areas, the ST started to increase from October 2022, presenting 18.7 °C and 19.9 °C, respectively, following the higher air temperatures (Table 2).
Table 2.
The mean difference between the two sites: TreeLabs IBIRA (Ibirapuera Park) and TreeLabs PIN (Pinheiros neighborhood) in terms of ST (soil temperatures) and VWC (volumetric water content).
Concerning the total value of volumetric water content (VWC) mean, in PIN the result was 17.6% (±6.63), and in IBIRA it was 22.0% (±6.79), being 4.4% higher than the value registered in PIN (t-value = 9.5324, df = 831.53, p-value = 2.2 × 10⁻¹⁶). In the two study areas, the highest monthly mean values were measured in IBIRA in March 2022 (29.4%) and PIN in January 2022 (28.5%), both in the summer, according to the highest precipitation accumulation (Table 2). These values are related to the rainfall season (from December to the end of March), with the highest amount of rainfall registered in December 2021 (285 mm); probably, the VWC at IBIRA is higher until March, because the permeable area is able to keep the soil humidity longer. The lowest monthly average VWC percentages were recorded in IBIRA in May 2022 (22.8%) and in PIN in July 2022 (14.7%). In both areas, the VWC started to increase again after September 2022, presenting monthly values of 25.13% and 20.13%, respectively, corresponding to the beginning of the next rainfall season (Figure 5).
3.4. Stem Growth Pattern
The mean daily growth increment of Cenostigma pluviosum presented similar behavior; however, we notice that the growth rate of the trees does not seem to be constant over time (Figure 6). The segmented linear regression models with three switching points resulted in four distinct straight lines for each tree [94,95]. The days related to each point are specified in Table 3 that presents the estimated growth rates over time for each of the trees, with the estimated increases and decreases at the switching points.
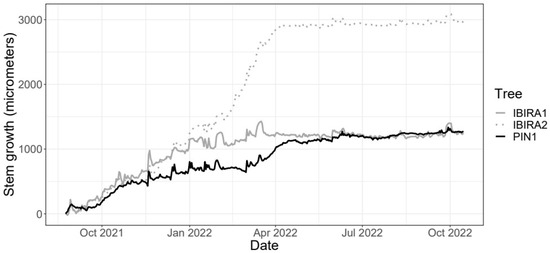
Figure 6.
Daily growth of the Cenostigma pluviosum trees at Ibirapuera Park and Pinheiros neighborhood between 24 August 2021 and 15 October 2022 (418 days in total).
Table 3.
Estimated stem growth rate (µm/day) and confidence interval for each studied tree and their respective time frame division.
The PIN1 tree’s total stem growth is reduced compared to the two trees in IBIRA. Comparing trees PIN1 and IBIRA1, they have similar total growth over time, but the estimated growth rate in tree PIN1 was noticeably higher from 10 March 2022 to 12 April 2022, resulting in higher growth in the end (Table 3). Trees IBIRA1 and IBIRA2 have similar beginning and ending of the growth curve, but between March and April 2022, a very high growth increase is noticed, which precedes an abrupt decrease in growth rates from 17 March 2022 at tree IBIRA1 (Table 3) and 30 March 2022 at tree IBIRA2 (Table 3).
All trees presented a period of reduced growth that coincided with the autumn season (Figure 6), with lower precipitation, temperatures, VWC, and ST. For tree PIN1, the low stem growth period stabilization is from mid-March 2022, and for tree IBIRA2 and tree PIN1, from early April 2022; all are similar dates. This stabilization time extends until October 2022.
The model below (Figure 7) provided an Adjusted R2 of 0.998, indicating adequate adjustment using segmented linear regression with 3 random cutoff points. Confidence intervals with a 95% confidence coefficient for the growth rates of all trees are presented below. The confidence interval is equivalent to performing a hypothesis test to verify that the rate is statistically different from zero (when the value 0 should not be in the interval). Figure 7 shows the adjustment obtained for the tree growth curves resulting from the estimated growth rates.
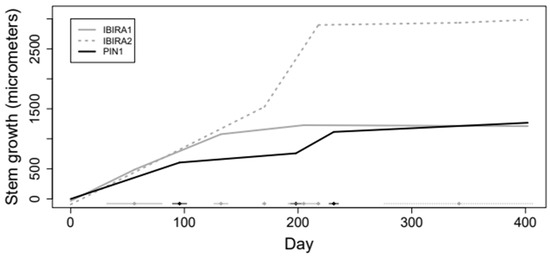
Figure 7.
Trees growth curves adjusted by segmented linear regression model.
3.5. Microclimatic Effects on Stem Growth
The interference of the microclimate variables ST, VWC, P, ARH, and AT with stem growth was tested by a Spearman Correlation (Figure 8 below) during the stem growth period, considered between September 2021 and the end of March 2022 (Figure 7, Table 3). The other months were not included in these analyses because of their low stem growth rate (Table 3).
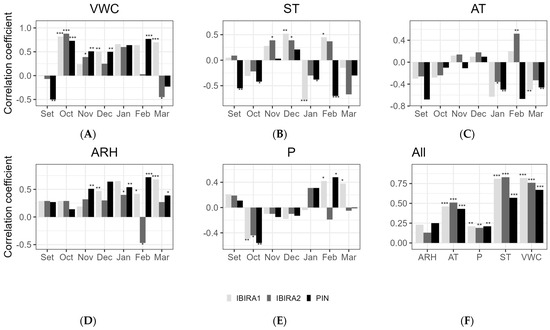
Figure 8.
Spearman’s correlation between the stem growth daily average (micrometer) and the microclimate variables for the months included in the tree growth period from September 2021 to March 2022. (A)—(VWC) Volumetric water content (%); (B)—(ST) Soil temperatures; (C)—(AT) Air temperature; (D)—(ARH) Air relative humidity; (E)—(P) Precipitation; (F)—for all the measurements together. Asterisks indicate a significant correlation (* at α < 0.05, ** at α < 0.01, *** at an α-level < 0.001).
According to the analysis of all months together (Figure 8), VWC and ST were the microclimatic variables that most impacted the stem growth of all trees with a high and significant correlation, especially VWC to IBIRA1 (0.82, ***) and IBIRA2 (0.76, ***), which presented a higher correlation coefficient than PIN (0.67, ***). Although the monthly correlations for ST vary and include negative values, the overall positive correlation indicates that the months with the strongest positive correlations prevail, presenting significative values to PIN (0.57, ***), IBIRA1 (0.81, ***), and IBIRA2 (0.83, ***).
The other correlations for all the months together did not present significant interference.
The monthly correlations varied considerably, reflecting the complexity of the interactions between environmental variables and tree growth.
3.6. Stem Growth Increment
Considering the entire study period the trees were measured by dendrometers, from 24 August 2021 to 15 October 2022, the radial stem growth were 1.2 mm and 3 mm, respectively, for IBIRA1 and IBIRA2, and for the tree PIN1 1.3 mm (Table 4).
Table 4.
Measured stem growth increment (mm), BAI—Basal Area Increment in mm2, all values per tree and also the average for each studied area, IBIRA and PIN. ±SD (Standard Deviation); period: 24 August 2021 to 15 October 2022.
In the same period studied, the basal area increment (BAI) for IBIRA1 and IBIRA2 was 1516.6 mm2 yr−1 and 4710 mm2 yr−1, and for PIN1 it was 2021.8 mm2 yr−1 (Table 4).
3.7. Biomass, C-Storage, and CO2 Removal
For tree PIN1, the initial values of total biomass and fixed CO2 were 463 kg of C and 1698 kg CO2, respectively; for IBIRA1, 347.7kg of C and 1274.80 kg CO2; and for IBIRA2, 521.1 kg of C and 1910.60 kg CO2 (Table 5).
Table 5.
Calculated total biomass increment (kg C) and total fixed CO2 increment (kg) along 418 days, based on the initial and final values; all values per tree and the average for each studied area: IBIRA and PIN. ±SD (Standard Deviation).
Considering the total biomass of the trees at the beginning of the study, and based on the rate of the total basal area increment (mm2/per tree) of each area, we could estimate that from 24 August 2021, to 15 October 2022, the growth corresponded to a biomass increment in PIN1 of 4.9 kg C yr−1; in IBIRA1, it was 4.2 kg C yr−1; and IBIRA2, 12.8 kg C yr−1. They fixed, in PIN1, 17.9 kg CO2 yr−1; in IBIRA1, 15.3 kg CO2 yr−1; and in IBIRA2, 47.1 kg CO2 yr−1 (Table 5).
4. Discussion
The Cenostigma pluviosum stem growth pattern displayed a sharp increase between spring and late summer and a dormancy phase from autumn, which included all the winter, and resumed its increase for the next springtime. Gheyret et al. [98] compared the growth pattern of evergreen and semi-deciduous forest trees in a Chinese subtropical environment, and for the semi-deciduous trees, the growth pattern was the same as we found for Cenostigma pluviosum, also a semi-deciduous species, while they found for evergreen trees a slightly longer growth period, until late autumn.
Even the tree planted on the Pinheiros’ sidewalk, which has a higher LAI value, crown projection area and crown diameter higher, showed a lower radial and basal stem growth rate, total biomass increment (kg C), and total fixed CO2 increment (kg CO2) in comparison to the IBIRA2 tree. During the period studied, tree stem growth was higher in IBIRA2, with permeable surroundings and consequently higher soil moisture (Table 5), which is related to their more intense metabolic activity. The IBIRA1 tree showed a lower radial and basal stem growth rate, total biomass increment (kg C), and total fixed CO2 increment (kg CO2) in comparison to PIN, very small difference between these two trees, although IBIRA1 showed lower values like DBH, CPA, and crown diameter.
Regarding site characteristics, such as the degree of soil sealing, the more sealed the surface, the less water is absorbed and the less photosynthesis occurs; consequently, less carbon (C) is produced for growth and metabolic functions. The explanation for this is the stomata closure, reducing transpiration rate and carbohydrate production. As a result, we have tree growth at the Pinheiros sidewalk being negatively affected. In this case, we could observe that the growth patterns of Cenostigma pluviosum were influenced by the soil surrounding environment. Both trees presented a significant difference between soil temperatures and volumetric water content, registered by the soil measurements’ mean value differences and presented by the VCW a significant and positive coefficient in the Spearman correlation.
The ST variable presented a more complex interference over the trees’ growth. First, because a lower temperature mean value was registered over all studied time at Ibirapuera Park than on the Pinheiros’ soil. This was expected because the park soil has more shade and humidity and receives less sun incidence. This inversion can be the reason the monthly Spearman correlation was negative during September 2021 (PIN1), October 2021 (all trees), January 2022 (all trees), February 2022 (PIN1), and March 2022 (all trees), indicating that the Spearman correlation presented a negative interference between stem growth and soil temperatures (ST) when the data were analyzed monthly.
Another aspect that may have influenced the ST correlation is the fact that stem growth does not have a constant rate; it fluctuates and has often been close to zero, or even negative, and these values may also have contributed to a negative correlation result.
The other microclimatic variables, such as AT, ARH, and P, also showed positive correlation, albeit lower, but their results could not be directly used to compare the differences in stem growth because the measurements were taken from a general meteorological station. These data were only included to present a general idea about how they influence the trees’ growth rate behavior.
For the trees’ basal area increment, the results are consistent with the few references found about trees of subtropical climate. Comparing the basal area growth of the three trees, PIN1, IBIRA1, and IBIRA2, 2021.8 mm2 yr−1, 1516.6 mm2 yr−1, and 4710.0 mm2 yr−1, respectively, were recorded in the period studied. The results of a more robust study carried out by Gheyret et al. [98] on trees in a forest environment in China found a relative annual basal increment ranging from 690 to 1940 mm2 yr−1 for the deciduous species and from 1870 to 3270 mm2 yr−1 for the evergreen species; these values are a relevant and comparable reference for the results we found.
Comparing the results we found with other studies related to average carbon storage per tree, the Sao Paulo city values are on the same level as the comparative results from Europe. The average of C sequestration by PIN1, IBIRA1 and IBIRA2 are, respectively, 468 kg C, 351 kg C, and 532 kg C; accordingly, Russo et al. [99] found an average of C storage per tree of 377 kg C, measured by allometric calculations with a sample of 468 trees in the city of Bolzano, Italy. The average C sequestration per year was also similar to the value found for IBIRA2; Russo et al. [99] presented the 12 Kg C yr−1 tree−1, and we found for PIN1, IBIRA1, and IBIRA2, 4.9 kg C yr−1 tree−1, 4.2 kg C yr−1 tree−1, and 12.8 kg C yr−1 tree−1, respectively.
The same comparison could be made to results from Beijing, China, with values of tree C storage presented as 130.62 kg C and for CO2 sequestration per year a result of 5.85 kg CO2 yr−1 from a study conducted in a forest environment [100], which is lower compared to the values found for PIN1, IBIRA1, and IBIRA2: 17.9 CO2 yr−1, 15.3 CO2 yr−1, and 47.1 CO2 yr−1, respectively.
Considering the differences in methodology, such as field measurement or modeling approach, tree species, tree age, and especially that the comparisons were made with other studies from temperate climates instead of subtropical ones, the results found in the present research were comparable in magnitude to those from Europe and China, and showed a higher CO2 sequestration rate, especially in the park situation (IBIRA). In a study on subtropical trees, with a longer growing period and more abundant heat and soil humidity, the results of higher growth rate values are equally expected [101,102,103].
There are some limitations to the current study, despite our efforts to accurately measure and quantify C storage and annual CO2 sequestration by individual urban trees. For example, the limited number of trees measured did not allow us to have a more significant sample size to analyze more meaningful results. The period of time analyzed—418 days—is long, but it only represents the microclimatic conditions of this period. With a more extended analysis in time and/or samples, it will be possible to better understand the growth pattern of Cenostigma pluviosum and other local urban tree species. To date, there are few studies related to this topic concerning trees in Brazil, or even Latin America, that could be used to improve the discussion of the results.
Further research is needed, especially on subtropical trees commonly planted in Brazilian cities, to closely monitor their growth and develop a more sophisticated allometric growth model for these trees. Such data and models can help us better understand how urban trees affect urban carbon balances and carbon cycling and guide further plans for urban forests in Sao Paulo city.
5. Conclusions
This makes it possible to indicate that for better tree performance, an urban forest plan should provide for planting on permeable surfaces so that CO2 sequestration and C storage are maximized wherever possible. Where this is not possible, nor is the use of permeable pavements, tree planting on sidewalks should be performed by planting boxes underground, with large and adequate dimensions, as suggested by the municipality’s technical literature.
São Paulo city, densely urbanized and heavily populated, is subject to the effects of UHI [34] and is also susceptible to the implications of climate change, such as higher air temperatures, increase in intense precipitation, and more flooding events [104]. It is a city with numerous neighborhoods still lacking green areas and street trees, which makes it even more necessary to expand the vision of the role of trees in regulating these climate risks.
Author Contributions
Conceptualization, J.R.-L. and T.R.; methodology, J.R.-L., A.M.-R. and T.R.; software, J.R.-L.; validation, J.R.-L. and A.M.-R.; formal analysis, J.R.-L.; investigation, J.R.-L.; resources, J.R.-L.; data curation, J.R.-L.; writing—original draft preparation, J.R.-L.; writing—review and editing, D.D., T.R. and A.M.-R.; visualization, J.R.-L.; supervision, D.D. and T.R.; project administration, J.R.-L.; funding acquisition, J.R.-L. and D.D. All authors have read and agreed to the published version of the manuscript.
Funding
This research was funded by FAPESP, grant process numbers 2018/20078-8 and 2019/16972-8.
Data Availability Statement
Data are contained within the article.
Acknowledgments
The authors sincerely thank the Laboratory of Comfort and Energy Studies (LABAUT/FAU-USP), the University of Sao Paulo, and the chair of Forests at the School of Life Sciences Weihenstephan—Technical University of Munich (TUM) for academic assistance. Our special thanks to SABESP for all the technical support allowing this study to be developed in its garden safely. We thank URBIA and CIP Gears company for all LABTrees installation assistence, the Institute of Energy and Environment of the University of São Paulo IEE-USP and the “Flood Alert System of São Paulo”-SAISP /FCTH for the provision of meteorological data, the Centre of Applied Statistics (CEA/IME-USP) for statistical consultancy, the forestry engineer José Walter Figueiredo and the Green and Blue Municipality Project (SIMA) for institutional support. We thank the reviewers for their valuable comments which help to improve the quality of the manuscript.
Conflicts of Interest
The authors declare no conflicts of interest.
References
- Shukla, P.R.; Skea, J.; Slade, R.; Al Khourdajie, A.; van Diemen, R.; McCollum, D.; Pathak, M.; Some, S.; Vyas, P.; Fradera, R.; et al. (Eds.) Intergovernmental Panel on Climate Change—IPCC, 2022: Climate Change 2022: Mitigation of Climate Change. Contribution of Working Group III to the Sixth Assessment Report of the Intergovernmental Panel on Climate Change; Cambridge University Press: Cambridge, UK; New York, NY, USA, 2022. [Google Scholar]
- Lwasa, S.; Seto, K.C.; Bai, X.; Blanco, H.; Gurney, K.R.; Kılkış, Ş.; Lucon, O.; Murakami, J.; Pan, J.; Sharifi, A.; et al. Chapter 8: Urban systems and other settlements. In IPCC, 2022: Climate Change 2022: Mitigation of Climate Change. Contribution of Working Group III to the Sixth Assessment Report of the Intergovernmental Panel on Climate Change; Shukla, P.R., Skea, J., Slade, R., Al Khourdajie, A., van Diemen, R., McCollum, D., Pathak, M., Some, S., Vyas, P., Fradera, R., et al., Eds.; Cambridge University Press: Cambridge, UK; New York, NY, USA, 2022; pp. 861–952. [Google Scholar]
- Costanza, R.; d’Arge, R.; De Groot, R.; Farber, S.; Grasso, M.; Hannon, B.; Limburg, K.; Naeem, S.; O’neill, R.V.; Paruelo, J.; et al. The value of the world’s ecosystem services and natural capital. Nature 1997, 387, 253–260. [Google Scholar] [CrossRef]
- Barbier, E.B.; Baumgärtner, S.; Chopra, K.; Costello, C.; Duraiappah, A.; Hassan, R.; Kinzig, A.; Lehman, M.; Pascual, U.; Polasky, S.; et al. The valuation of ecosystem services. In Biodiversity, Ecosystem Functioning, and Human Wellbeing. An Ecological and Economic Perspective; Naeem, S., Bunker, D., Hector, A., Loreau, M., Perrings, C., Eds.; Oxford University Press: New York, NY, USA, 2009; pp. 248–262. [Google Scholar]
- Sukhdev, P.; Wittmer, H.; Miller, D. The economics of ecosystems and biodiversity (TEEB): Challenges and responses. In Nature in the Balance: The Economics of Biodiversity; Helmer, D., Hepburn, C., Eds.; Oxford University Press: New York, NY, USA, 2014; pp. 135–152. [Google Scholar]
- Millennium Ecosystem Assessment (MEA). Ecosystems and Human Well-Being: Synthesis; Island Press: Washington, DC, USA, 2005. [Google Scholar]
- Haines-Young, R.; Potschin-Young, M. Revision of the Common International Classification for Ecosystem Services (CICES V5.1): A Policy Brief. One Ecosyst. 2018, 3, e27108. [Google Scholar] [CrossRef]
- Haase, D.; Larondelle, N.; Andersson, E.; Artmann, M.; Borgström, S.; Breuste, J.; Gomez-Baggethun, E.; Gren, Å.; Hamstead, Z.; Hansen, R.; et al. A Quantitative Review of Urban Ecosystem Service Assessments: Concepts, Models, and Implementation. AMBIO 2014, 43, 413–433. [Google Scholar] [CrossRef]
- Barona, C.O.; Devisscher, T.; Dobbs, C.; Aguilar, L.O.; Baptista, M.D.; Navarro, N.M.; da Silva Filho, D.F.; Escobedo, F.J. Trends in urban forestry research in Latin America & the Caribbean: A systematic literature review and synthesis. Urban For. Urban Green. 2020, 47, 126544. [Google Scholar]
- Dobbs, C.; Hernández-Moreno, Á.; Reyes-Paecke, S.; Miranda, M.D. Exploring temporal dynamics of urban ecosystem services in Latin America: The case of Bogota (Colombia) and Santiago (Chile). Ecol. Indic. 2018, 85, 1068–1080. [Google Scholar] [CrossRef]
- Maragno, D.; Gaglio, M.; Robbi, M.; Appiotti, F.; Fano, E.A.; Gissi, E. Fine-scale analysis of urban flooding reduction from green infrastructure: An ecosystem services approach for the management of water flows. Ecol. Model. 2018, 386, 1–10. [Google Scholar] [CrossRef]
- Su, M.; Zheng, Y.; Hao, Y.; Chen, Q.; Chen, S.; Chen, Z.; Xie, H. The influence of landscape pattern on the risk of urban water-logging and flood disaster. Ecol. Indic. 2018, 92, 133–140. [Google Scholar] [CrossRef]
- Nowak, D.J.; Greenfield, E.J. The increase of impervious cover and decrease of tree cover within urban areas globally (2012–2017). Urban For. Urban Green. 2020, 49, 126638. [Google Scholar] [CrossRef]
- Trlica, A.; Hutyra, L.R.; Morreale, L.L.; Smith, I.A.; Reinmann, A.B. Current and future biomass carbon uptake in Boston’s urban forest. Sci. Total Environ. 2020, 709, 136196. [Google Scholar] [CrossRef]
- Boukili, V.K.; Bebber, D.P.; Mortimer, T.; Venicx, G.; Lefcourt, D.; Chandler, M.; Eisenberg, C. Assessing the performance of urban forest carbon sequestration models using direct measurements of tree growth. Urban For. Urban Green. 2017, 24, 212–221. [Google Scholar] [CrossRef]
- Shashua-Bar, L.; Pearlmutter, D.; Erell, E. The influence of trees and grass on outdoor thermal comfort in a hot-arid environment. Int. J. Climatol. 2011, 31, 1498–1506. [Google Scholar] [CrossRef]
- Gill, S.E.; Rahman, M.A.; Handley, J.F.; Ennos, A.R. Modelling water stress to urban amenity grass in Manchester UK under climate change and its potential impacts in reducing urban cooling. Urban For. Urban Green. 2013, 12, 350–358. [Google Scholar] [CrossRef]
- Zhang, Z.; Lv, Y.; Pan, H. Cooling and humidifying effect of plant communities in subtropical urban parks. Urban For. Urban Green. 2013, 12, 323–329. [Google Scholar] [CrossRef]
- Offerle, B.; Grimmond, C.S.; Fortuniak, K.; Kłysik, K.; Oke, T.R. Temporal variations in heat fluxes over a central European city centre. Theor. Appl. Climatol. 2006, 84, 103–115. [Google Scholar] [CrossRef]
- Gill, S.E.; Handley, J.F.; Ennos, A.R.; Pauleit, S. Adapting cities for climate change: The role of the green infrastructure. Built Environ. 2007, 33, 115–133. [Google Scholar] [CrossRef]
- Loridan, T.; Grimmond, C.S.B. Characterization of energy flux partitioning in urban environments: Links with surface seasonal properties. J. Appl. Meteorol. Climatol. 2012, 51, 219–241. [Google Scholar] [CrossRef]
- Oke, T.R.; Mills, G.; Christen, A.; Voogt, J.A. Urban Climates; Cambridge University Press: Cambridge, UK, 2017. [Google Scholar]
- Kong, L.; Lau, K.K.L.; Yuan, C.; Chen, Y.; Xu, Y.; Ren, C.; Ng, E. Regulation of outdoor thermal comfort by trees in Hong Kong. Sustain. Cities Soc. 2017, 31, 12–25. [Google Scholar] [CrossRef]
- Coutts, A. Green infrastructure for cities It’s all about trees! Urban Clim. News Int. Assoc. Urban Clim. 2015, 97, 7–12. [Google Scholar]
- de Coninck, H.; Revi, A.; Babiker, M.; Bertoldi, P.; Buckeridge, M.; Cartwright, A.; Dong, W.; Ford, J.; Fuss, S.; Hourcade, J.C.; et al. Chapter 4: Strengthening and Implementing the Global Response. In Global Warming of 1.5 °C an IPCC Special Report on the Impacts of Global Warming of 1.5 °C above Pre-Industrial Levels and Related Global Greenhouse Gas Emission Pathways, in the Context of Strengthening the Global Response to the Threat of Climate Change; Intergovernmental Panel on Climate Change: Geneva, Switzerland, 2018; pp. 313–443. [Google Scholar]
- Duarte, D.H.; Shinzato, P.; dos Santos Gusson, C.; Alves, C.A. The impact of vegetation on urban microclimate to counterbalance built density in a subtropical changing climate. Urban Clim. 2015, 14, 224–239. [Google Scholar] [CrossRef]
- Shashua-Bar, L.; Potchter, O.; Bitan, A.; Boltansky, D.; Yaakov, Y. Microclimate modelling of street tree species effects within the varied urban morphology in the Mediterranean city of Tel Aviv, Israel. Int. J. Climatol. 2010, 30, 44–57. [Google Scholar] [CrossRef]
- Grimmond, S.U.E. Urbanization and global environmental change: Local effects of urban warming. Geogr. J. 2007, 173, 83–88. [Google Scholar] [CrossRef]
- Romero-Duque, L.P.; Trilleras, J.M.; Castellarini, F.; Quijas, S. Ecosystem services in urban ecological infrastructure of Latin America and the Caribbean: How do they contribute to urban planning? Sci. Total Environ. 2020, 728, 138780. [Google Scholar] [CrossRef]
- Rötzer, T.; Rahman, M.A.; Moser-Reischl, A.; Pauleit, S.; Pretzsch, H. Process based simulation of tree growth and ecosystem services of urban trees under present and future climate conditions. Sci. Total Environ. 2019, 676, 651–664. [Google Scholar] [CrossRef] [PubMed]
- Livesley, S.J.; McPherson, E.G.; Calfapietra, C. The urban forest and ecosystem services: Impacts on urban water, heat, and pollution cycles at the tree, street, and city scale. J. Environ. Qual. 2016, 45, 119–124. [Google Scholar] [CrossRef] [PubMed]
- Pretzsch, H.; Moser-Reischl, A.; Rahman, M.A.; Pauleit, S.; Rötzer, T. Towards sustainable management of the stock and ecosystem services of urban trees. From theory to model and application. Trees 2023, 37, 177–196. [Google Scholar] [CrossRef]
- Song, P.; Kim, G.; Mayer, A.; He, R.; Tian, G. Assessing the ecosystem services of various types of urban green spaces based on i-Tree Eco. Sustainability 2020, 12, 1630. [Google Scholar] [CrossRef]
- Wu, R.; Na Wu, X.N.; Hai, Y.; Ke, W.; Tingting, M.; Juan, S.; Zhiyi, B. Effects of the Bamboo Communities on Microclimate and Thermal Comfort in Subtropical Climates. Forests 2023, 14, 1231. [Google Scholar] [CrossRef]
- Borowski, P.F.; Iaroslav, P.K.; Erick, R.B. Innovative Industrial Use of Bamboo as Key “Green” Material. Sustainability 2022, 14, 1955. [Google Scholar] [CrossRef]
- Umezaki, A.S.; Ribeiro, F.N.D.; de Oliveira, A.P.; Soares, J.; de Miranda, R.M. Numerical characterization of spatial and temporal evolution of summer urban heat island intensity in São Paulo, Brazil. Urban Clim. 2020, 32, 100615. [Google Scholar] [CrossRef]
- Oliveira, A.P.; Marques Filho, E.P.; Ferreira, M.J.; Codato, G.; Ribeiro, F.N.D.; Landulfo, E.; Moreira, G.A.; Pereira, M.M.R.; Mlakar, P.; Boznar, M.Z.; et al. Assessing urban effects on the climate of metropolitan regions of Brazil—Preliminary results of the MCITY BRAZIL project. Explor. Environ. Sci. Res. 2020, 1, 38–77. [Google Scholar] [CrossRef]
- Ferreira, M.J.; de Oliveira, A.P.; Soares, J.; Codato, G.; Bárbaro, E.W.; Escobedo, J.F. Radiation balance at the surface in the city of São Paulo, Brazil: Diurnal and seasonal variations. Theor. Appl. Climatol. 2012, 10, 229–246. [Google Scholar] [CrossRef]
- Marengo, J.A.; Ambrizzi, T.; Barreto, N.; Cunha, A.P.; Ramos, A.M.; Skansi, M.; Molina Carpio, J.; Salinas, R. The heat wave of October 2020 in central South America. Int. J. Climatol. 2022, 42, 2281–2298. [Google Scholar] [CrossRef]
- UNEP-WCMC; UN Environment Programme World Conservation Monitoring Centre. The State of Biodiversity in Latin America and the Caribbean: A Mid-Term Review of Progress towards the Aichi Biodiversity Targets; UNEP-WCMC: Cambridge, UK, 2016; 114p. [Google Scholar]
- Leite, J.R.; Pellegrino, P.R.M.; Modesto, A.A.L. Avaliação temporal do crescimento da mancha urbana no setor oeste da reserva da biosfera do cinturão verde (RBCV). Rev. Soc. Bras. Arborização Urbana 2012, 7, 37–52. [Google Scholar]
- Castellanos, E.J.; Lemos, M.F.; Astigarraga, L.; Chacón, N.; Cuvi, N.; Huggel, C.; Miranda Sara, L.R.; Moncassim Vale, M.; Ometto, J.P.; Peri, P.L.; et al. Central and South America. In Climate Change 2022: Impacts, Adaptation and Vulnerability. Contribution of Working Group II to the Sixth Assessment Report of the Intergovernmental Panel on Climate Change; Pörtner, H.O., Roberts, D.C., Tignor, M., Poloczanska, E.S., Mintenbeck, K., Alegría, A., Craig, M., Langsdorf, S., Löschke, S., Möller, V., et al., Eds.; Cambridge University Press: Cambridge, UK; New York, NY, USA, 2022; pp. 1689–1816. [Google Scholar] [CrossRef]
- SEEG—Sistema de Estimativas de Emissões e Remoções de Gases de Efeito Estufa; Observatório do Clima. Análise das Emissões de Suas Implicações para as Metas Climáticas do Brasil 1970–2021. Available online: https://www.oc.eco.br/wp-content/uploads/2023/03/SEEG-10-anos-v4.pdf (accessed on 10 November 2022).
- Satterthwaite, D. Cities’ contribution to global warming: Notes on the allocation of greenhouse gas emissions. Environ. Urban. 2008, 20, 539–549. [Google Scholar] [CrossRef]
- Sánchez-Ccoyllo, O.R.; Ynoue, R.Y.; Martins, L.D.; Astolfo, R.; Miranda, R.M.; Freitas, E.D.; Borges, A.S.; Fornaro, A.; Freitas, H.; Moreira, A.; et al. Vehicular particulate matter emissions in road tunnels in Sao Paulo, Brazil. Environ. Monit. Assess. 2009, 149, 241–249. [Google Scholar] [CrossRef] [PubMed]
- Costa, E.; Seixas, J.; Baptista, P.; Costa, G.; Turrentine, T. CO2 emissions and mitigation policies for urban road transportation: Sao Paulo versus Shanghai. Urbe Rev. Bras. Gestão Urbana 2018, 10, 143–158. [Google Scholar] [CrossRef]
- Grimmond, C.S.B.; King, T.S.; Cropley, F.D.; Nowak, D.J.; Souch, C. Local-scale fluxes of carbon dioxide in urban environments: Methodological challenges and results from Chicago. Environ. Pollut. 2002, 116, 243–254. [Google Scholar] [CrossRef] [PubMed]
- Escobedo, F.; Varela, S.; Zhao, M.; Wagner, J.E.; Zipperer, W. Analyzing the efficacy of subtropical urban forests in offsetting carbon emissions from cities. Environ. Sci. Policy 2010, 13, 362–372. [Google Scholar] [CrossRef]
- Weissert, L.F.; Salmond, J.A.; Schwendenmann, L. A review of the current progress in quantifying the potential of urban forests to mitigate urban CO2 emissions. Urban Clim. 2014, 8, 100–125. [Google Scholar] [CrossRef]
- Nowak, D.J.; Greenfield, E.J.; Hoehn, R.E.; Lapoint, E. Carbon storage and sequestration by trees in urban and community areas of the United States. Environ. Pollut. 2013, 178, 229–236. [Google Scholar] [CrossRef]
- Zhao, M.; Kong, Z.H.; Escobedo, F.J.; Gao, J. Impacts of urban forests on offsetting carbon emissions from industrial energy use in Hangzhou, China. J. Environ. Manag. 2010, 91, 807–813. [Google Scholar] [CrossRef] [PubMed]
- López-López, S.F.; Martínez-Trinidad, T.; Benavides-Meza, H.M.; García-Nieto, M.; Ángeles-Pérez, G. Reservorios de biomasa y carbono en el arbolado de la primera sección del Bosque de Chapultepec, Ciudad de México. Madera Bosques 2018, 24, e2431620. [Google Scholar] [CrossRef]
- Rubiano, K. Distribución de la infraestructura verde y su capacidad de regulación térmica en Bogotá, Colombia. Colomb. For. 2019, 22, 83–100. [Google Scholar] [CrossRef]
- Núñez-Florez, R.; Pérez-Gómez, U.; Fernández-Méndez, F. Functional diversity criteria for selecting urban trees. Urban For. Urban Green. 2019, 38, 251–266. [Google Scholar] [CrossRef]
- Mariano, M.V.; Almeida, C.M.V.B.D.; Bonilla, S.H.; Agostinho, F.; Giannetti, B.F. Avaliação em emergia como ferramenta de gestão nos parques urbanos de São Paulo. Gestão Produção 2015, 22, 443–458. [Google Scholar] [CrossRef]
- Dobbs, C.; Nitschke, C.; Kendal, D. Assessing the drivers shaping global patterns of urban vegetation landscape structure. Sci. Total Environ. 2017, 592, 171–177. [Google Scholar] [CrossRef]
- Carretero, E.M.; Moreno, G.; Duplancic, A.; Abud, A.; Vento, B.; Jauregui, J.A. Urban Forest of Mendoza (Argentina): The role of Morus alba (Moraceae) in carbon storage. Carbon Manag. 2017, 8, 237–244. [Google Scholar] [CrossRef]
- Reynolds, C.C.; Escobedo, F.J.; Clerici, N.; Zea-Camaño, J. Does “greening” of neotropical cities considerably mitigate carbon dioxide emissions? The case of Medellin, Colombia. Sustainability 2017, 9, 785. [Google Scholar] [CrossRef]
- Lüttge, U.; Buckeridge, M. Trees: Structure and function and the challenges of urbanization. Trees 2020, 37, 9–16. [Google Scholar] [CrossRef]
- Clark, J.R.; Kjelgren, R. Water as a limiting factor in the development of urban trees. J. Arboric. 1990, 16, 203–208. [Google Scholar] [CrossRef]
- Morgenroth, J.; Buchan, G.D. Soil moisture and aeration beneath pervious and impervious pavements. Arboric. Urban For. 2009, 35, 135–141. [Google Scholar] [CrossRef]
- Day, S.D.; Dove, J.E.; Bartens, J.; Harris, J.R. Stormwater management that combines paved surfaces and urban trees. In GeoCongress 2008: Geosustainability and Geohazard Mitigation, Proceedings of GeoCongress 2008, New Orleans, LA, USA, 9–12 March 2008; American Society of Civil Engineers: Reston, VA, USA, 2008; pp. 1129–1136. [Google Scholar]
- Bartens, J.; Day, S.D.; Harris, J.R.; Dove, J.E.; Wynn, T.M. Can urban tree roots improve infiltration through compacted subsoils for stormwater management? J. Environ. Qual. 2008, 37, 2048–2057. [Google Scholar] [CrossRef] [PubMed]
- Armson, D.; Rahman, M.A.; Ennos, A.R. A comparison of the shading effectiveness of five different street tree species in Manchester, UK. Arboric. Urban For. 2013, 39, 157–164. [Google Scholar] [CrossRef]
- Moser, A.; Rötzer, T.; Pauleit, S.; Pretzsch, H. Structure and ecosystem services of small-leaved lime (Tilia cordata Mill.) and black locust (Robinia pseudoacacia L.) in urban environments. Urban For. Urban Green. 2015, 14, 1110–1121. [Google Scholar] [CrossRef]
- Moser, A.; Rahman, M.A.; Pretzsch, H.; Pauleit, S.; Rötzer, T. Inter-and intraannual growth patterns of urban small-leaved lime (Tilia cordata mill.) at two public squares with contrasting microclimatic conditions. Int. J. Biometeorol. 2017, 61, 1095–1107. [Google Scholar] [CrossRef] [PubMed]
- Way, D.A.; Oren, R. Differential responses to changes in growth temperature between trees from different functional groups and biomes: A review and synthesis of data. Tree Physiol. 2010, 30, 669–688. [Google Scholar] [CrossRef] [PubMed]
- Yoon, T.K.; Park, C.W.; Lee, S.J.; Ko, S.; Kim, K.N.; Son, Y.; Lee, K.H.; Oh, S.; Lee, W.K.; Son, Y. Allometric equations for estimating the aboveground volume of five common urban street tree species in Daegu, Korea. Urban For. Urban Green. 2013, 12, 344–349. [Google Scholar] [CrossRef]
- Chojnacky, D.C.; Heath, L.S.; Jenkins, J.C. Updated generalized biomass equations for North American tree species. Forestry 2014, 87, 129–151. [Google Scholar] [CrossRef]
- Farias, A.R.; Mingoti, R.; Lalle, L.D.; Spadotto, C.A.; Lovisi Filho, E. Identificação, Mapeamento e Quantificação das Áreas Urbanas do Brasil. 2017. Available online: http://www.infoteca.cnptia.embrapa.br/infoteca/handle/doc/1069928 (accessed on 26 October 2022).
- IBGE—Instituto Brasileiro de Geografia e Estatística. Dados do Censo. 2010. Available online: http://www.censo2010.ibge.gov.br/ (accessed on 12 September 2022).
- IBGE—Instituto Brasileiro de Geografia e Estatística. Dados do Censo. 2022. Available online: https://www.ibge.gov.br/estatisticas/sociais/populacao/9103-estimativas-de-populacao.html?=&t=resultados (accessed on 15 January 2023).
- Alvares, C.A.; Stape, J.L.; Sentelhas, P.C.; Gonçalves, J.D.M.; Sparovek, G. Köppen’s climate classification map for Brazil. Meteorol. Z. 2013, 22, 711–728. [Google Scholar] [CrossRef]
- Laboratory of Photovoltaic Systems (LSF); Institute of Energy and Environment of the University of São Paulo (IEE-USP). 2022. Available online: https://lsf.iee.usp.br/ (accessed on 15 January 2023).
- Ribeiro, F.N.; de Oliveira, A.P.; Soares, J.; de Miranda, R.M.; Barlage, M.; Chen, F. Effect of sea breeze propagation on the urban boundary layer of the metropolitan region of Sao Paulo, Brazil. Atmos. Res. 2018, 214, 174–188. [Google Scholar] [CrossRef]
- Oliveira, A.P.; Bornstein, R.D.; Soares, J. Annual and diurnal wind patterns in the city of São Paulo. Water Air Soil Pollut. Focus 2003, 3, 3–15. [Google Scholar] [CrossRef]
- Gagnon, E.; Bruneau, A.; Hughes, C.E.; de Queiroz, L.P.; Lewis, G.P. A new generic system for the pantropical Caesalpinia group (Leguminosae). PhytoKeys 2016, 71, 1–160. [Google Scholar] [CrossRef]
- Lorenzi, H. Árvores Brasileiras: Manual de Identificação e Cultivo de Plantas Arbóreas Nativas do Brasil, 7th ed.; Instituto Plantarum de Estudos da Flora: São Paulo, Brazil, 2016. [Google Scholar]
- Silva, L.F.; Lima, A.M.L.P.; Filho, D.F.S.; Couto, H.T.Z. Interceptação da chuva pelas copas das espécies de Caesalpinia pluviosa DC. (Sibipiruna) e Tipuana tipu O. Kuntze (Tipuana) em arborização urbana. Sci. For. 2008, 36, 307–315. [Google Scholar]
- Lima, M.W.; Trivilato, R.A.; Bezerra, I.M.; Morais, M.J.; Paixão, A.P.; Melo, L.E.; Basto, V.D.; Klingenberg, D.; Nolasco, A.M.; Dias Júnior, A.F.; et al. Propriedades tecnológicas de sete espécies provenientes da arborização urbana. Eng. Ind. Madeireira Tecnol. Pesqui. Tendências 2020, 31, 305–316. [Google Scholar]
- Guimarães, J.L.; Hüther, C.M.; Almeida, R.D.B.D.; Nogueira, L.T.; Carvalho, L.F.D.; Borella, J.; Machado, T.D.B.; Pereira, C.R. The specific leaf area of forest species subjected to different degrees of shading did not differ when detached and full leaflets were compared. Semin. Ciências Agrárias 2020, 41, 1837–1848. [Google Scholar] [CrossRef]
- Rahman, M.A.; Moser, A.; Rötzer, T.; Paulett, S. Microclimate differences and their influence on transpirational cooling of Tilia cordata in two contrasting street canyons in Munich, Germany. Agric. For. Meteorol. 2017, 232, 443–456. [Google Scholar] [CrossRef]
- McPherson, E.G.; Nowak, D.J.; Rowntree, R.A. Chicago’s Urban Forest Ecosystem: Results of the Chicago Urban Forest Climate Project; Forest Service General Technical Report (Final); Northeastern Forest Experiment Station: Radnor, PA, USA, 1994. [Google Scholar]
- McHale, M.R.; Burke, I.C.; Lefsky, M.A.; Peper, P.J.; McPherson, E.G. Urban forest biomass estimates: Is it important to use allometric relationships developed specifically for urban trees? Urban Ecosyst. 2009, 12, 95–113. [Google Scholar] [CrossRef]
- McPherson, E.G.; Nowak, D.; Heisler, G.; Grimmond, S.; Souch, C.; Grant, R.; Rowntree, R. Quantifying urban forest structure, function, and value: The Chicago Urban Forest Climate Project. Urban Ecosyst. 1997, 1, 49–61. [Google Scholar] [CrossRef]
- Nowak, D.J.; Crane, D.E. Carbon storage and sequestration by urban trees in the USA. Environ. Pollut. 2002, 116, 381–389. [Google Scholar] [CrossRef]
- Aguaron, E.; McPherson, E.G. Comparison of methods for estimating carbon dioxide storage by Sacramento’s urban forest. In Carbon Sequestration in Urban Ecosystems; Lal, R., Augustin, B., Eds.; Springer: Dordrecht, The Netherlands, 2012; pp. 43–71. [Google Scholar]
- Pretzsch, H.; Dauber, E.; Biber, P. Species-specific and ontogeny-related stem allometry of European forest trees: Evidence from extensive stem analyses. For. Sci. 2013, 59, 290–302. [Google Scholar] [CrossRef]
- Hydraulic Technology Center Foundation (FCTH). Alto Tietê Telemetry Network; Flooding Alert System of São Paulo (SAISP): São Paulo, Brazil, 2022. [Google Scholar]
- Wang, Z.; Yang, B.; Deslauriers, A.; Braeuning, A. Intra-annual stem radial increment response of Qilian juniper to temperature and precipitation along an altitudinal gradient in northwestern China. Trees-Struct. Funct. 2015, 29, 25–34. [Google Scholar] [CrossRef]
- Mäkinen, H.; Seo, J.W.; Nöjd, P.; Schmitt, U.; Jalkanen, R. Seasonal dynamics of wood formation: A comparison between pinning, micro coring and dendrometer measurements. Eur. J. For. Res. 2008, 127, 235–245. [Google Scholar] [CrossRef]
- Drew, D.M.; Downes, G.M. The use of precision dendrometers in research on daily stem size and wood property variation: A review. Dendrochronologia 2009, 27, 159–172. [Google Scholar] [CrossRef]
- Muggeo, V.M.R. Estimating regression models with unknown break-points. Stat. Med. 2003, 22, 3055–3071. [Google Scholar] [CrossRef]
- Muggeo, V.M.R. Regression Models with Break-Points/Change-Points Estimation (with Possibly Random Effects), R Package version 2.1-0; R Foundation for Statistical Computing: Vienna, Austria, 2008; pp. 1–6. Available online: https://cran.r-project.org/package=segmented (accessed on 15 January 2023).
- Forrester, D.I.; Tachauer, I.H.H.; Annighoefer, P.; Barbeito, I.; Pretzsch, H.; Ruiz-Peinado, R.; Stark, H.; Vacchiano, G.; Zlatanov, T.; Chakraborty, T.; et al. Generalized biomass and leaf area allometric equations for European tree species incorporating stand structure, tree age and climate. For. Ecol. Manag. 2017, 396, 160–175. [Google Scholar] [CrossRef]
- Cairns, M.A.; Brown, S.; Helmer, E.H.; Baumgardner, G.A. Root biomass allocation in the world’s upland forests. Oecologia 1997, 111, 1–11. [Google Scholar] [CrossRef]
- R Core Team. R. A Language and Environment for Statistical Computing; R Foundation for Statistical Computing: Vienna, Austria, 2020; Available online: https://www.R-project.org/ (accessed on 10 June 2021).
- Gheyret, G.; Zhang, H.T.; Guo, Y.; Liu, T.Y.; Bai, Y.H.; Li, S.; Schmid, B.; Bruelheide, H.; Ma, K.; Tang, Z. Radial growth response of trees to seasonal soil humidity in a subtropical forest. Basic Appl. Ecol. 2021, 55, 74–86. [Google Scholar] [CrossRef]
- Russo, A.; Escobedo, F.J.; Timilsina, N.; Schmitt, A.O.; Varela, S.; Zerbe, S. Assessing urban tree carbon storage and sequestration in Bolzano, Italy. Int. J. Biodivers. Sci. Ecosyst. Serv. Manag. 2014, 10, 54–70. [Google Scholar] [CrossRef]
- Tang, Y.; Chen, A.; Zhao, S. Carbon storage and sequestration of urban street trees in Beijing, China. Front. Ecol. Evol. 2016, 4, 53. [Google Scholar] [CrossRef]
- Mullaney, J.; Lucke, T.; Trueman, S.J. The effect of permeable pavements with an underlying base layer on the growth and nutrient status of urban trees. Urban For. Urban Green. 2015, 14, 19–29. [Google Scholar] [CrossRef]
- Mullaney, J.; Lucke, T.; Trueman, S.J.; Hosseini Bai, S. The growth and health of street trees planted in permeable pavements. Acta Hortic. 2016, 1108, 77–82. [Google Scholar] [CrossRef]
- de la Mota Daniel, F.J.; Day, S.D.; Owen Jr, J.S.; Stewart, R.D.; Steele, M.K.; Sridhar, V. Porous-permeable pavements promote growth and establishment and modify root depth distribution of Platanus × acerifolia (Aiton) Willd. in simulated urban tree pits. Urban For. Urban Green. 2018, 33, 27–36. [Google Scholar] [CrossRef]
- Vemado, F.; Pereira Filho, A.J. Severe weather caused by heat island and sea breeze effects in the metropolitan area of São Paulo, Brazil. Adv. Meteorol. 2016, 2016, 8364134. [Google Scholar] [CrossRef]


Disclaimer/Publisher’s Note: The statements, opinions and data contained in all publications are solely those of the individual author(s) and contributor(s) and not of MDPI and/or the editor(s). MDPI and/or the editor(s) disclaim responsibility for any injury to people or property resulting from any ideas, methods, instructions or products referred to in the content. |
© 2024 by the authors. Licensee MDPI, Basel, Switzerland. This article is an open access article distributed under the terms and conditions of the Creative Commons Attribution (CC BY) license (https://creativecommons.org/licenses/by/4.0/).