Abstract
Droughts can affect forest ecosystems and lead to soil degradation, biodiversity loss, and desertification. Not all regions of Mexico are affected in the same way, as some areas are naturally more prone to drought due to their geographical location. Therefore, the objective of this work was to carry out a spatio-temporal analysis of the occurrence of droughts (severe and extreme) in Mexican forest systems, covering the period 2000–2021, and to study the area covered by these events in Mexican forest systems. This analysis was divided into three stages: the classification of land use and vegetation, spatial mapping and the classification of drought intensity, and an analysis of drought frequency and probability in forest systems. The results show that more than 46% of Mexico’s forest area experienced severe and extreme droughts during the 21-year period studied. Broadleaved forests were most affected by severe and extreme droughts, with a frequency of 6 years. The increasing frequency of droughts poses a major challenge to the resilience of forest ecosystems in Mexico, highlighting the need to implement climate change adaptation and forest management measures to protect the country’s biodiversity and natural resources.
1. Introduction
Drought can have devastating effects. Drought, a global problem exacerbated by climate change and anthropogenic factors, has far-reaching effects on various aspects of society [1,2]. It affects environmental components such as soil processes, vegetation growth, and aquatic ecosystems, leading to water scarcity and stress for one third of the world’s population [3]. The health impacts of drought are significant, threatening physical, mental, and social well-being, particularly in regions such as Iran where poor water resource management exacerbates the effects [4]. Economically, droughts reduce per capita GDP growth by 0.39 to 0.85 percentage points, with low- and middle-income countries in drylands experiencing the greatest losses, highlighting the need for adaptation investments and changes in water management practices [5,6]. Drought can lead to economic losses affecting agriculture and other sectors, with the magnitude of the impact depending on water allocation policies [7].
Understanding the multiple impacts of drought is crucial for effective mitigation and preparedness measures worldwide [8]. Therefore, some researchers have analysed different methods for quantifying drought and its potential impacts.
Globally, droughts have reduced global crop production by about 10% [9]. In regions such as the Loess Plateau and the Qinling Mountains in China, the resilience of vegetation is gradually decreasing, and productivity takes longer to recover than canopy structure [10]. In addition, the sensitivity of global vegetation productivity to drought has increased over time [11].
Historical droughts such as the European drought of 1540 and the US Dust Bowl of the 1930s illustrate the severity of such events in Europe and North America [12]. The extreme drought of 1842 affected a broad zonal belt from France to eastern central Europe, resulting in significant agricultural, hydrological, and socio-economic impacts [13]. An analysis of severe droughts from 1970 to 2020 shows that Eastern Europe, western Russia, and North America have experienced extreme droughts associated with specific atmospheric conditions and circulation patterns [14]. South Korea has identified periods of extreme drought, the most severe of which occurred from 2014 to 2016 [15].
Internationally, several methods are commonly used to quantify drought. These methods include the Standardised Precipitation Index (SPI) [16], the Standardised Precipitation Evapotranspiration Index (SPEI) [17], the Palmer Drought Severity Index (PDSI) [18], the Keetch–Byram Drought Index (KBDI) [19], the Standardised Aridity Index (SAI) [20], and the Effective Drought Index (EDI) [21]. The use of composite hydrometeorological indices such as JDHMI-CCA, JDHMI-PCA, and JDHMI-Copula, which incorporate canonical correlation analysis, principal component analysis, and copula-based methods, has been explored to provide a more comprehensive assessment of drought conditions [22]. While the SPEI is particularly useful for characterising drought in agricultural settings [23,24], the SPI remains widely accepted due to its simplicity and reliance on precipitation data only [25,26].
In Mexico, significant efforts have been made in recent years to understand the impact of drought on the agricultural sector using the SPI. These studies have analysed various aspects such as the reduction in maize grain yields and livestock production [27,28], soil moisture deficits and plant water stress that threaten both crop yields and livestock productivity [29], and the economic value of agricultural water under drought conditions [30]. In addition, a 40% reduction in national maize production and agribusiness due to drought has been documented [31]. Questions remain, however, about the effects of drought on forest ecosystems.
For example, prolonged extreme drought causes significant stress to trees, resulting in reduced growth and significant leaf loss [32,33]. This decline in growth is closely linked to water availability and can lead to physiological changes that may ultimately result in tree death. In the tropical montane cloud forests of Mexico, the vulnerability of tree species to extreme drought has been highlighted, affecting their physiological and phenological processes and ultimately the resilience of the ecosystem [34].
In addition, increased water stress may influence how forests interact with climate change, potentially exacerbating its effects. For example, in semi-arid areas, tree mortality could increase the rate of soil evaporation, leading to warmer microclimatic conditions [32]. As climate change leads to increases in temperature and variations in precipitation, water availability and vegetation patterns in forests may be significantly altered [35]. A prominent example of the relationship between drought and extreme events is the occurrence of forest fires in the state of Chihuahua in the 1990s, to which drought events contributed significantly [36]. In northern Mexico, in mountainous regions, species such as Yucca carnerosana, Pinus cembroides, and Larrea tridentata show differential mortality across stress gradients [37].
Remote sensing studies have highlighted the phenological effects of drought on vegetation cover, emphasising the need to understand how drought affects landscapes [38,39]. A spatio-temporal analysis of severe and extreme droughts is critical for understanding climate patterns and making decisions related to natural resource management and climate change adaptation [40].
Therefore, the objective of this work was to carry out a spatio-temporal analysis of the occurrence of severe and extreme droughts and to study the area covered by these events in Mexican forest systems. In this study, we focus on assessing the probability and frequency of such events, recognising that both are key components of risk analysis studies. Previous research has shown that understanding the probability of severe and extreme droughts is crucial for assessing potential future risks to these ecosystems [41,42]. This assessment will provide important information for both government agencies and local communities, and contribute to planning for and mitigating the adverse effects of drought in a country facing unique and changing climatic challenges.
2. Materials and Methods
The spatio-temporal analysis of drought in forest systems was carried out in three stages: the classification of forest land use and vegetation, spatial mapping and classification of drought intensity, and an analysis of drought frequency in forest systems (Figure 1). Each step is described below:
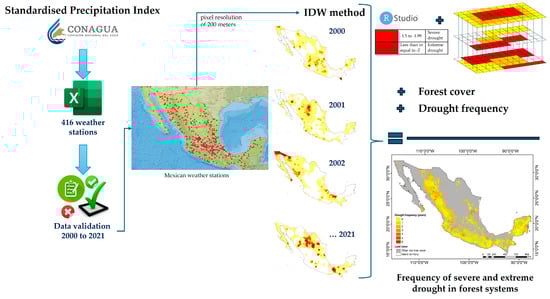
Figure 1.
Flow chart to determine the area affected by severe and extreme drought in forest systems in Mexico for the period 2000–2021.
2.1. Delineation of Forest Systems
The study area corresponds to the forested areas of Mexico, delimited on the basis of the latest 1:250,000 scale land use and vegetation map of Mexico, provided by the National Institute of Statistics, Geography and Informatics (INEGI) [43]. It should be noted that this map reflects the situation in 2018. The mapping of vegetation and forest use included nine categories, following CONAZA [44]: coniferous, coniferous and broadleaved, broadleaved, cloud forest, highland and midland tropical forests, lowland tropical forests, other wooded areas, secondary forest vegetation, and secondary rainforest vegetation.
2.2. Spatial Mapping and Classification of Drought Intensity
The SPI is calculated by fitting a gamma distribution to the historical rainfall data and transforming the cumulative probabilities to a standard normal distribution according to Equation (1) [45].
where P is the observed precipitation, μ is the precipitation distribution mean, and σ is the precipitation distribution standard deviation.
The calculated 12-month SPI (SPI-12), or annual drought summary, was downloaded from the National Weather Service [46] in an Excel file. In order to reduce the error in interpolation and the quality of the information, a thorough check of the data was carried out to identify any missing data or anomalies so that each point had data for all 21 years. It consisted of 415 points or meteorological stations distributed throughout the Mexican territory for the period 2000–2021 (see Supplementary Material S1 for more information). From the grid of points, a map of the spatial distribution of drought was obtained for each of the years of the period, using the IDW method with a pixel resolution of 200 m. Any interpolation method introduces an inherent error. To minimise this error, an interpolation method that has been shown to be effective in similar studies was selected, and its parameters were adjusted to optimise its performance [47,48,49]. Twenty-two maps were obtained in raster format. Each map was classified into five drought intensity classes according to Barker et al. [50] (Table 1).

Table 1.
Standardised Precipitation Index (SPI) drought intensity classes.
2.3. Drought Frequency and Probability in Forest Systems
For the drought analysis, in addition to counting frequency, a crosswalk with the 9 previously defined forest categories was carried out. This crosswalk made it possible to assess how severe and extreme droughts specifically affected each type of forest cover in the study area. It should be noted that attention was focused on severe and extreme droughts because they are the most drastic, and their recurrence reflects the climatic exposure of forest ecosystems. The calculation of frequencies was carried out using RStudio 2023.06.0 Build 421 [51], counting pixels with SPI-12 values less than or equal to −1.5, corresponding to severe and extreme intensity. Identifying and quantifying the frequency of such events is essential to fully understand their impacts in different regions and over time [32]. The identification of severe and extreme drought events allows decision makers in risk and natural resource management to implement appropriate adaptation and mitigation measures. It also provides critical information for planning drought management strategies and efficient resource allocation [52].
A probability analysis was performed to assess the potential occurrence of drought according to Equation (2).
where P(D) is the probability of occurrence of severe and extreme droughts based on 2000–2021 data, F is the number of years with severe and extreme droughts in the studied period, and T is the number of years, in this case 21.
3. Results
3.1. Subsection Distribution of Forest Ecosystems in Mexico
Forest ecosystems in Mexico are very diverse throughout the country. In summary, the results show that 71% of the country’s surface area is covered by primary vegetation, of which 33% corresponds to coniferous, coniferous and broadleaved, broadleaved, cloud forest, highland and midland tropical forests, lowland tropical forests, and other wooded areas (Figure 2). In contrast, 29% of the area has been converted for agricultural, urban, or other human uses, of which 36% corresponds to secondary forest vegetation and secondary rainforest vegetation. In terms of forest cover, the states with more than 50% of their territory covered by forest are, from largest to smallest, as follows: Quintana Roo > Oaxaca > Campeche > Guerrero > Yucatán > Nayarit > Michoacán de Ocampo > Jalisco > Colima > Sinaloa.
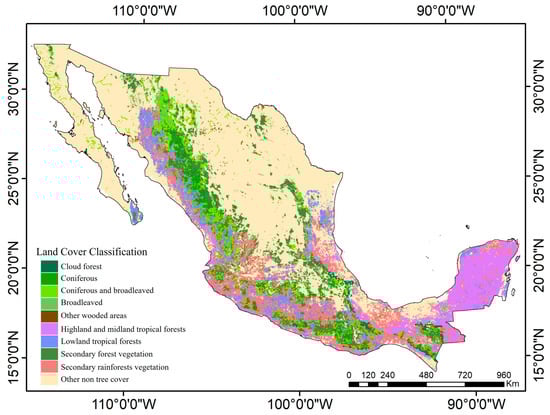
Figure 2.
Mexico’s forest ecosystems. Source: Author’s elaboration based on INEGI [43].
3.2. Drought Intensity in Mexico
Figure 3 shows the temporal and spatial variations of the SPI-12 in Mexico during the period 2000–2021. The entire national territory is plotted on the x-axis according to its longitudinal orientation (from the Greenwich meridian).
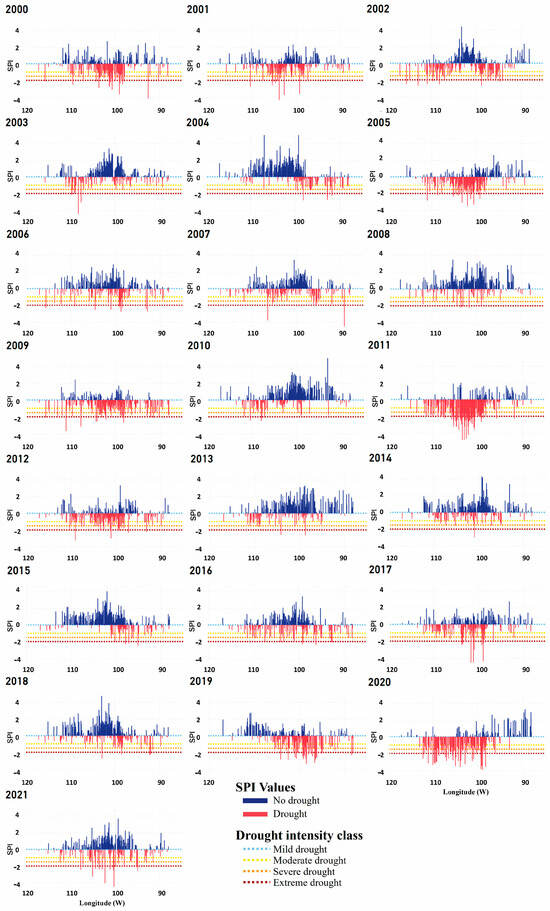
Figure 3.
Temporal and spatial pattern of drought in Mexico.
It can be observed that at least half of the period studied has SPI-12 values corresponding to droughts between longitudes 110° and 100° W of the country, corresponding mainly to the states of Chihuahua, Durango, Sinaloa, Zacatecas, Jalisco, Guanajuato, and Michoacán. A similar situation is observed in the areas between 100° and 88° W, corresponding to the states of Veracruz, Tabasco, Puebla, Oaxaca, Chiapas, and the Yucatan Peninsula. Drought has affected between 30 and 50% of the national territory in 2003, 2004, 2006, 2007, 2017, and 2018, between 50 and 70% in 2000, 2001, 2003, 2003, 2016, 2019, and 2021, and between 70 and 77% in 2009, 2011, 2012, and 2020.
In practically all the studied years, the threshold of severe and extreme intensity was exceeded, the difference being the national area covered (Figure 4). In 2011 and 2020, both intensities covered the largest national area, 27.16% and 13.17% respectively.
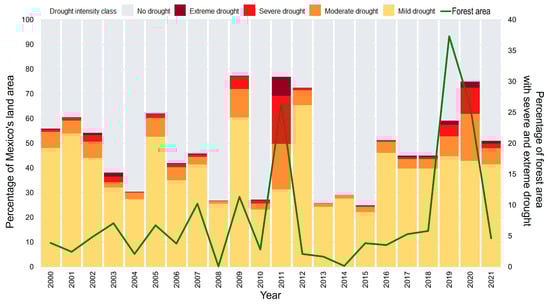
Figure 4.
Percentage of Mexico’s land area under some form of drought and forest area under severe and extreme drought.
3.3. Drought Frequency Analysis in Forest Systems
The results of this study show that severe and extreme droughts have been distributed throughout the country and have significantly affected different regions of Mexico. In particular, the years 2011, 2020, and 2021 stand out as the periods in which the area affected by these droughts reached its greatest extent (see Supplementary Material S2 for more information).
The frequency analysis resulted in a colour map where darker shades indicate a higher frequency of severe and extreme droughts in the different forest categories, allowing a clear and comparative visualisation of the spatial distribution of these events (Figure 5a). The results show that 46% of the forest area has experienced severe and extreme drought during the study period. Categories such as other wooded areas have experienced both types of drought over 70% of their area, while coniferous, broadleaved, and lowland tropical forests have experienced similar conditions over 55% of their area, and the remaining categories have been affected by these climatic conditions over 30%–40% of their area (see Supplementary Material S3 for more information).
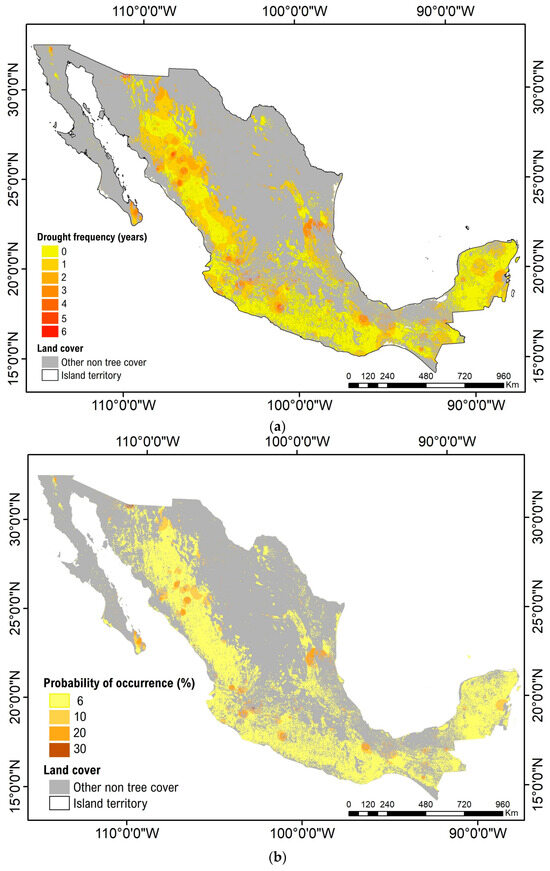
Figure 5.
(a) Frequency of severe and extreme droughts in forest systems. (b) Probability of occurrence of severe and extreme droughts in forest systems.
In 2011, the severe drought had a significant impact on the forest cover of different forest types. Coniferous, coniferous and broadleaved, broadleaved, lowland tropical forests, and secondary forest vegetation were affected by 10%–20% of their area and other forest areas by 30% of their area. In 2019, cloud forests were affected by 20% of their area, followed by other wooded areas and highland and midland tropical forests, which were affected by 10% of their area. In 2020, coniferous forests were affected on 20% of their area, followed by coniferous and broadleaved, other wooded areas, and lowland tropical forests with 10%. The extreme drought, although affecting a smaller area, had a significant impact. In 2011, coniferous, broadleaved, and secondary forest vegetation were affected by 5%–10% of their area. In 2020, other wooded areas were affected by this catastrophic event covering over 20% of their area (see Supplementary Material S4 and S5 for more information).
According to the probability map (Figure 5b), 90% of the forest area has a 6% probability of experiencing severe and extreme drought. Lowland forests, deciduous forests, and other wooded areas, including coniferous forests, account for 40% of this area with such a probability. On the other hand, 7% of the forest area has a 10% probability of severe and extreme droughts, of which wooded areas and broadleaved forests account for 10% of the area. The forest area with the highest probability of occurrence, reaching 30%, is only 1%, although it is the broadleaved forests that are most affected by these severe and extreme droughts.
4. Discussion
4.1. Forest Area Affected by Severe and Extreme Drought
Drought, a phenomenon that tests the resilience of forests and their ability to cope with these challenges [38], has a variable impact depending on its duration and severity. Understanding the resilience of forests to drought is critical at a global scale. Studies suggest that species interactions are beneficial during mild droughts, but negative effects such as competition dominate during extreme droughts [53]. The effects of drought severity and fire frequency on juvenile mortality and forest regeneration have been assessed, and they indicate that severe drought can reduce regeneration and the replacement of juvenile trees [54,55]. Severe droughts and heat waves have highlighted the danger to temperate forest ecosystems [56], highlighting their vulnerability to increased drought severity and the urgent need for further research to improve their resilience [57].
Mexico is a country that experiences drought practically every year, with the main differences being in the magnitude, duration, and distribution over the territory [58]. According to the data analysed, there is considerable variability in these aspects across the different forest areas studied. These results suggest that a significant part of the forest area has experienced drought at different times, which is a relevant concern for the health and resilience of forest ecosystems. Of these, secondary forest vegetation covers 9 and 10% of the national territory [59]. Other wooded areas account for 6%, the categories of coniferous with deciduous and lowland forests for 4% each, deciduous and coniferous forests for 3% each, high and medium forests for 2%, and mesophyll forests for less than 1%.
Mexico’s forest cover has been significantly affected by severe and extreme drought events, as shown in Figure 4 and Table 2. It should be noted that for the purpose of sizing the forest systems’ problem, Table 2 groups the different categories used in this paper into temperate forest, tropical forest, and cloud forest. In 2019, the percentage of affected forest area reached a significant 37%, compared to 26% in 2011 and 2020. Temperate forests have been most affected by these climatic events, with around 60% of their area affected by drought, closely followed by tropical forests at 58% and cloud forests at 53%. According to CONAGUA data, 2020 was the second most severe year on record for the Drought Monitor, and was slightly less severe than 2011 [58,60].
Table 2.
Area affected by drought in forest ecosystems in Mexico (km2) for the period studied.
Some authors agree that not only the duration but also the severity of drought plays a crucial role in determining the impacts on forests [58,61]. These severe conditions can lead to increased tree mortality and reduce forest resilience to future stress events [62]. The information obtained in this study on the areas most affected by severe and extreme drought reinforces the need to implement forest management measures to improve forest resilience to extreme climate variability, such as drought [63]. Furthermore, it is essential to continue monitoring and assessing these conditions in order to anticipate and mitigate them.
Forest ecosystems play a critical role in the ecological balance and biodiversity not only in Mexico, but also internationally [64,65,66]. Forests located in southern Mexico are more resilient to temperature changes, but variations in the seasonality of future temperature is a factor that will determine the distribution of vegetation [63].
Globally, tropical forests have faced severe droughts in the last decade, particularly in the Amazon basin and western Amazonia, which have affected forest dynamics and carbon balance [67,68]. In contrast, forests in West and Central Africa have shown resilience to extreme drought, possibly due to their historical adaptation [69]. Tropical forests, which are highly sensitive to drought, show differential responses to seasonal and meteorological drought, affecting gross primary production and evapotranspiration [70,71].
In temperate forests, about 65% have experienced drought episodes, affecting their vitality and species distribution [72]. Extreme droughts lead to negative leaf water potentials, significant tree mortality, and changes in vegetation composition [73]. Severe droughts, which are becoming more frequent due to climate change, are altering the structure and function of forests worldwide [74]. In Europe, extreme droughts threaten the sustainability of semi-arid and temperate forests [55]. Temperate forests, such as broadleaved forests, are affected by structural overstory, which contributes to more rapid declines during extreme droughts [75]. However, these forests show greater stability compared to other biomes under increasingly extreme droughts, highlighting the critical role of conserving these ecosystems for global vegetation productivity and carbon sink stability [76].
In cloud forests, drought affects biodiversity, especially endemic species, and reduces tree characteristics such as growth rings [77]. Species diversity can mitigate these effects by improving productivity and carbon sequestration [78]. Epiphyte responses to drought vary, with some being more resilient due to water storage structures [79]. West African tropical forests experience changes in taxonomic, functional, and phylogenetic diversity, with less stability and diversity in drier areas [80]. In summary, drought is having a profound impact on the biodiversity and functioning of forest ecosystems worldwide.
4.2. Persistence of Severe and Extreme Droughts in Forest Areas
A probability analysis provided a clearer understanding of the possible scenarios associated with environmental risks in the forest ecosystem. Probability is used as a key component in understanding and quantifying potential risks associated with environmental factors and human activities in urban settings [81]. Drought frequency is also a key component of risk analysis. It allows the identification of patterns and trends that can inform forest management strategies [82]. By combining drought probability and frequency, it is possible to develop a more robust and accurate risk assessment, allowing more effective adaptation measures to be designed and implemented to mitigate the impacts of extreme climate variability on Mexico’s forests.
The probability of drought occurrence varies globally, depending on the type of drought. Studies have shown that the average probability of the co-occurrence of meteorological, agricultural, and hydrological droughts in a single event is around 30%, with individual drought types having probabilities ranging from 61% to 69% of all single drought events [83]. However, this specific work shows that over a 21-year period, the probability of occurrence is 30%. Furthermore, research focused on Central Iran indicates that more severe and longer droughts are expected in the future, especially under certain emission scenarios, highlighting an increased probability of drought events [84]. Understanding these probabilities is crucial for early warning systems, drought management planning, and the development of effective strategies to mitigate the impacts of drought on agriculture, natural resources, and society [85,86].
It can be observed that 39.74% of the forest area has been affected by drought at least once during the year. Although this is a significant proportion, what is even more alarming is that 16.4% have been affected for 2 to 3 years. This prolonged drought can have devastating long-term effects on forest health. In contrast, a small proportion, 0.56%, have experienced drought for 4 to 7 years. While this amount may seem insignificant, even on a small scale these droughts can have significant impacts on the structure and functioning of these forest ecosystems, affecting biodiversity, reducing carbon sequestration, and altering ecosystem services.
Coniferous, broadleaved, cloud forest, and highland and midland tropical forests are among the vegetation cover types that have experienced at least one year of drought on 90% of their area. In contrast, broadleaved forest, other woodland, lowland forest, and secondary rainforest vegetation have experienced between 2 and 3 years of drought on at least 5% of their area. Most worryingly, these same areas have experienced between 4 and 6 years of drought in at least 0.5% of their area, as shown in Figure 6. However, Mexico has experienced droughts with a frequency of 4 to 10 years (Dobler-Morales and Bocco, 2021). This situation makes vegetation vulnerable. A specific example of this situation is observed in Douglas fir growing in northern Mexico, which requires 6–10 years to fully recover growth rates after extreme drought events [87]. The idea that a forest will always fully recover after disturbance may not always be correct, as multiple droughts may affect its ability to recover to its previous condition. In other words, it is difficult to assess the response of a forest to a single drought without considering the cumulative effects of repeated droughts [38].
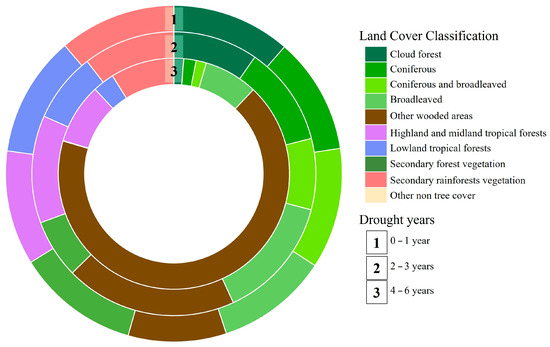
Figure 6.
Cumulative frequency of severe and extreme droughts in forest systems.
In addition, water shortages due to drought events can negatively affect tree growth and development, which can have a negative impact on the productivity of forest resources [88]. This can affect the timber industry and the economy of the communities that depend on it, as reported by Rubio-Camacho et al. [89], who found that tree mortality in a forest dominated by Pinus montezumae and Alnus firmifolia was mainly due to drought events. Similarly, it can also have indirect effects on forest cover, such as the increased presence of pests and diseases that attack trees weakened by water scarcity [90].
Other authors, such as Tran et al. [91] and Calama et al. [92], claim that drought stress in Pinus massoniana and Pinus pinaster ssp. mesogeensis leads to reduced stomatal conductance, increased superoxide dismutase activity, and altered gene expression, thereby increasing drought tolerance. In studies of Pinus ponderosa in the western United States [93], more recurrent drought conditions were found to result in additional reductions in growth and changes in growth-climate sensitivity. Specifically, triple drought events were found to be particularly detrimental to growth in this species. In addition, a multi-decadal study conducted in mountainous areas of the southwestern United States highlighted that increased drought frequency alone is a contributing factor to the long-term growth effects observed in Pinus ponderosa populations [94].
4.3. Critical Analysis and Future Prospects
This study provides a detailed overview of the frequency of droughts in forest ecosystems in Mexico, providing valuable information for forest management and biodiversity conservation. It uses a spatio-temporal approach to analyse the evolution of droughts over time, providing a broad perspective on the situation. It is also based on hard data and established methodologies, such as the Standardised Precipitation Index, which gives validity and reliability to the results.
However, this study focuses mainly on the frequency of droughts and their impact on forests, without considering other possible factors that may influence ecosystem health. In addition, the delineation of forest areas and the classification of forest categories may introduce some subjectivity into the interpretation of the data. In addition, there is no explicit mention of analysing the possible causes of droughts, which may limit the full understanding of the factors contributing to these events. Finally, the representativeness of the data may be limited if not all relevant variables are considered in the study of droughts in forest ecosystems.
To address these limitations and to improve knowledge, it would be important to investigate the specific effects of drought on different tree species and their long-term adaptive capacity. It would also be possible to analyse how extreme droughts affect the dynamics of forest ecosystems, including changes in species composition and forest structure. It would also be important to study the interaction between droughts and other environmental stressors, such as forest fires, to better understand the combined effects on ecosystems. It would also be important to assess the effectiveness of forest restoration and management measures in mitigating the effects of drought on forests. Finally, it would be crucial to investigate the influence of climate variability and climate change on the frequency and intensity of droughts in forest ecosystems in Mexico.
5. Conclusions
In recent years, drought has significantly affected Mexico’s forest ecosystems. In terms of severe and extreme drought, the years 2011, 2020, and 2021 showed the highest intensity, duration, and area affected. The analysis of frequency and probability of droughts showed that more than 46% of Mexico’s forest area has experienced severe and extreme droughts. Although further damage studies are required to complete the risk approach, the inclusion of frequency and probability in the analysis provides insight into possible risk scenarios.
The increasing frequency of severe and extreme droughts in Mexico poses a significant challenge to the sustainability of forest ecosystems. Adaptation to these changing conditions is essential to ensure the conservation of biodiversity, the provision of ecosystem services, and the protection of the country’s natural resources.
The variability in the geographical distribution and intensity of droughts in different types of Mexican forests highlights the diversity of forest ecosystems present in the country. Temperate forest ecosystems were most affected by drought, with drought affecting 60% of their area, followed by tropical rainforest, with drought affecting 58% of their area. In addition, montane cloud forests were affected in 53% of their area. More than half of Mexico’s forest area has been affected by drought in the last 21 years, highlighting the vulnerability of these ecosystems to drought. This diversity requires adaptive and specific management approaches for each forest type, considering the particularities of each region and its response to droughts.
Concerns about the persistence of prolonged droughts lasting 2–6 years underscore the importance of assessing the long-term resilience of Mexican forests. These prolonged events need to be studied, as they can have devastating impacts on biodiversity, tree growth, and the provision of ecosystem services, highlighting the need to strengthen forest resilience to these climate challenges.
The 30% probability of drought over a 21-year period highlights the ongoing threat that these climate events pose to Mexico’s forest ecosystems. This finding underscores the importance of developing early warning systems, drought management plans, and adaptation strategies to mitigate the negative impacts of drought on biodiversity, natural resources, and Mexican society.
Supplementary Materials
The following supporting information can be downloaded at: https://www.mdpi.com/article/10.3390/f15071241/s1. Supplementary Material S1—Mexican weather stations. Supplementary Material S2—Annual mapping of severe and extreme droughts from 2000 to 2021. Supplementary Material S3—Severe and extreme drought area by category and frequency. Supplementary Material S4—Annual area affected by severe drought by category, in km2. Supplementary Material S5—Annual area affected by extreme drought by category, in km2.
Author Contributions
Conceptualisation, L.C.L.-T. and A.I.M.-R.; data curation, L.C.L.-T.; formal analysis, L.C.L.-T. and A.I.M.-R.; investigation, L.C.L.-T.; methodology, L.C.L.-T. and A.I.M.-R.; software, L.C.L.-T.; supervision, A.I.M.-R.; validation, L.C.L.-T. and A.I.M.-R.; visualisation, L.C.L.-T.; writing—original draft, L.C.L.-T. and A.I.M.-R.; writing—review and editing, L.C.L.-T. and A.I.M.-R. All authors have read and agreed to the published version of the manuscript.
Funding
This research received no external funding. Lopez receives financial support from the Consejo Nacional de Humanidades, Ciencias y Tecnologías (CONAHCYT) for her postdoctoral stay in the Postgraduate Programme in Forestry and Environmental Sciences at Universidad Autonoma Chapingo.
Data Availability Statement
Data are available upon reasonable request from the corresponding author.
Acknowledgments
CONAHCYT for financial support, DGIP, CIRENAM, and the Department of Forest Sciences of Universidad Autonoma Chapingo. To the anonymous reviewers.
Conflicts of Interest
The authors declare no conflicts of interest.
References
- Schmidhuber, J.; Tubiello, F.N. Global food security under climate change. Proc. Natl. Acad. Sci. USA 2007, 104, 19703–19708. [Google Scholar] [CrossRef] [PubMed]
- Muse, N.M.; Tayfur, G.; Safari, M.J.S. Meteorological Drought Assessment and Trend Analysis in Puntland Region of Somalia. Sustainability 2023, 15, 10652. [Google Scholar] [CrossRef]
- Eyvaz, M.; Albahnasawi, A.; Tekbaş, M.; Gürbulak, E. Drought; IntechOpen: Rijeka, Croatia, 2022. [Google Scholar] [CrossRef]
- Mehdipour, S.; Nakhaee, N.; Khankeh, H.; Haghdoost, A.A. Impacts of drought on health: A qualitative case study from Iran. Int. J. Disaster Risk Reduct. 2022, 76, 103007. [Google Scholar] [CrossRef]
- Zaveri, E.; Damania, R.; Engle, N. Droughts and Deficits: Summary Evidence of the Global Impact on Economic Growth; World Bank Group: Washington, DC, USA, 2023; Available online: www.worldbank.org/gwsp (accessed on 20 May 2024).
- Nouri, M.; Homaee, M. Drought trend, frequency and extremity across a wide range of climates over Iran. Meteorol. Appl. 2020, 27, e1899. [Google Scholar] [CrossRef]
- Ortuzar, I.; Serrano, A.; Xabadia, À. Macroeconomic impacts of water allocation under droughts. Accounting for global supply chains in a multiregional context. Ecol. Econ. 2023, 211, 107904. [Google Scholar] [CrossRef]
- Orimoogunje, O.O.I.; Eslamian, S. (Eds.) Minimizing the Impacts of Drought, 1st ed.; CRC Press: Boca Raton, FL, USA, 2016; Available online: https://www.researchgate.net/publication/323018733 (accessed on 20 May 2024).
- Pozzi, W.; Sheffield, J.; Stefanski, R.; Cripe, D.; Pulwarty, R.; Vogt, J.V.; Heim, R.R.; Brewer, M.J.; Svoboda, M.; Westerhoff, R.; et al. Toward global drought early warning capability: Expanding international cooperation for the development of a framework for monitoring and forecasting. Bull. Am. Meteorol. Soc. 2013, 94, 776–785. [Google Scholar] [CrossRef]
- da Silva, G.J.F.; de Oliveira, N.M.; Santos, C.A.G.; da Silva, R.M. Spatiotemporal variability of vegetation due to drought dynamics (2012–2017): A case study of the Upper Paraíba River basin, Brazil. Nat. Hazards 2020, 102, 939–964. [Google Scholar] [CrossRef]
- Zhang, Y.; Liu, X.; Jiao, W.; Wu, X.; Zeng, X.; Zhao, L.; Wang, L.; Guo, J.; Xing, X.; Hong, Y. Spatial Heterogeneity of Vegetation Resilience Changes to Different Drought Types. Earths Future 2023, 11, e2022EF003108. [Google Scholar] [CrossRef]
- Gessner, C.; Fischer, E.M.; Beyerle, U.; Knutti, R. Multi-year drought storylines for Europe and North America from an iteratively perturbed global climate model. Weather Clim. Extremes 2022, 38, 100512. [Google Scholar] [CrossRef]
- Brázdil, R.; Demarée, G.R.; Kiss, A.; Dobrovolný, P.; Chromá, K.; Trnka, M.; Dolák, L.; Řezníčková, L.; Zahradníček, P.; Limanowka, D.; et al. The extreme drought of 1842 in Europe as described by both documentary data and instrumental measurements. Clim. Past 2019, 15, 1861–1884. [Google Scholar] [CrossRef]
- Lupo, A.R.; Kononova, N.K.; Semenova, I.G.; Lebedeva, M.G. A Comparison of the Characteristics of Extreme Drought during the Late 20thand Early 21stCenturies over Eurasia and North America. IOP Conf. Ser. Earth Environ. Sci. 2022, 949, 012122. [Google Scholar] [CrossRef]
- Runde, I.; Zobel, Z.; Schwalm, C. Human and natural resource exposure to extreme drought at 1.0 °C–4.0 °C warming levels. Environ. Res. Lett. 2022, 17, 064005. [Google Scholar] [CrossRef]
- Reyes, L.J.C.; Rangel, H.Á.; Herazo, L.C.S. Adjustment of the Standardized Precipitation Index (SPI) for the Evaluation of Drought in the Arroyo Pechelín Basin, Colombia, under Zero Monthly Precipitation Conditions. Atmosphere 2022, 13, 236. [Google Scholar] [CrossRef]
- Tigkas, D.; Vangelis, H.; Tsakiris, G. Drought characterisation based on an agriculture-oriented standardised precipitation index. Theor. Appl. Climatol. 2019, 135, 1435–1447. [Google Scholar] [CrossRef]
- Hadisuwito, A.S.; Hassan, F.H. Selection Drought Index Calculation Methods Using Electre, Topsis, and Analytic Hierarchy Process. Int. J. Eng. Technol. 2018, 7, 188. [Google Scholar] [CrossRef]
- Charlton, C.; Stephenson, T.; Taylor, M.A.; Campbell, J. Evaluating Skill of the Keetch–Byram Drought Index, Vapour Pressure Deficit and Water Potential for Determining Bushfire Potential in Jamaica. Atmosphere 2022, 13, 1267. [Google Scholar] [CrossRef]
- Zhang, H.; Zhang, L.; Zhang, Q.; Liu, Q.; You, X.; Wang, L. Analysis of the Difference between Climate Aridity Index and Meteorological Drought Index in the Summer Monsoon Transition Zone. Remote Sens. 2023, 15, 1175. [Google Scholar] [CrossRef]
- Arabzadeh, R.; Kholoosi, M.M.; Bazrafshan, J. Regional Hydrological Drought Monitoring Using Principal Components Analysis. J. Irrig. Drain. Eng. 2016, 142, 04015029. [Google Scholar] [CrossRef]
- Azhdari, Z.; Bazrafshan, O.; Zamani, H.; Shekari, M.; Singh, V.P. Hydro-meteorological drought risk assessment using linear and nonlinear multivariate methods. Phys. Chem. Earth 2021, 123, 103046. [Google Scholar] [CrossRef]
- Bezdan, J.; Bezdan, A.; Blagojević, B.; Mesaroš, M.; Pejić, B.; Vranešević, M.; Pavić, D.; Nikolić-Đorić, E. SPEI-based approach to agricultural drought monitoring in Vojvodina region. Water 2019, 11, 1481. [Google Scholar] [CrossRef]
- Hou, M.; Yao, N.; Li, Y.; Liu, F.; Biswas, A.; Pulatov, A.; Hassan, I. Better Drought Index between SPEI and SMDI and the Key Parameters in Denoting Drought Impacts on Spring Wheat Yields in Qinghai, China. Agronomy 2022, 12, 1552. [Google Scholar] [CrossRef]
- Butu, H.M.; Seo, Y.; Huh, J.S. Determining extremes for future precipitation in South Korea based on RCP scenarios using non-parametric SPI. Sustainability 2020, 12, 963. [Google Scholar] [CrossRef]
- Yeh, H.F.; Lin, X.Y.; Huang, C.C.; Chen, H.Y. A Meteorological Drought Migration Model for Assessing the Spatiotemporal Paths of Drought in the Choushui River Alluvial Fan, Taiwan. Geosciences 2024, 14, 106. [Google Scholar] [CrossRef]
- Chávez, J.E.R. Allocation of drought relief resources and its biased impact on agricultural production in Mexico. Sobre México Temas Econ. 2022, 1, 40–80. [Google Scholar] [CrossRef]
- León, G.S.-D.; Moran-Ramírez, J.; Ramos-Leal, J.A. Impact of Drought and Groundwater Quality on Agriculture in a Semi-Arid Zone of Mexico. Agriculture 2022, 12, 1379. [Google Scholar] [CrossRef]
- Salas-Martínez, F.; Valdés-Rodríguez, O.A.; Palacios-Wassenaar, O.M.; Márquez-Grajales, A. Analysis of the evolution of drought through spi and its relationship with the agricultural sector in the central zone of the state of Veracruz, Mexico. Agronomy 2021, 11, 2099. [Google Scholar] [CrossRef]
- Zempoaltecatl-Ramirez, E.; Monsiváis-Huertero, A.; Quiroz-Ibarra, J.E.; González-Ordiano, J.Á. Validation of a Drought Index Based on Smos Soil Moisture Product Over An Agricultural Area in Central Mexico. In Proceedings of the 2021 IEEE International Geoscience and Remote Sensing Symposium IGARSS, Brussels, Belgium, 11–16 July 2021; pp. 1335–1338. [Google Scholar] [CrossRef]
- Sánchez, H.U.R.; Montiel, A.L.F.; Bañuelos, A.D.O.; De la Torre Villaseñor, O. The Agricultural Sector and Climate Change in Mexico. J. Agric. Ecol. Res. Int. 2022, 23, 19–44. [Google Scholar] [CrossRef]
- Camarero, J.J.; Barreda, G.S.; Alla, A.Q.; de Andrés, E.G.; Martínez, M.M.; Vicente-Serrano, S.M. The precedents and the responses of trees to extreme droughts reveal the processes involved in the die-off of Mediterranean conifer forests. Ecosistemas 2012, 21, 22–30. [Google Scholar] [CrossRef]
- Sánchez-Salguero, R.; Navarro-Cerrillo, R. La sequía y la gestión histórica como factores del decaimiento forestal en las repoblaciones del sur peninsular. In Los Bosques y la Biodiversidad Frente al Cambio Climático: Impactos, Vulnerabilidad y Adaptación en España; Herrer, A., Zavala, M.A., Eds.; Ministerio de Agricultura, Alimentación y Medio Ambiente: Madrid, Spain, 2015. [Google Scholar]
- Ruiz-Valencia, J.A.; Vázquez-Sánchez, M.; Burgos-Hernández, M.; Gutiérrez, J.; Terrazas, T. Wood anatomy of Forestiera (Oleaceae) species in Mexico. Acta Bot. Mex 2021, 128, e1924. [Google Scholar] [CrossRef]
- Takano-Rojas, H.; Murray-Tortarolo, G.; Maass, M.; Castillo, A. Characterization, variability and long-term trends on local climate in a Mexican tropical dry forest. Int. J. Climatol. 2023, 43, 5077–5091. [Google Scholar] [CrossRef]
- López, M.N.; Robles, M.; Gómez, R.; Velasco, V.; Esparza, G. Caracterización de la sequía a diversas escalas de tiempo en Chihuahua, México. Agrociencia 2007, 41, 253–262. Available online: http://www.redalyc.org/articulo.oa?id=30241301 (accessed on 25 September 2023).
- Argüelles-Marrón, B.; Meave, J.A.; Luna-Vega, I.; Crispin-DelaCruz, D.B.; Szejner, P.; Ames-Martínez, F.N.; Rodríguez-Ramírez, E.C. Adaptation potential of Neotropical montane oaks to drought events: Wood anatomy sensitivity in Quercus delgadoana and Quercus meavei. Funct. Ecol. 2023, 37, 2040–2055. [Google Scholar] [CrossRef]
- Correa-Díaz, A.; Villanueva-Díaz, J.; Gómez-Guerrero, A.; Martínez-Bautista, H.; Castruita-Esparza, L.U.; Horwath, W.R.; Silva, L.C.R. A comprehensive resilience assessment of Mexican tree species and their relationship with drought events over the last century. Glob. Chang. Biol. 2023, 29, 3652–3666. [Google Scholar] [CrossRef] [PubMed]
- Le, T.S.; Harper, R.; Dell, B. Application of Remote Sensing in Detecting and Monitoring Water Stress in Forests. Remote Sens. 2023, 15, 3360. [Google Scholar] [CrossRef]
- Rashiq, A.; Kumar, V.; Prakash, O. A Spatiotemporal Assessment of the Precipitation Variability and Pattern, and an Evaluation of the Predictive Reliability, of Global Climate Models over Bihar. Hydrology 2024, 11, 50. [Google Scholar] [CrossRef]
- Allen, C.D.; Macalady, A.K.; Chenchouni, H.; Bachelet, D.; McDowell, N.; Vennetier, M.; Kitzberger, T.; Rigling, A.; Breshears, D.D.; Hogg, E.T.; et al. A global overview of drought and heat-induced tree mortality reveals emerging climate change risks for forests. For. Ecol. Manag. 2010, 259, 660–684. [Google Scholar] [CrossRef]
- Millar, C.I.; Stephenson, N.L. Temperate forest health in an era of emerging megadisturbance. Sciencie 2015, 349, 823–826. [Google Scholar] [CrossRef]
- INEGI. Carta de Uso de Suelo y Vegetación, Serie VII, Escala 1:250,000; INEGI: Aguascalientes, Mexico, 2021. [Google Scholar]
- CONAZA. Informe Nacional 2022 de Acciones Contra la Desertificación, Degradación de Tierras y Sequía en México; Comisión Nacional de Zonas Áridas: Saltillo, Mexico, 2023.
- Mckee, T.B.; Doesken, N.J.; Kleist, J. The relationship of drought frequency and duration to time scales. Proc. 8th Conf. Appl. Climatol. 1993, 17, 179–183. [Google Scholar]
- Servicio Meteorológico Nacional, Índice Estandarizado de Precipitación (SPI). Available online: https://smn.conagua.gob.mx/es/climatologia/monitor-de-sequia/spi (accessed on 25 August 2023).
- Chen, J.; Han, C.; Peng, Y.; Wang, M.; Zhao, Y. Improved three-dimensional mapping of soil chromium pollution with sparse borehole data: Incorporating multisource auxiliary data into IDW-based interpolation. Soil Use Manag. 2023, 39, 933–947. [Google Scholar] [CrossRef]
- Kim, J.; Han, J.; Park, K.; Seok, S. Improved IDW Interpolation Application Using 3D Search Neighborhoods: Borehole Data-Based Seismic Liquefaction Hazard Assessment and Mapping. Appl. Sci. 2022, 12, 11652. [Google Scholar] [CrossRef]
- Bahmani, S.; Naganna, S.R.; Ghorbani, M.A.; Shahabi, M.; Asadi, E.; Shahid, S. Geographically Weighted Regression Hybridized with Kriging Model for Delineation of Drought-Prone Areas. Environ. Model. Assess. 2021, 26, 803–821. [Google Scholar] [CrossRef]
- Barker, L.J.; Rickards, N.J.; Sarkar, S.; Hannaford, J.; King-Okumu, C.; Rees, G. Good Practice Guidance for National Reporting on UNCCD Strategic Objective 3: To Mitigate, Adapt to, and Manage the Effects of Drought in Order to Enhance Resilience of Vulnerable Populations and Ecosystems; United Nations Convention to Combat Desertification (UNCCD): Bonn, Germany, 2021. [Google Scholar]
- Posit Team. RStudio: Integrated Development Environment for R. 2023. Available online: https://posit.co/download/rstudio-desktop/ (accessed on 1 September 2023).
- CONAGUA, Política Pública Nacional para la Sequía. Documento Rector. 2014. Available online: https://www.gob.mx/conagua (accessed on 28 February 2024).
- Haberstroh, S.; Werner, C. The role of species interactions for forest resilience to drought. Plant Biol. 2022, 24, 1098–1107. [Google Scholar] [CrossRef]
- Bendall, E.R.; Bedward, M.; Boer, M.; Clarke, H.; Collins, L.; Leigh, A.; Bradstock, R.A. Changes in the resilience of resprouting juvenile tree populations in temperate forests due to coupled severe drought and fire. Plant Ecol. 2022, 223, 907–923. [Google Scholar] [CrossRef]
- Werner, C. Extreme droughts and heatwaves endanger temperate forests. Plant Biol. 2022, 24, 1091–1092. [Google Scholar] [CrossRef]
- Speich, M.J.R. Quantifying and modeling water availability in temperate forests: A review of drought and aridity indices. iForest 2019, 12, 1–16. [Google Scholar] [CrossRef]
- D’Orangeville, L.; Maxwell, J.; Kneeshaw, D.; Pederson, N.; Duchesne, L.; Logan, T.; Houle, D.; Arseneault, D.; Beier, C.M.; Bishop, D.A.; et al. Drought timing and local climate determine the sensitivity of eastern temperate forests to drought. Glob. Chang. Biol. 2018, 24, 2339–2351. [Google Scholar] [CrossRef]
- Agustín-Canales, N.S.; Cruz-Sánchez, Y.; la Rosa, M.A.B.-D.; González-Tepale, M.R.; Monterroso-Rivas, A.I. Drought and Vulnerability in Mexico’s Forest Ecosystems. Forests 2023, 14, 1813. [Google Scholar] [CrossRef]
- Comisión Nacional Forestal (CONAFOR). El Sector Forestal Mexicano en Cifras: Bosques para el Bienestar Social y Climático; CONAFOR: Zapopan, Mexico, 2020.
- CONAGUA. Monitor de Sequía en México (MSM). Available online: https://smn.conagua.gob.mx/es/climatologia/monitor-de-sequia/monitor-de-sequia-en-mexico (accessed on 9 April 2024).
- Cárdenas, O.L.; Ruacho, O.G.G.; Montoya, J.M.; Diéguez, E.T. Hot Extremes and Climatological Drought Indicators in the Transitional Semiarid-Subtropical Region of Sinaloa, Northwest Mexico. Pol. J. Environ. Stud. 2022, 31, 4567–4577. [Google Scholar] [CrossRef]
- García-Valdés, R.; Morales-Castilla, I. Efectos del cambio climático en los ecosistemas forestales: Integrando inventarios y modelos. Ecosistemas 2016, 25, 51–59. [Google Scholar] [CrossRef]
- Fernández, A.S.; Cabrera, I.I.V.; Ruiz, L.M.P.; Ávila, E.C.; Cobos, F.A.; Ortega, J.B. Resilience of vegetation cover in Southwest Mexico to the climate change effects. Rev. Peru. Biol. 2021, 28, e18187. [Google Scholar] [CrossRef]
- Barreras, A.; Alanís de la Rosa, J.A.; Mayorga, R.; Cuenca, R.; Moreno-G, C.; Godínez, C.; Delgado, C.; Soriano-Luna, M.D.L.Á.; George, S.; Aldrete-Leal, M.I.; et al. Spatial predictions of tree density and tree height across Mexico forests using ensemble learning and forest inventory data. Ecol. Evol. 2023, 13, e10090. [Google Scholar] [CrossRef] [PubMed]
- Shekhar, A. Role of Forest Management in Environmental Studies with Reference to the Maintaining of Conservation Values. Int. J. Res. Appl. Sci. Eng. Technol. 2022, 10, 496–502. [Google Scholar] [CrossRef]
- Li, J.; Zhou, A.; Liao, Y.; Zhao, Z.; Mao, X.; Zhang, S. Forest Ecological Diversity Change Prediction Discrete Dynamic Model. Discret. Dyn. Nat. Soc. 2022, 2022, 4869363. [Google Scholar] [CrossRef]
- Feldpausch, T.R.; Phillips, O.L.; Brienen, R.J.W.; Gloor, E.; Lloyd, J.; Lopez-Gonzalez, G.; Monteagudo-Mendoza, A.; Malhi, Y.; Alarcón, A.; Álvarez Dávila, E.; et al. Amazon forest response to repeated droughts. Glob. Biogeochem. Cycles 2016, 30, 964–982. [Google Scholar] [CrossRef]
- Asefi-Najafabady, S.; Saatchi, S. Response of African humid tropical forests to recent rainfall anomalies. Philos. Trans. R. Soc. B Biol. Sci. 2013, 368, 20120306. [Google Scholar] [CrossRef] [PubMed]
- Xiong, Q.; Sun, Z.; Cui, W.; Lei, J.; Fu, X.; Wu, L. A Study on Sensitivities of Tropical Forest GPP Responding to the Characteristics of Drought—A Case Study in Xishuangbanna, China. Water 2022, 14, 157. [Google Scholar] [CrossRef]
- Zou, L.; Cao, S.; Zhao, A.; Sanchez-Azofeifa, A. Assessing the temporal response of tropical dry forests to meteorological drought. Remote Sens. 2020, 12, 2341. [Google Scholar] [CrossRef]
- Cox, P.M.; Harris, P.P.; Huntingford, C.; Betts, R.A.; Collins, M.; Jones, C.D.; Jupp, T.E.; Marengo, J.A.; Nobre, C.A. Increasing risk of Amazonian drought due to decreasing aerosol pollution. Nature 2008, 453, 212–215. [Google Scholar] [CrossRef] [PubMed]
- Beloiu, M.; Stahlmann, R.; Beierkuhnlein, C. High recovery of saplings after severe drought in temperate deciduous forests. Forests 2020, 11, 546. [Google Scholar] [CrossRef]
- Werner, C.; Haberstroh, S.; Seifert, T.; Christen, A.; Caldeira, M. Impacts of severe droughts on species interaction in forests. In Proceedings of the EGU General Assembly Conference Abstracts, Vienna, Austria, 23–28 April 2023; p. EGU-9525. [Google Scholar] [CrossRef]
- Bennett, A.C.; McDowell, N.G.; Allen, C.D.; Anderson-Teixeira, K.J. Larger trees suffer most during drought in forests worldwide. Nat. Plants 2015, 1, 15139. [Google Scholar] [CrossRef]
- Zhang, Y.; Keenan, T.F.; Zhou, S. Exacerbated drought impacts on global ecosystems due to structural overshoot. Nat. Ecol. Evol. 2021, 5, 1490–1498. [Google Scholar] [CrossRef] [PubMed]
- Huang, K.; Xia, J. High ecosystem stability of evergreen broadleaf forests under severe droughts. Glob. Chang. Biol. 2019, 25, 3494–3503. [Google Scholar] [CrossRef] [PubMed]
- Rodriguez-Ramirez, E.C.; Vazquez-Garcia, J.A.; Garcia-Gonzalez, I.; Alcantara-Ayala, O.; Luna-Vega, I. Drought effects on the plasticity in vessel traits of two endemic Magnolia species in the tropical montane cloud forests of eastern Mexico. J. Plant Ecol. 2020, 13, 331–340. [Google Scholar] [CrossRef]
- Grossiord, C. Having the right neighbors: How tree species diversity modulates drought impacts on forests. New Phytol. 2020, 228, 42–49. [Google Scholar] [CrossRef] [PubMed]
- Tsai, Y.C.; Wang, L.; Wang, C.P.; Lin, T.C. Distinct epiphyte responses to drought in tropical mountain cloud forests. Ecohydrology 2023, 16, e2569. [Google Scholar] [CrossRef]
- Aguirre-Gutiérrez, J.; Malhi, Y.; Lewis, S.L.; Fauset, S.; Adu-Bredu, S.; Affum-Baffoe, K.; Baker, T.R.; Gvozdevaite, A.; Hubau, W.; Moore, S.; et al. Long-term droughts may drive drier tropical forests towards increased functional, taxonomic and phylogenetic homogeneity. Nat. Commun. 2020, 11, 3346. [Google Scholar] [CrossRef]
- Liu, C.; Chen, W.; Hou, Y.; Ma, L. A new risk probability calculation method for urban ecological risk assessment. Environ. Res. Lett. 2020, 15, 024016. [Google Scholar] [CrossRef]
- IPCC. Climate Change 2014 Impacts, Adaptation, and Vulnerability Part A: Global and Sectoral Aspects Working Group II Contribution to the Fifth Assessment Report of the Intergovernmental Panel on Climate Change; Cambridge University: Cambridge, UK; New York, NY, USA, 2014. [Google Scholar]
- Ahopelto, L.; Kallio, M.; Heino, M.; Kinnunen, P.; Fallon, A.; Kummu, M. Quantifying the co-occurrence of hydrological, meteorological, and agricultural droughts on a global scale. In Proceedings of the EGU General Assembly 2020, Online, 4–8 May 2020. [Google Scholar] [CrossRef]
- Naderi, K.; Shokri, A.; Moghaddasi, M. Drought Occurrence Probability Analysis Using Multivariate Standardized Drought Index and Copula Function under Climate Change. Water Resour. Manag. 2022, 36, 2865–2888. [Google Scholar] [CrossRef]
- Eriyagama, N.; Smakhtin, V.; Eriyagama, N.; Smakhtin, V.; Gamage, N. A Global Picture of Drought Occurrence, Magnitude and Preparedness. Istanbul, Turkey. 2010. Available online: www.cru.uea.ac.uk/cru/data/hrg/timm/grid/CRU_TS_2_0.html (accessed on 24 May 2024).
- Qi, W.; Feng, L.; Yang, H.; Liu, J. Increasing Concurrent Drought Probability in Global Main Crop Production Countries. Geophys. Res. Lett. 2022, 49, e2021GL097060. [Google Scholar] [CrossRef]
- Castruita-Esparza, L.U.; Silva, L.C.R.; Gómez-Guerrero, A.; Villanueva-Díaz, J.; Correa-Díaz, A.; Horwath, W.R. Coping With Extreme Events: Growth and Water-Use Efficiency of Trees in Western Mexico During the Driest and Wettest Periods of the Past One Hundred Sixty Years. J. Geophys. Res. Biogeosci. 2019, 124, 3419–3431. [Google Scholar] [CrossRef]
- Rodriguez-Robles, U.; Arredondo, T.; Smart, D. Wood anatomical and physiological differences between semiarid pine and oak, stand up for their tree ring sensibility to precipitation variability. Agric. For. Meteorol. 2023, 338, 109530. [Google Scholar] [CrossRef]
- Rubio-Camacho, E.A.; Hesselbarth, M.H.K.; Flores-Garnica, J.G.; Acosta-Mireles, M. Tree mortality in mature temperate forests of central Mexico: A spatial approach. Eur. J. For. Res. 2023, 142, 565–577. [Google Scholar] [CrossRef]
- Gómez-Pineda, E.; Sáenz-Romero, C.; Salinas-Melgoza, M.Á.; Ramírez, M.I. Drought occurrence and forest management: Interrelated drivers of sanitary logging in central México temperate forests. Trees For. People 2023, 13, 100413. [Google Scholar] [CrossRef]
- Zhang, J.; Wang, D.; Chen, P.; Zhang, C.; Yao, S.; Hao, Q.; Agassin, R.H.; Ji, K. The Transcriptomic Analysis of the Response of Pinus massoniana to Drought Stress and a Functional Study on the ERF1 Transcription Factor. Int. J. Mol. Sci. 2023, 24, 11103. [Google Scholar] [CrossRef] [PubMed]
- Calama, R.; Martínez, C.; Gordo, J.; Del Río, M.; Menéndez-Miguélez, M.; Pardos, M. The impact of climate and management on recent mortality in Pinus pinaster resin-tapped forests of inland Spain. Forestry 2024, 97, 120–132. [Google Scholar] [CrossRef]
- Peltier, D.M.P.; Ogle, K. Legacies of more frequent drought in ponderosa pine across the western United States. Glob. Chang. Biol. 2019, 25, 3803–3816. [Google Scholar] [CrossRef]
- Szejner, P.; Belmecheri, S.; Ehleringer, J.R.; Monson, R.K. Recent increases in drought frequency cause observed multi-year drought legacies in the tree rings of semi-arid forests. Oecologia 2020, 192, 241–259. [Google Scholar] [CrossRef]


Disclaimer/Publisher’s Note: The statements, opinions and data contained in all publications are solely those of the individual author(s) and contributor(s) and not of MDPI and/or the editor(s). MDPI and/or the editor(s) disclaim responsibility for any injury to people or property resulting from any ideas, methods, instructions or products referred to in the content. |
© 2024 by the authors. Licensee MDPI, Basel, Switzerland. This article is an open access article distributed under the terms and conditions of the Creative Commons Attribution (CC BY) license (https://creativecommons.org/licenses/by/4.0/).