Article

Altitudinal Difference of Growth–Climate Response Models in the Coniferous Forests of Southeastern Tibetan Plateau, China

1
School of Geography, Nanjing Normal University, Nanjing 210023, China
2
Jiangsu Centre for Collaborative Innovation in Geographical Information Resource Development and Application, Nanjing 210023, China
3
Key Laboratory of Virtual Geographic Environment, Ministry of Education of China, Nanjing 210023, China
*
Author to whom correspondence should be addressed.
Forests 2024, 15(7), 1265; https://doi.org/10.3390/f15071265 (registering DOI)
Submission received: 10 June 2024 / Revised: 3 July 2024 / Accepted: 17 July 2024 / Published: 20 July 2024
(This article belongs to the Section Forest Meteorology and Climate Change)

Abstract

:
Characterized as a climatologically sensitive region, the southeastern Tibetan Plateau (STP) is an ideal location for dendrochronological research. Here, five tree-ring width (TRW) chronologies were developed: three for Picea likiangensis along altitudinal gradients from 3600 to 4400 m a.s.l. and two for Sabina saltuaria and Abies squamata from 4200 m a.s.l. Significant differences in the growth rates and age composition of Picea likiangensis were observed at various elevation gradients. The chronology statistics (mean sensitivity, etc.) fluctuated with the elevation gradient. Picea likiangensis showed distinct growth patterns in response to climatic variability along the altitude gradient: the minimum temperature influenced tree growth at lower and middle altitudes, while higher altitudes were affected by precipitation. The radial growth of different tree species growing in the same region is controlled by the same climatic factors. Sabina saltuaria and Abies squamata exhibited similar growth responses to Picea likiangensis. Stand conditions (wind speeds, slope, and elevation) and biotic factors (the depth of root, forest type, tree age, and sensitivity) can partially explain why the ring width–climate relationships change with altitude.

1. Introduction

Human influence has warmed the climate at an unprecedented rate in at least the last 2000 years, particularly affecting high-mountain regions where the climate changes more rapidly than in surrounding lowlands [1,2]. Climate change will affect the population structure, distribution, and annual growth rates of tree species [3,4,5,6,7]. In alpine areas, the temperature–precipitation (hydrothermal) coupling pattern alters with increasing altitude, as altitude corresponds to a natural cooling and humidification gradient [7,8,9]. Temperature and precipitation are the primary drivers of tree growth [10,11]. Consequently, plants exhibit varied adaptations in growth, survival, and metabolism in response to altitude changes, and the relationship between tree growth and climate often varies with altitude [12,13]. Therefore, a comprehensive understanding of the growth–climate responses of high-elevation tree species across their distribution range is essential for devising appropriate forest management and conservation strategies to mitigate the adverse impacts of climate change [14].
Predicting changes in growth dynamics and evaluating the impact of climate change requires a deeper understanding of tree growth responses along elevation gradients. Throughout the altitudinal range of tree species, the lower and upper distribution limits are identified as critical zones that are particularly sensitive to local climate changes [15,16]. It is generally believed that tree growth near the upper tree line is mainly influenced by temperature, whereas tree growth at lower distribution limits is mainly influenced by precipitation and moisture conditions [15,17,18,19,20,21]. However, at many sites, results which are inconsistent with this general understanding have been observed. For instance, in the Manang valley of the central Himalayas, it was observed that spring and summer rainfall, rather than summer temperature, determined the growth of Abies spectabilis at high-elevation sites [22]. In Suoxian and Jiali counties, the Naqu region, and the southern TP, temperature does not significantly affect the growth–climate relationships of Sabina tibetica; instead, tree growth is primarily influenced by variability in moisture from April to June, even near the upper tree line [23]. Additionally, some other studies have shown a uniform growth response along altitude gradients [2,24,25]. Therefore, to obtain accurate climate change information, more relevant research is needed.
Located in the transition zone from the Chengdu Plain to the Tibetan Plateau, the western Sichuan Plateau in the southeastern Tibetan Plateau (STP) is largely covered by abundant alpine coniferous forests and is very sensitive to climate change [26]. Meanwhile, this area is a transition zone with a subtropical and temperate climate [27]. Therefore, it is an ideal site for dendroclimatology research. Lots of dendroclimatology work has been developed in this region [28,29,30,31,32]. Though the response patterns were different in different sites, few studies have been conducted along the elevation gradients in the STP [33,34,35]. Furthermore, previous studies have focused solely on how individual species respond to changes in elevation [23,36]. Therefore, there is a need to investigate the radial growth response of various tree species at different altitudes in the STP.
Picea likiangensis var. balfouriana (P. likiangensis) is a high-altitude conifer widely distributed in Sichuan province and it is the main tree species in composite subalpine forests [37]. The conifer Sabina saltuaria (S. saltuaria) has great potential for paleoclimate reconstruction. In its upright growth form, S. saltuaria reaches a height of around 9 m, and the canopy density is 30%–50% [32]. As a unique subtropical evergreen coniferous tree species in the eastern and southern TP, S. saltuaria is distributed on the hillside at altitudes of 4150–4600 m a.s.l. in the form of isolated trees or small patches. Abies squamata (A. squamata) is a species of fir tree native to western China, particularly in the regions of Sichuan, Tibet, and Yunnan. This tree typically grows at high altitudes ranging from 3000 to 4500 m a.s.l., often in mixed coniferous forests or on mountain slopes [38]. These three tree species all exhibit clear tree rings and few false rings and missing rings, making them very suitable for dendrochronological research [32,39]. In this study, we developed three ring width chronologies of P. likiangensis from a mountain located in Daocheng county. In order to detect differences in growth responses to climate among the studied species, we also developed chronologies of S. saltuaria and A. squamata growing at altitudes near 4300 m above sea level (a.s.l.). The specific objectives of our study were as follows: (1) to examine the patterns of P. likiangensis growth along an elevation gradient in the STP; (2) to identify the climatic variables that influence the radial growth of P. likiangensis and detect differences in growth responses to climate among the different dominant tree species; and (3) to analyze the reason for the change in the tree-ring width–climate relationship with altitude. We hypothesized that (1) similar to the general trend proposed by Fritts et al. [15], trees at high elevations in this region are primarily limited by temperature, while trees at low elevations are mainly limited by precipitation; and (2) the radial growth of different tree species growing in the same region is controlled by the same climatic factors. These investigations can provide some insight into the role of regional forest dynamics and their relationships with climatic change. What is more, these results are also important for formulating appropriate forest management and conservation strategies under expected future climate conditions.

2. Materials and Methods
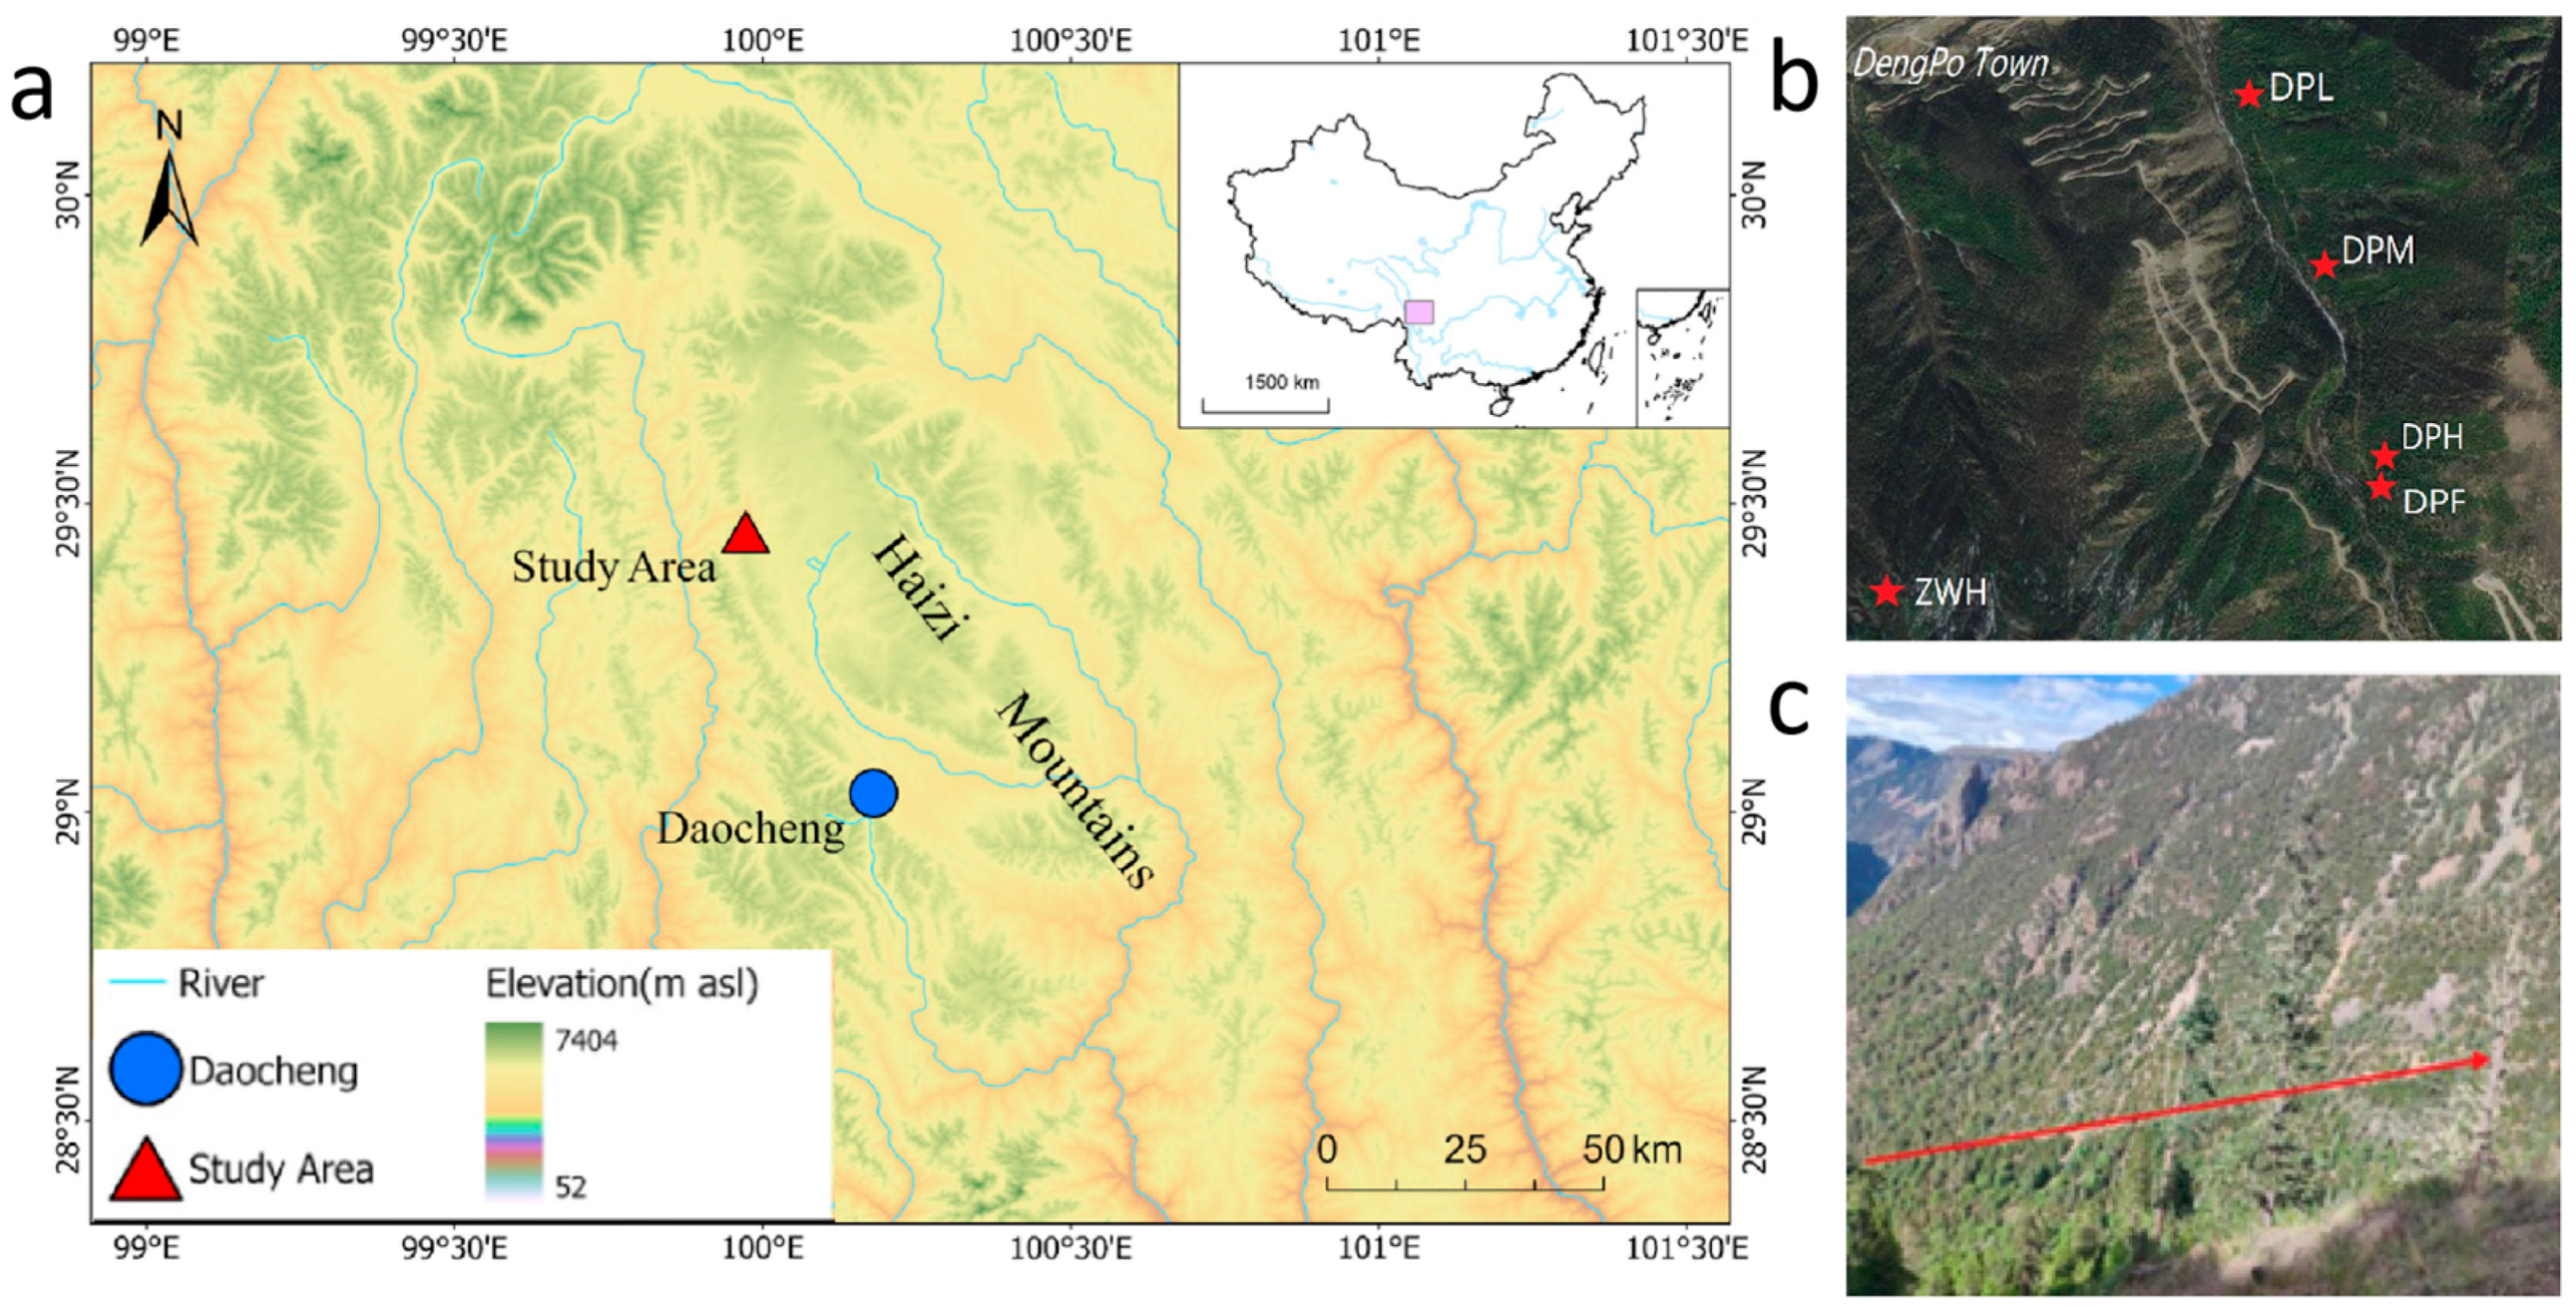
2.1. Study Area

The study was conducted in the high-elevation forest ecosystems of the STP, and the sampling sites were located in the Haizi mountain, China (99°56′–99°59′ E, 29°26′–29°29′ N) (Figure 1). This area exhibits distinct altitudinal belts and vegetation types with a high level of plant endemism due to its topographical complexity [39]. Various climate systems, including the eastern Asian monsoon, the Indian monsoon, and the continental westerlies, play an active role in driving the regional climate patterns of this region [40]. Based on the data acquired from a local meteorological station (Daocheng, 29.03° N, 100.18° E, 3728 m a.s.l.), the annual precipitation is 660 mm, most of which falls between June and September. The annual mean temperature is 4.58 °C, with a mean temperature of 12.2 °C in July and −4.9 °C in January (Figure 2). According to the climate data over the past six decades at Daocheng station, significant warming trends have been observed in annual mean temperatures, but total annual precipitation did not show a clear changing trend (Figure 3).

2.2. Sample Collection and Dendrochronological Analyses
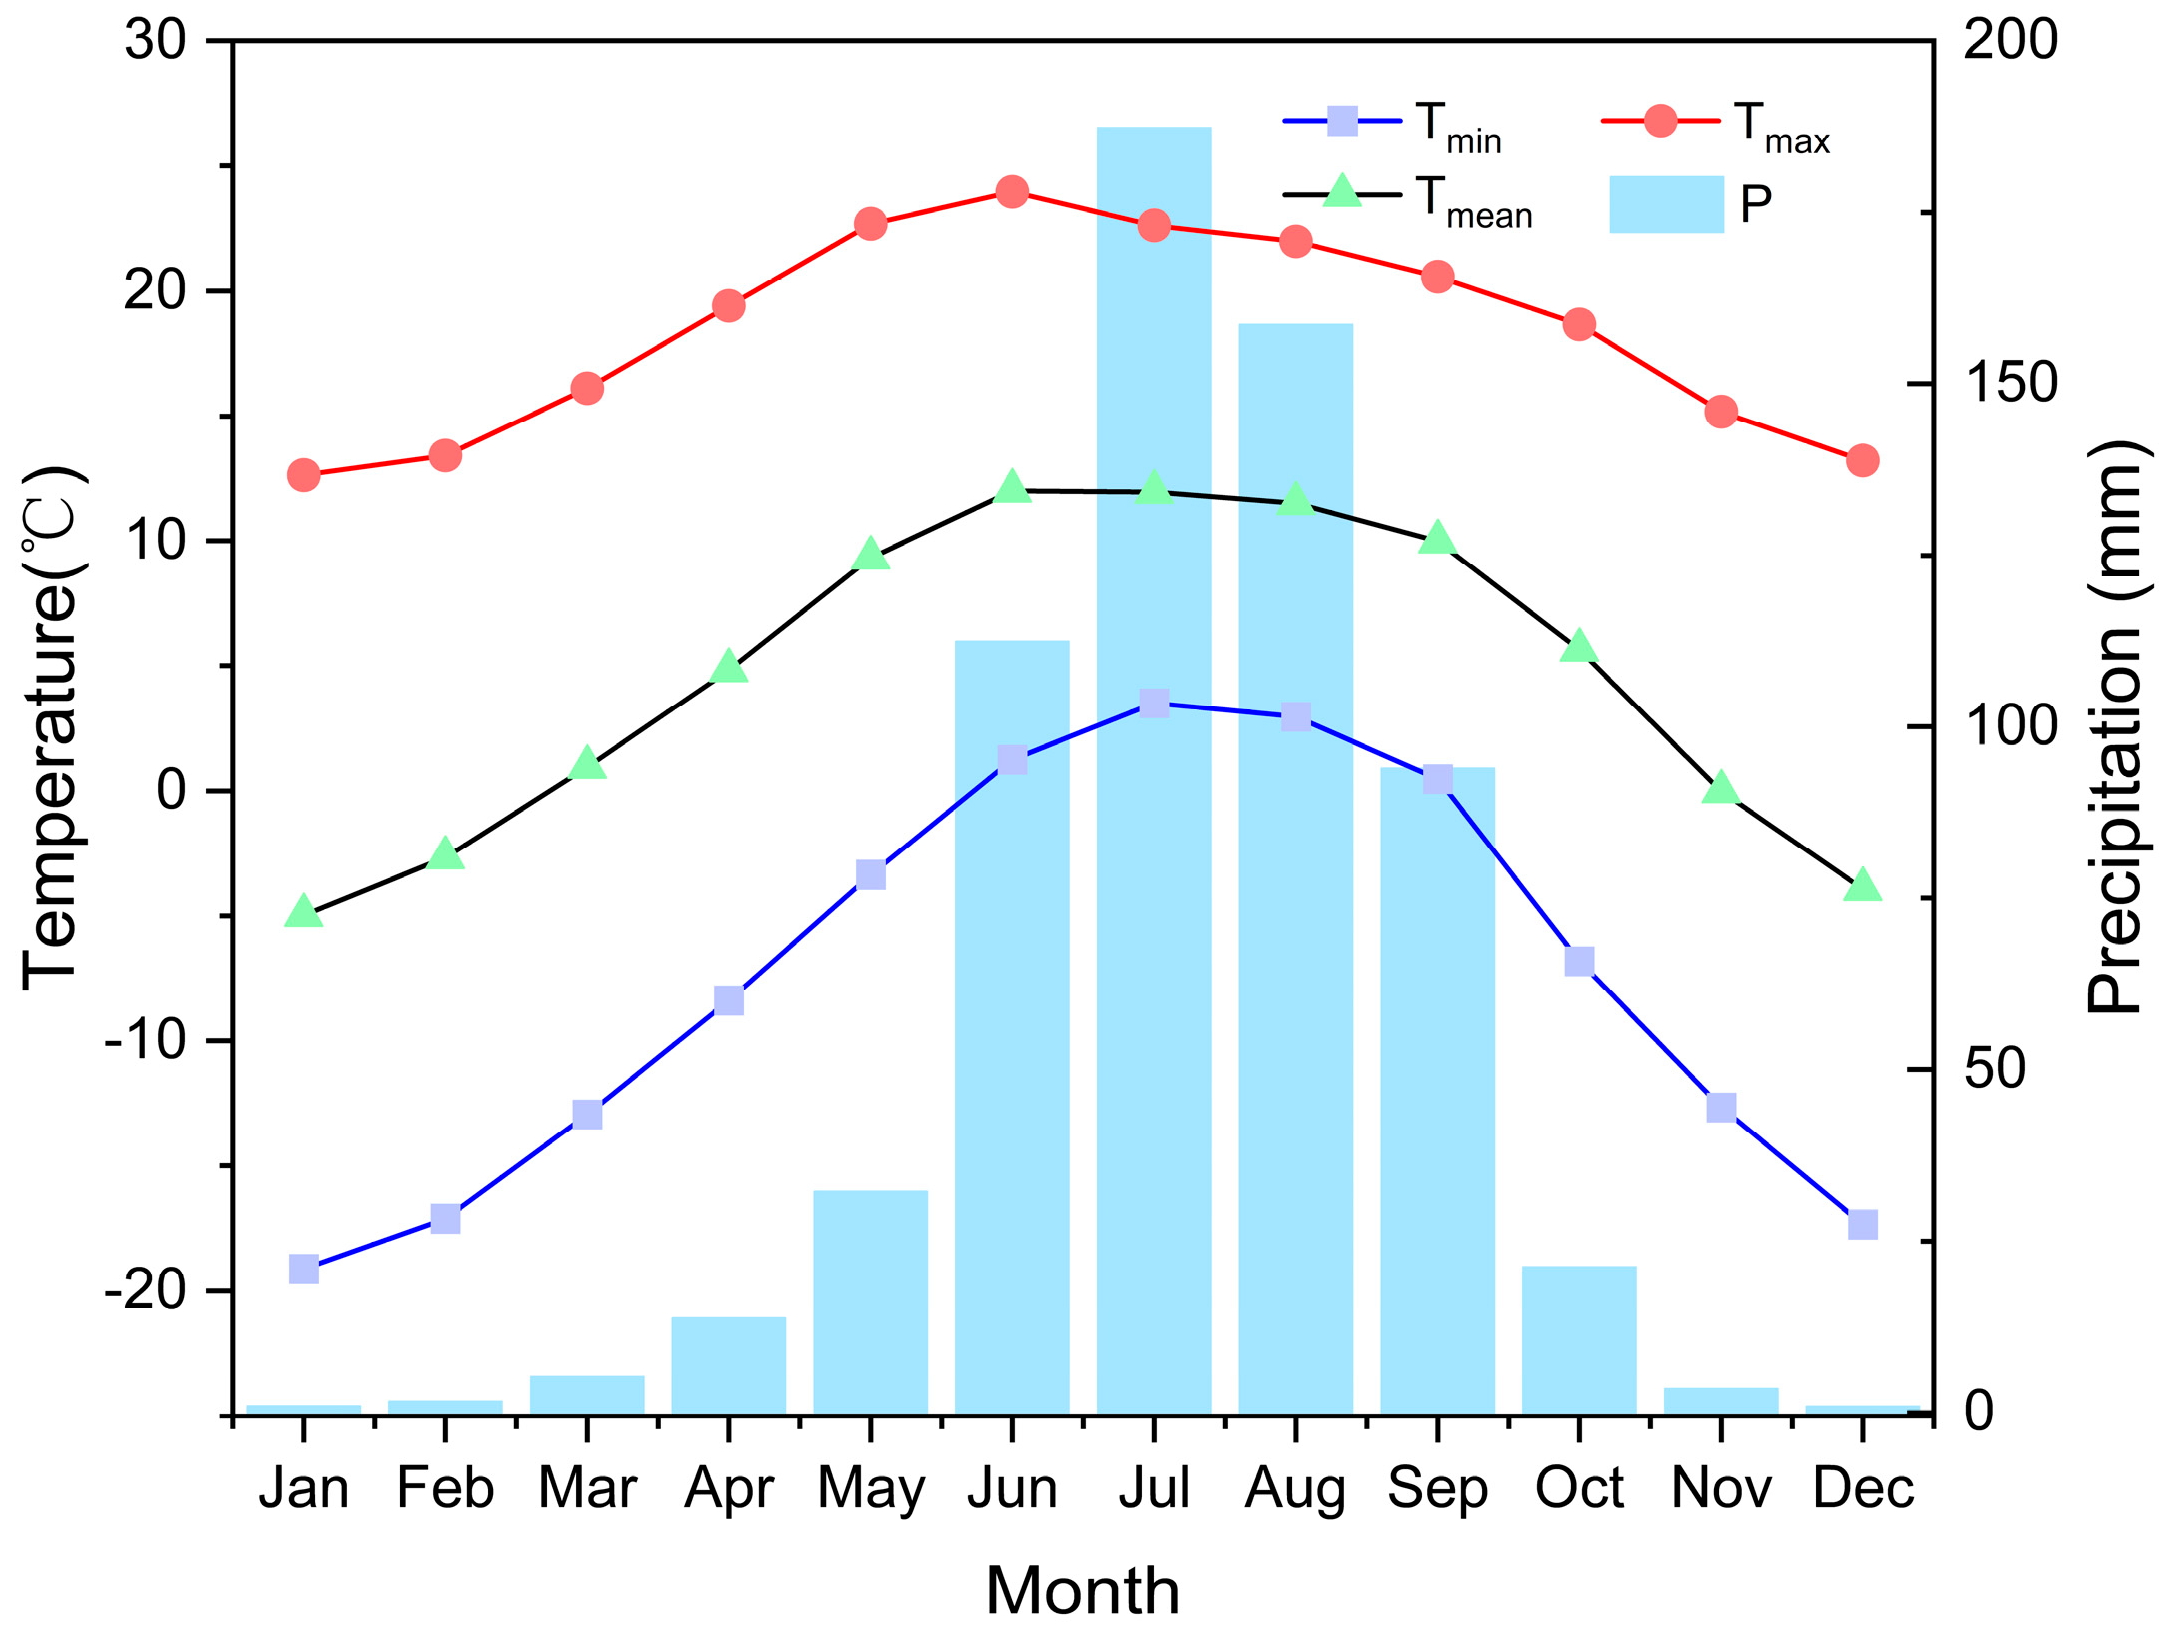
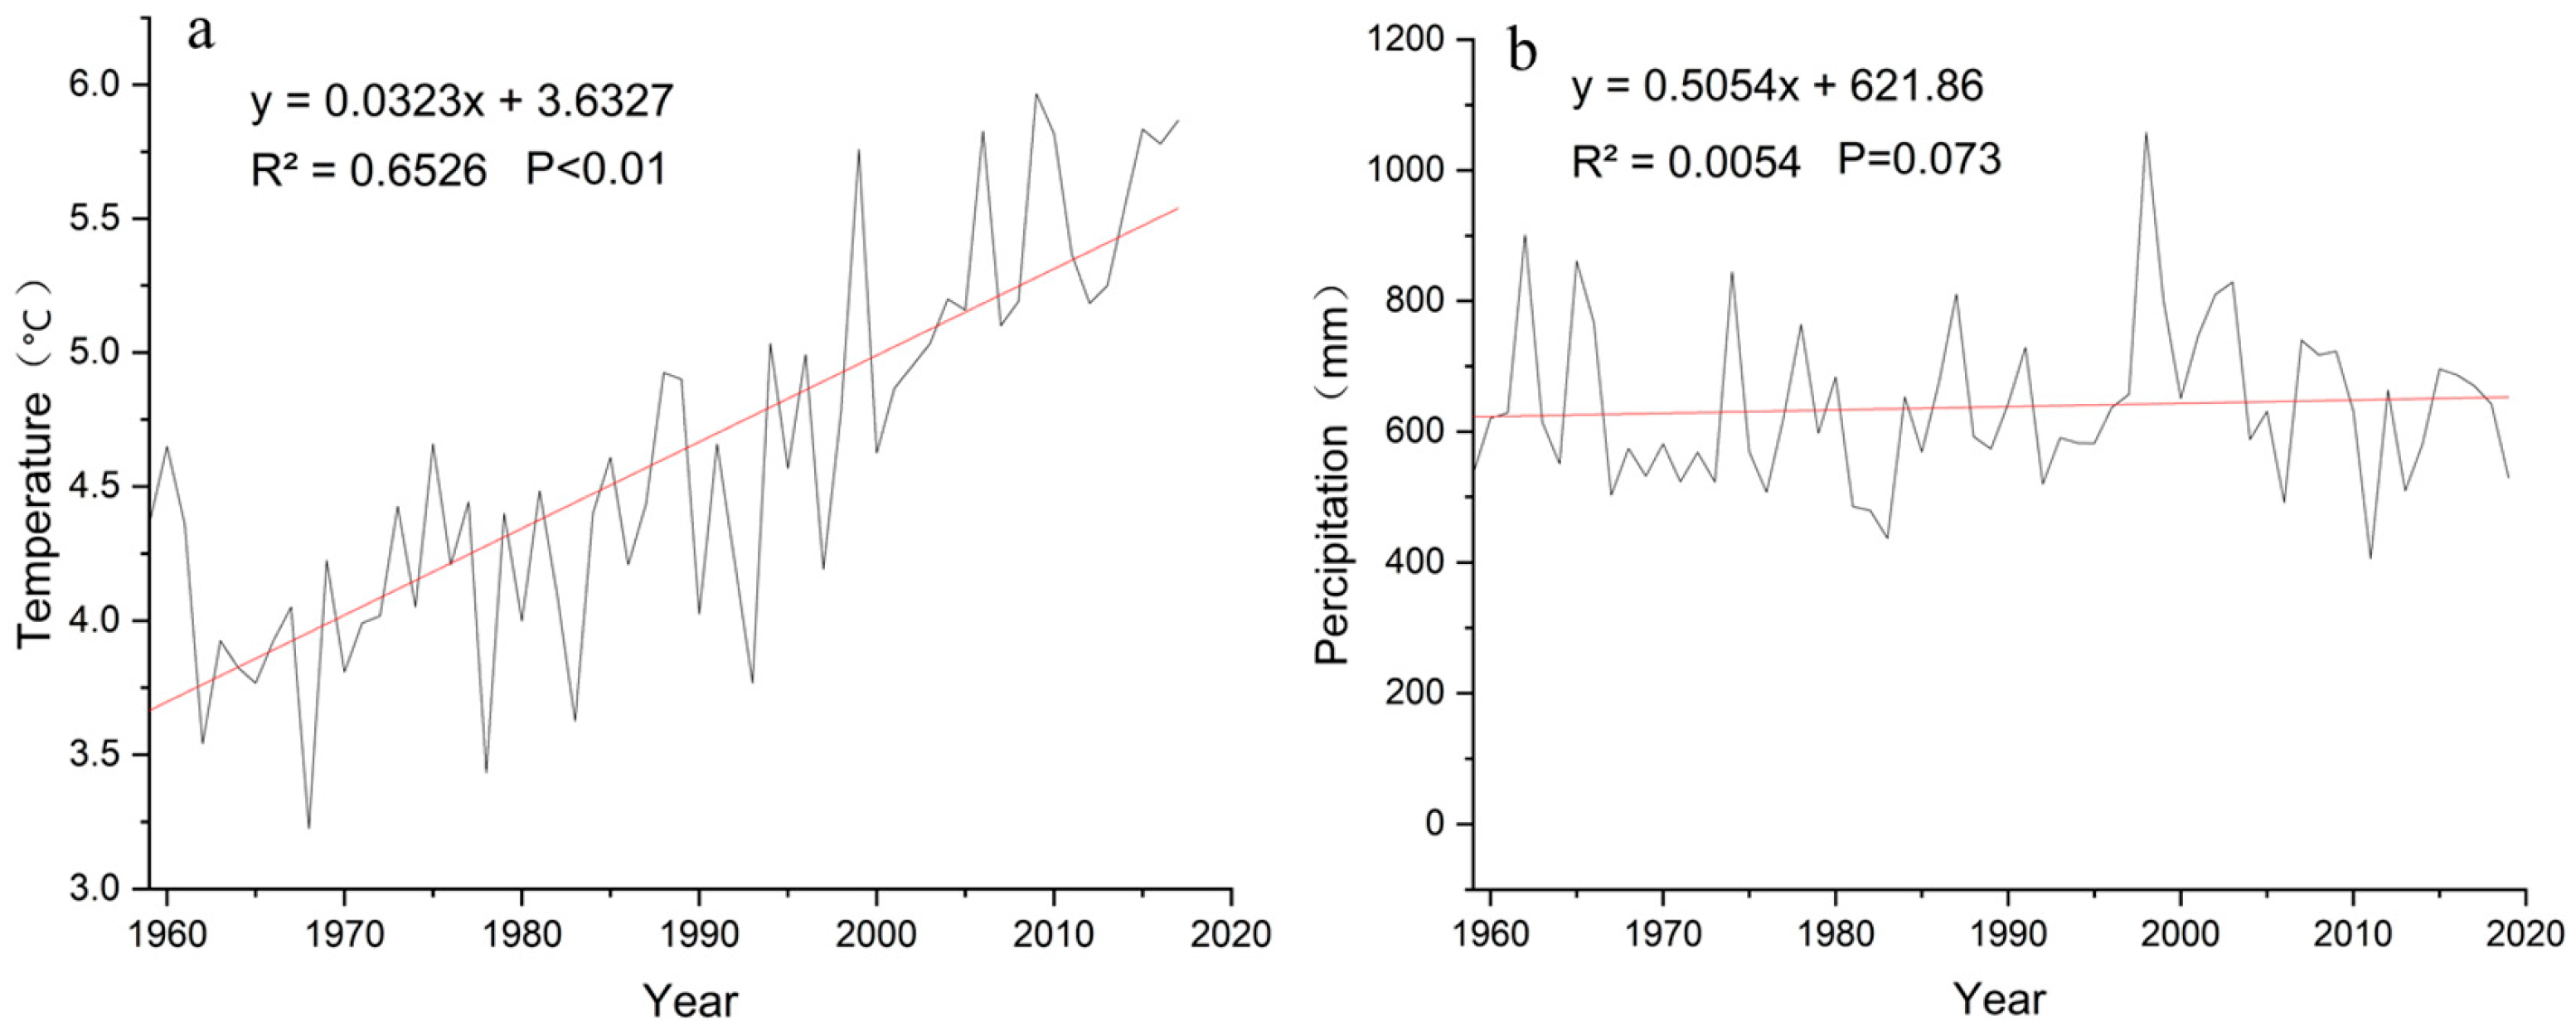
The hillside near the Dengpo Township, Daocheng County, China was chosen as the sampling location; the elevation of the sampled P. likiangensis forest ranges from 3550 to 4450 m a.s.l. P. likiangensis is a shallow-rooted species that can tolerate cold weather [37]. Consequently, it is widely distributed on the north-facing slopes of high mountains where the climate is cold and humid. Though P. likiangensis is the dominant tree species on this hillside, the community structure at each sampling site varies significantly with elevation. In the high-elevation zone, P. likiangensis and S. saltuaria form an open mixed forest, with Rhododendron decorum Franch and Rhododendron phaeochrysum present in the understory. The forest in the middle elevation range is an open stand primarily dominated by P. likiangensis, with a few R. phaeochrysum and Salix sclerophylla in the understory. In the lower elevation zone, the forest remains characterized by an open, pure stand, predominantly composed of P. likiangensis, and accompanied by some Salix sclerophylla.
According to the standard dendrochronological techniques for sample preparation and chronology development [41,42,43], P. likiangensis trees were sampled from three elevational belts at the species’ upper distribution limit (4250–4350 m a.s.l., DPH), at the middle range (3850–3950 m a.s.l., DPM), and at the lower distribution limit (3650–3750 m a.s.l., DPL). S. saltuaria trees were sampled at the site corresponding to DPH (4170–4283 m a.s.l., DPF). In addition, we sampled some Abies squamata Mast. from another hillside near the DPH (4355–4398 m a.s.l., ZWH) (Figure 1). At each sampling site, two to three increment cores per tree were collected from 20 to 26 mature and heathy trees using the increment borer of a 5.15 mm diameter (Supplemental Figure S1). Specifically, to develop chronologies, 47, 56, 50, 44, and 42 increment cores were collected at the breast height from the DPH, DPM, DPL, DPF, and ZWH sites, respectively (Table 1). The increment cores were stored in paper tubes to prevent damage.
The preparation and processing of samples were carried out following international general specifications and standards [41,42,44]. First, the samples were dried and fixed in wooden slots; then, we used consecutively finer grades of sandpapers to smooth the core surfaces until the ring boundaries and cells were clearly visible under a microscope. We used skeleton plots for cross-dating and the TSAP-win™ (v4.81c) standard annual ring analysis software for auxiliary cross-dating. Tree-ring widths were measured with a LinTAB 6 system (Rinntech, Heidelberg, Germany) at a resolution of 0.001 mm. Each core was measured at least twice. Then, COFECHA software (2012) [44,45] was utilized to check the results of cross-dating and corrected errors following the microscopic examination of tree-ring characteristics [46]. We applied a negative exponential regression function and a 67% of the series length cubic spline function to remove the age-related trend for each series using the ARSTAN program (2008) [46]. The analysis results revealed that the de-trending methods had a negligible impact on the quality of the chronologies (Supplemental Tables S1 and S2). The bi-weight robust estimation of the mean was employed for all the series to produce the standard chronology (STD), residual chronology (RES), and ARTSAN chronology (ARS). The mean sensitivity (M.S.), standard deviation (S.D.), and first-order autocorrelation coefficient (AC1) of the chronology were calculated to evaluate the quality of the chronology. In addition, the signal-to-noise ratio (SNR) and first principal component variance interpretation (PC1) were also calculated. The reliability and signal strength of each standard chronology was assessed by a 50-year moving expressed population signal (EPS) and the mean series inter-correlations (Rbar) [10].

2.3. Climate Data

The instrumental data, including monthly total precipitation (P), mean temperature (Tmean), mean minimum temperature (Tmin), and mean maximum temperature (Tmax) from the previous May to the current October, were collected from the local meteorological station (Daocheng, 29.03° N, 100.18° E, 3728 m a.s.l.), which is located 52 km from our sampling sites (Figure 1), with coverage from A.D. 1959 to 2021 (Data from https://data.cma.cn/, accessed on 24 April 2023). This study employed the moving t-test to detect mean shifts in the temperature and precipitation time series [10]. The results indicate that there are no abrupt changes in temperature and precipitation series at the Daocheng station. Consequently, the meteorological data demonstrate good homogeneity and can be reliably used for subsequent analysis and research. The Standardized Precipitation–Evapotranspiration Index (SPEI) [47] was used to derive regional moisture conditions. The SPEI dataset was obtained from CRUTS3.23 (http://sac.csic.es/spei, accessed on 24 April 2023). Climate–growth relationships were determined by using Pearson’s correlation analyses. Correlation analyses between the tree-ring width index (TRI) of each residual chronology and climatic variables were performed for 18 months in total, starting in May of the previous growing season, and ending in October of the current growing season.

3. Results

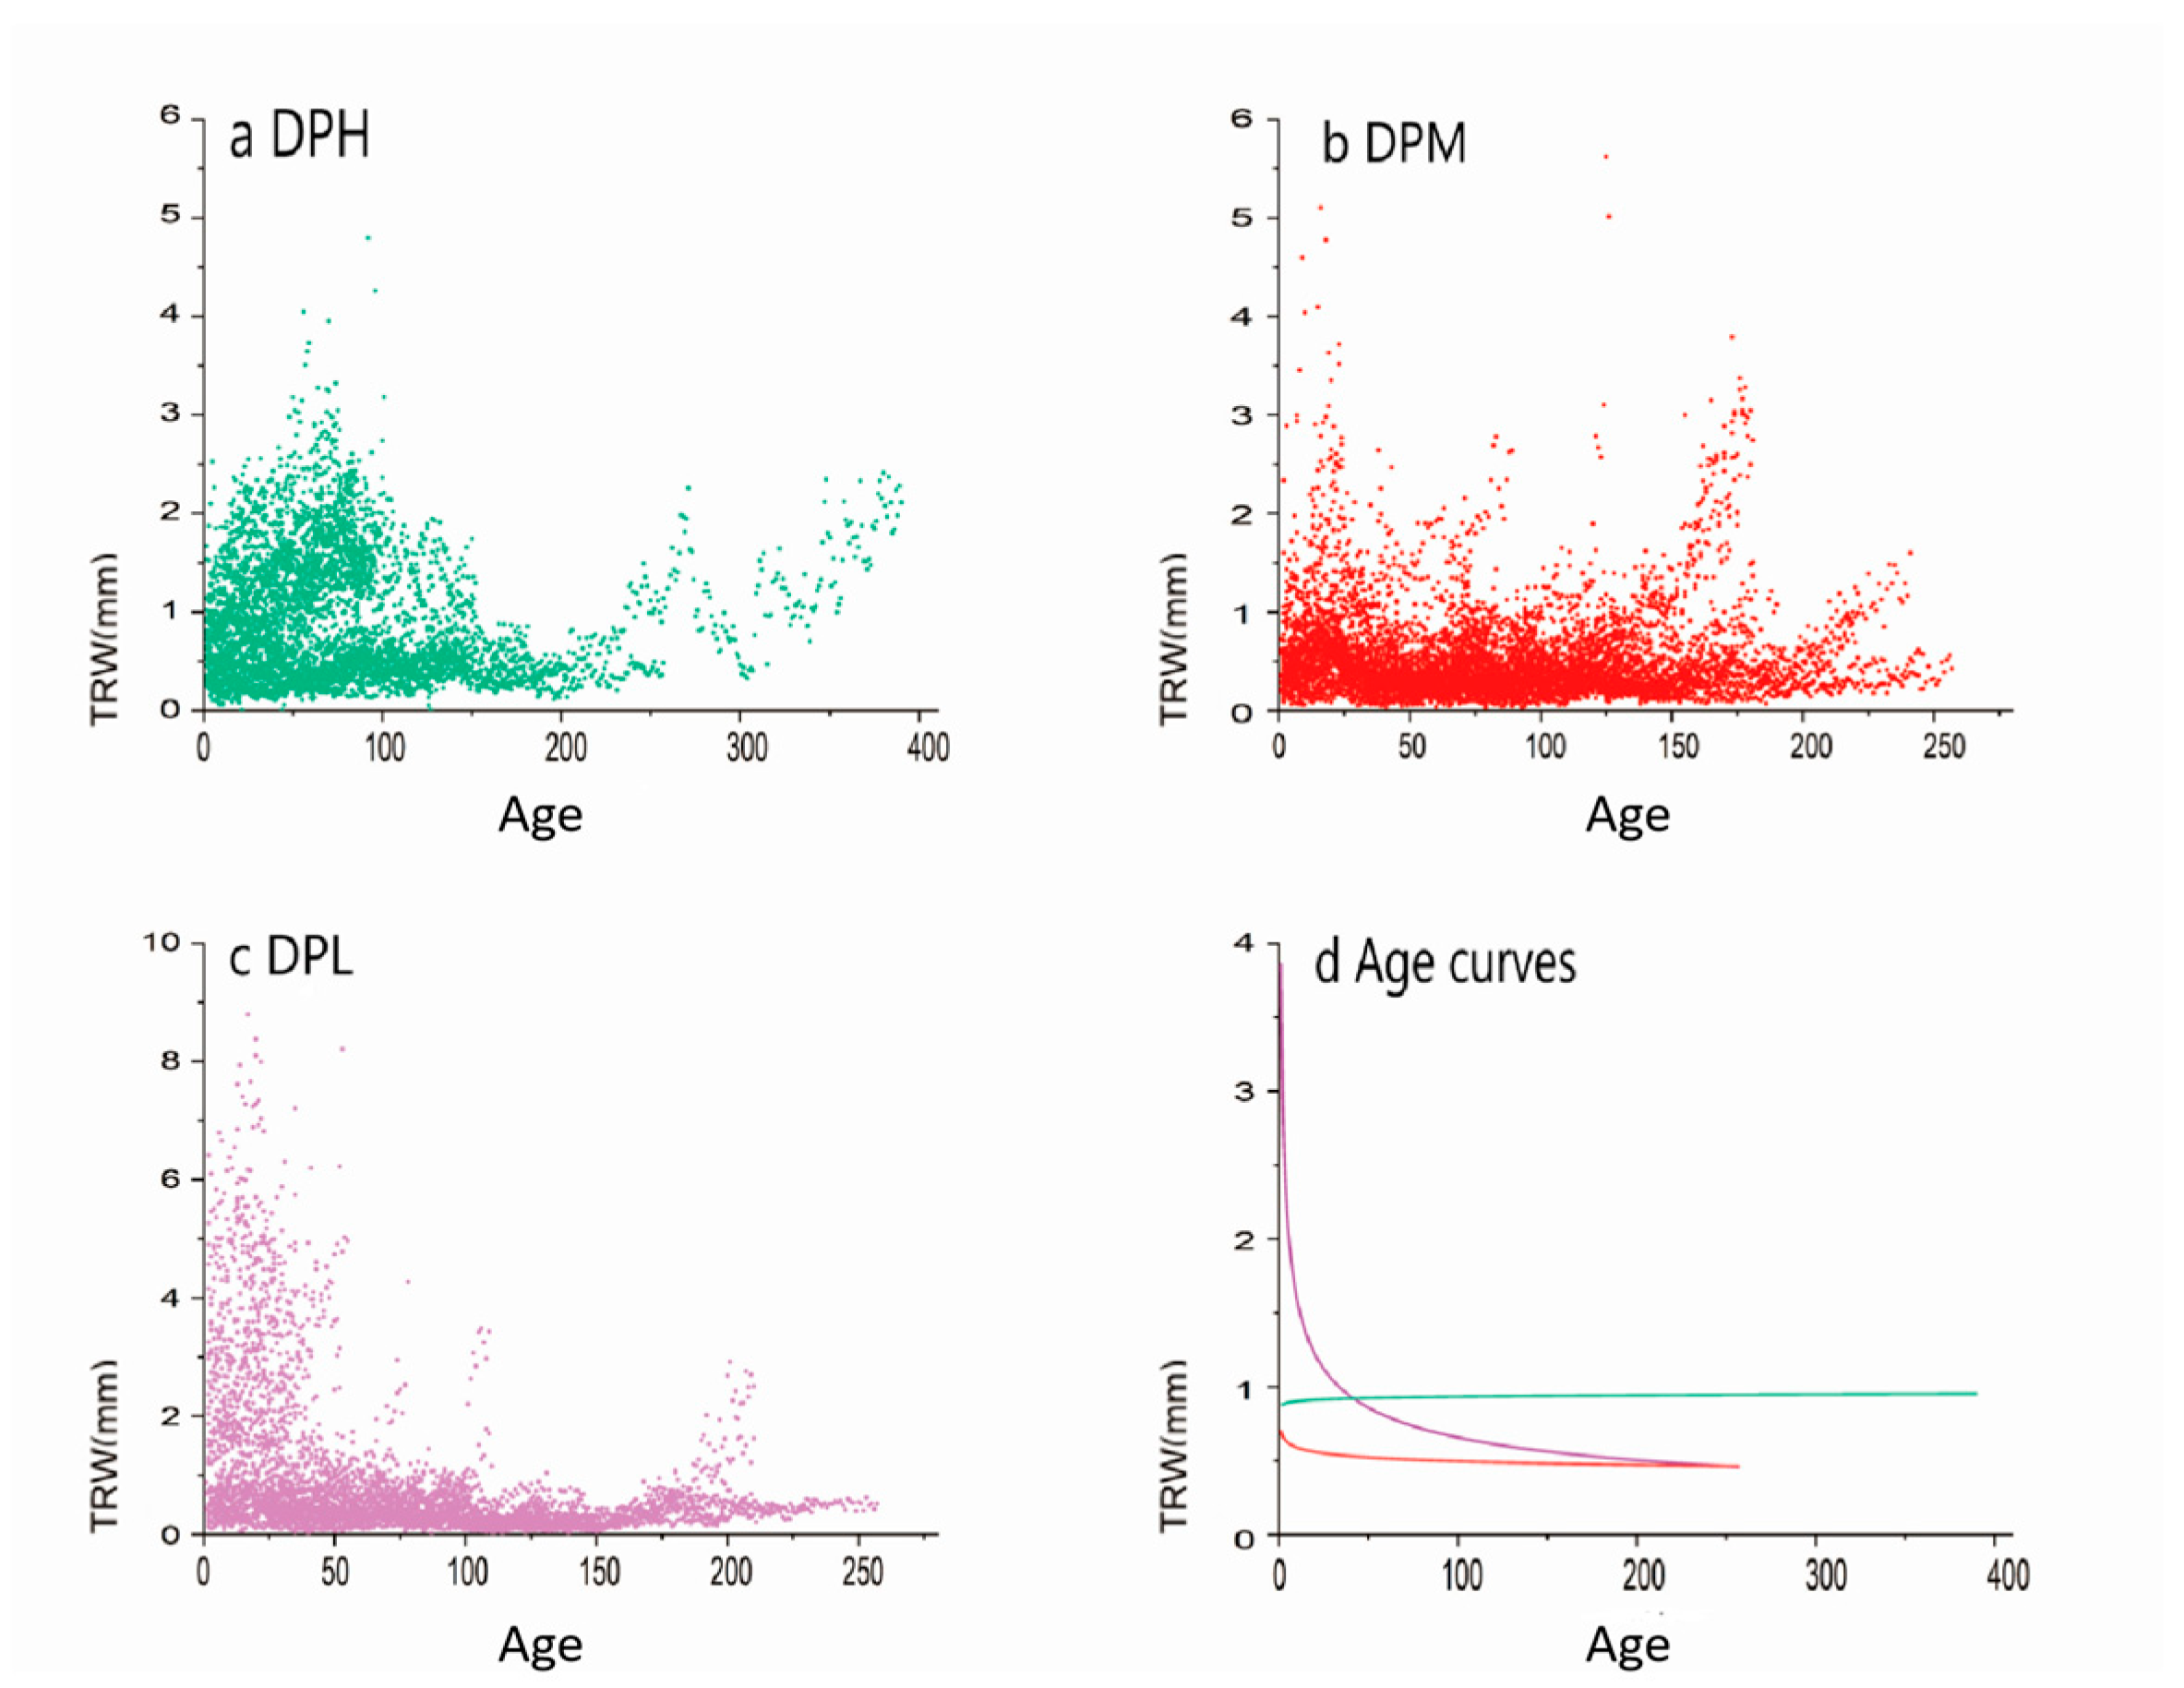
3.1. Tree-Ring Width Chronologies and Statistics

There were significant differences in the growth rates and age composition among chronologies of various elevation gradients. The age of P. likiangensis trees increased with elevation. The average age of trees across all P. likiangensis stands ranged from 108 to 145 years; the youngest tree (22 years old) was found at the lower elevation stand (DPL) while the oldest tree (389 years old) was found at the high-elevation site (DPH). Because many of the standing trees with large diameters at the DPH are rotten inside, the length of the chronologies does not accurately reflect the age of the old-growth fir forests at the DPH. The average annual radial growth rate was found to decrease with increasing age at the DPL; however, it did not change significantly at the DPM and DPH (Figure 4).
To retain more signals [48], the STD chronologies, established by the negative exponential regression function detrending method, were selected for subsequent analysis (Figure 5). The correlation analysis of the STD chronologies of P. likiangensis growing at three different elevations showed that the TRI variation at the DPL and DPM had a high degree of agreement, with correlations exceeding the 99% significance level (r = 0.673). In contrast, the TRI variation at the DPH differed significantly from those at both the DPM and DPL, with lower correlations (r = 0.171 and r = 0.149, respectively, p > 0.01) (Table S1). This phenomenon indicated that the growth of P. likiangensis at the DPL and DPM is likely governed by similar climatic factors due to the consistent TRI observed in trees at the DPL and DPM. In contrast, radial growth at the DPH appears to be influenced by climatic factors distinct from those affecting the DPL and DPM.
It can be observed that most statistical parameters (including M.S., EPS, SNR, WTR, and BTR) at the DPM exhibited a higher value than the other two sites (DPH, DPL), indicating that coherence among the tree-ring width series at the middle altitudes are better than that of the high altitudes and the low altitudes (Table 2). The AC1 values for all the sampling sites are high, indicating that there are strong climatic lag-effects [10]. Despite the differences in the chronological characteristics of the data at different elevations, all the above data indicated that the P. likiangensis growing at different elevations in the study area contain more environmental information and can be used for dendroclimatological research. As to the other species, the EPS of them was below the threshold of 0.85 (Table 2), which showing that there was no reliable signal contained in S. saltuaria and A. squamata chronologies. The M.S., SNR, and EPS of the P. likiangensis were higher than those of S. saltuaria and A. squamata, indicating that the annual ring index of P. likiangensis contains more environmental information and is more suitable for the study of dendrochronology.

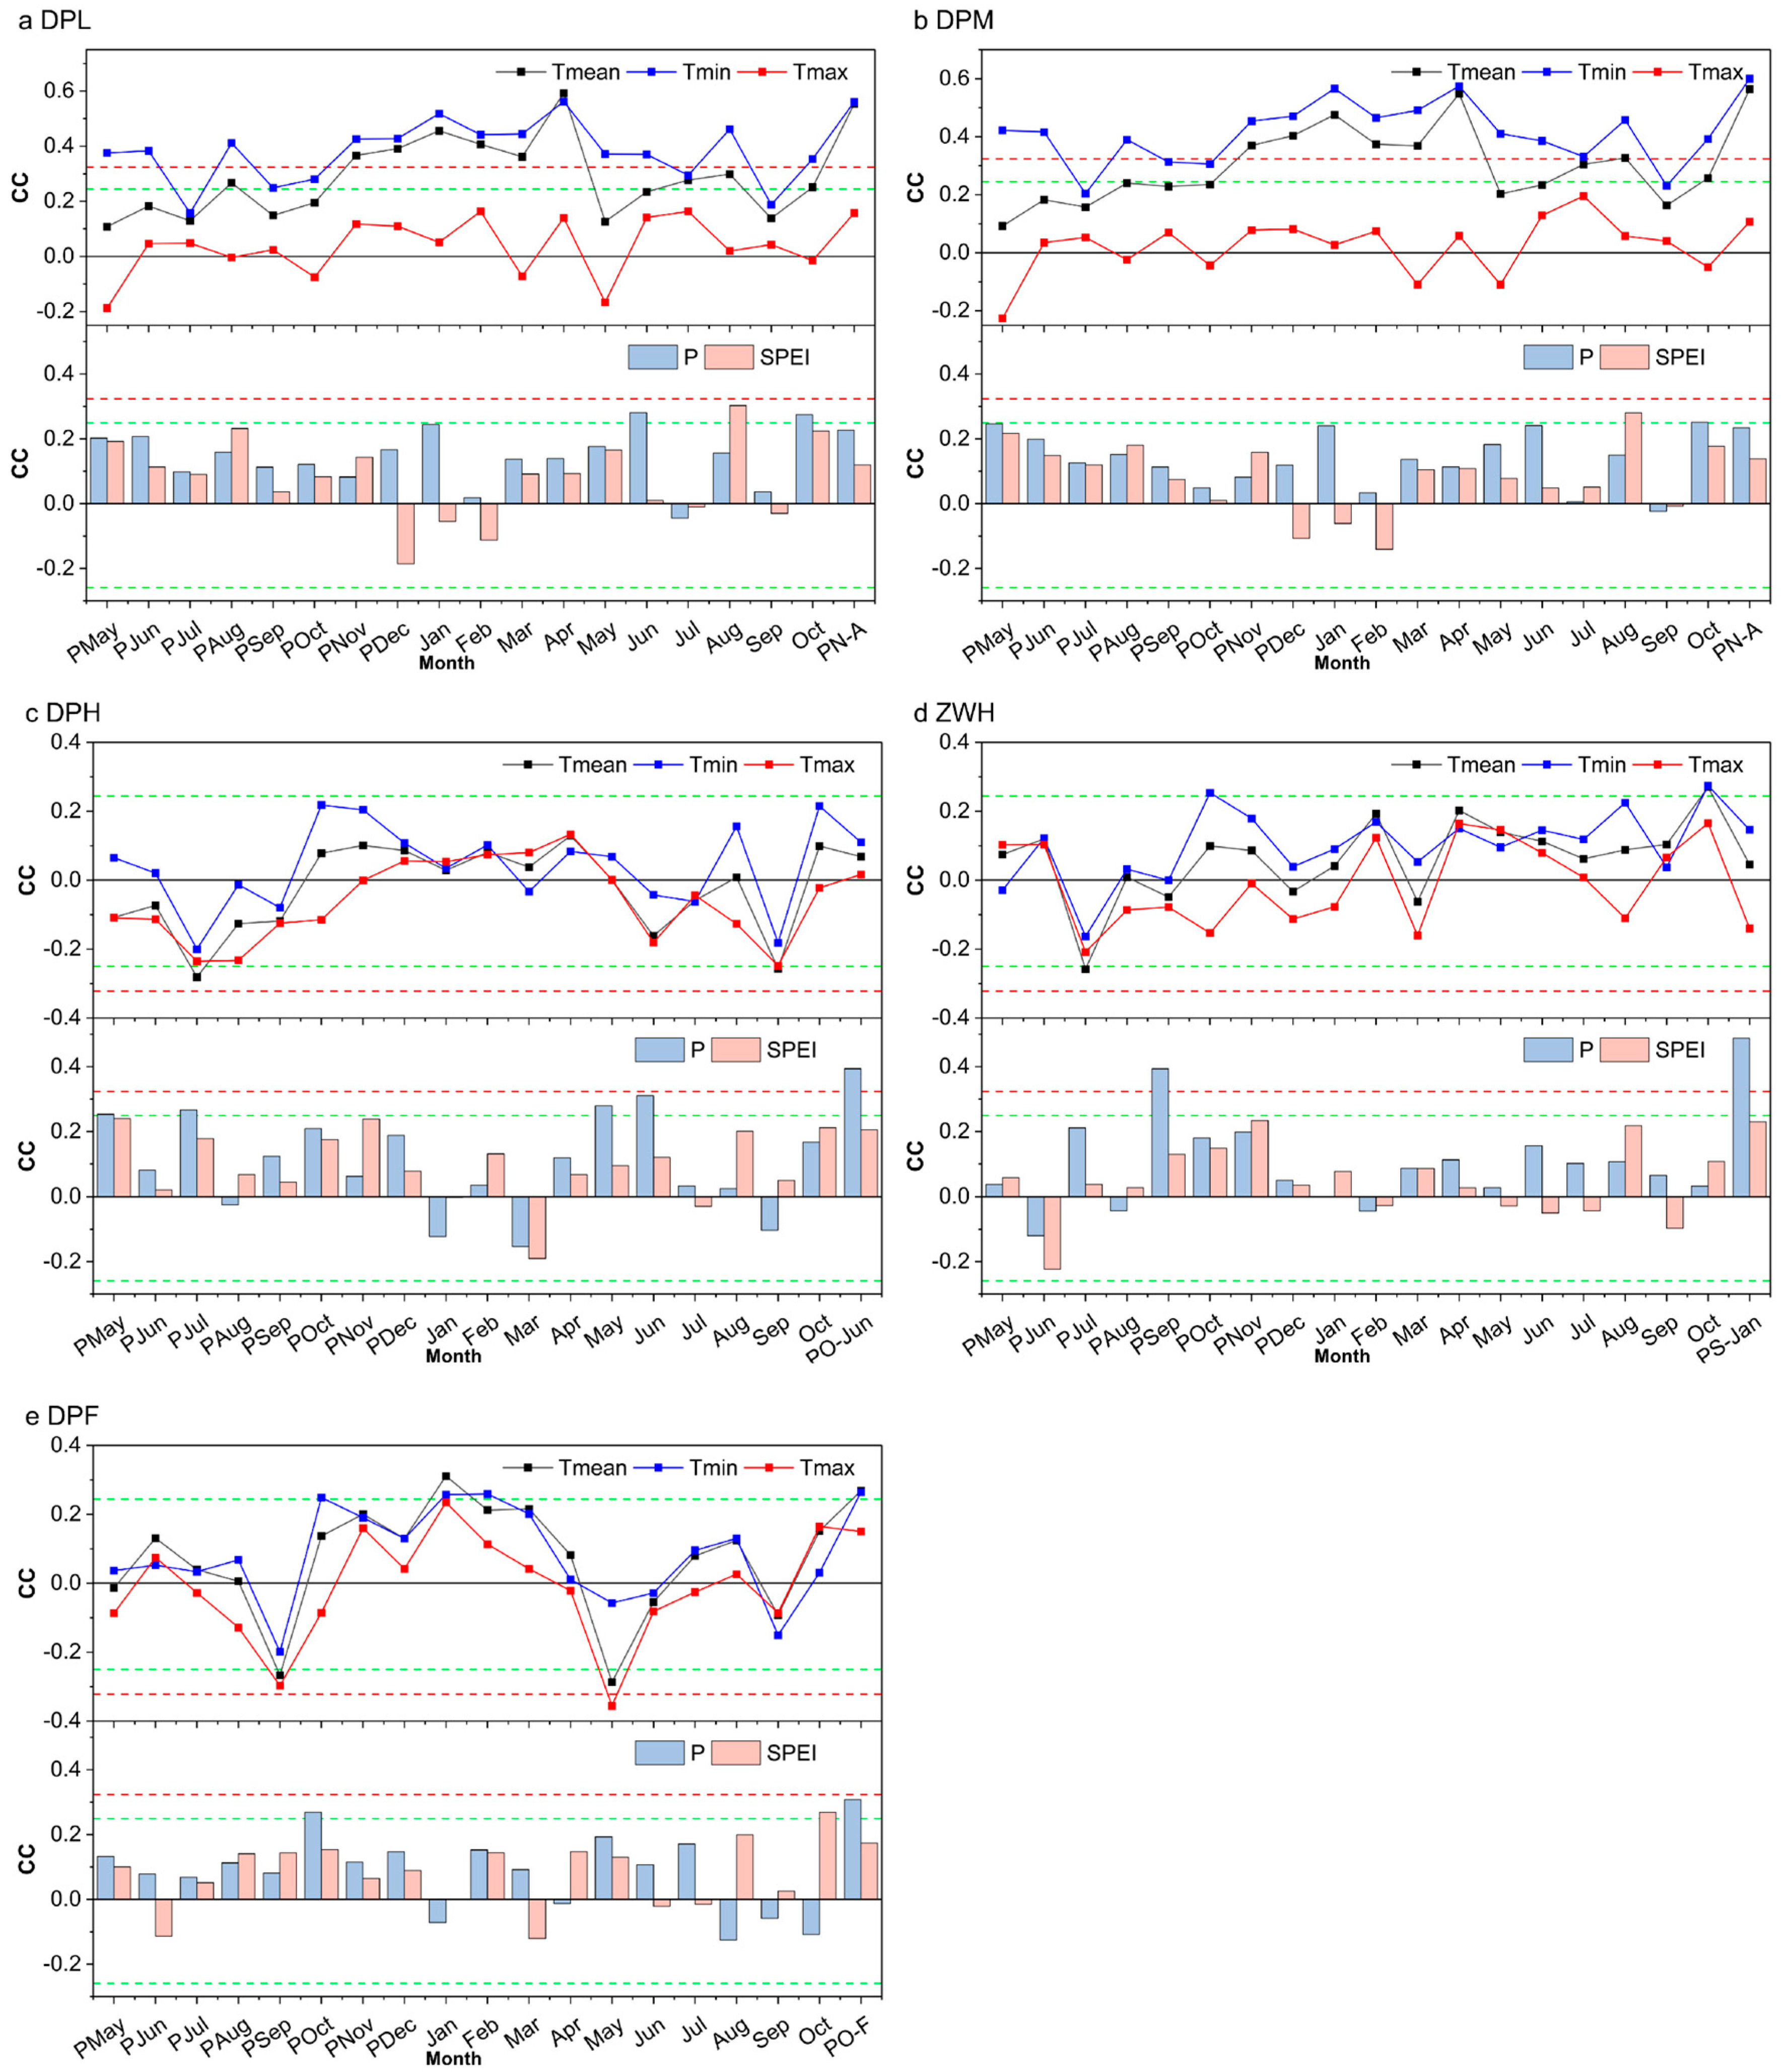
3.2. Response to Climatic Condition

Given the lag-effect of the climate on radial tree growth, we selected meteorological data from the beginning of the previous year’s growing season to the end of the current year’s growing season (previous May to current October) for dendroclimatic analysis. The tree radial growth of P. likiangensis showed positive correlations with mean temperature and mean minimum temperature at the DPL and DPM during the winter and spring months, and it showed positive correlations with the SPEI and negative correlations with the mean maximum temperature at the DPH during the summer months. The results regarding the TRI’s response to climatic factors is shown in Figure 6.
On the monthly scale, the DPL and DPM indicated that the growth of trees is significantly positively responsive to most of the temperature parameters (Tmean, Tmin) during the previous and last winter (Dec., Jan., Feb.) and spring (Mar., Apr., May) months, although the magnitude and intensity of the correlation coefficients varied; they were all significant at the 99% confidence level. In contrast, the influence of precipitation on the growth of P. likiangensis at the DPL and DPM was minimal. The DPL showed a positive correlation with precipitation in the current June and October, but the correlation coefficients were not significant (Figure 6a), and the DPM did not show any relationships with precipitation from the previous and current year. In addition, the DPL and DPM relationship with the SPEI only showed a positive correlation in August, but the significance did not reach the 99% confidence level (Figure 6b). For the high-altitude sites, the DPH showed significantly positive responses to precipitation in the early growing season (from May to July) at the 99% confidence level (Figure 6c).
The results of the Pearson correlation analyses conducted on seasonal and annual scales indicate a significant positive correlation between radial tree growth and Tmin across all time periods, both during the growing season and throughout the year. The highest correlation between the DPL and temperature parameters occurred in the previous November to the current August (PNov-CAug), especially for Tmin (r = 0.560, p < 0.01) (Figure 6a, Supplemental Figure S2), and the same results were also found for the DPM (r = 0.600, p < 0.01) (Figure 6b, Supplemental Figure S3). The correlation coefficient values for precipitation were significantly lower than those for temperature, although the DPL showed positive correlations with precipitation from the previous October to the current July (r = 0.356, p < 0.01) (Supplemental Figure S2), and the DPM showed strong positive correlations with precipitation from the previous May to the current April (r = 0.321, p < 0.01) (Supplemental Figure S3). When it comes to the high-altitude site, the DPH showed a significantly positive correlation with the SPEI (PMay-PDec, r = 0.341, p < 0.01) and precipitation (POct-CJun, r = 0.394, p < 0.01) (Figure 6c, Supplemental Figure S4).
Though the EPS of S. saltuaria and A. squamata chronology did not reach the level of 0.85, we still analyzed the relationship between the TRI and climate factors to verify whether the radial growth of different tree species growing in the same region is controlled by the same climatic factors. At the DPF, tree growth showed a significant positive correlation with precipitation in the previous October, whereas a significant negative correlation with Tmax was observed in the current May (r = 0.355, p < 0.01) (Figure 6e). At the seasonal and annual scale, the DPF has a positive correlation with the precipitation in the previous October to the current February (POct-CFeb, r = 0.308, p < 0.05) (Figure 6e, Supplemental Figure S5). As for ZWH, the result of the correlation analysis showed that the radial growth of A. squamata is limited by the precipitation during the current September (r = 0.393, p < 0.01). At the seasonal and annual scale, ZWH has a positive correlation with the precipitation during the previous October to the current February (POct-CFeb, r = 0.308, p < 0.05) (Figure 6d, Supplemental Figure S6).

4. Discussion

4.1. Climate–Growth Relationships along the Altitudinal Gradient

All detected correlations between the radial growth of P. likiangensis and climate data were not significantly associated with the elevation gradients; thus, the influence of altitude on tree growth was not uniform in the STP. In our research, both temperature and precipitation were identified as main factors affecting tree growth, with effects varying according to altitude and tree species. Similar results were also found in previous studies [9,19,49,50,51]. At higher elevations, the radial growth of P. likiangensis was mainly limited by precipitation, whereas at middle and lower elevations, temperature played a dominant role in ring width formation. This finding contradicts the general principle of limiting factors, according to which it is generally believed that a tree species is mainly affected by temperature at their upper altitudinal limits and by precipitation at their lower limits [17,18,51,52]. However, similar phenomena have been observed in some other areas of the STP, and these phenomena can be explained by the knowledge of tree physiology.
The Tmin from the previous November to the current August (PNov-CAug) was a dominant factor influencing the radial growth of P. likiangensis at lower and middle altitudes. This climatic response model was typical in many areas of the central Hengduan Mountains (HM) [53], the STP [54,55,56], and the central Himalayas [14,22]. The same climatic response model was also found in other regions [57]. For example, at Balang mountain in the Wolong Natural Reserve (Western Sichuan Province, China), the radial growth of Picea brachytyla var. complanate showed a general positive correlation with the temperature of all months from November of the prior growth year to October of the current growth year [53]. The study conducted by Keyimu et al. [56] also showed that the annual Tmin was the key climatic factor influencing radial tree growth in conifer species at 98 sites in the STP. So, the significant positive correlation between PNov-CAug Tmin and local tree growth is reasonable. During the summer, Tmin influences the division and enlargement of cells and influences xylem lignification [58,59]. Thus, Tmin, which is frequently measured at night, is significant for radial tree growth because xylem lignification occurs primarily at night [56]. Low summer soil temperature can limit the growth of roots and their function in water uptake, and hence limit the tree growth in our study area. A cold August may lead to an early cessation of tree growth and a reduction in the rate of cell division, consequently reducing tree-ring widths. In contrast, a warm August may lead to a longer growing season and may still allow the formation of latewood cells [10]. For instance, Zhu et al. [39] found that low temperatures in August were the primary factor limiting the growth of P. likiangensis, which grew in the eastern part of the Nyainqentanglha Mountains. A positive effect of the summer minimum temperature on tree growth was also reported for the entire TP [60,61,62,63]. A warm climate in the spring has a significantly positive effect on tree growth; higher spring temperatures can lengthen the growing season by breaking dormancy in advance, boosting the advanced division of tree cambium cells [24,64], and increasing leaf area to increase the photosynthetic rate [65]. It is found that the tree growth in the surrounding areas of our study site were also positively limited by spring temperature [33,51]. A warm winter may protect the needles from frost damage, prevent root damage caused by freezing embolism, and maintain the roots in a photosynthetically active state for the next year [66]. However, in a cold winter, the soil from a deep layer of frost can delay the time of thawing and shorten the growing season, resulting in the formation of narrow rings [14,67]. This can explain why the TRI in the DPL and DPM show a notable positive correlation with the last winter. The positive correlation between radial growth and winter temperatures in the central HM was also supported by previous studies [23,34,68].
In contrast, at high elevations, the radial growth of P. likiangensis was mainly limited by precipitation during the period between the end of the last growing season and the beginning of this growing season. Generally, a tree species is mainly affected by temperature at its upper altitudinal limit since the temperature drops at a rate of 0.6 °C per 100 m of elevation gain as the altitude rises. However, in our study region, the radial growth of P. likiangensis, S. saltuaria, and A. squamata were all positively associated with precipitation and the SPEI, and negatively associated with the maximum temperature. Gou et al. [69] found that the tree growth of Abies forrestii Coltm., which grew in Xiangcheng, central HM, was also significantly positively associated with precipitation during the previous September to the current June. This phenomenon was also found in the central Himalayas. Liang et al. [70] found that in the central Himalayas, precipitation decreases with increasing elevation. Thus, trees growth at high altitudes in this area was mainly limited by moisture stress rather than temperatures [22]. But in our research, according to the data acquired from automatic weather stations (HOBO U30, USA), on some days the relative humidity (RH) in the DPL was higher than that in the DPH (Figure 7). So, the question of why the growth of P. likiangensis, S. saltuaria, and A. squamata at high altitudes was mainly constrained by precipitation and the SPEI needs further study. Therefore, we discuss some possible reasons in the next section. In the future, further monitoring is needed to test the reliability of this conclusion.

4.2. Factors May Influence Growth Response to Climate Change

Although there are now many studies that have reached conclusions which do not agree well with the general principle of limiting factors, none of them have explained the reasons for this difference. Therefore, in this paper, we grouped possible reasons into two categories. The first possible reason concerns the stand conditions (wind speeds, slope, elevation, etc.). The altitude of our research area ranged from 3600 to 4400 m, which is much higher than other study sites; thus, the temperature is lower than that in other study areas, which caused the tree growth in a relative lower elevation area to show a significant positive relationship with the temperature (DPL, DPH). The increase in the elevation and hydrothermal combination gradually changed and caused the change in the ring width–climate relationship. Wind speeds are higher at high-elevation sites in the STP [24], and the wind speed data acquired from automatic weather stations showed that the wind speeds at the DPH are approximately twice as high as those at the DPL, but precipitation at the two sites is roughly equal (Figure 7). High wind speeds and increasing evapotranspiration can cause drought stress, which occurred in the dry season. In addition, the slope in our sampling site at high elevations is greater than that in middle and low elevations; thus, a lot of precipitation is lost in the form of runoff. Therefore, precipitation and the SPEI became the main climatic factors to influence tree growth in high-elevation areas (DPH, DPF, ZWH).
The second possible reason concerns the biotic factors (the depth of root, forest type, tree age, and sensitivity, etc.). P. likiangensis is a shallow-rooted plant which is more susceptible to frost damage [71]. Thus, in the DPL and DPM, the ring growth of P. likiangensis is tightly correlated with temperature. Different forest types, such as open, closed, and mixed forests, significantly influence how trees respond to climatic variables. All five sites studied in this research are categorized as open forests, which have been observed to be more sensitive to temperature fluctuations compared to closed forests [72]. Unlike the DPL and DPM, the DPH is a mixed forest, where interactions between various tree species can modify responses to climate change [73]. This also explains one possible reason for the variation in the relationship between the TRI and climate along different altitudes. As to the age of trees, we can see that at the DPL, the age of these trees is relatively younger compared to the age of trees at the DPM and DPH, and there is no decay inside trees collected in the DPL. At the DPM and DPH, the interior of the older trees had decayed. As a result, the samples could not reflect the true age of the whole trees in the DPM and DPH. However, the age of the tree can be deduced by its trunk diameter and height [74]. In the DPH, both the trunk diameter and height of the trees are significantly larger than those in the DPL. So, there is no doubt that trees growing at higher altitudes are older than trees growing at lower altitudes (Figure 3). The age of trees plays a crucial role in their response to climate change. For example, the basal area increments (BAIs) of trees, which are influenced by tree size and age, have a negative correlation with the tree-ring mean sensitivity [75]. Many other studies have also verified that the age of trees can affect the M.S. of radial growth, with the radial growth of older trees being more sensitive to climate change than younger trees [76,77,78]. In addition, large trees have different physiological characteristics compared to intermediate trees [79]. So, the age of trees may play a significant role in the changes in the ring width–climate relationship with altitude.
Previous studies indicated that M.S. is a measure of year-to-year growth variability, which is generally considered to reflect the growth sensitivity to high-frequency climate variability; and S.D. reflects the multi-decadal growth variability in a chronology related to low-frequency climate variability [10,80,81]. Therefore, these two indicators can be seen as an aspect of growth variability. The M.S., S.D., SNR, and EPS of chronology were key indicators to test the reliability of the chronology and strength of the climate signal contained in TRW (Table 2). In this study, we found that along the studied elevation gradient, these parameters all displayed a wave-like tendency of increasing and then decreasing values. A similar trend was reported in other studies conducted in the STP and other places in China [14,22,23,34,82,83]. For instance, in Naqu, southern TP, He et al. [23] sampled increment cores of Juniperus tibetica at four elevations along altitudinal transects from 4000 to 4500 m a.s.l.; the results of this study showed that the values of SNR, EPS, and M.S. were the lowest in the high juniper belt and the highest in the mid-high juniper belt. Panthi et al. [34] developed tree-ring width chronologies of Abies georgei along elevation gradients from 3900 to 4400 m a.s.l. in the central HM and the values of M.S. and SNR were the highest in middle elevation areas. The same result was also observed in the central Himalayas; the chronology of Abies spectabilis showed that M.S. and EPS all reach their highest values in middle elevation areas [14,22]. Our results confirmed that the chronology of P. likiangensis growth at middle elevation sites has the highest M.S., S.D., EPS, and SNR. Compared with the research conducted in the STP, we found that the highest value of these indictors was usually found in 4000–4200 m a.s.l. This result suggested that mutual disturbance and competition among trees within the forest has an effect on the ability for trees to respond to climate change [83]. Although these parameters displayed a wave-like tendency, their high values indicate that the three chronologies all contain strong climatic signals and are suitable to reveal tree growth–climate relationships. In future studies, we can choose suitable sites for sampling based on the meteorological factors that need to be reconstructed.

5. Conclusions

In this study, significant differences in the growth rates and age composition of P. likiangensis were observed at various elevation gradients. Specifically, the average annual radial growth rate of P. likiangensis decreased with age at lower altitudes but remained stable at middle and higher altitudes, while tree age increased with elevation. The present study confirmed that the growth parameters of tree species, such as M.S., S.D., SNR, and EPS, all displayed fluctuation tendencies. Temperature and precipitation were the main factors affecting the tree growth on the Haizi Mountain, with their effects varying by altitude. The Tmin from the previous November to the current August was the dominant factor influencing the radial growth of P. likiangensis at low and middle altitudes. At high altitudes, precipitation from the last growing season to the beginning of this growing season were the dominant factors. The precipitation during the last autumn and last winter (POct-CMar) was the main factor to limit the growth of S. saltuaria, and the precipitation during the last autumn (PSep-PDec) was the main factor limiting the growth of A. squamata. Stand conditions (wind speeds, slope, elevation, etc.) and biotic factors (the depth of root, forest type, tree age, sensitivity, etc.) can explain the changes in ring width–climate relationships with the altitude. These results provide a sampling basis for reconstructing climate factors in the future and enhance the understanding of the impacts of climate change on forest ecosystems in the STP.

Supplementary Materials

The following supporting information can be downloaded at: https://www.mdpi.com/article/10.3390/f15071265/s1, Figure S1: The surrounding of our five sample sites; Figure S2: The correlation coefficients between tree-ring widths index in DPL and multi-monthly variations of mean minimum temperature (Tmin) and precipitation (P) from previous May to current October. The y-axis numbers represent multi-month combinations (e.g., 2 represents the mean data from P May. to P Jun., 12 represents the mean data from P May. to C Apr.); Figure S3: The correlation coefficients between tree-ring widths in DPM and multi-monthly variations of mean minimum temperature (Tmin) and precipitation (P) from previous May to current October. The y-axis numbers represent multi-month combinations (e.g., 2 represents the mean data from P May. to P Jun., 12 represents the mean data from P May. to C Apr.); Figure S4: The correlation coefficients between tree-ring widths in DPH and multi-monthly variations of precipitation temperature from previous May to current October. The y-axis numbers represent multi-month combinations (e.g., 2 represents the mean data from P May. to P Jun., 12 represents the mean data from P May. to C Apr.); Figure S5: The correlation coefficients between tree-ring widths in ZWH and multi-monthly variations of precipitation temperature from previous May to current October. The y-axis numbers represent multi-month combinations (e.g., 2 represents the mean data from P May. to P Jun., 12 represents the mean data from P May. to C Apr.); Figure S6: The correlation coefficients between tree-ring widths in DPF and multi-monthly variations of precipitation temperature from previous May to current October. The y-axis numbers represent multi-month combinations (e.g., 2 represents the mean data from P May. to P Jun., 12 represents the mean data from P May. to C Apr.); Table S1: Correlation coefficient of tree ring standard chronologies in different altitude and detrending method; Table S2: Correlation coefficient of tree ring standard chronologies in different species and detrending method.

Author Contributions

All authors contributed to the study conception and design. Material preparation and data collection were performed by S.X., C.Z., Z.Z. (Zhigang Zhang), X.K. and Z.Z. (Zhijun Zhao), data analysis was performed by S.X. and Z.S. The first draft of the manuscript was written by S.X., Z.S. and Z.Z. (Zhijun Zhao) is responsible for polishing the entire text and correcting grammar errors. All authors commented on previous versions of the manuscript. All authors have read and agreed to the published version of the manuscript.

Funding

This research was funded by the National Natural Science Foundation of China (41971009), the Strategic Priority Research Program (A) of the Chinese Academy of Sciences (XDA20100300); and the Second Tibetan Plateau Scientific Expedition Program (STEP) (2019QZKK0205).

Data Availability Statement

The datasets generated during and/or analyzed during the current study are available from the corresponding author on reasonable request.

Acknowledgments

We gratefully acknowledge all the staff of Nature Reserve Management Unit of the Forestry and Grassland Bureau of Daocheng County. Thanks to other members of our team for their help during sampling.

Conflicts of Interest

The authors declare no conflicts of interest.

References

  1. Pepin, N.; Bradley, R.S.; Diaz, F.; Baraer, M.; Caceres, E.B.; Forsythe, N.; Fowle, H.; Greenwood, G.; Hashmi, M.Z.; Liu, X.D.; et al. Mountain Research Initiative EDW Working Group. Elevation-dependent warming in mountain regions of the world. Nat. Clim. Chang. 2015, 5, 424–430. [Google Scholar] [CrossRef]
  2. Guerrero-Hernández, R.; Muñiz-Castro, M.Á.; Villanueva-Díaz, J.; Hernández-Vera, G.; Vázquez-García, J.A.; Ruiz-Corral, J.A. Tree-Ring Patterns and Growth Response of Abies jaliscana to Climate along Elevational Gradients in the Mountains of Western Jalisco, Mexico. Forests 2022, 13, 981. [Google Scholar] [CrossRef]
  3. LaMarche, V.C. Frequency-dependent relationships between tree-ring series along an ecological gradient and some dendro- climatic implications. Tree-Ring Bull. J. Ecol. 1974, 90, 68–77. [Google Scholar]
  4. Thomas, S.C. Genetic vs. phenotypic responses of trees to altitude. Tree Physiol. 2011, 31, 1161–1163. [Google Scholar] [CrossRef] [PubMed]
  5. Allen, C.D.; Breshears, D.; McDowell, N.G. On underestimation of global vulnerability to tree mortality and forest die-off from hotter drought in the Anthropocene. Ecosphere 2015, 6, art129. [Google Scholar] [CrossRef]
  6. Yang, B.; He, M.; Shishov, V.; Tychkov, I.; Vaganov, E.; Rossi, S.; Ljungqvist, F.C.; Bräuning, A.; Grießinger, J. New perspective on spring vegetation phenology and global climate change based on Tibetan Plateau tree-ring data. Proc. Natl. Acad. Sci. USA 2017, 114, 6966–6971. [Google Scholar] [CrossRef] [PubMed]
  7. IPCC. Summary for Policymakers. In Climate Change 2021: The Physical Science Basis. Contribution of Working Group I to the Sixth Assessment Report of the Intergovernmental Panel on Climate Change 2021; IPCC: Geneva, Switzerland, 2021. [Google Scholar]
  8. Körner, C. The use of ‘altitude’ in ecological research. Trends Ecol. Evol. 2007, 22, 569–574. [Google Scholar] [CrossRef]
  9. Salzer, M.W.; Larso, E.R.; Bunn, A.G.; Hughes, M.K. Changing climate response in near-treeline bristlecone pine with elevation and aspect. Environ. Res. Lett. 2014, 9, 114007. [Google Scholar] [CrossRef]
  10. Fritts, H.C. The statistics of ring-width and climatic data. In Tree Rings and Climate; Academic Press: London, UK, 1976; pp. 246–311. [Google Scholar]
  11. Arias, N.S.; Scholz, F.G.; Goldstein, G.; Bucci, S.J. Low-temperature acclimation and legacy effects of summer water deficits in olive freezing resistance. Tree Physiol. 2021, 41, 1836–1847. [Google Scholar] [CrossRef]
  12. Louthan, A.M.; Doak, D.F.; Angert, A.L. Where and When do Species Interactions Set Range Limits? Trends Ecol. Evol. 2015, 30, 780–792. [Google Scholar] [CrossRef]
  13. Conlisk, E.; Castanha, C.; Germino, M.J.; Veblen, T.T.; Smith, J.M.; Kueppers, L.M. Declines in low-elevation subalpine tree populations outpace growth in high-elevation populations with warming. J. Ecol. 2017, 105, 1347–1357. [Google Scholar] [CrossRef]
  14. Gaire, N.P.; Fan, Z.; Bräuning, A.; Panthi, S.; Rana, P.; Shrestha, A.; Bhuju, D.R. Abies spectabilis shows stable growth relations to temperature, but changing response to moisture conditions along an elevation gradient in the central Himalaya. Dendrochronologia 2020, 60, 125675. [Google Scholar] [CrossRef]
  15. Fritts, H.C. Tree-ring evidence for climatic changes in western North America. Mon. Weather Rev. 1965, 93, 421–443. [Google Scholar] [CrossRef]
  16. Körner, C. Alpine Treelines: Functional Biology of the Global High Elevation Tree Limits; Springer: Basel, Switzerland, 2012. [Google Scholar]
  17. Leal, S.; Melvin, T.M.; Grabner, M.; Wimmer, R.; Briffa, K.R. Tree-ring growth variability in the Austrian Alps: The influence of site, altitude, tree species and climate. Boreas 1996, 15, 426–440. [Google Scholar] [CrossRef]
  18. Dittmar, C.; Zech, W.; Elling, W. Growth variations of Common beech (Fagus sylvatica L.) under different climatic and environmental conditions in Europe—A dendroecological study. For. Ecol. Manag. 2003, 173, 63–78. [Google Scholar] [CrossRef]
  19. Savva, Y.; Oleksyn, J.; Reich, P.B.; Tjoelker, M.G.; Vaganov, E.A.; Modrzynski, J. Interannual growth response of Norway spruce to climate along an altitudinal gradient in the Tatra Mountains, Poland. Trees 2006, 20, 735–746. [Google Scholar] [CrossRef]
  20. Fan, Z.; Bräuning, A.; Cao, K. Annual temperature reconstruction in the central Hengduan Mountains, China, as deduced from tree rings. Dendrochronologia 2008, 26, 97–107. [Google Scholar] [CrossRef]
  21. Panthi, S.; Fan, Z. Long-term physiological and growth responses of Himalayan fir to environmental change are mediated by mean climate. Glob. Chang. Biol. 2019, 17, 1778–1794. [Google Scholar] [CrossRef]
  22. Rai, S.; Dawadi, B.; Wang, Y.; Lu, X.; Ru, H.; Sigdel, S.R. Growth response of Abies spectabilis to climate along an elevation gradient of the Manang valley in the central Himalayas. J. For. Res. 2020, 31, 2245–2254. [Google Scholar] [CrossRef]
  23. He, M.; Yang, B.; Bräuning, A. Tree growth–climate relationships of Juniperus tibetica along an altitudinal gradient on the southern Tibetan Plateau. Trees 2013, 27, 429–439. [Google Scholar] [CrossRef]
  24. Liang, E.; Wang, Y.; Xu, Y.; Liu, B.; Shao, X. Growth variation in Abies georgei var. smithii along altitudinal gradients in the Sygera Mountains, southeastern Tibetan Plateau. Trees 2010, 24, 363–373. [Google Scholar] [CrossRef]
  25. Babushkina, E.; Belokopytova, L.; Zhirnova, D.; Barabantsova, A.; Vaganov, E. Divergent growth trends and climatic response of Picea obovata along elevational gradient in Western Sayan mountains, Siberia. J. Mt. Sci. 2018, 15, 2378–2397. [Google Scholar] [CrossRef]
  26. Fan, Z.; Bräuning, A.; Thomas, A.; Li, J.; Cao, K. Spatial and temporal temperature trends on the Yunnan Plateau (Southwest China) during 1961–2004. Int. J. Climatol. 2011, 31, 2078–2090. [Google Scholar] [CrossRef]
  27. Bohner, J. General climatic controls and topoclimatic variations in Central and High Asia. Boreas 2006, 35, 279–295. [Google Scholar] [CrossRef]
  28. Liang, E.; Shao, X.; Xu, Y. Tree-ring evidence of recent abnormal warming on the southeast Tibetan Plateau. Theor. Appl. Climatol. 2009, 98, 9–18. [Google Scholar] [CrossRef]
  29. Yang, B.; Kang, X.; Liu, J.; Bräuning, A.; Qin, C. Annual temperature history in Southwest Tibet during the last 400 years recorded by tree rings: Annual Temperature History in Southwest Tibet. Int. J. Climatol. 2010, 30, 962–971. [Google Scholar] [CrossRef]
  30. Wang, J.; Yang, B.; Qin, C.; Kang, S.; He, M.; Wang, Z. Tree-ring inferred annual mean temperature variations on the southeastern Tibetan Plateau during the last millennium and their relationships with the Atlantic Multidecadal Oscillation. Clim. Dyn. 2014, 43, 627–640. [Google Scholar] [CrossRef]
  31. Lv, L.; Zhang, Q. Tree-ring based summer minimum temperature reconstruction for the southern edge of the Qinghai-Tibetan Plateau, China. Clim. Res. 2013, 56, 91–101. [Google Scholar] [CrossRef]
  32. Zou, L.; Xu, S.; Zheng, C. Relationship between the tree ring width of Sabina saltuaria and climate factors in Haizi Mountain, Daocheng, Sichuan. J. Glaciol. Geocryol. 2021, 43, 917–927. (In Chinese) [Google Scholar]
  33. Li, Z.; Liu, G.; Fu, B.; Hu, C.; Luo, S.; Liu, X.; He, F. Anomalous temperature–growth response of Abies faxoniana to sustained freezing stress along elevational gradients in China’s Western Sichuan Province. Trees 2012, 26, 1373–1388. [Google Scholar] [CrossRef]
  34. Panthi, S.; Bräuning, A.; Zhou, Z.K.; Fan, Z. Growth response of Abies georgei to climate increases with elevation in the central Hengduan Mountains, southwestern China. Dendrochronologia 2018, 47, 1–9. [Google Scholar] [CrossRef]
  35. Sun, M.; Li, J.; Cao, R.; Tian, K.; Zhang, W.; Yin, D.; Zhang, Y. Climate-Growth Relations of Abies georgei along an Altitudinal Gradient in Haba Snow Mountain, Southwestern China. Forests 2021, 12, 1569. [Google Scholar] [CrossRef]
  36. Yang, R.; Fan, Z.; Li, Z. Radial growth of Pinus yunnanensis at different elevations and their responses to climatic factors in the Yulong Snow Mountain, Northwest Yunnan, China. Acta Ecol. Sin. 2018, 38, 8983–8991. [Google Scholar]
  37. Yu, J.; Liu, Q.; Meng, S.; Zhou, G.; Shah, S.; Xu, Z. Summer temperature variability inferred from tree-ring records in the central Hengduan Mountains, southeastern Tibetan Plateau. Dendrochronologia 2018, 51, 92–100. [Google Scholar] [CrossRef]
  38. Fu, L.K.; Jin, J.M. China Plant Red Data Book: Rare and Endangered Plants; Science Press: Beijing, China, 1992; ISBN 9787030103061. [Google Scholar]
  39. Zhu, H.; Shao, X.; Yin, Z.; Xu, P.; Xu, Y.; Tian, H. August temperature variability in the southeastern Tibetan Plateau since AD 1385 inferred from tree rings. Palaeogeogr. Palaeoclimatol. Palaeoecol. 2011, 305, 84–92. [Google Scholar] [CrossRef]
  40. Zhao, J.; Chen, C. Geography of China; Higher Education Press: Beijing, China, 1999. (In Chinese) [Google Scholar]
  41. Stokes, M.A.; Smiley, T.L. An Introduction to Tree-Ring Dating; University of Arizona Press: Tucson, AZ, USA, 1996. [Google Scholar]
  42. Cook, E.R.; Briffa, K.R. Methods of calibration, verification, and reconstruction. In Methods of Dendrochronology; Cook, E.R., Kairiukstis, L.A., Eds.; Kluwer Academic Publishers: Dordrecht, The Netherlands, 1990; pp. 104–123. [Google Scholar]
  43. Wu, X. Tree Annual Rings and Climate Change; Meteorological Press: Beijing, China, 1990. (In Chinese) [Google Scholar]
  44. Fritts, H.C.; Mosimann, J.E.; Bottorff, C.P. A revised computer program for standardising tree-ring series. Tree Ring Bull. 1969, 29, 15–20. [Google Scholar]
  45. Holmes, R.L. Computer-assisted quality control in tree-ring dating and measurement. Tree Ring Bull. 1983, 43, 69–78. [Google Scholar]
  46. Cook, E.R. A Time-Series Analysis Approach to TreeRing Standardisation. Ph.D. Thesis, University of Arizona, Tucson, AZ, USA, 1985. [Google Scholar]
  47. Vicente-Serrano, S.M.; Beguerí, S.; López-Moreno, J.I. A Multiscalar Drought Index Sensitive to Global Warming: The Standardized Precipitation Evapotranspiration Index. J. Clim. 2010, 23, 1696–1718. [Google Scholar] [CrossRef]
  48. Li, Z.; Liu, G.; Wu, X.; Wang, X. Tree-ring-based temperature reconstruction for the Wolong Natural Reserve, western Sichuan Plateau of China: A temperature reconstruction in southwestern China from tree rings. Int. J. Clim. 2015, 35, 3296–3307. [Google Scholar] [CrossRef]
  49. Buckley, B.M.; Cook, E.R.; Peterson, M.J.; Barbetti, M. A Changing Temperature Response with Elevation for Lagarostrobos Franklinii in Tasmania, Australia. In Climatic Change at High Elevation Sites; Diaz, H.F., Beniston, M., Bradley, R.S., Eds.; Springer: Dordrecht, The Netherlands, 1997; pp. 245–266. [Google Scholar] [CrossRef]
  50. Takahashi, K.; Tokumitsu, Y.; Yasue, K. Climatic factors affecting the tree-ring width of Betula ermanii at the timberline on Mount Norikura, central Japan. Ecol. Res. 2005, 20, 445–451. [Google Scholar] [CrossRef]
  51. Zhang HCai, Q.; Liu, Y. Altitudinal difference of growth-climate response models in the north subtropical forests of China. Dendrochronologia 2022, 72, 125935. [Google Scholar] [CrossRef]
  52. Affolter, P.; Büntgen, U.; Esper, J.; Rigling, A.; Weber, P.; Luterbacher, J.; Frank, D. Inner Alpine conifer response to 20th century drought swings. Eur. J. For. Res. 2010, 129, 289–298. [Google Scholar] [CrossRef]
  53. Li, Z.; Zhang, Q.; Ma, K. Tree-ring reconstruction of summer temperature for A.D. 1475–2003 in the central Hengduan Mountains, Northwestern Yunnan, China. Clim. Chan. 2012, 110, 455–467. [Google Scholar] [CrossRef]
  54. Fan, Z.; Bräuning, A.; Tian, Q.; Yang, B.; Cao, K. Tree ring recorded May–August temperature variations since A.D. 1585 in the Gaoligong Mountains, southeastern Tibetan Plateau. Palaeogeogr. Palaeoclimatol. Palaeoecol. 2010, 296, 94–102. [Google Scholar] [CrossRef]
  55. Huang, R.; Zhu, H.; Liang, E.; Liu, B.; Shi, J.; Zhang, R.; Yuan, Y.; Grießinger, J. A tree ring-based winter temperature reconstruction for the southeastern Tibetan Plateau since 1340 CE. Clim. Dyn. 2019, 53, 3221–3233. [Google Scholar] [CrossRef]
  56. Keyimu, M.; Li, Z.; Liu, G.; Fu, B.; Fan, Z.; Wang, X.; Wu, X.; Zhang, Y.; Halik, U. Tree-ring based minimum temperature reconstruction on the southeastern Tibetan Plateau. Quat. Sci. Rev. 2021, 251, 106712. [Google Scholar] [CrossRef]
  57. Takahashi, K.; Okuhara, I.; Tokumitsu, Y.; Yasue, K. Responses to climate by tree-ring widths and maximum latewood densities of two Abies species at upper and lower altitudinal distribution limits in central Japan. Trees 2011, 25, 745–753. [Google Scholar] [CrossRef]
  58. Hosoo, Y.; Yoshida, M.; Imai, T.; Okuyama, T. Diurnal difference in the amount of immunogold-labeled glucomannans detected with field emission scanning electron microscopy at the innermost surface of developing secondary walls of differentiating conifer tracheids. Planta 2002, 215, 1006–1012. [Google Scholar] [CrossRef]
  59. Deslauriers, A.; Rossi, S.; Anfodillo, T.; Saracino, A. Cambial phenology, wood formation and temperature thresholds in two contrasting years at high altitude in southern Italy. Tree Physiol. 2008, 28, 863–871. [Google Scholar] [CrossRef]
  60. Shao, X.; Fan, J. Past climate on west Sichuan Plateau as reconstructed from ring widths of Dragon Spruce. Quat. Sci. 1999, 19, 81–89. (In Chinese) [Google Scholar]
  61. Bräuning, A. Tree-ring evidence of ‘Little Ice Age’ glacier advances in southern Tibet. Holocene 2006, 16, 369–380. [Google Scholar] [CrossRef]
  62. Liang, E.; Shao, X.; Qin, N. Tree-ring based summer temperature reconstruction for the source region of the Yangtze River on the Tibetan Plateau. Glob. Planet. Chang. 2008, 61, 313–320. [Google Scholar] [CrossRef]
  63. Liang, H.; Lyu, L.; Wahab, M. A 382-year reconstruction of August mean minimum temperature from tree-ring maximum latewood density on the southeastern Tibetan Plateau, China. Dendrochronologia 2016, 37, 1–8. [Google Scholar] [CrossRef]
  64. Misson, L.; Rathgeber, C.; Guiot, J. Dendroecological analysis of climatic effects on Quercus petraea and Pinus halepensis radial growth using the process-based MAIDEN model. Can. J. For. Res. 2004, 34, 888–898. [Google Scholar] [CrossRef]
  65. Dang, H.; Zhang, Y.; Zhang, K.; Jiang, M.; Zhang, Q. Climate-growth relationships of subalpine fir (Abies fargesii) across the altitudinal range in the Shennongjia Mountains, central China. Clim. Chang. 2013, 117, 903–917. [Google Scholar] [CrossRef]
  66. Zhang, R.; Yuan, Y.; Wei, W.; Gou, X.H.; Yu, S.L.; Shang, H.M.; Chen, F.; Zhang, T.W.; Qin, L. Dendroclimatic reconstruction of autumn–winter mean minimum temperature in the eastern Tibetan Plateau since 1600 AD. Dendrochronologia 2015, 33, 1–7. [Google Scholar] [CrossRef]
  67. Shah, S.K.; Pandey, U.; Mehrotra, N.; Wiles, G.C.; Chandra, R. A winter temperature reconstruction for the Lidder Valley, Kashmir, Northwest Himalaya based on tree-rings of Pinus wallichiana. Clim. Dyn. 2019, 53, 4059–4075. [Google Scholar] [CrossRef]
  68. Fan, Z.; Bräuning, A.; Cao, K.; Zhu, S. Growth–climate responses of high-elevation conifers in the central Hengduan Mountains, southwestern China. For. Ecol. Manag. 2009, 258, 306–313. [Google Scholar] [CrossRef]
  69. Gou, X.; Yang, T.; Gao, L.; Deng, Y.; Yang, M.; Chen, F. A 457-year reconstruction of precipitation in the southeastern Qinghai-Tibet Plateau, China using tree-ring records. Chin. Sci. Bull. 2013, 58, 1107–1114. [Google Scholar] [CrossRef]
  70. Liang, E.; Dawadi, B.; Pederson, N.; Eckstein, D. Is the growth of birch at the upper timberline in the Himalayas limited by moisture or by temperature? Ecology 2014, 95, 2453–2465. [Google Scholar] [CrossRef]
  71. Liu, J.; Deng, X.; Lv, L.X. Relationship of tree growth and climatic factors at treeline of Picea likiangensis var. balfouriana forest in Basu County, Xizang. Chin. J. Plant Ecol. 2015, 39, 442–452. (In Chinese) [Google Scholar] [CrossRef]
  72. Devi, N.M.; Kukarskih, V.V.; Galimova, A.A.; Mazepa, V.S.; Grigoriev, A.A. Climate change evidence in tree growth and stand productivity at the upper treeline ecotone in the Polar Ural Mountains. Forest Ecosyst. 2020, 7, 7. [Google Scholar] [CrossRef]
  73. González de Andrés, E. Interactions between Climate and Nutrient Cycles on Forest Response to Global Change: The Role of Mixed Forests. Forests 2019, 10, 609. [Google Scholar] [CrossRef]
  74. Diallo, A.; Agbangba, E.C.; Ndiaye, O.; Guisse, A. Ecological Structure and Prediction Equations for Estimating Tree Age, and Dendometric Parameters of Acacia senegal in the Senegalese Semi-Arid Zone—Ferlo. Am. J. Plant Sci. 2013, 4, 1046–1053. [Google Scholar] [CrossRef]
  75. Martin-Benito, D.; Kint, V.; del Río, M.; Muys, B.; Cañellas, I. Growth responses of West-Mediterranean Pinus nigra to climate change are modulated by competition and productivity: Past trends and future perspectives. For. Ecol. Manag. 2011, 262, 1030–1040. [Google Scholar] [CrossRef]
  76. Wang, X.; Zhang, Y.; McRae, D.J. Spatial and age-dependent tree-ring growth responses of Larix gmelinii to climate in northeastern China. Trees 2009, 23, 875–885. [Google Scholar] [CrossRef]
  77. Vlam, M.; Van Der Sleen, P.; Groenendijk, P.; Zuidema, P.A. Tree Age Distributions Reveal Large-Scale Disturbance-Recovery Cycles in Three Tropical Forests. Front. Plant Sci. 2017, 7, 1984. [Google Scholar] [CrossRef]
  78. Rajsnerová, P.; Klem, K.; Holub, P.; Novotná, K.; Večeřová, K.; Kozáčiková, M.; Rivas-Ubach, A.; Sardans, J.; Marek, M.V.; Peñuelas, J.; et al. Morphological, biochemical and physiological traits of upper and lower canopy leaves of European beech tend to converge with increasing altitude. Tree Physiol. 2015, 35, 47–60. [Google Scholar] [CrossRef]
  79. Qiu, T.; Aravena, M.-C.; Andrus, R.; Ascoli, D.; Bergeron, Y.; Berretti, R.; Bogdziewicz, M.; Boivin, T.; Bonal, R.; Caignard, T.; et al. Is there tree senescence? The fecundity evidence. Proc. Natl. Acad. Sci. USA 2021, 118, e2106130118. [Google Scholar] [CrossRef]
  80. Cullen, L.E.; Grierson, P.F. Multi-decadal scale variability in autumn-winter rainfall in south-western Australia since 1655 AD as reconstructed from tree rings of Callitris columellaris. Clim. Dyn. 2009, 33, 433–444. [Google Scholar] [CrossRef]
  81. Liang, P.; Wang, X.; Sun, H.; Fan, Y.; Wu, Y.; Lin, X.; Chang, J. Forest type and height are important in shaping the altitudinal change of radial growth response to climate change. Sci. Rep. 2019, 9, 1336. [Google Scholar] [CrossRef] [PubMed]
  82. Peng, J.; Gou, X.; Chen, F.; Li, J.; Liu, P.; Zhang, Y. Altitudinal variability of climate–tree growth relationships along a consistent slope of Anyemaqen Mountains, northeastern Tibetan Plateau. Dendrochronologia 2008, 26, 87–96. [Google Scholar] [CrossRef]
  83. Yu, S.; Yuan, Y.; Qin, L. Tree-ring-width Growth Responses of Picea schrenkiana to Climate Change for Different Elevations in the Central Tianshan Mountains. Desert Oasis Meteorol. 2016, 10, 30–38. (In Chinese) [Google Scholar]
Figure 1. Location of study area (a) and sampling sites (b), and the landscape of study area (c). The blue circle represents Daocheng meteorological station, the red triangle represents the study area, the five-pointed stars represent the location of the five sampling sites, and the red arrows indicate our sampling route (from 3600 to 4400 m a.s.l.). DPH/DPM/DPL represent the upper distribution limit/the middle range/the lower distribution limit of Picea likiangensis. DPF/ZWH represent the sampling site of Sabina saltuaria and Abies squamata.
Forests 15 01265 g001
Figure 2. Monthly variation in total precipitation (blue bars), mean maximum temperature (line with green triangles), mean temperature (line with purple squares), and mean minimum temperature (line with red circles) for Daocheng meteorological station of southwestern Sichuan, China.
Forests 15 01265 g002
Figure 3. Variations in annual mean temperatures (a) and annual precipitation (b) from 1959 to 2020 at Daocheng station.
Forests 15 01265 g003
Figure 4. Age distribution of Picea likiangensis along elevations and the ring width. The sub-graphs (ac) are represented as DPH, DPM and DPL, respectively. In subfigure (d), green/red/purple lines represent the age curves at DPH/DPM/DPL, respectively.
Forests 15 01265 g004
Figure 5. Standard ring width index chronologies along elevation from southeastern Tibetan Plateau. The sub-graphs (ae) are represented as DPL, DPM, DPH, ZWH, and DPF, respectively. “Number” represents the sample depth (gray shading), TRI stands for tree-ring index (blue bold line), Rbar represents the mean series inter-correlations (black line), and EPS stands for expressed population signal (red line). The red dashed line indicates EPS = 0.85.
Forests 15 01265 g005
Figure 6. Results of Pearson correlation analysis between tree-ring chronologies and climatic factors in DPL (a), DPM (b), DPH (c), ZWH (d), and DPF (e). CC represents correlation coefficient. Tmean/Tmax/Tmin, P, and SPEI represent the monthly mean/maximum/minimum temperature, precipitation, and standardized precipitation evapotranspiration index, respectively. The green dashed line and the red dashed line represent 95% and 99% confidence levels. PMay represents the previous May and PN-A represents the previous November to current Augst. PO-Jun represents the previous October to current June. PS-Jan represents the previous September to current January. PO-F represents the previous October to current February.
Forests 15 01265 g006
Figure 7. Relative humidity (RH), precipitation, and wind speed data acquired from automatic weather stations (HOBO U30, USA) in DPH and DPL from 26 March 2023 to 26 August 2023. 24-Apr represents the date 24 April 2023.
Forests 15 01265 g007
Table 1. Basic information of the sampling sites. No. T/C = number of trees and cores. P. likiangensis (Picea likiangensis), S. saltuaria (Sabina saltuaria), A. squamata (Abies squamata).
SiteDateSpecieNo. T/CMean Series LengthTime SpanElevation (m)LatitudeLongitude
DPL8 July 2022P. likiangensis21/47108AD1766–20213678–377429°28′ N99°57′ E
DPM9 July 2022P. likiangensis26/56145AD1766–20213874–389729°28′ N99°58′ E
DPH10 July 2022P. likiangensis24/50127AD1633–20214254–430529°27′ N99°58′ E
DPF6 December 2022S. saltuaria20/44146AD1773–20224170–428329°27′ N99°58′ E
ZWH6 July 2022A. squamata20/4257AD1918–20214355–439829°26′ N99°56′ E
Table 2. Statistics of standardized tree-ring width chronologies.
Num.T/CCommon PeriodM.S.SDSNRAC1EPSWTRBTRRbar
DPL19/421950–20200.2220.1065.6210.7530.8610.3920.2100.333
DPM26/511950–20200.2390.14023.3920.6630.9590.6410.3340.342
DPH20/341950–20200.1630.16212.3760.5630.9250.4620.2730.279
DPF18/321930–20000.1860.1424.3850.7450.8140.2620.1320.135
ZWH20/411950–20200.1220.1731.5400.5400.6060.5280.0980.146
T/C: core/tree in the common interval, M.S.: mean sensitivity, SNR: signal-to-noise ratio, EPS: expressed population signal, WTR: mean correlations within-trees, BTR: mean correlations between trees, and Rbar: mean series inter-correlations.
Disclaimer/Publisher’s Note: The statements, opinions and data contained in all publications are solely those of the individual author(s) and contributor(s) and not of MDPI and/or the editor(s). MDPI and/or the editor(s) disclaim responsibility for any injury to people or property resulting from any ideas, methods, instructions or products referred to in the content.

