Abstract
Natural soil and vegetation recovery following human disturbance is the primary means of restoring degraded ecosystems globally. However, it remains unclear how vegetation recovery in the tropical karst areas of China affects the soil physicochemical properties. Here, we investigated the impacts of natural vegetation recovery on soil physicochemical properties at different soil depths in tropical karst areas in southwestern China, using a space–time substitution method. We found that with the natural vegetation recovery, soil bulk density (SBD) decreased. Soil pH initially decreased and then increased, reaching its lowest value during the shrubland stage. There was a significant increase in other soil physicochemical factors. In the soil profiles, SBD tended to increase with depth. The pH, total potassium (TK), total phosphorus (TP), and exchangeable calcium remained relatively stable across the different soil layers. TK, TP, available phosphorus, SBD, total nitrogen, pH, exchangeable magnesium, and available potassium significantly contributed to the soil physicochemical properties. Soil physicochemical properties were predominantly directly affected by litter and biological factors, albeit indirectly influenced by topographic factors. Our study provides crucial insights into karst soils and their relationship with vegetation recovery, which are pivotal for steering vegetation restoration and soil amelioration in karst areas.
1. Introduction
The global karst distribution area is approximately 2.2 × 10⁷ km2, representing 15% of the earth’s total land area. In China, karst landforms cover an area of 3.44 × 10⁶ km2, comprising approximately one-third of the country’s land area [1]. Southwest China has the world’s largest karst area (5.5 × 10⁵ km2), characterized by typical karst features and considerable environmental challenges [2]. This area faces the dual pressures of environmental degradation and poverty owing to its low karstic rock–soil formation capacity, shallow and discontinuous soil layers, and highly heterogeneous habitats [3]. Intense karstification over time has led to the surface and underground having a dual-layered spatial structure, which causes water source leakage and deep burial. This has resulted in a fundamental mismatch between water and soil resources which increases the vulnerability of karst ecosystems [4]. Unsustainable land use and excessive human activity have exacerbated vegetation degradation, soil erosion, biodiversity loss, and declining land productivity in the karst area of southwestern China [5]. Karstification has become the largest ecological challenge for sustainable development in this area [6]. To address this aspect, the Chinese government has implemented various ecological projects. This includes returning farmland to forests and grasslands, soil and water conservation initiatives, and ecological migration programs to achieve sustainable development in karst areas [7]. Consequently, the overall expansion of rocky desertification in China has been effectively controlled and the rocky desertified land area continues to decrease [8]. To date, natural restoration and artificial afforestation have been the primary strategies for greening karst rocky desertified areas. Natural restoration favors vegetation recovery and the reconstruction of degraded ecosystems in karst areas [9].
Soil plays a crucial role in the foundation of ecological restoration [10]. Vegetation recovery induces changes in soil properties, and, in turn, the soil characteristics affect vegetation distribution and variation. This has resulted in complex interactions between vegetation and soil at the ecosystem level [11]. Soil physicochemical properties are key ecological factors influencing plant growth and development and are vital indicators of soil fertility and quality [12]. Among them, SBD, soil water content (SWC), and soil electrical conductivity (SEC) directly influence soil particle adhesion, capillary adsorption, and soil salt content. Therefore, they are key indicators of soil quality and productivity [13]. Soil chemical properties, including soil pH, soil organic matter (SOM), total nitrogen (TN), total phosphorus (TP), and total potassium (TK), directly affect soil fertility. They regulate ecosystem services by influencing vegetation growth [14]. Vegetation restoration in karst areas can have various positive effects on soil physicochemical properties. Diverse vegetation restoration approaches such as natural recovery, afforestation, and grassland establishment significantly enhance soil quality in karst areas [13]. Xiao et al. discovered differences in soil properties after vegetation restoration in karst areas compared to uncultivated land. This was particularly the case for soil physical properties such as the soil moisture conversion coefficient, soil porosity, and SWC, which showed increases relative to uncultivated land [15]. Natural shrublands in karst areas have demonstrated a superior capability for enhancing soil quality [16]. Although prior research has predominantly focused on subtropical karst areas, to date, there have been relatively few studies examining the effects of vegetation restoration on soil physicochemical properties in tropical karst areas. Further experimental studies are required to broaden the scope of knowledge in this field.
In this study, we used a space–time research methodology to investigate the soil physicochemical properties across five stages of vegetation restoration, that is, tussock (TU), shrubland (SL), young secondary forest (YSF), mature secondary forest (MSF), and primary forest (PF) in the tropical karst peak–cluster depression areas of southwestern China. The aims of this study were the following: (1) to examine the variations in soil physicochemical properties across different restoration stages and examine the interrelationships among various soil factors, and (2) to identify the primary factors influencing soil properties and analyze the pathways through which topographic, litter, and biological factors affect soil physicochemical properties. We hypothesize that as the vegetation recovers, there will be significant improvements in soil physicochemical properties. Various environmental factors will exert diverse influences on these soil properties during the recovery process. Our study will offer practical guidance for ecological restoration in karst areas. It provides insights to optimize restoration measures and enhance the effectiveness of ecological engineering, supporting better ecological outcomes and more efficient restoration practices.
2. Materials and Methods
2.1. Study Area
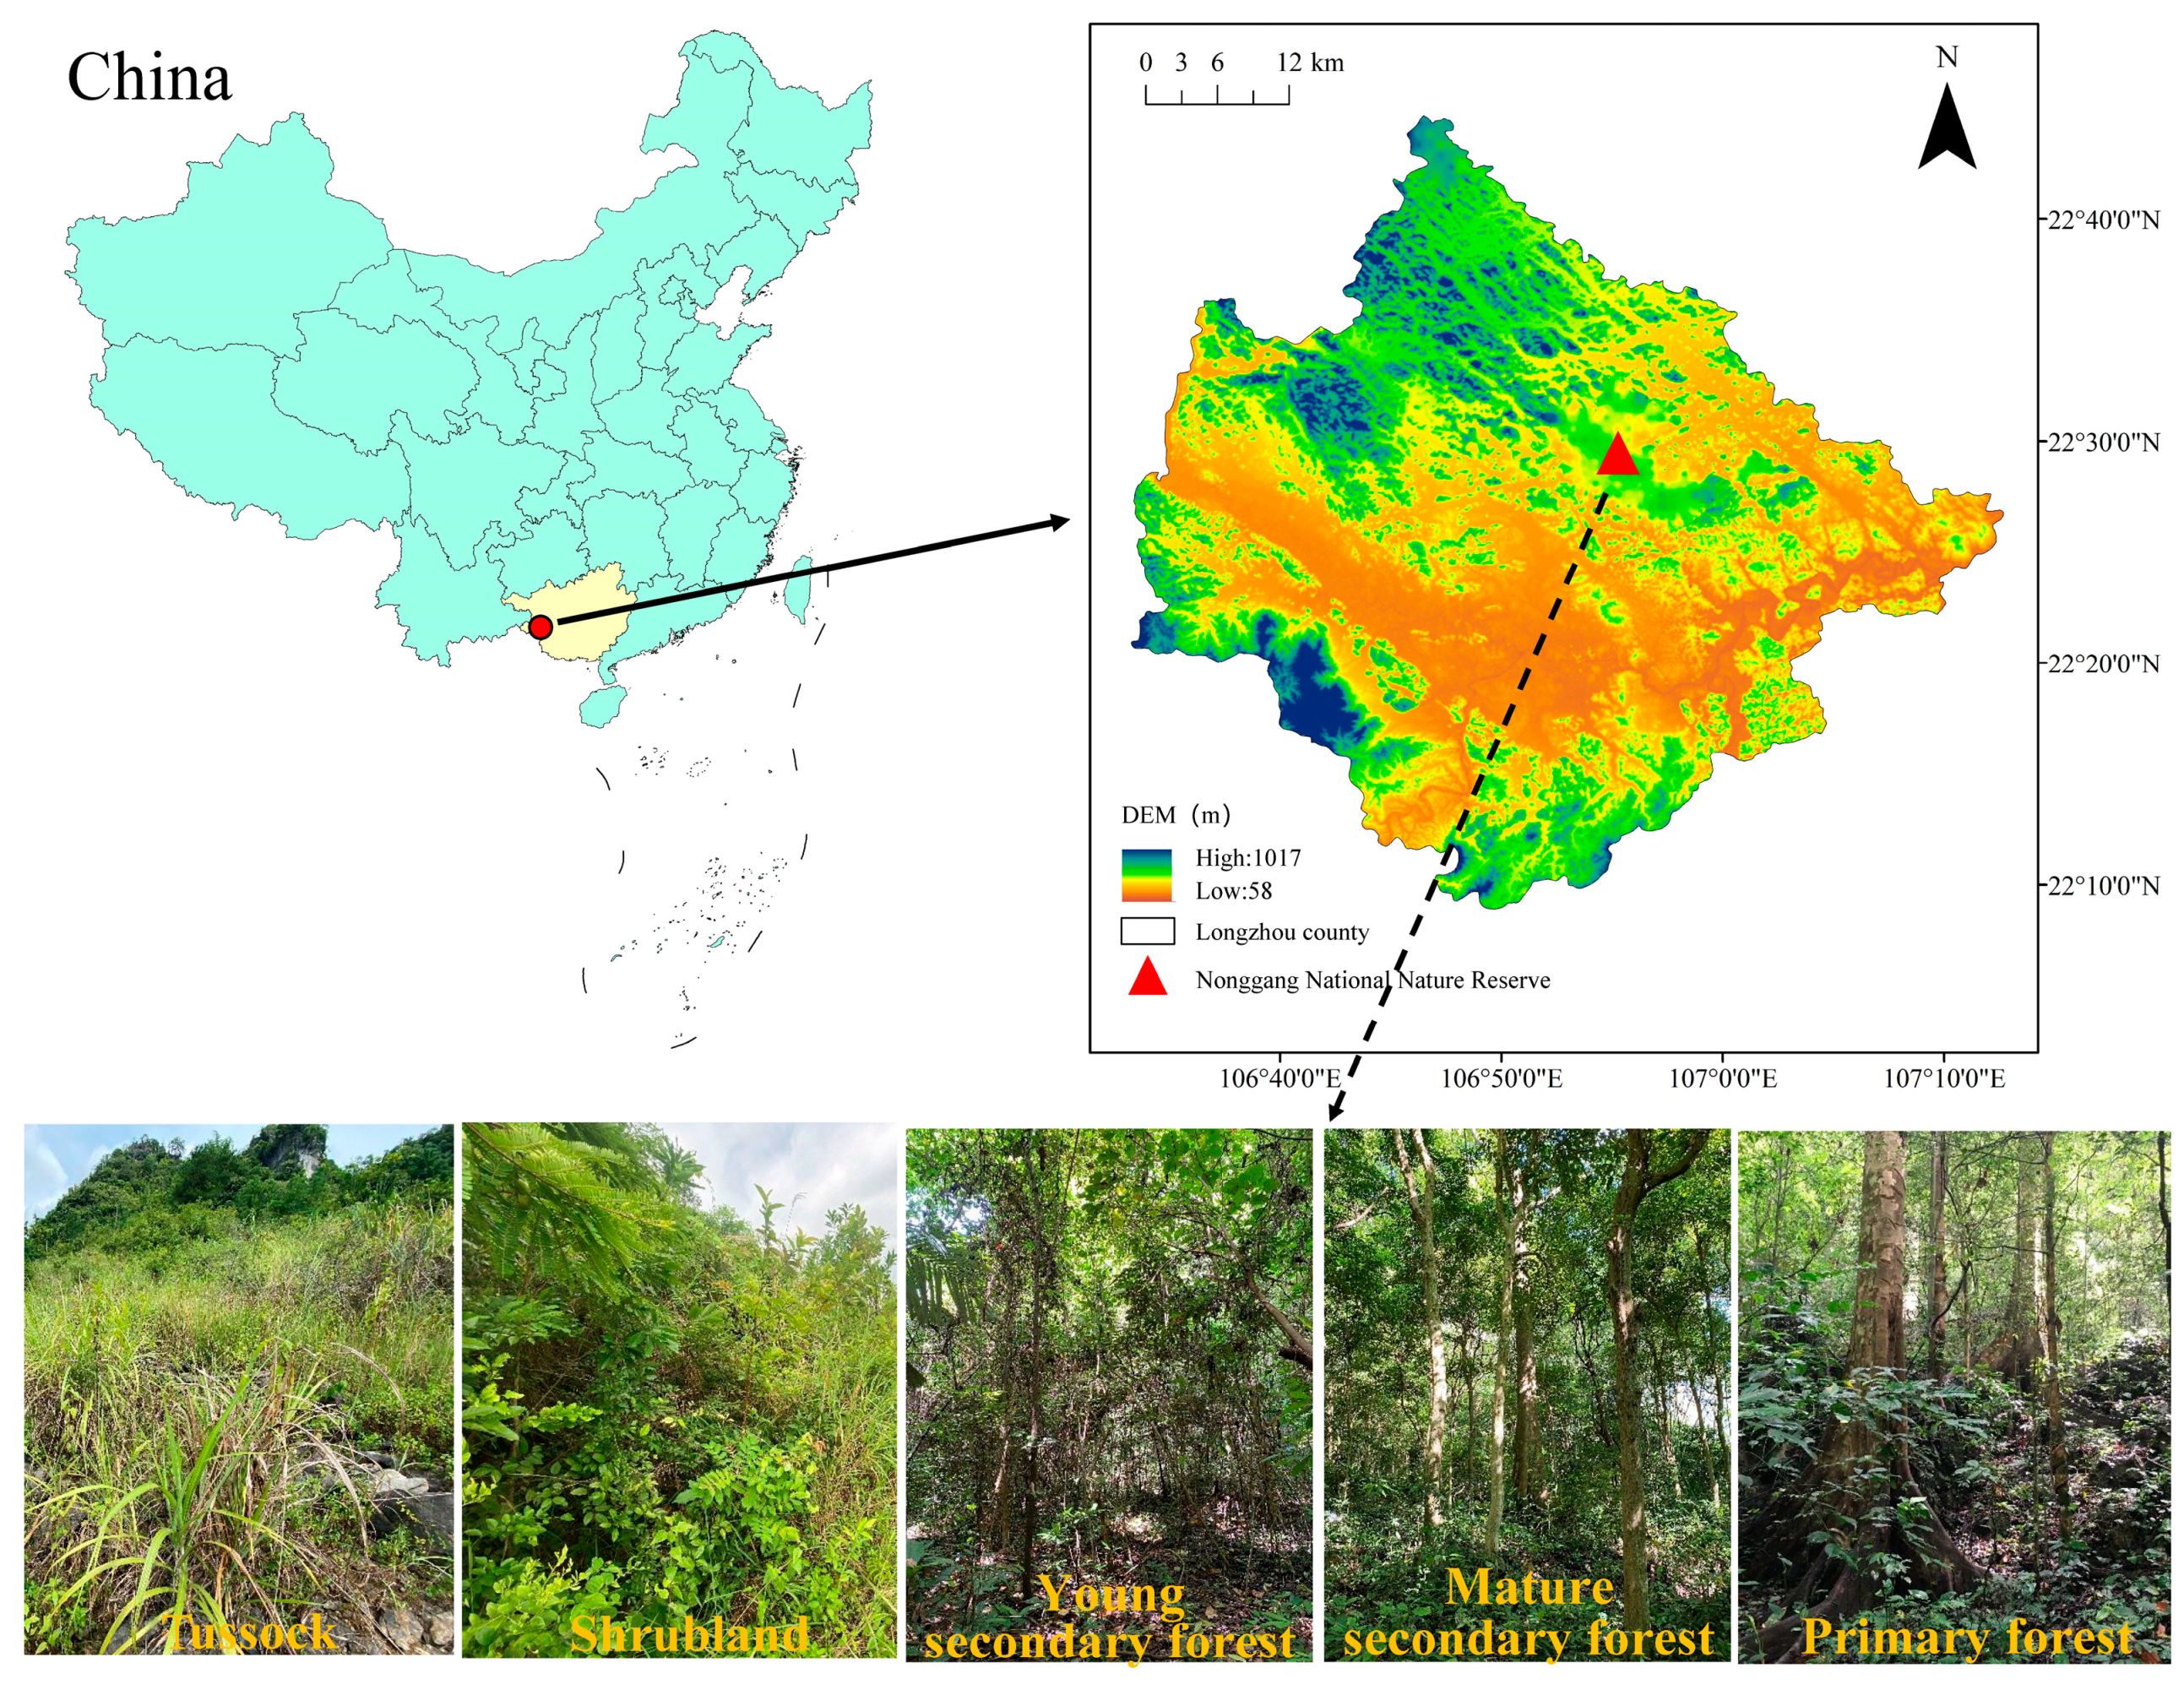
The study area is situated within the Nonggang National Nature Reserve in Longzhou County, Guangxi, southwestern China (106°42′28″–107°04′54″ E, 22°13′56″–22°39′09″ N, Figure 1). This area is primarily characterized by karst landforms formed on carbonate rocks, featuring typical peak–cluster depression topography with elevations ranging from 300 to 600 m. Positioned south of the Tropic of Cancer, the area has a classic tropical monsoon climate, with ample solar radiation, high temperatures, and an average annual temperature of 22 °C. The coldest month has an average temperature exceeding 13 °C for 7 months, indicating an extended warm season. Annual rainfall averages from 1150 to 1550 mm. It is primarily concentrated between May and September, delineating distinct wet and dry seasons. The soil attributes included a low total volume, shallow soil layers, discontinuous soil coverage, and uneven spatial dispersion. The primary formation lithology consists of Devonian, Carboniferous, and Permian carbonate rocks. The soil is calcareous, formed from limestone, and is characterized by high pH levels and an abundance of magnesium (Mg) and calcium (Ca) compounds. According to the Chinese Soil Taxonomy, this soil can be further subdivided into the brown limestone soil subclass. It is also categorized as Calcaric Cambisol in the World Reference Base (WRB) for Soil Resource. Karst vegetation in this location shows exceptionally high diversity and endemism, with a total of 1725 vascular plant species. Noteworthy among these are protected wild plants, such as Cycas sexseminifera F.N.Wei, Cycas bifida (Dyer) K.D.Hill, Excentrodendron tonkinense (A. Chev.) H. T. Chang and R. H. Miao, Firmiana kwangsiensis H. H. Hsue, Deutzianthus tonkinensis Gagnep., Camellia flavida Hung T. Chang, and Horsfieldia hainanensis Merr.
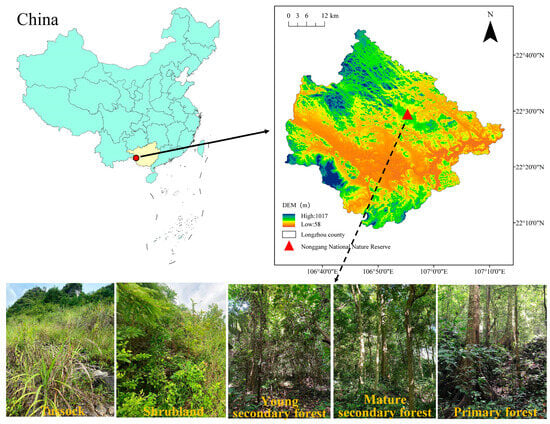
Figure 1.
Location of the study area and growth conditions of the five vegetation types.
2.2. Soil Sampling
For 2021, a successional sequence comprising five vegetation types at different stages of vegetation restoration was selected for the study area (Figure 1). Characteristics of sample plots at different vegetation restoration stages are presented in Table 1. Twenty plots were established, with four replicate plots designated for each vegetation restoration stage. The TU plots measured 2 × 2 m with a minimum spacing of 2 m between plots. The SL plots measured 10 × 10 m with a minimum spacing of 10 m between plots. The YSF, MSF, and PF plots measured 20 × 20 m with a minimum spacing of 20 m between plots. Routine community surveys were conducted in each plot. During the TU stage, the surveys included plant taxa names, abundances, average heights, and coverage. For the SL stage, the surveys included species names, abundance, basal diameter, breast height, diameter, height, and coverage. For the vegetation at the forest stage, all woody plants with a breast height diameter ≥1 cm were numbered and marked with spray paint at breast height (1.3 m). Each woody plant with a breast diameter ≥1 cm was surveyed, and data were collected on the taxon name, breast diameter, height, and canopy width. In addition, the aboveground biomass (AGB) of each plot was monitored. Tussock AGB monitoring mostly involved the harvesting method, whereas woody AGB monitoring followed the method described by Liu et al. [17]. Information such as elevation (Ele), slope, rock exposure (RE), vegetation cover (VC), community height (CH), and species richness (SR) was recorded for each plot. In each plot, three sampling points were randomly selected to collect litter within a 0.5 m × 0.5 m area, which was then brought back to the laboratory. In the laboratory, litter samples were dried in a constant-temperature oven at 75 °C for at least 48 h until a constant weight was reached. The dried samples were then ground and sieved. After collecting the litter, soil samples were taken from a 50 cm deep soil profile, with samples collected at 0–10, 10–20, 20–30, and 30–50 cm depths. Soil samples from the same depth within the same plot were thoroughly mixed and taken back to the laboratory for air drying and sieving. Undisturbed soil samples were collected from each soil profile using a ring knife.

Table 1.
Characteristics of sample plots at different vegetation restoration stages.
2.3. Measurement of Soil Properties
SBD and SWC were measured using the ring knife method (100 cm3) and the oven-drying method (at an oven temperature of 105 °C), whereas SEC was measured using the electrode method with a water-to-soil ratio of 5:1 (Conductivity Meter, DDSJ-308F, INESA, China). Soil pH was determined using the potentiometric method with a water-to-soil ratio of 2.5:1 (pH Meter, Model: IS128C, Insmark Co., Ltd., Shanghai, China). SOM was measured using the potassium dichromate heating method (TOC Analyzer, Shimadzu, Japan). Soil TN was determined using the Kjeldahl method and alkali-hydrolyzed nitrogen (AN) was measured using the alkali diffusion method (Automatic Kjeldahl Nitrogen Analyzer KDY-9830, Beijing, China). The soil TP was determined using the alkaline fusion–molybdenum antimony anti-spectrophotometry method. Available phosphorus (AP) was measured using the sodium bicarbonate leaching–molybdenum antimony anti-spectrophotometry method (Smartchem 200 Discrete Chemistry Analyzer, WestCo Scientific Instruments, Brookfield, CT, USA). TK was determined using atomic absorption spectrophotometry (Varian Atomic Absorption Spectrophotometer, Model: AA240FS, Agilent Technologies Inc., CA, USA), while available potassium (AK) was measured using flame atomic absorption spectrophotometry (the flame atomic absorption spectrometer, FAAS 2380 Perkin Elmer, Waltham, MA, USA). Soil exchangeable calcium (ECa) was determined using the ammonium acetate exchange–EDTA complexometric titration method; and exchangeable magnesium (EMg) was measured using the ammonium acetate exchange–atomic absorption spectrophotometry method (Varian Atomic Absorption Spectrophotometer, Model: AA240FS, USA). The methods for determining litter carbon (litter C), litter nitrogen (litter N), and litter phosphorus (litter P) were the same as those used for the SOM, TN, and TP measurements (Table S1). These indicators were measured using the method described by Bao [18].
2.4. Statistical Analysis
The physicochemical properties were analyzed for different vegetation restoration stages and soil depths using a two-way analysis of variance (ANOVA). The data passed the test for homogeneity of variances, and post hoc multiple comparisons of means were conducted using the least significant difference method at a significance level of 0.05. Pearson’s correlation analysis was used to examine the relationships among various soil physicochemical factors. Principal component analysis (PCA) was used to analyze the soil physicochemical properties. Important factors were determined based on the variance contribution rate and magnitude of the loadings. A structural equation model (SEM) was constructed to examine the pathways through which topographic (Ele, Slope, and RE), litter (litter N, litter P, litter C:P, and litter N:P), and biological (CH, SR, and AGB) factors influenced soil physicochemical factors. Two-way ANOVA was performed using SPSS 24.0, whereas correlation analysis, PCA, and SEM were conducted using Psych, FactoMineR, and PiecewiseSEM packages in R 4.1.3. The statistical data are presented as mean ± standard error (SE).
3. Results
3.1. Changes in Soil Physical Properties with Vegetation Restoration
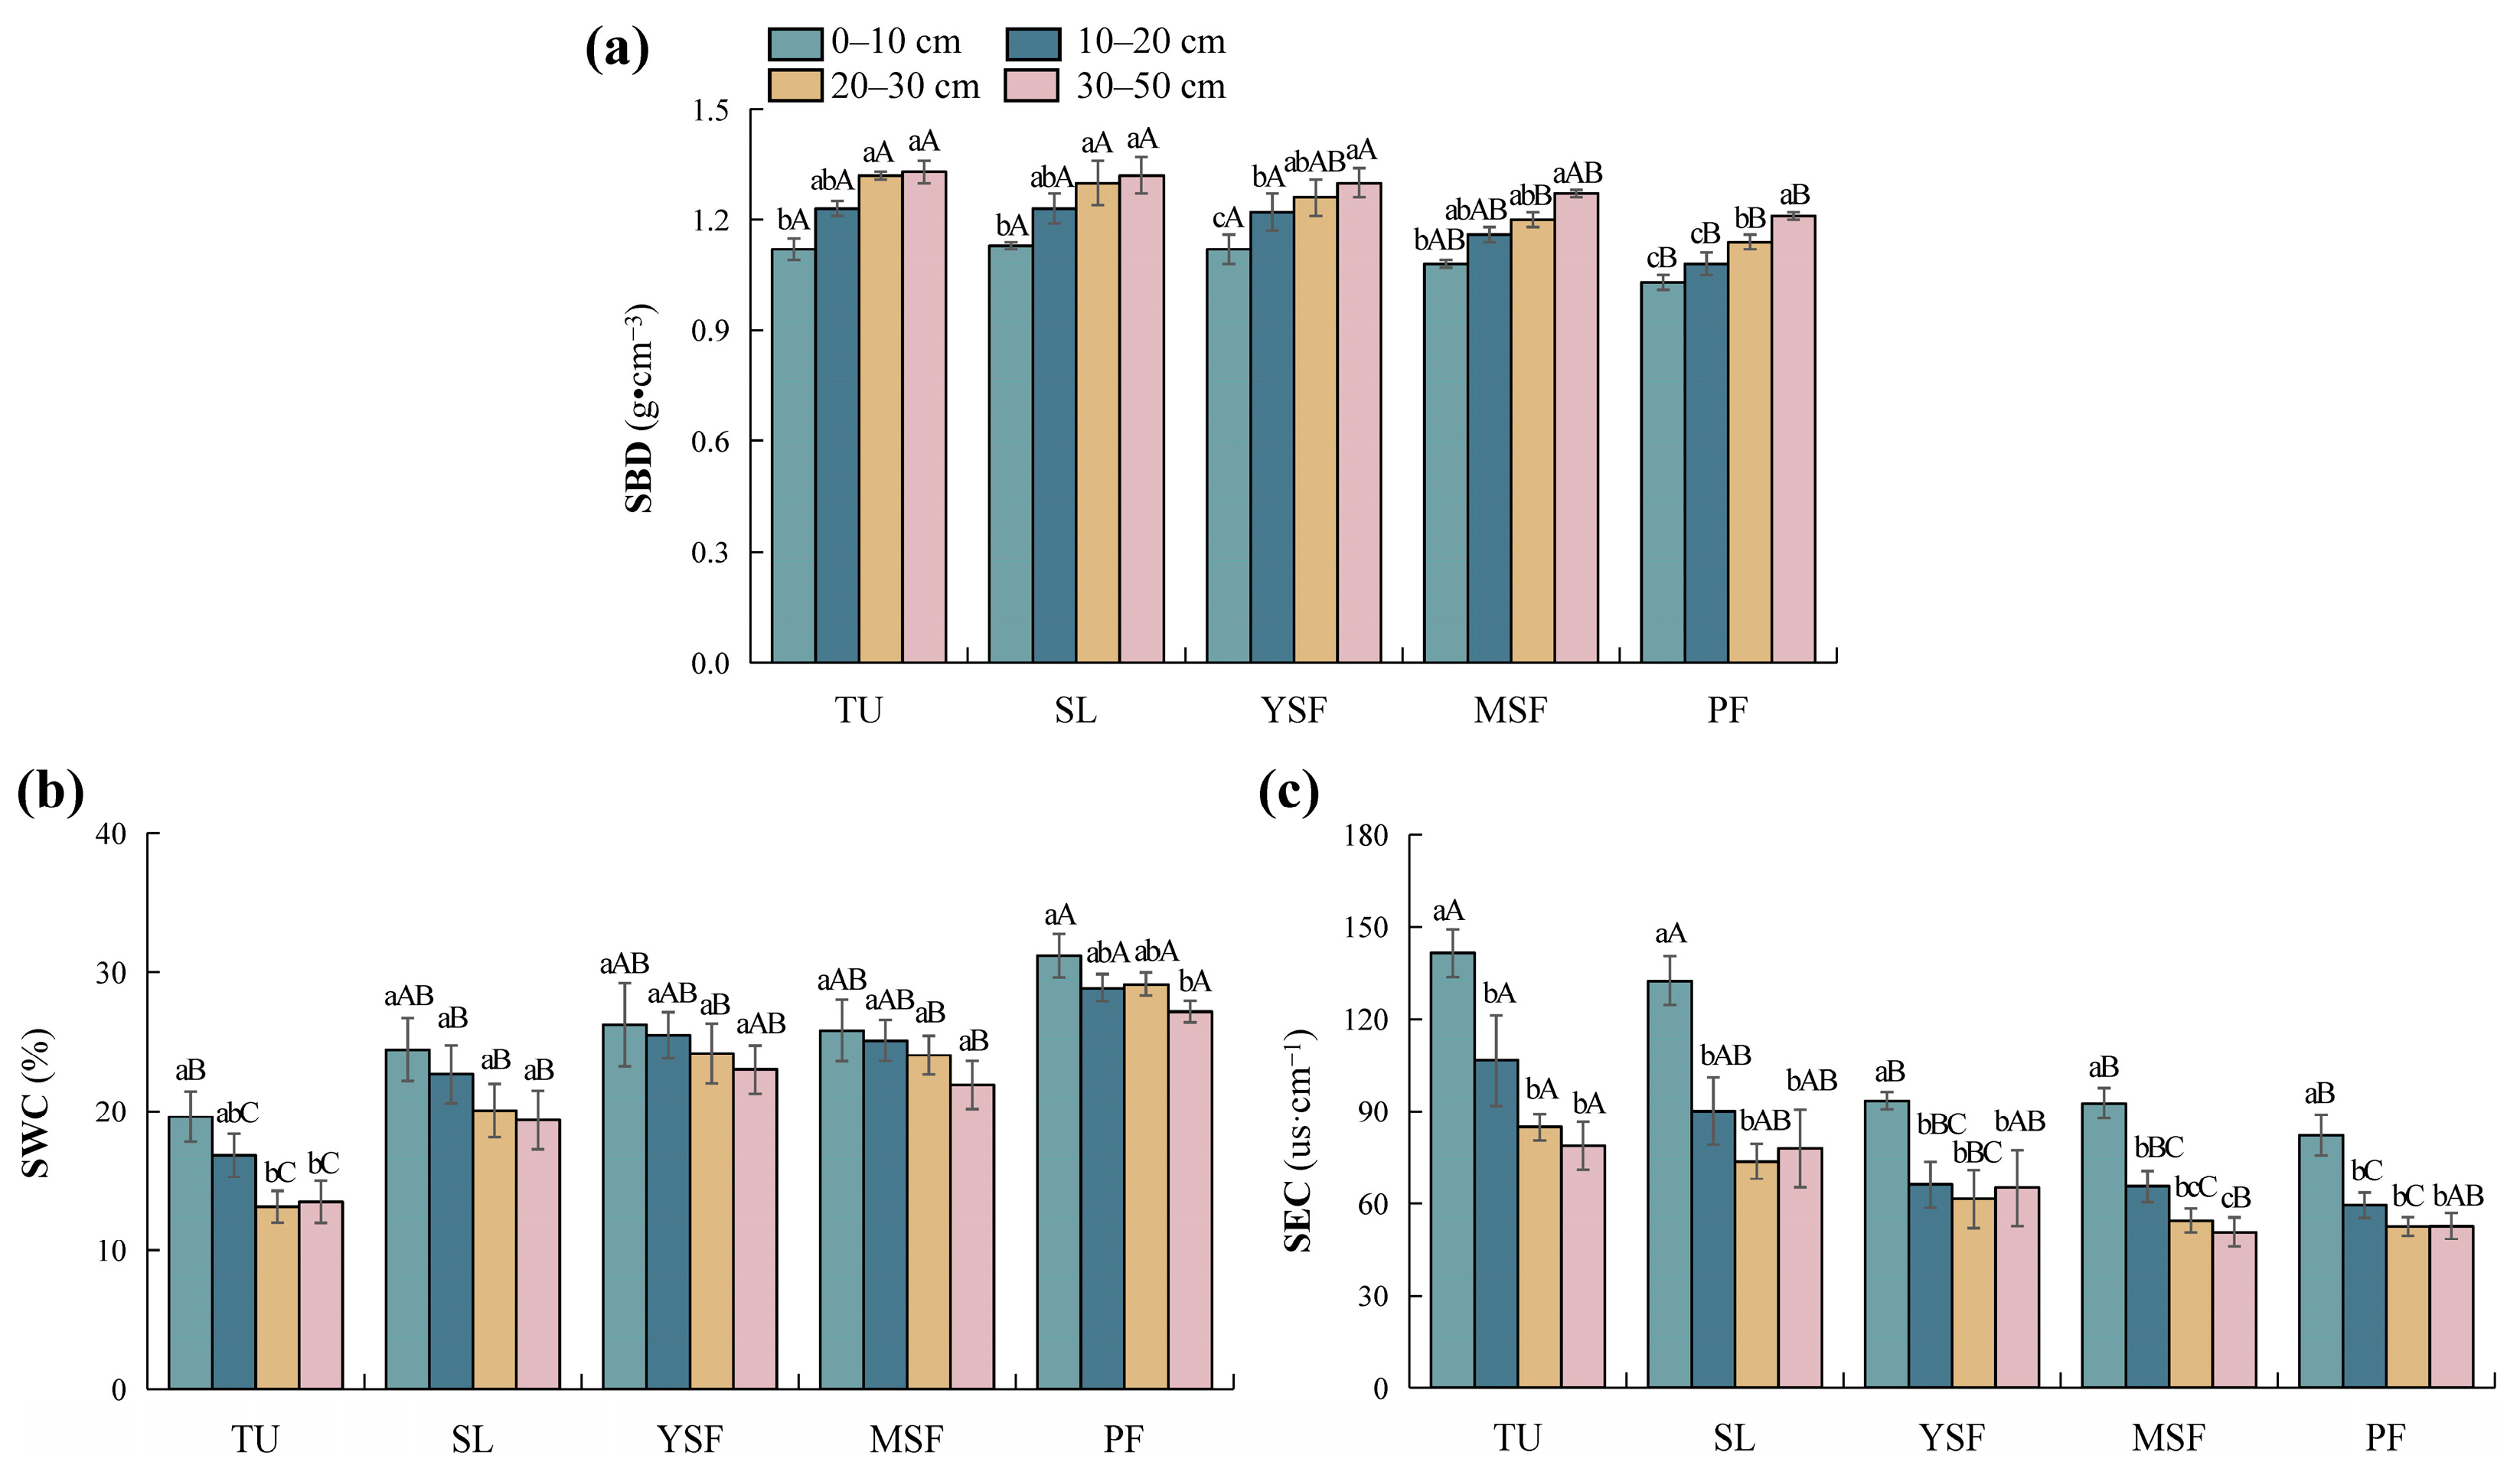
As shown in Table 2, vegetation restoration and soil depth significantly influenced three soil physical factors, that is, SBD, SWC, and SEC (p < 0.01 or p < 0.001). The SBD of each soil layer ranged from 1.03 to 1.33 g·cm−3 (Figure 2a). The SBD in the TU stage was significantly higher than those in the MSF and PF stages (p < 0.05), showing an overall decreasing trend with vegetation restoration. SWC ranged from 13.13% to 31.17% (Figure 2b), with SWC in the PF stage being significantly higher than that in the other stages. The SWC in the YSF stage was significantly higher than that in the SL and TU stages. The SWC in the MSF and SL stages was significantly higher than that in the TU stage (p < 0.05), showing an overall increasing trend with vegetation restoration. SEC ranged from 50.73 to 141.50 µs·cm−1 (Figure 2c), with SEC in the TU and SL stages significantly higher than in the YSF, MSF, and PF stages (p < 0.05), showing an overall decreasing trend with vegetation restoration. Overall, SBD increased with soil depth, whereas SWC and SEC decreased along the soil profile.
Table 2.
Two-way ANOVA on the effects of vegetation restoration and soil depth on soil physical factors.
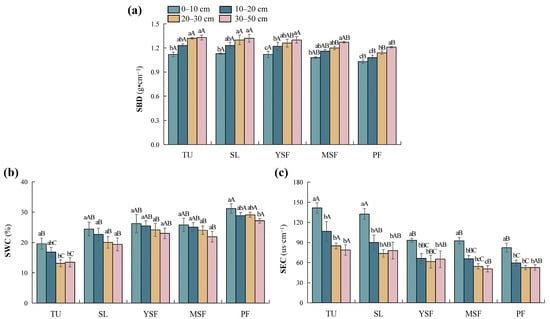
Figure 2.
Distribution characteristics of soil physical factors at different stages. (a) SBD, soil bulk density; (b) SWC, soil water content; and (c) SEC, soil electrical conductivity. Different lowercase letters indicate significant differences between different soil layers (p < 0.05), and different capital letters indicate significant differences between different restoration stages (p < 0.05). TU, tussock; SL, shrubland; YSF, young secondary forest; MSF, mature secondary forest; PF, primary forest.
3.2. Changes in Soil Chemical Properties with Vegetation Restoration
3.2.1. Changes in Soil pH and Soil Organic Matter
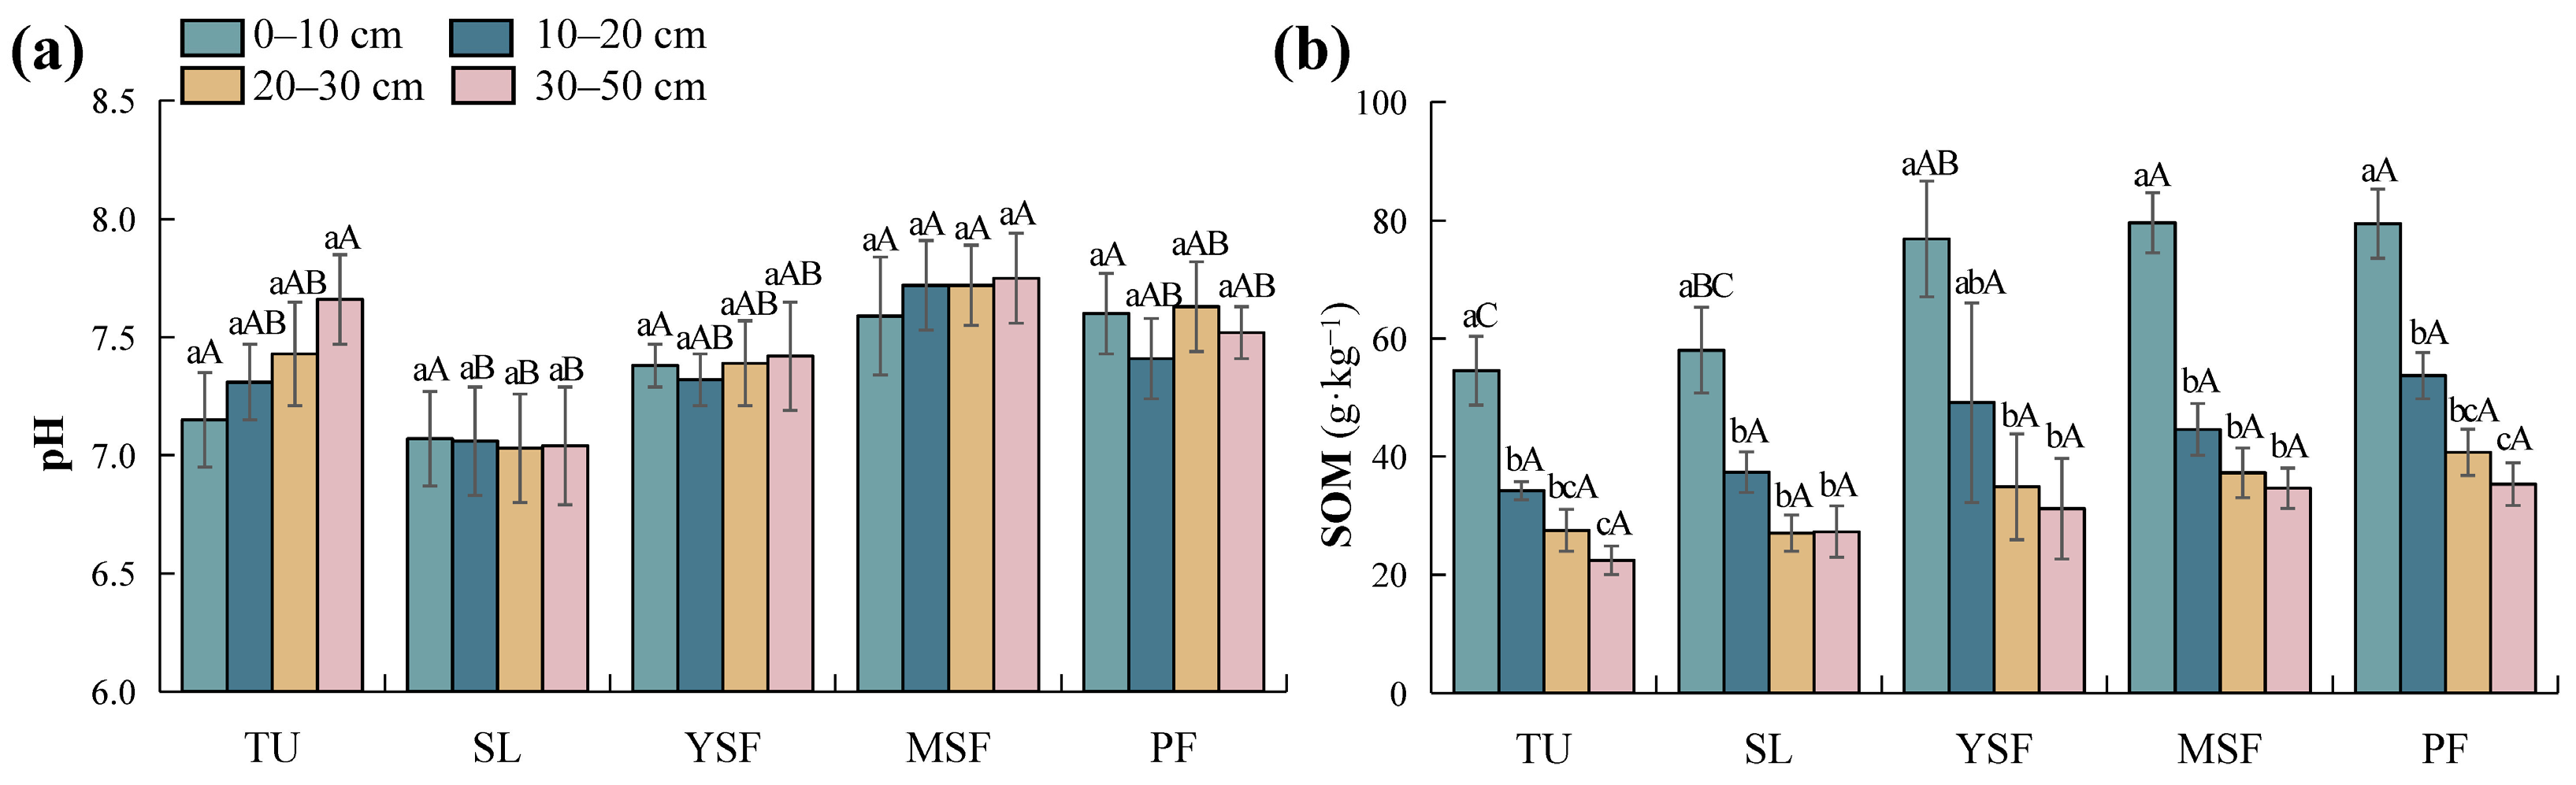
As shown in Table 3, vegetation restoration significantly affected the soil pH (p < 0.001) and SOM (p < 0.01). Soil depth had a significant effect on SOM (p < 0.001), whereas its effect on soil pH was not significant (p > 0.05). Soil pH ranged from 7.03 to 7.75 (Figure 3a). With the recovery of vegetation, the soil pH first decreases and then increases, reaching its lowest value during the SL stage. In the later stages of vegetation recovery (MSF and PF stages), the soil pH is higher than in the early stage of recovery (TU stage), but the difference was not significant (p > 0.05). The SOM ranged from 22.42 to 79.63 g·kg−1 (Figure 3b). Vegetation restoration significantly affected SOM only in the 0–10 cm soil layer. The MSF and PF stages were significantly higher than the TU and SL stages, and the YSF stage was significantly higher than that of the TU stage (p < 0.05). Overall, SOM increased with vegetation restoration. Along the soil profile, there was no significant difference in soil pH with increasing soil depth, whereas SOM showed an overall decreasing trend.
Table 3.
Two-way ANOVA on the effects of vegetation restoration and soil depth on soil chemical factors.
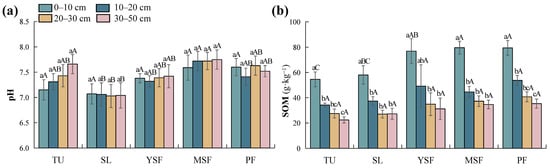
Figure 3.
Distribution of (a) soil pH and (b) soil organic matter (SOM) at different restoration stages. Different lowercase letters indicate significant differences between different soil layers (p < 0.05), and different capital letters indicate significant differences between different restoration stages (p < 0.05). TU, tussock; SL, shrubland; YSF, young secondary forest; MSF, mature secondary forest; PF, primary forest.
3.2.2. Changes in Soil Nutrients
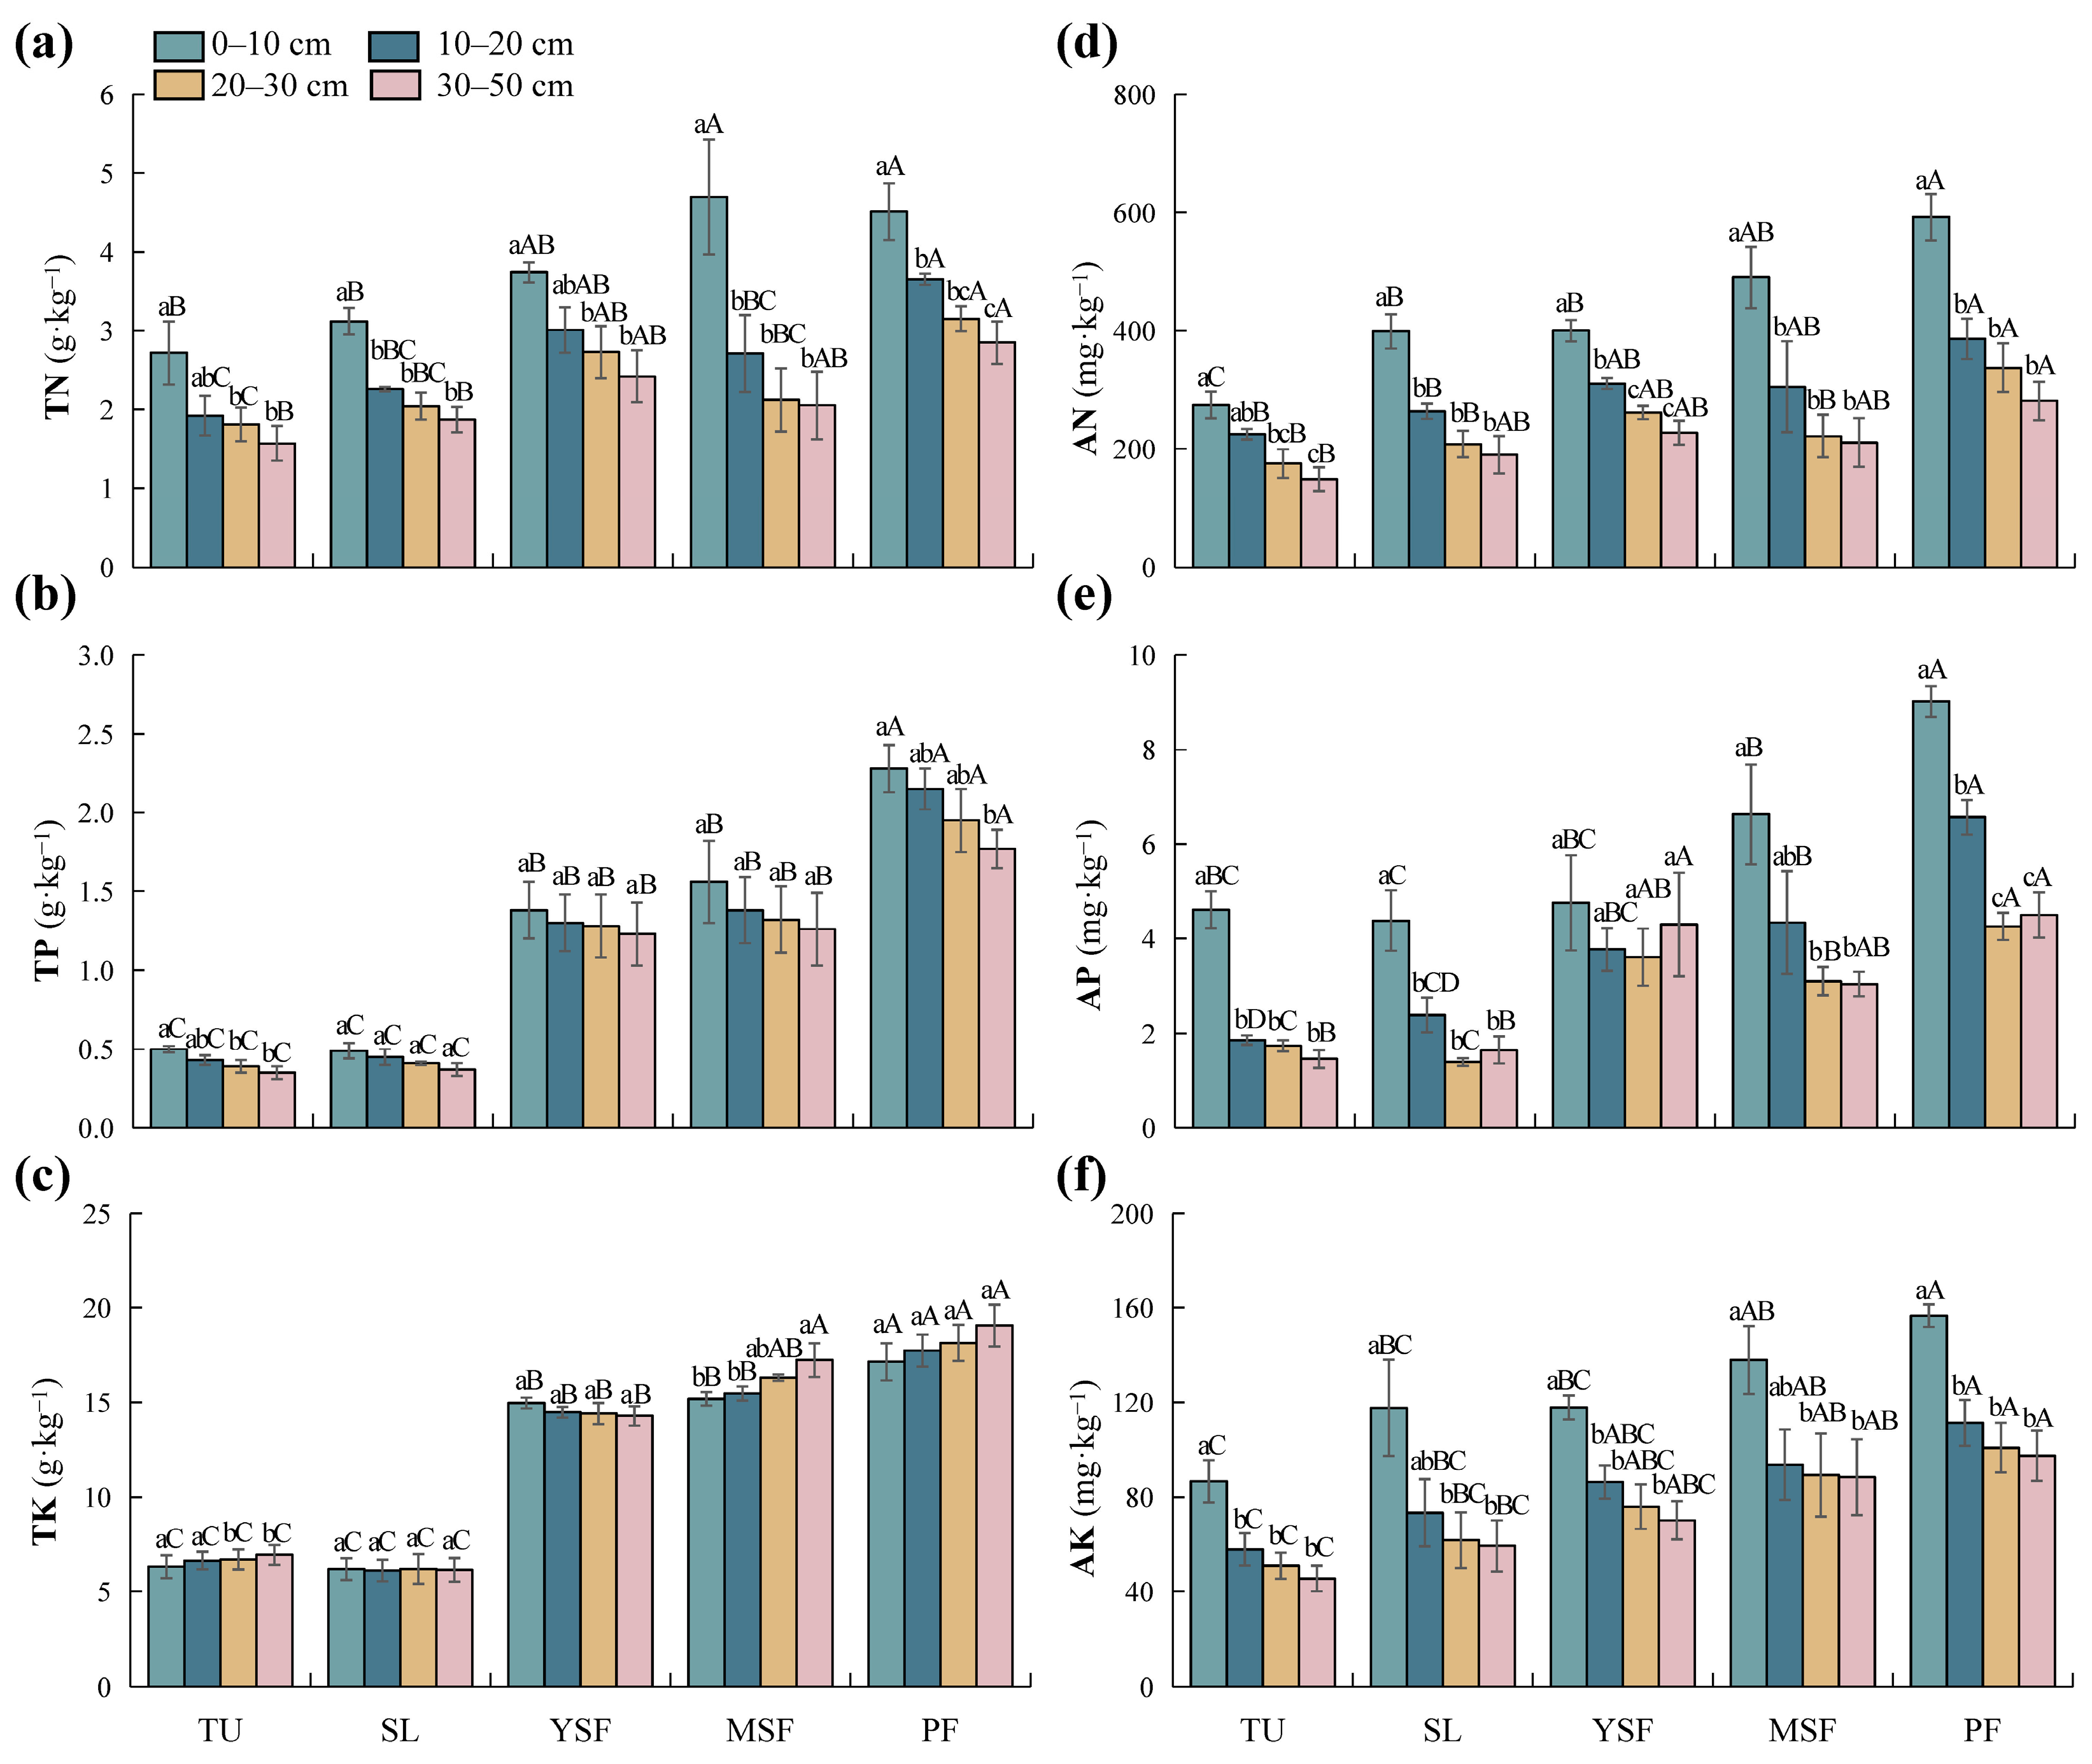
As shown in Table 3, vegetation restoration significantly affected TN, TP, TK, AN, AP, and AK (p < 0.001). The TN content in each soil layer ranged from 1.57 to 4.70 g·kg−1 (Figure 4a), with the lowest TN content observed in the TU stage. The TN content in each soil layer of the PF stage was significantly higher than that in the TU and SL stages (p < 0.05). The ranges of TP and TK content were 0.35–2.28 g·kg−1 and 6.12–19.06 g·kg−1, respectively (Figure 4b,c). The highest TP and TK content was recorded in the PF stage, which was significantly higher than in other stages (p < 0.05). The TP and TK contents at the YSF and MSF stages were significantly higher than those at the TU and SL stages (p < 0.05). TN, TP, and TK increased during vegetation restoration. The AN, AP, and AK contents in the PF stage were the highest (Figure 4d–f), significantly higher than those in the TU stage (p < 0.05). With vegetation restoration, the soil AN, AP, and AK content showed an overall increasing trend. Soil depth had a significant impact on TN, AN, AP, and AK (p < 0.001; Table 3). Meanwhile, the impact on TP and TK did not reach a significant level (p > 0.05; Table 3). Overall, TN, AN, AK, and AP contents decreased with increasing soil depth, whereas TP and TK contents showed no significant changes.
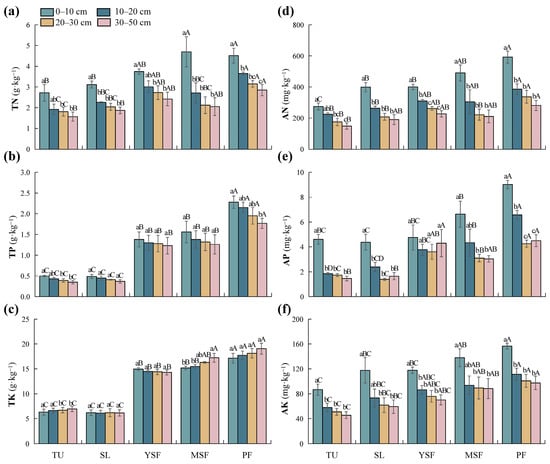
Figure 4.
Distribution of soil nutrient factors at different restoration stages. (a) TN, total nitrogen; (b) TP, total phosphorus; (c) TK, total potassium; (d) AN, alkali-hydrolyzed nitrogen; (e) AP, available phosphorus; and (f) AK, available potassium. Different lowercase letters indicate significant differences between different soil layers (p < 0.05), and different capital letters indicate significant differences between different restoration stages (p < 0.05). TU, tussock; SL, shrubland; YSF, young secondary forest; MSF, mature secondary forest; PF, primary forest.
3.2.3. Changes in Soil Cation Exchange Capacity
The results of the two-factor variance analysis (Table 3) indicated that vegetation restoration had a significant effect on ECa and EMg (p < 0.001). The soil ECa and EMg content in each soil layer ranged from 112.29 to 284.45 mg·kg−1 (Figure 5a) and 9.11 to 23.97 mg·kg−1 (Figure 5b), respectively. The ECa and EMg contents in the TU stage were the lowest and were significantly lower than those in the MSF and PF stages (p < 0.05). With vegetation restoration, soil ECa and EMg showed an overall increasing trend (Figure 5). Soil depth had a significant impact on EMg (p < 0.001; Table 3), whereas its impact on ECa was not significant (p > 0.05; Table 3). In the soil profile, soil ECa showed no significant change with increasing soil depth, whereas EMg showed a decreasing trend.
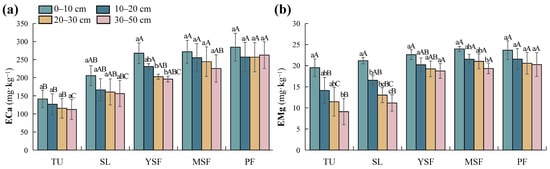
Figure 5.
Distribution of soil (a) exchangeable calcium (ECa) and (b) exchangeable magnesium (EMg) at different restoration stages. Different lowercase letters indicate significant differences between different soil layers (p < 0.05), and different capital letters indicate significant differences between different restoration stages (p < 0.05). TU, tussock; SL, shrubland; YSF, young secondary forest; MSF, mature secondary forest; PF, primary forest.
3.3. Relationship between Environmental Factors and Soil Physicochemical Properties
3.3.1. Correlation Analysis of Soil Physicochemical Factors
The results of the correlation analysis (Figure 6) indicated that SBD was strongly negatively correlated with SWC (p < 0.01). However, the correlations between SEC and SBD, as well as SWC, were found to be nonsignificant (p > 0.05). pH was significantly positively correlated with TN, TP, TK, AN, AP, ECa, and EMg (p < 0.05 and p < 0.01). SOM was significantly positively correlated with TN, TP, TK, AN, AP, AK, ECa, and EMg (p < 0.01). All the pairwise correlations between the soil nutrient factors (TN, TP, TK, AN, AP, and AK) and cation exchange capacities (ECa and EMg) were significantly positive (p < 0.05 and p < 0.01).
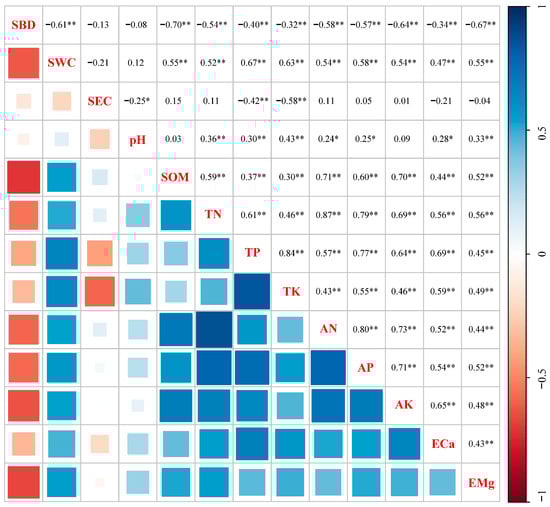
Figure 6.
Correlation analysis of soil physicochemical properties. The blue indicates positive correlation, and the red indicates negative correlation. Numbers indicate the correlation coefficients. p-values were used to test the level of significance for hypothesis testing. * and ** indicate p < 0.05 and p < 0.01, respectively. SBD, soil bulk density; SWC, soil water content; SEC, soil electrical conductivity; SOM, soil organic matter; TN, total nitrogen; TP, total phosphorus; TK, total potassium; AN, alkali-hydrolyzed nitrogen; AP, available phosphorus; AK, available potassium; ECa, exchangeable calcium; EMg, exchangeable magnesium.
3.3.2. PCA Analysis of Soil Physicochemical Properties
The PCA results for the soil physicochemical factors are shown in Figure 7a. Following the criterion of eigenvalues greater than one, the first three principal components were retained, with a cumulative contribution rate of 79.81% (Figure 7b). The cumulative contribution rate of the first principal component was 58.92%, mainly reflecting the contributions of TK (loading: 0.92; contribution: 10.94%; Figure 7c,d), TP (loading: 0.91; contribution: 10.68%), and AP (loading: 0.88; contribution: 10.03%). Meanwhile, that of the second principal component was 12.77%, mainly reflecting the contributions of SOM (loading: −0.56; contribution: 21.62%), TN (loading: 0.50; contribution: 17.08%), and SBD (loading: 0.50; contribution: 16.81%). The cumulative contribution rate of the third principal component was 8.35%, reflecting the contributions of EMg (loading: −0.62; contribution: 34.43%), pH (loading: −0.60; contribution:32.76%), and AK (loading: 0.33; contribution: 9.84%).
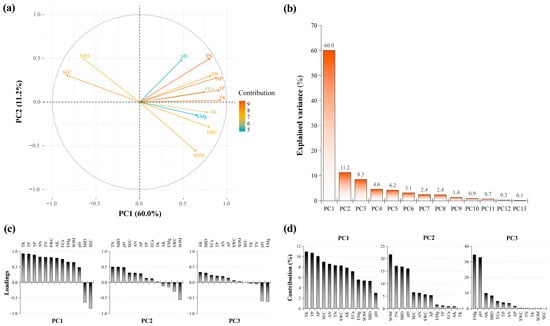
Figure 7.
PCA of soil physicochemical factors. (a) Biplot resulting from PCA; (b) explained variance for the retained principal components; (c) barplot for the loadings; and (d) contributions for each variable on the retained principal components. SBD, soil bulk density; SWC, soil water content; SEC, soil electrical conductivity; SOM, soil organic matter; TN, total nitrogen; TP, total phosphorus; TK, total potassium; AN, alkali-hydrolyzed nitrogen; AP, available phosphorus; AK, available potassium; ECa, exchangeable calcium; EMg, exchangeable magnesium.
3.3.3. Pathways of Influence of Environmental Factors on Soil Physicochemical Properties
As shown in Figure 8a, SEM analysis showed that soil physicochemical factors were primarily directly influenced by litter and biological factors, with path coefficients of 0.311 (p < 0.01) and 0.671 (p < 0.01), respectively. In addition, they were indirectly influenced by topographic factors. The indirect paths of topographic factors affecting soil physicochemical factors had significant effects on litter and biological factors with path coefficients of 0.664 (p < 0.01) and 0.897 (p < 0.001), respectively. Together, topographic, biological, and litter factors explained 91% (R2) of the variation in the soil physicochemical properties. Their contributions are shown in Figure 8b, from highest to lowest as follows: topography (0.76), biology (0.67), and litter (0.31).
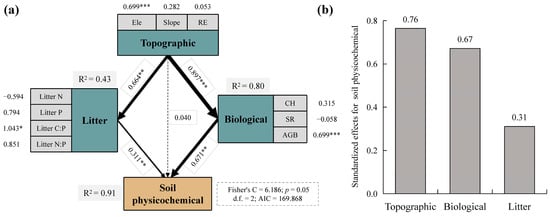
Figure 8.
PiecewiseSEM pathway analysis of soil physicochemical characteristics. (a) Path analysis diagram for each factor and (b) their standardized effects for soil physicochemical characteristics. Soil physicochemical characteristics were derived from PCA. The dashed line indicates that the regression results are not significant, and the solid line is significant. The thickness of the line indicates the size of the path coefficient, and the numbers next to the line represent regression coefficients; * p < 0.05, ** p < 0.01, and *** p < 0.001. Ele, elevation; RE, rock exposure; Litter N, litter nitrogen; Litter P, litter phosphorus; Litter C:P, litter carbon–phosphorus ratio; Litter N:P, litter nitrogen–phosphorus ratio; CH, community height; SR, species richness; AGB, aboveground biomass.
4. Discussion
4.1. Effects of Vegetation Restoration on Soil Physicochemical Properties
The natural recovery of vegetation in karst geomorphic areas effectively mitigates the impact of karstification and anthropogenic disturbances on environmental and ecological risks. This process crucially supports the maintenance and enhancement of soil quality [13,19]. In this study, we observed a decrease in SBD with the natural resurgence of vegetation, which is consistent with prior work [14]. The growth and expansion of plant roots during vegetation recovery augments soil porosity by enhancing the soil structure, thereby reducing SBD [20]. SWC has significantly influenced vegetation growth and development in karst areas [21]. Correspondingly, vegetation cover increases with the natural recovery of vegetation (Table 1). This, in turn, mitigates erosion, protects the soil surface, and reduces water loss and soil erosion [13,22]. Increased vegetation cover slows direct soil water infiltration, prolonging rainfall residence time and promoting SWC, which corroborates our findings [23,24]. The SEC is a key indicator of soil moisture conditions and indirectly reflects soil salinity [25]. We observed a decrease in SEC with the natural resurgence of vegetation, likely because of the increased SWC and diminished soil salinity [24]. Along the soil profile, SWC and SEC declined with increasing soil depth across each restoration stage, whereas SBD increased. This may be attributed to diminished weathering and rock decomposition in deeper soil layers, resulting in increased SBD [26]. Plant roots are predominantly concentrated in shallow soil layers, affecting soil porosity by occupying the pore space. Therefore, a decrease in root presence in deeper soil layers may contribute to diminished soil porosity. A lower soil porosity in deeper soil layers may lead to reduced water storage, resulting in a relatively lower SWC in those layers [27,28]. Karst areas commonly harbor soluble minerals such as carbonates in rocks, which release ions during weathering. As the depth increases, rock weathering weakens, diminishing the presence of conductive materials in the soil and lowering the SEC [29].
In this study, the soil exhibited alkaline pH levels. With vegetation recovery, soil pH showed an initially decreasing and subsequent increasing trend. This may be because the roots of herbaceous plants are shallow, and root secretions have minimal impact on the soil, resulting in higher soil pH values during the TU stage. In the SL stage, plants are in a rapid growth phase and have higher nutrient demands. Roots secrete organic acids to dissolve minerals in the soil and release necessary nutrients. The increase in organic acid secretion by roots also absorbs alkaline substances, resulting in the lowest pH values [30]. As the vegetation further recovers, the secretion of organic acids by tree roots decreases, while the alkaline substances produced from litter decomposition increase, gradually causing soil pH levels to rise during the YSF, MSF, and PF stages [31]. SOM is a key indicator for assessing soil quality and is intricately linked to ecosystem services such as carbon sequestration, water retention, soil fertility, and erosion control [32]. The SOM content typically increases during vegetation recovery owing to the increased vegetation cover. As plants engage in photosynthesis, they absorb CO2 and sequester it in their tissues. The decomposition of dead plant matter and leaves gradually releases organic material into the soil [33,34]. Biological processes play a critical role in the proliferation of microorganisms. Other soil organisms aid in the decomposition of plant and animal residues, facilitating their conversion into more stable organic matter stored within the soil matrix [35]. Along the soil profile, the surface soil experiences humus enrichment owing to the abundant distribution of litter and roots. As litter and roots decompose, SOM content decreases with increasing soil depth [36].
Here, a pronounced increase in the soil nutrient content, including TN, AN, TP, AP, TK, and AK, was observed along with vegetation recovery. As the vegetation gradually regenerates, the accumulation of plant residues in the soil prompts a substantial release of organic matter and nutrients during decomposition, that is, nitrogen, phosphorus, and potassium, which are important for plant growth [37,38]. During growth, plant roots secrete diverse organic substances such as organic acids and plant hormones. These substances facilitate the dissolution of solid nutrients into forms that are directly absorbed and used by plants, thereby increasing the soil nutrient content [39]. The proliferation of vegetation roots supports soil particle aggregation and soil aggregate formation, which enhances soil structure and increases water retention and aeration. These processes are conducive to nutrient storage and supply [40]. With vegetation recovery, the soil microbial community experiences increased activity. This contributes to increased nutrient release, including nitrogen, phosphorus, and potassium, through activities such as organic matter decomposition and nitrogen fixation [35]. Across each restoration stage, the distributions of TN, AN, AP, and AK in the soil profile generally followed a consistent pattern and declined with increasing soil depth. In karst areas, plant roots are primarily concentrated in the surface soil, where nutrient absorption is most vigorous. As soil depth increases, root activity diminishes, resulting in elevated nutrient content in the surface soil [41]. In contrast, the surface soil is enriched with soil organic matter, harboring ample nitrogen, phosphorus, potassium, and other nutrients. As the soil depth increases, the decomposition of organic matter gradually decreases, slowing the release rate of nutrients, and diminishing their availability [42]. Soil nutrients may migrate downward with water infiltration, leading to a reduction in nutrient content with increasing soil depth [43,44]. However, in contrast to the observed trends for other nutrients, soil TK and TP showed relatively stable patterns with increasing soil depth. This stability may stem from the multifaceted influences on TP distribution and transformation in the soil, such as groundwater leaching, microbial activity, and plant absorption [45]. TK encompasses the portions bound to soil particles and organic matter, rendering it less susceptible to external influences [46].
Soil ECa and EMg refer to the proportion of Ca and Mg in the soil that can be released to plants through ion exchange processes, which are crucial for soil fertility and plant growth [47]. Throughout this study, the ECa and EMg levels had an upward trajectory alongside vegetation recovery. The regrowth of vegetation encourages organic matter accumulation in the soil, augmenting the anion exchange capacity of the soil and facilitating the adsorption and exchange of calcium and magnesium. Vegetation recovery enhances soil water retention capabilities, supporting the migration and exchange of essential elements [48]. Conversely, the root activity of vegetation mitigates soil erosion, thereby retaining mineral particles within the soil and maintaining the relative abundances of ECa and EMg [49]. In the soil profile, EMg tends to decrease with increasing soil depth. This may be attributed to the impacts of karstification, which renders magnesium prone to leaching, alongside facilitating magnesium dissolution and absorption by organic substances released from the vegetation’s roots. The limited Mg uptake by plant roots in deeper soil layers likely contributes to the decline in EMg with increasing soil depth [50]. In contrast, ECa showed no significant variation with increasing soil depth. This stability may be ascribed to the dominance of limestone in karst areas where weathering and soil formation processes liberate calcium ions from the soil. Owing to the abundant Ca content in the soil parent material, ECa levels remain relatively high and stable across distinct soil depths [51].
4.2. Relationship between Environmental Factors and Soil Physicochemical Properties
Correlation analysis showed significant negative correlations between SBD and SWC, which is consistent with prior research [52,53]. An increase in SBD reduces the distance between soil particles, leading to a decrease in soil porosity [54]. Elevated SBD results in a denser soil pore structure, diminishing pore connectivity and permeability and reducing soil water storage space and SWC [55]. The soil pH showed significant positive correlations with TN, TP, TK, AN, AP, ECa, and EMg. This association stems from the pH-induced reduction in the hydrogen ion concentration, which enhances nutrient availability [56]. Neutral to alkaline pH conditions support microbial activity, promoting the release and transformation of nutrients such as nitrogen, phosphorus, and potassium [57]. The positive correlation among soil pH, ECa, and EMg reflects the regulation of soil acidity and alkalinity through soil ion exchange processes [58]. SOM showed significant positive correlations with TN, TP, TK, AN, AP, AK, ECa, and EMg. This indicated that increased SOM content in karst soils may coincide with elevated levels of these nutrients and cation exchange capacity. This correlation underscores the constructive role of SOM in soil nutrient release and transformation, given its richness in nutrients and cation exchange capacity, facilitating soil fertility [59,60]. All the soil nutrient factors, that is, TN, TP, TK, AN, AP, and AK, and cation exchange capacity factors, namely ECa and EMg, had significant positive correlations. This suggested potential synergistic effects where soil nutrients and cation exchange capacity mutually influenced each other’s distribution in the soil [61].
PCA delineated the key factors and their contributions to soil physicochemical properties. The first principal component was primarily influenced by TK, TP, and AP, which highlighted the pivotal role of these nutrients in soil fertility. The second principal component primarily reflected the impacts of SOM, TN, and SBD; these factors not only affect the structure, aeration, and water retention of the soil but also directly relate to the fertility of the soil and the growth environment of plant roots. The third principal component, characterized by EMg, pH, and AK, underscores the significance of soil acidity and the efficacy of trace elements, such as magnesium and potassium, in shaping soil properties. Changes in vegetation from restoration efforts lead to variations in plant growth and nutrient absorption capacity, altering litter carbon, nitrogen, and phosphorus contents, thereby influencing soil physicochemical properties [62]. Terrain also has a significant impact on soil physicochemical properties [63]. SEM showed that soil physicochemical properties are a collective outcome of various factors, including topography, biology, and litter. These factors interact to shape soil characteristics and status. They have diverse effects, with biology and litter directly providing nutrients and enhancing soil structure. Meanwhile, topography primarily influences soil physicochemical properties indirectly by impacting environmental factors and ecological processes [64,65]. This interplay between the direct and indirect effects adds complexity and diversity to soil systems. Although each factor affects the soil physicochemical properties, their contributions differ. Topography made the most significant contribution, followed by biology, with little contribution from litter. These contributions offer insights into the roles and positions of different factors in soil systems, aiding the development of targeted soil management strategies. During the natural restoration of vegetation in karst areas, soil physicochemical properties change significantly due to various factors. Key influences include rock weathering, the vegetation’s root activity, and microbial decomposition, which are crucial for soil formation. Leaching and deposition processes also significantly affect soil structure and properties [66,67]. In the early stages of vegetation restoration, the growth of pioneer species positively influences soil properties, gradually improving as restoration continues [68]. Vegetation restoration and soil formation are interdependent, reinforcing each other to promote ecosystem recovery and stabilization [69]. Therefore, future ecological restoration and management efforts in karst areas should consider this interaction and adopt scientifically sound measures to promote the overall restoration and sustainable development of the ecosystem.
5. Conclusions
This study illustrated the significant impacts of natural vegetation restoration on soil physicochemical properties in tropical karst areas. With vegetation restoration, SWC typically increased, whereas SBD and SEC tended to decrease. Soil pH initially decreased and subsequently increased, with the lowest values observed during the shrubland stage. In the later stages of vegetation recovery (MSF and PF), soil pH was higher compared to the early recovery stage (TU), although the difference was not statistically significant. And the SOM generally increased. The soil nutrient content, that is, TN, TP, TK, AN, AP, and AK, and cation exchange capacity, namely ECa and EMg, all increased significantly. In the soil profile, the SP, SWC, and SEC decreased with increasing soil depth, whereas the SBD increased significantly. SOM and soil nutrients excluding TK and TP decreased with EMg, whereas soil pH, TK, TP, and ECa remained relatively stable. PCA analysis showed that the first principal component mainly encompassed the contributions of TK, TP, and AP. The second principal component was predominantly influenced by SBD, SP, and TN. The third principal component primarily reflected the contributions of pH, EMg, and AK, underscoring the significance of these factors and furnishing pivotal insights for a detailed understanding of karst soil characteristics. SEM suggested that soil physicochemical properties are primarily directly influenced by litter and biological factors and indirectly by topographic factors. Therefore, based on the results of this study, we propose the following recommendations for vegetation restoration and soil improvement in karst areas: Firstly, prioritize the utilization of natural recovery mechanisms. Secondly, select vegetation types suitable for the local ecological environment. Simultaneously, monitor and adjust in a timely manner the soil pH levels to ensure soil health. Properly manage litter to promote nutrient cycling. Thoroughly consider topographical factors and formulate appropriate restoration strategies. Finally, strengthen soil and water conservation measures to systematically improve soil quality and optimize the effectiveness of ecological restoration.
Supplementary Materials
The following supporting information can be downloaded at: https://www.mdpi.com/article/10.3390/f15071270/s1, Table S1: Carbon, nitrogen, and phosphorus contents of litter and their stoichiometric ratios in the plots at each vegetation restoration stage.
Author Contributions
Conceptualization, G.H. and Z.Z.; Formal analysis, B.Z., G.H., C.H. and Z.Z.; Funding acquisition, G.H., C.X., C.H., C.Z., S.C. and Z.Z.; Investigation, B.Z., G.H., C.X., C.Z., S.C. and Z.Z.; Methodology, B.Z., C.X. and C.Z.; Writing—original draft, B.Z., G.H., C.H., S.C. and Z.Z.; Writing—review and editing, B.Z., G.H., C.X., C.Z., S.C. and Z.Z. All authors have read and agreed to the published version of the manuscript.
Funding
This work was supported by the Natural Science Foundation of Guangxi (2021GXNSFFA196005, 2021GXNSFAA196024, 2022GXNSFBA035633, 2022GXNSFBA035461), the National Natural Science Foundation of China (31960275, 42201023, 42301073), and the Construction Project of the College of Natural Resources Digital Industry, Nanning Normal University.
Data Availability Statement
The data that support the findings of this study are available upon request from the corresponding author.
Conflicts of Interest
The authors declare no conflicts of interest.
References
- Li, S.L.; Xu, S.; Wang, T.J.; Yue, F.J.; Peng, T.; Zhong, J.; Wang, L.C.; Chen, J.A.; Wang, S.J.; Chen, X.; et al. Effects of agricultural activities coupled with karst structures on riverine biogeochemical cycles and environmental quality in the karst region. Agr. Ecosyst. Environ. 2020, 303, 107120. [Google Scholar] [CrossRef]
- Wang, K.L.; Yue, Y.M.; Chen, H.S.; Zeng, F.P. Mechanisms and realization pathways for integration of scientific poverty alleviation and ecosystem services enhancement. Bull. Chin. Acad. Sci. 2020, 35, 1264–1272. (In Chinese) [Google Scholar] [CrossRef]
- Zhang, L.L.; Du, H.; Yang, Z.Q.; Song, T.Q.; Zeng, F.P.; Peng, W.X.; Huang, G.Q. Topography and soil properties determine biomass and productivity indirectly via community structural and species diversity in karst forest, Southwest China. Sustainability 2022, 14, 7644. [Google Scholar] [CrossRef]
- He, J.; Dai, Q.H.; Yi, X.S.; Wang, Y.; Peng, X.D.; Yan, Y.J. Soil water retention modulates effects of soil nutrients and stoichiometry on stability of organic carbon in a karst region, Southwestern China. Plant Soil 2023, 489, 557–572. [Google Scholar] [CrossRef]
- Wu, Q.; Zheng, W.; Rao, C.J.; Wang, E.W.; Yan, W.D. Soil quality assessment and management in karst rocky desertification ecosystem of Southwest China. Forests 2022, 13, 1513. [Google Scholar] [CrossRef]
- Jiang, Z.C.; Lian, Y.Q.; Qin, X.Q. Rocky desertification in Southwest China: Impacts, causes, and restoration. Earth-Sci. Rev. 2014, 132, 145160. [Google Scholar] [CrossRef]
- Zhang, X.M.; Yue, Y.M.; Tong, X.W.; Wang, K.L.; Qi, X.K.; Deng, C.X.; Brandt, M. Eco-engineering controls vegetation trends in southwest China karst. Sci. Total Environ. 2021, 770, 145160. [Google Scholar] [CrossRef]
- Qiao, Y.N.; Jiang, Y.J.; Zhang, C.Y. Contribution of karst ecological restoration engineering to vegetation greening in southwest China during recent decade. Ecol. Indic. 2021, 121, 107081. [Google Scholar] [CrossRef]
- Hua, F.Y.; Bruijnzeel, L.A.; Meli, P.; Martin, P.A.; Zhang, J.; Nakagawa, S.; Miao, X.R.; Wang, W.Y.; McEvoy, C.; Peña-Arancibia, J.L.; et al. The biodiversity and ecosystem service contributions and trade-offs of forest restoration approaches. Science 2022, 376, 839–844. [Google Scholar] [CrossRef]
- Guo, Y.Q.; Xu, T.Q.; Cheng, J.M.; Wei, G.H.; Lin, Y.B. Above-and belowground biodiversity drives soil multifunctionality along a long-term grassland restoration chronosequence. Sci. Total Environ. 2021, 772, 145010. [Google Scholar] [CrossRef]
- Zhu, S.C.; Zheng, H.X.; Liu, W.S.; Liu, C.; Guo, M.N.; Huot, H.; Morel, J.L.; Qiu, R.L.; Chao, Y.Q.; Tang, Y.T. Plant-soil feedbacks for the restoration of degraded mine lands: A review. Front. Microbiol. 2022, 12, 751794. [Google Scholar] [CrossRef] [PubMed]
- Javed, A.; Ali, E.; Afzal, K.B.; Osman, A.; Riaz, S. Soil fertility: Factors affecting soil fertility, and biodiversity responsible for soil fertility. Int. J. Plant Anim. Env. Sci. 2022, 12, 21–33. [Google Scholar] [CrossRef]
- Zhang, Y.H.; Xu, X.L.; Li, Z.W.; Liu, M.X.; Xu, C.H.; Zhang, R.F.; Luo, W. Effects of vegetation restoration on soil quality in degraded karst landscapes of southwest China. Sci. Total Environ. 2019, 650, 2657–2665. [Google Scholar] [CrossRef] [PubMed]
- Zhang, Y.H.; Xu, X.L.; Li, Z.W.; Xu, C.H.; Luo, W. Improvements in soil quality with vegetation succession in subtropical China karst. Sci. Total Environ. 2021, 775, 145876. [Google Scholar] [CrossRef] [PubMed]
- Xiao, C.; You, R.; Zhu, N.H.; Mi, X.Q.; Gao, L.; Zhou, X.S.; Zhou, G.Y. Variation of soil physicochemical properties of different vegetation restoration types on subtropical karst area in southern China. PLoS ONE 2023, 18, e0282620. [Google Scholar] [CrossRef] [PubMed]
- Guan, H.L.; Fan, J.W. Effects of vegetation restoration on soil quality in fragile karst ecosystems of southwest China. PeerJ 2020, 8, e9456. [Google Scholar] [CrossRef] [PubMed]
- Liu, C.C.; Wei, Y.F.; Liu, Y.G.; Guo, K. Biomass of canopy and shrub layers of karst forests in Puding, Guizhou, China. J. Plant Ecol. 2009, 33, 698–705. (In Chinese) [Google Scholar] [CrossRef]
- Bao, S.D. Soil Agrochemical Analysis; China Agricultural Press: Beijing, China, 2000. (In Chinese) [Google Scholar]
- Melekhina, E.N.; Kanev, V.A.; Deneva, S.V. Karst ecosystems of middle Timan, Russia: Soils, plant communities, and soil oribatid mites. Diversity 2022, 14, 718. [Google Scholar] [CrossRef]
- Gu, C.J.; Mu, X.M.; Gao, P.; Zhao, G.J.; Sun, W.Y.; Tatarko, J.; Tan, X.J. Influence of vegetation restoration on soil physical properties in the Loess Plateau, China. J. Soil. Sediment. 2019, 19, 716–728. [Google Scholar] [CrossRef]
- Zhong, F.X.; Xu, X.L.; Li, Z.W.; Zeng, X.M.; Yi, R.Z.; Luo, W.; Zhang, Y.H.; Xu, C.H. Relationships between lithology, topography, soil, and vegetation, and their implications for karst vegetation restoration. Catena 2022, 209, 105831. [Google Scholar] [CrossRef]
- Mensah, A.K. Role of revegetation in restoring fertility of degraded mined soils in Ghana: A review. Int. J. Biodivers. Conserv. 2015, 7, 57–80. [Google Scholar] [CrossRef]
- He, Z.M.; Jia, G.D.; Liu, Z.Q.; Zhang, Z.Y.; Yu, X.X.; Xiao, P.Q. Field studies on the influence of rainfall intensity, vegetation cover and slope length on soil moisture infiltration on typical watersheds of the Loess Plateau, China. Hydrol. Process. 2020, 34, 4904–4919. [Google Scholar] [CrossRef]
- Liu, H.Y.; Dai, J.Y.; Xu, C.Y.; Peng, J.; Wu, X.C.; Wang, H.Y. Bedrock-associated belowground and aboveground interactions and their implications for vegetation restoration in the karst critical zone of subtropical Southwest China. Prog. Phys. Geog. 2021, 45, 7–19. [Google Scholar] [CrossRef]
- Eigenberg, R.A.; Nienaber, J.A.; Woodbury, B.L.; Ferguson, R.B. Soil conductivity as a measure of soil and crop status—A four-year summary. Soil Sci. Soc. Am. J. 2006, 70, 1600–1611. [Google Scholar] [CrossRef]
- Green, S.M.; Dungait, J.A.; Tu, C.; Buss, H.L.; Sanderson, N.; Hawkes, S.J.; Xing, K.X.; Yue, F.J.; Hussey, V.L.; Peng, J.; et al. Soil functions and ecosystem services research in the Chinese karst Critical Zone. Chem. Geol. 2019, 527, 119107. [Google Scholar] [CrossRef]
- Li, T.Y.; Zeng, J.M.; He, B.H.; Chen, Z.P. Changes in soil C, N, and P concentrations and stoichiometry in karst trough valley area under ecological restoration: The role of slope aspect, land use, and soil depth. Forests 2021, 12, 144. [Google Scholar] [CrossRef]
- Liu, W.J.; Li, P.J.; Duan, W.P.; Liu, W.Y. Dry-season water utilization by trees growing on thin karst soils in a seasonal tropical rainforest of Xishuangbanna, Southwest China. Ecohydrology 2014, 7, 927–935. [Google Scholar] [CrossRef]
- Worthington, S.R.; Davies, G.J.; Alexander, E.C., Jr. Enhancement of bedrock permeability by weathering. Earth-Sci. Rev. 2016, 160, 188–202. [Google Scholar] [CrossRef]
- Adeleke, R.; Nwangburuka, C.; Oboirien, B. Origins, roles and fate of organic acids in soils: A review. S. Afr. J. Bot. 2017, 108, 393–406. [Google Scholar] [CrossRef]
- Fageria, N.K.; Baligar, V.C.; Clark, R.B. Micronutrients in crop production. Adv. Agron. 2002, 77, 185–268. [Google Scholar] [CrossRef]
- Teixeira, H.M.; Cardoso, I.M.; Bianchi, F.J.; da Cruz Silva, A.; Jamme, D.; Peña-Claros, M. Linking vegetation and soil functions during secondary forest succession in the Atlantic forest. Forest Ecol. Manag. 2020, 457, 117696. [Google Scholar] [CrossRef]
- Nair, R.; Mehta, C.R.; Sharma, S. Carbon sequestration in soils—A Review. Agric. Rev. 2015, 36, 81–99. [Google Scholar] [CrossRef]
- Valjavec, M.B.; Čarni, A.; Žlindra, D.; Zorn, M.; Marinšek, A. Soil organic carbon stock capacity in karst dolines under different land uses. Catena 2022, 218, 106548. [Google Scholar] [CrossRef]
- Hoffland, E.; Kuyper, T.W.; Comans, R.N.; Creamer, R.E. Eco-functionality of organic matter in soils. Plant Soil 2020, 455, 1–22. [Google Scholar] [CrossRef]
- Frouz, J. Effects of soil macro- and mesofauna on litter decomposition and soil organic matter stabilization. Geoderma 2018, 332, 161–172. [Google Scholar] [CrossRef]
- Zhu, X.Y.; Fang, X.; Xiang, W.H.; Chen, L.; Ouyang, S.; Lei, P.F. Vegetation restoration drives dynamics of soil nitrogen content and availability in the subtropics. Catena 2023, 220, 106720. [Google Scholar] [CrossRef]
- Gong, X.; Liu, Y.Q.; Li, Q.L.; Wei, X.H.; Guo, X.M.; Niu, D.K.; Zhang, W.Y.; Zhang, J.X.; Zhang, L. Sub-tropic degraded red soil restoration: Is soil organic carbon build-up limited by nutrients supply. Forest Ecol. Manag. 2013, 300, 77–87. [Google Scholar] [CrossRef]
- Yadav, A.; Yadav, K.; Abd-Elsalam, K.A. Nanofertilizers: Types, delivery and advantages in agricultural sustainability. Agrochemicals 2023, 2, 296–336. [Google Scholar] [CrossRef]
- Shen, J.B.; Yuan, L.X.; Zhang, J.L.; Li, H.G.; Bai, Z.H.; Chen, X.P.; Zhang, W.F.; Zhang, F.S. Phosphorus dynamics: From soil to plant. Plant Physiol. 2011, 156, 997–1005. [Google Scholar] [CrossRef]
- Li, G.M.; Liu, P.; Zhao, J.H.; Su, L.Y.N.; Zhao, M.Y.; Jiang, Z.J.; Zhao, Y.; Yang, X.P. Correlation of microbiomes in “plant-insect-soil” ecosystem. Front. Microbiol. 2023, 14, 1088532. [Google Scholar] [CrossRef]
- Jobbagy, E.G.; Jackson, R.B. The distribution of soil nutrients with depth: Global patterns and the imprint of plants. Biogeochemistry 2001, 53, 51–77. [Google Scholar] [CrossRef]
- Poirier, V.; Roumet, C.; Munson, A.D. The root of the matter: Linking root traits and soil organic matter stabilization processes. Soil Biol. Biochem. 2018, 120, 246–259. [Google Scholar] [CrossRef]
- Zhang, S.L.; Huffman, T.; Zhang, X.Y.; Liu, W.; Liu, Z.H. Spatial distribution of soil nutrient at depth in black soil of Northeast China: A case study of soil available phosphorus and total phosphorus. J. Soil. Sediment. 2014, 14, 1775–1789. [Google Scholar] [CrossRef]
- Wang, L.L.; Zhang, G.H.; Zhu, P.Z.; Xing, S.K.; Wang, C.S. Soil C, N and P contents and their stoichiometry as affected by typical plant communities on steep gully slopes of the Loess Plateau, China. Catena 2022, 208, 105740. [Google Scholar] [CrossRef]
- Reitemeier, R.F. Soil potassium. Adv. Agron. 1951, 3, 113–164. [Google Scholar] [CrossRef]
- Qadir, M.; Schubert, S.J.L.D. Degradation processes and nutrient constraints in sodic soils. Land Degrad. Dev. 2002, 13, 275–294. [Google Scholar] [CrossRef]
- Xu, X.; Guo, L.; Wang, S.B.; Wang, X.Y.; Ren, M.; Zhao, P.J.; Huang, Z.Y.; Jia, H.J.; Wang, J.H.; Lin, A.J. Effective strategies for reclamation of saline-alkali soil and response mechanisms of the soil-plant system. Sci. Total Environ. 2023, 905, 167179. [Google Scholar] [CrossRef]
- Fageria, N.K.; Moreira, A. The role of mineral nutrition on root growth of crop plants. Adv. Agron. 2011, 110, 251–331. [Google Scholar] [CrossRef]
- Liu, C.N.; Huang, Y.; Wu, F.; Liu, W.J.; Ning, Y.Q.; Huang, Z.; Tang, S.Q.; Liang, Y. Plant adaptability in karst regions. J. Plant Res. 2021, 134, 889–906. [Google Scholar] [CrossRef]
- Luo, Y.; Shi, C.M.; Yang, S.T.; Liu, Y.; Zhao, S.; Zhang, C.C. Characteristics of soil calcium content distribution in karst dry-hot valley and its influencing factors. Water 2023, 15, 1119. [Google Scholar] [CrossRef]
- Sheng, M.Y.; Xiong, K.N.; Wang, L.J.; Li, X.N.; Li, R.; Tian, X.J. Response of soil physical and chemical properties to Rocky desertification succession in South China Karst. Carbonate. Evaporite. 2018, 33, 15–28. [Google Scholar] [CrossRef]
- Zhang, Z.C.; Chen, X.; Ghadouani, A.; Shi, P. Modelling hydrological processes influenced by soil, rock and vegetation in a small karst basin of southwest China. Hydrol. Process. 2011, 25, 2456–2470. [Google Scholar] [CrossRef]
- Robinson, D.A.; Thomas, A.; Reinsch, S.; Lebron, I.; Feeney, C.J.; Maskell, L.C.; Wood, C.M.; Seaton, F.M.; Emmett, B.A.; Cosby, B.J. Analytical modelling of soil porosity and bulk density across the soil organic matter and land-use continuum. Sci. Rep. 2022, 12, 7085. [Google Scholar] [CrossRef] [PubMed]
- Huang, X.J.; Horn, R.; Ren, T.S. Soil structure effects on deformation, pore water pressure, and consequences for air permeability during compaction and subsequent shearing. Geoderma 2022, 406, 115452. [Google Scholar] [CrossRef]
- Huang, K.; Li, M.Q.; Li, R.P.; Rasul, F.; Shahzad, S.; Wu, C.H.; Shao, J.H.; Huang, G.Q.; Li, R.H.; Almari, S.; et al. Soil acidification and salinity: The importance of biochar application to agricultural soils. Front. Plant Sci. 2023, 14, 1206820. [Google Scholar] [CrossRef]
- Msimbira, L.A.; Smith, D.L. The roles of plant growth promoting microbes in enhancing plant tolerance to acidity and alkalinity stresses. Front. Sustain. Food Syst. 2020, 4, 106. [Google Scholar] [CrossRef]
- Hu, B.F.; Xie, M.D.; Li, H.Y.; He, R.B.; Zhou, Y.; Jiang, Y.F.; Ji, W.J.; Peng, J.; Xia, F.; Liang, Z.Z.; et al. Climate and soil management factors control spatio-temporal variation of soil nutrients and soil organic matter in the farmland of Jiangxi Province in South China. J. Soil. Sediment. 2023, 23, 2373–2395. [Google Scholar] [CrossRef]
- Wei, H.; Deng, Y.S.; Lin, L.W.; Wang, J.Y.; Huang, J. Improved soil composition promotes nutrient recovery during vegetation restoration in karst peak-cluster depressions. Catena 2023, 222, 106769. [Google Scholar] [CrossRef]
- Wang, Y.; Dungait, J.A.J.; Xing, K.X.; Green, S.M.; Hartley, I.; Tu, C.L.; Quine, T.A.; Tian, J.; Kuzyakov, Y. Persistence of soil microbial function at the rock-soil interface in degraded karst topsoils. Land Degrad. Dev. 2020, 31, 251–265. [Google Scholar] [CrossRef]
- Rietra, R.P.J.J.; Heinen, M.; Dimkpa, C.O.; Bindraban, P.S. Effects of nutrient antagonism and synergism on yield and fertilizer use efficiency. Commun. Soil Sci. Plant 2017, 48, 1895–1920. [Google Scholar] [CrossRef]
- Zhu, B.B.; Li, Z.B.; Li, P.; Liu, G.B.; Xue, S. Soil erodibility, microbial biomass, and physical–chemical property changes during long-term natural vegetation restoration: A case study in the Loess Plateau, China. Ecol. Res. 2010, 25, 531–541. [Google Scholar] [CrossRef]
- Wang, M.M.; Chen, H.S.; Zhang, W.; Wang, K.L. Influencing factors on soil nutrients at different scales in a karst area. Catena 2019, 175, 411–420. [Google Scholar] [CrossRef]
- Ge, X.G.; Zeng, L.X.; Xiao, W.F.; Huang, Z.L.; Geng, X.S.; Tan, B.W. Effect of litter substrate quality and soil nutrients on forest litter decomposition: A review. Acta Ecol. Sin. 2013, 33, 102–108. [Google Scholar] [CrossRef]
- Zhang, C.; Zeng, F.P.; Zeng, Z.X.; Du, H.; Zhang, L.J.; Su, L.; Lu, M.Z.; Zhang, H. Carbon, nitrogen and phosphorus stoichiometry and its influencing factors in karst primary forest. Forests 2022, 13, 1990. [Google Scholar] [CrossRef]
- Xiong, K.; Yin, C.; Ji, H.B. Soil erosion and chemical weathering in a region with typical karst topography. Environ. Earth Sci. 2018, 77, 500. [Google Scholar] [CrossRef]
- Qiu, S.J.; Peng, J.; Zheng, H.N.; Xu, Z.H.; Meersmans, J. How can massive ecological restoration programs interplay with social-ecological systems? A review of research in the South China karst region. Sci. Total Environ. 2022, 807, 150723. [Google Scholar] [CrossRef] [PubMed]
- Chen, T.T.; Peng, L.; Liu, S.Q.; Wang, Q. Land cover change in different altitudes of Guizhou-Guangxi karst mountain area, China: Patterns and drivers. J. Mt. Sci. 2017, 14, 1873–1888. [Google Scholar] [CrossRef]
- Zhou, Q.W.; Luo, Y.Z.; Shi, C.M.; Li, Y. Hydrological effects of vegetation restoration in karst areas research: Progress and challenges. Trans. Earth Environ. Sustain. 2023, 1, 177–204. [Google Scholar] [CrossRef]
Disclaimer/Publisher’s Note: The statements, opinions and data contained in all publications are solely those of the individual author(s) and contributor(s) and not of MDPI and/or the editor(s). MDPI and/or the editor(s) disclaim responsibility for any injury to people or property resulting from any ideas, methods, instructions or products referred to in the content. |
© 2024 by the authors. Licensee MDPI, Basel, Switzerland. This article is an open access article distributed under the terms and conditions of the Creative Commons Attribution (CC BY) license (https://creativecommons.org/licenses/by/4.0/).