Article

Soil pH and Nutrient Content Sustain Variability of Soil Bacterial Community Structure and Activity after Forest Clear-Cutting

by
Katalin Bereczki
1,2,*,
Attila Benke
3,
Endre György Tóth
4,
Melinda Megyes
1,
Kristóf Korponai
5,
Tibor Szili-Kovács
6,
Gábor Illés
2,
Botond Boldizsár Lados
3 and
Károly Márialigeti
7
1
Doctoral School of Environmental Sciences, Eötvös Loránd University, 1117 Budapest, Hungary
2
Department of Forest Management and Ecology, Forest Research Institute, University of Sopron, 9600 Sárvár, Hungary
3
Department of Forestry Breeding, Forest Research Institute, University of Sopron, 9600 Sárvár, Hungary
4
National Coalition of Independent Scholars (NCIS), Brattleboro, VT 05301, USA
5
Department of Plant Molecular Biology, Agricultural Institute, Centre for Agricultural Research, 2462 Martonvásár, Hungary
6
Institute for Soil Sciences, HUN-REN Centre for Agricultural Research, 1022 Budapest, Hungary
7
Department of Microbiology, Eötvös Loránd University, 1117 Budapest, Hungary
*
Author to whom correspondence should be addressed.
Forests 2024, 15(8), 1284; https://doi.org/10.3390/f15081284
Submission received: 23 June 2024 / Revised: 19 July 2024 / Accepted: 22 July 2024 / Published: 23 July 2024
(This article belongs to the Section Forest Soil)

Abstract

:
Clear-cutting is the most robust intervention in a forest ecosystem, causing marked changes in ecosystem processes. Although the effects of forest harvesting have been widely investigated, comparative studies can provide vital supplementary information concerning specific fields, including changes in soil microbiota structure and functioning. Our study examined the soil bacterial community composition, diversity, and activity of a mixed pedunculate oak stand over three years after clear-cutting based on 16S rRNA sequencing and substrate-induced respiration data. In addition, we conducted a yearly comparison with a control oak stand already in the regeneration phase. According to our results, the forest harvest caused only limited changes in the diversity, structure, and activity of the soil bacterial community of the oak stand, suggesting that soil parameters influence the soil bacterial community structure and functioning more significantly than the cessation of forest cover.

1. Introduction

Forest harvesting markedly disturbs the natural environment, affecting forest animal and plant communities [1,2,3]. Furthermore, the change in forest structure (timber removal) and soil disturbance caused by harvesting negatively affects the nutrient content and C storage of soils [4,5,6] and can induce a marked change in the structure of soil meso- and macrofaunal communities [7,8,9] and soil microbiota composition and functioning [10,11].
Soil microbiota actively participates in numerous soil processes, such as producing and consuming atmospheric gases, mediating nutrient cycling, influencing soil physicochemical properties (pH), and regulating carbon dynamics [12]. However, edaphic parameters, such as pH, nutrient content, and soil moisture, markedly influence soil microbiota community composition and functioning [13,14,15]. In addition, vegetation interferes with this complex soil–microbiota relationship and can also be considered an essential factor. Indeed, habitats with different vegetation types (e.g., grassland versus forest) or vegetation structures (different species composition) often show soil microbiota community composition and activity diversions [16,17,18,19]. Therefore, natural and/or artificial development or decline in forests implies changes in the soil microbiota.
Clear-cutting is an intensive harvest method that affects soil life considerably; however, the extent of change depends heavily on the prevailing environmental parameters, the harvesting technique used (level of organic horizon damage), or the time between the process and the observation. Through the organic-matter-removal effect, clear-cutting generally alters microbiota communities’ composition, decreasing their capability for biomass degradation [20]. At the same time, the alterations in microbial community structures that occur through forest harvesting can influence the soil’s nutrient cycling. Clear-cutting negatively impacts the quantity of nitrogen-oxidizing bacteria, implying marked changes in soil nitrogen, nitrate, and nitrite content [21,22]. However, the soil fungal community changes triggered by clear-cutting also play an essential role in forming the composition of soil bacterial communities. The disappearance of living trees increases the ratio of saprotrophs against ectomycorrhizal fungi [23,24], and the decrease in symbiont fungi could enhance the number of bacteria consuming labile C sources [25]. Although the alterations in the bacterial microbiome structure after the clear-cutting generally occurred due to the changed substrate quantity [26], they also can be influenced by the different environmental tolerances of the bacterial taxa [27]. Even though soil bacterial communities show higher resistance than fungi against environmental changes caused by clear-cutting [23], investigating their reaction in structure and activity under different site conditions can provide valuable information about the effect of forest harvesting. Their role in nutrient cycling can make some bacterial taxa suitable for the soil bioindicators of nutrient availability in the future [21]. Thus, all studies on changes in nutrient content and microbial community composition can contribute to the development of the microbial-based qualifying of soil fertility.
We studied the effect of clear-cutting on the soil bacterial community composition and activity of a mixed pedunculate oak forest. The study lasted over four vegetation periods, beginning before forest harvesting and continuing over three years after the disturbance. To separate the harvest-based changes of the bacterial community structure and activity from its periodic variations, we performed a yearly comparison with a control oak stand with a similar species composition already in the regeneration phase. The main oak stand was clear-cut in the winter of 2018–2019, while the control forest was clear-cut in 2016. The soil samplings occurred during four vegetation periods between 2018 and 2021. The relative abundance of bacterial taxa was investigated using amplicon sequence analysis, while bacterial community activity was evaluated using substrate-induced respiration measurements. The central question of the research was to what extent clear-cutting changes the forest soil bacterial community diversity, structure, and activity.
We hypothesized as follows: (1) that the soil microbial diversity, structure, and activity of the oak stand significantly change after the harvest compared to the initial state; (2) given that the main and the control stands are planted in former agricultural sites, are located close to each other, and are constituted of the same tree species, we also assumed that all of their studied soil microbial characteristics would become similar shortly after the disturbance (the harvest of the main stand) and that this similarity would be maintained throughout the study period; (3) summarily, we hypothesized that clear-cutting affects soil microbial life more robustly than soil characteristics, at least in the short term.

2. Materials and Methods

2.1. Study Sites

The study area is on the Mezőség Loess Ridge in Central Hungary, 150 m ASL. Experimental plots were designated in two forest compartments that are part of an 80.6-hectare forest block at Ráckeresztúr, afforested on former arable land during the 1930s. The area has a typical temperate climate, referred to as the Pannonian 2 environmental zone of Europe [28], and its soil type is chernozem developed on calcareous loess parental material.
The study involved two privately owned mixed pedunculate oak (Quercus robur L.) forests. The control stand (T1, 47°18′32.40″ N; 18°49′33.60″ E) had an extent of 5.71 hectares and was in the regeneration phase at the beginning of the study in 2018. Its former forest was composed of pedunculate oak (57%) and Turkey oak (Quercus cerris L.) individuals (43%) and was harvested in 2016. At the beginning of the study, one-year-old pedunculate and Turkey oak stump sprouts and seedlings constituted the forest area, with zero canopy closure. The main stand (T2, 47°18′43.20″ N; 18°49′51.60″ E) was a mature, 82-year-old mixed oak stand containing pedunculate oak (40%), Turkey oak (20%), and European ash (Fraxinus excelsior L., 40%) and, according to the forestry registration, had a 92% canopy closure in 2018. This forest has an area of 5.04 hectares. The regeneration of the T2 stand started in the winter of 2018–2019 with clear-cutting. The natural regeneration of this stand is based on the stump sprouts and seedlings that appeared naturally in the forest area, with a species constitution similar to the former stand. After the harvest (from the spring of 2019), a continuously developing young forest association constituted the area of T2 with zero canopy closure (forest data are demonstrated in Table S1).

2.2. Soil Sampling

Soil samples were collected five times in 2018 and 2019 and three times in 2020 and 2021, during spring, summer, and autumn months every year (accurate sampling times are detailed in Table S2). Study plots of 100 m2 (10 × 10 m) were marked on a homogeneous and typical part of both stands before the first sampling to ensure minimal disturbance in the private forests. During each sampling, 1-1 kg of soil samples was collected from two topsoil depths (0–10 cm, layer A; 10–40 cm, layer B) at three randomly chosen points in the study plots. The sampling points were always marked to avoid later re-sampling. The spade and the sampler spatulas were sterilized with 80% ethanol before excavating pits and collecting soil samples. After sampling, the soil samples were stored in disposable plastic bags and kept under low-temperature conditions (4 °C) until laboratory processing. The sample collection adhered to the following scheme at each sampling time: twelve samples (two plots, three sampling points, and two layers) were collected for soil physical, chemical, and substrate-induced respiration activity analyses. Furthermore, four composite samples were created to perform DNA isolation and metagenome analyses by accurately blending soil samples derived from the same layers in each plot (two plots and two layers). Soil samples were not separated into rhizosphere and bulk soils, so all samples represented the whole soil of the given layer and its microbiome.

2.3. DNA Extraction and High-Throughput Sequencing

The DNeasy PowerSoil Kit (Qiagen, Hilden, Germany) was used to extract community DNA from 0.25 g of soil samples, following the manufacturer’s instructions. After DNA extraction, the V3-V4 region containing the 16S rRNA gene was amplified using the 341F and 805R universal bacteria-specific primers with Illumina adapter overhang sequences added to their 5′ ends (Bakt_341F: 5′-CCTACGGGNGGCWGCAG-3′ and Bakt_805R: 5′-GACTACNVGGGTATCTAATCC-3′) [29]. All composite soil samples were amplified in triplicate to avert inter-sample variability.
The amplicon PCR mix contained the following components: 7.5 µL 2× Phusion Flash PCR Master Mix (Thermo Fischer Scientific, Waltham, MA, USA), 3 µL of each primer (1 µM) (Merck, Feltham, UK), and 1.5 µL template DNA. The following steps were used to construct the amplicon PCR according to Illumina protocol [30]: initial denaturation at 95 °C for 3 min; 25 cycles of denaturation (at 95 °C for 30 s), annealing (at 55 °C for 30 s), and elongation (at 72 °C for 30 s); and final extension at 72 °C for 5 min. Plates were stored in the PCR machine at 4 °C after completion of the program. Agencourt AMPure XP beads (Beckman Coulter, Indianapolis, IN, USA) were used to purify the PCR products. The quality of the amplification was checked with a Qiagen QIAxcel Advanced System (Qiagen, Hilden, Germany) using a DNA Screening Cartridge (Qiagen, Hilden, Germany). Triplicate PCR products from the same samples were pooled and mixed in one tube. A second PCR was used for amplicon indexing according to the manufacturer’s instructions using the dual indices of the Illumina Nextera XT Index Kit. After subsequent normalization using the Qubit 4.0 fluorometer (Invitrogen, Thermo Fischer Scientific, Waltham, MA, USA), libraries were pooled in equimolar ratios and sequenced using the Illumina MiSeq platform (Illumina, San Diego, CA, USA) with the MiSeq Reagent Kit v2 (2 × 250 bp) run configuration at the Centre for Agricultural Research, Agricultural Institute, Martonvásár, Hungary. The Illumina 16S metagenomic protocol was followed during the sequencing reaction preparation. The raw 16S rRNA gene sequencing data revealed during high-throughput sequencing are available at the NCBI Sequence Read Archive (SRA) (http://www.ncbi.nlm.nih.gov/sra, accessed on 31 January 2023) under accession number PRJNA929690 [SAMN32968875-32968894, SAMN35536186-35536232].

2.4. Environmental Analyses

Roots and other visible plant residues were removed to prepare the soil samples for physicochemical analyses, and then the samples were air-dried, ground, and sieved (mesh size 0.63 mm). Soil moisture content (SM) was determined based on weight differences between fresh and at 105 °C until weight stability dried soil samples [31]. The pH value ( pH H 2 O ) of the soil samples was measured at a soil:solvent ratio of 1:2.5 (w/v) using a pH meter with a glass electrode [32]. The total carbon (TC), total organic carbon (TOC), and total inorganic carbon (TIC) contents were analyzed by dry combustion [33] in an RC612 analyzer (LECO, St. Joseph, MI, USA). A dry combustion method [34] was also used to determine the total nitrogen (TN) content using a CN628 analyzer (LECO, St. Joseph, MI, USA). Calcium carbonate (CaCO3) content was determined using a Scheibler-type calcimeter [32]. Plant-available phosphorous (AL-P2O5) and nitrate nitrogen (NO3-N) contents were measured spectrophotometrically using a Shimadzu UV-1601 spectrophotometer (Shimadzu, Kyoto, Japan) following ammonium lactate and potassium chloride extraction [35]. Finally, the available potassium (AL-K2O), calcium (AL-Ca), magnesium (AL-Mg), and sodium (AL-Na) contents were determined following ammonium lactate (AL) extraction [35] using an Agilent 5110 ICP-OES analyzer (Agilent Technologies, Santa Clara, CA, USA).
Average daily mean temperatures were calculated for five-day periods (ADT5) before the sampling dates to include temperature as a variable in the environment–bacteria community structure and environment–microbe activity analyses. Average temperatures were calculated from the daily measurements of the closest automatic climate station in Martonvásár.

2.5. Bioinformatic Analysis of Sequence Data

Sequence reads were subjected to a series of processing steps using mothur v1.47 [36] following the MiSeq SOP pipeline (www.mothur.org, accessed on 20 January 2023). First, the reads were checked for ambiguous bases, sequence length (min length = 400 and max length = 500), and homopolymers. Sequences were then aligned to the ARB-SILVA SSU Ref NR 138 reference database (http://www.arb-silva.de/, accessed on 20 January 2023) using default settings and the Needleman-Wunsch pairwise alignment method [37]. Alignment gaps (terminal and vertical) were removed, and sequences were clustered based on their abundance using the pseudo-single linkage algorithm developed by [38].
We used the vsearch program included in the mothur installer to identify chimeric sequences [39]. Singleton sequences with extremely low abundance were eliminated by abundance-based filtering [40]. Classification of abundant sequences was performed using the Wang approach, with a minimum bootstrap confidence of 80% [41]. In addition, OTUs belonging to taxa other than bacteria were excluded from subsequent downstream analyses.
To assign sample sequences to OTUs, we used the OptiClust method [42]. For this, a distance matrix was constructed between all unique sequences, retaining only those with more than three counts in the entire dataset [40]. Sequences were then clustered using default settings (cutoff = 0.03). Each OTU’s number and relative abundance were determined within each sample using mothur. Several diversity indices, including observed OTUs (Sobs), Chao1, Ace, inverse Simpson, and Shannon, were calculated using mothur for the smallest dataset.
Nonmetric multidimensional scaling (NMDS) was performed using the Bray-Curtis distance matrix implemented in mothur to investigate the bacterial community structure based on OTU composition. The NMDS scores for each axis were analyzed using R Statistical Software version 4.2.0 [43].

2.6. MicroResp Substrate-Induced Catabolic Activity Analysis

The MicroResp™ system, a method based on colorimetric detection of CO2 emitted from the soil after adding carbon substrates [44], was used to evaluate the catabolic activity pattern of the bacterial community of soil samples. During the carbon source preference analysis of bacteria, 23 different carbon sources were used in four replicates and were distributed into adequate 96-well plates (ultrapure distilled water was used as a control). The carbon sources (substrates) were the following: L-glutamic acid (Glu), L-3,4-dihydroxybenzoic acid (Dhb), and L-arginine (Arg) in 12 mg mL−1; L-asparagine monohydrate (Asp) and L-glutamine (Gln) in 20 mg mL−1; DL-malic acid (Mal), Na-succinate (Suc), citric acid (Cit), D-gluconic acid-potassium salt (Gla), L-lysine (Lys), L-alanine (Ala), and L-serine (Ser) in 40 mg mL−1; and L-arabinose (Ara), D-xylose (Xyl), D-galactose (Gal), D-glucose (Glc), D-fructose (Fru), L-rhamnose (Rha), D-mannose (Man), trehalose (Tre), Myo-inositol (Ino), D-mannitol (Mat), and D-sorbitol (Sor) in 80 mg mL−1 concentration. All substrate solutions were adjusted to pH 6.5 by adding 1 M NaOH or 1 M HCl. An Anthos 2010 photometer (Biochrom, Cambridge, UK) was used to detect the CO2 release-induced color changes of the indicator gel at 570 nm photometrically at two different times: at the beginning (0 h) and after 6 h of incubation. Respiration data (μg CO2-C g soil−1 h−1) were calculated from the normalized and cumulative CO2 data for the 6 h incubation period and were standardized by the average respiration rate for each plate. The whole protocol of MicroResp™ catabolic respiration analysis, including soil sample preparation, is described by Campbell et al. [44]. In addition to the absolute respiration values, standardized substrate utilization was calculated for each carbon source by dividing the absolute respiration data by the mean value of the sampling dataset.

2.7. Data Preparation, Illustration, and Descriptive Statistics

All statistical analyses on physicochemical, bacterial community and respiration activity datasets were performed in the R statistical environment [43]. The ‘dplyr’ package version 1.1.2 [45] was used to calculate basic statistics. For testing data normality, the Shapiro-Wilk normality test [46,47] was used; the variance of the data showing a normal distribution was evaluated via one-way ANOVA [48], and the datasets with a non-normal distribution were analyzed by the Kruskal-Wallis rank sum test [49] using package ‘stats’ version 4.2.0. [43]. A linear model was fitted on the dataset using the ‘stats’ package when the variance tests revealed significant differences between groups. Furthermore, estimated marginal means (least-squares means) were calculated, and compact letter displays were created with the packages ‘emmeans’ version 1.8.6 [50] and ‘multcomp’ version 1.4-23 [51]. T2/T1 ratios were calculated for each soil parameter in each observation to reveal the effect of forest harvesting on soil physicochemical parameters, and the variance of ratios was analyzed. The relationship between environmental parameters and bacterial community data (relative abundance and substrate-induced respiration data) was analyzed by pairwise calculating the Pearson correlation coefficient [52] using the package ‘stats’. Redundancy analysis (RDA) was performed using the packages ‘vegan’ version 2.6-2 [53] and ‘packfor’ version 0.0-8 [54] to determine the correlation between different variables and reveal the most determinant variables on the total variance, as well as the environmental parameters that are the best predictors. The change in bacterial community structure between years was modeled by nonmetric multidimensional scaling analysis (NMDS) [55] using the package ‘vegan’. Packages of ‘ggplot2’ (version version 3.3.6) [56] and ComplexHeatmap (version 2.13.2) [57] were used to visualize the results. All the figures made with R packages were post-edited using the image and photo editing software Paint.NET version 5.0.13 [58].

3. Results

3.1. Site Characteristics

The most considerable soil physicochemical difference between the forest stands appeared in the CaCO3 content; both layers of the T1 stand were markedly carbonate (the lime content ranged between 4.92 and 7.02% in the upper and between 7.80 and 10.60% in the under layer). By contrast, the soil of T2 contained lime only in small amounts (the lime content was 0.00%–0.82% and 0.00%–1.41% in layers A and B, respectively). The remarkable deviation in CaCO3 content was reflected in the values of other lime-related parameters, such as TIC, TC, AL–Ca content, and soil pH, among which the TIC content and pH showed the most significant differences in the pairwise comparison of the forest stands in both layers. As for the soil organic carbon and nutrient content (TOC, TN, NO3–N, AL–P2O5, and AL–K2O), no remarkable differences were revealed between the stands.
Considering the control (T1) related change in physicochemical parameters, three variables showed notable deviations after 2018, which suggests a considerable influence of the clear-cutting on them (Figure S1). The relative SM and AL–P2O5 content increased remarkably in T2 after the harvest in both layers (the changes of the former parameter were statistically significant at p = 0.05 in layer A), while the relative AL–K2O content increased in layer A and decreased in layer B samples after the harvest (the changes in potassium content were significant at p = 0.05 in layer B). Table 1 presents the soil physicochemical analysis results, while Table S3 presents the average daily temperatures counted for five-day periods.

3.2. Bacterial Community Diversity and Composition

The five diversity indices (Sobs, Chao1, ACE, Shannon, Inverse Simpson) detected no remarkable effect of forest harvesting on the soil bacterial community structure in the T2 forest (the stand differences in the year-to-year comparison were not significant at p = 0.05 in any year, and this was valid for both layers; Figures S2 and S3 illustrate the diversity indices values, while Figure S4 and Table S4 present sequence data). However, compared to T1, a slight relative increase in diversity in layer A and a slight decrease in layer B were observed in the T2 forest after the harvest.
The most abundant phyla (mean relative abundance > 5%) were Acidobacteriota (27.97%), Proteobacteria (17.36%), Actinobacteriota (14.61%), Verrucomicrobiota (10.77%), and Bacteroidota (7.40%). Furthermore, although the mean relative abundance of Gemmatimonadota lagged the 5% threshold, this phylum was the only one among the less abundant phyla whose relative abundance reached 10% in some layer B samples (2018: T1—August, T1—October; 2019: T1—April, T2—April; 2020: T1—April; 2021: T1—July) (Figure S5 illustrates the relative abundances of all bacterial taxa evaluated).
Considering the six main taxa, the main differences between the stands’ soil bacterial community structures appeared primarily in the layer B samples. Acidobacteriota and Verrucomicrobiota showed markedly higher, while Gemmatimonadota had lower mean relative abundance values in T2 stand samples compared to T1 in the deeper layer (it should be noted that even if the differences mentioned above were considerable, a statistically significant difference between the stands was only revealed with Verrucomicrobiota in 2018). Alone among the six main taxa, Verrucomicrobiota showed a significant change (decrease) in relative abundance after the forest harvest in the T2 stand (layer A samples, Figure 1). In addition, a gradual and intensive but statistically insignificant increase in the relative abundance of Acidobacteriota was observed in layer B after 2018, while a temporary and not significant increase was identified in the relative abundance of Actinobacteriota and Gemmatimonadota in the under-layer in 2019.

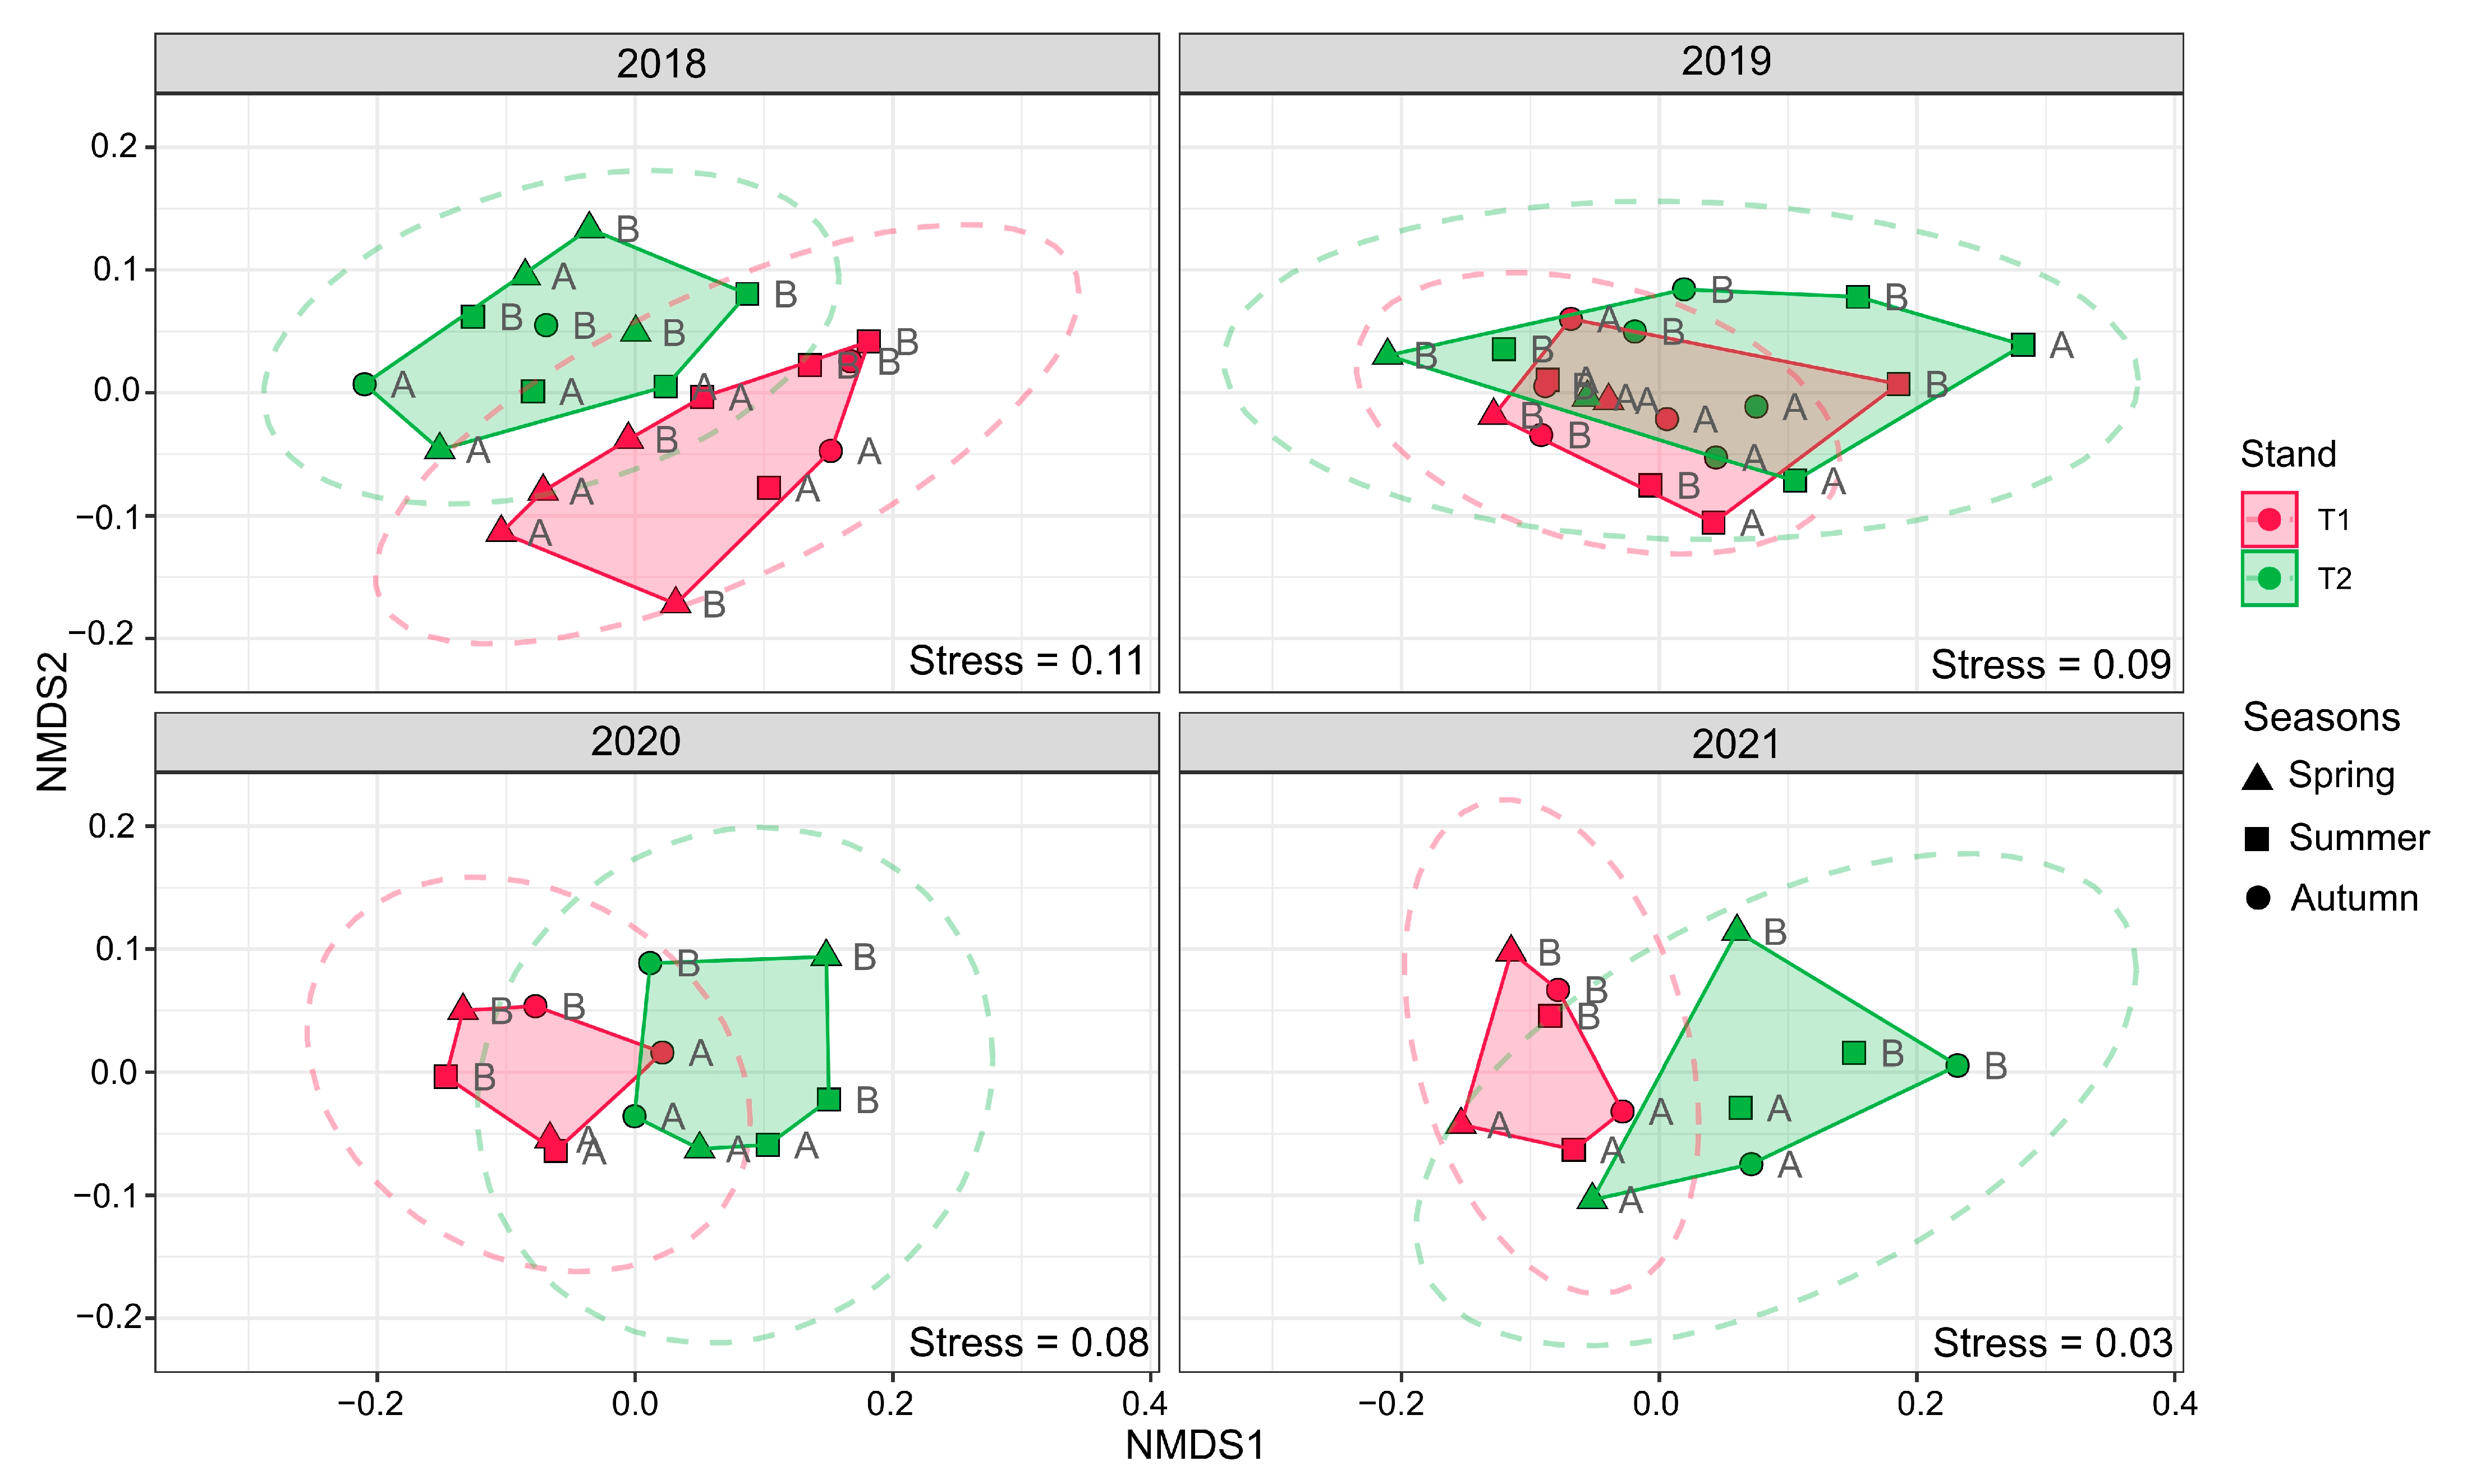
3.3. Bacterial Community Composition Shift

Contrary to the species richness and diversity indices, NMDS and RDA analyses based on the phylum’s relative abundance data showed a firm but not durable change in bacterial community structure after the clear-cutting in the T2 stand. As Figure 2 and Figure 3 show, the polygons of the two oak stands separated very clearly in 2018. This situation changed in 2019, when the stands overlapped remarkably, while in 2020 and 2021, the stands separated firmly again. These changes in the polygon locations suggest that the composition of the soil bacterial communities of the stands turned very similar after the harvest of the T2 stand, but this situation was only temporary.
The redundancy (RDA) and forward selection analysis results showed that pH played the most remarkable role in forming bacterial communities in forest soils (Figure 3, Table S5). The effect of pH on the inter-stand variability was less in 2019 when TN, SM and AL–K2O were determinant environmental factors influencing bacterial community structure (Table S5). As for the most abundant phyla, Acidobacteriota and Actinobacteriota occupied the most remarkable role in maintaining the variability between the bacterial communities in 2019 (Figure 3). The connections between these phyla and the most determinant environmental factors were different: Acidobacteriota correlated significantly negatively with pH and TN in layer A and significantly negatively with pH in layer B, while Actinobacteriota showed a significant negative correlation with SM content in both layers (Figure S6).

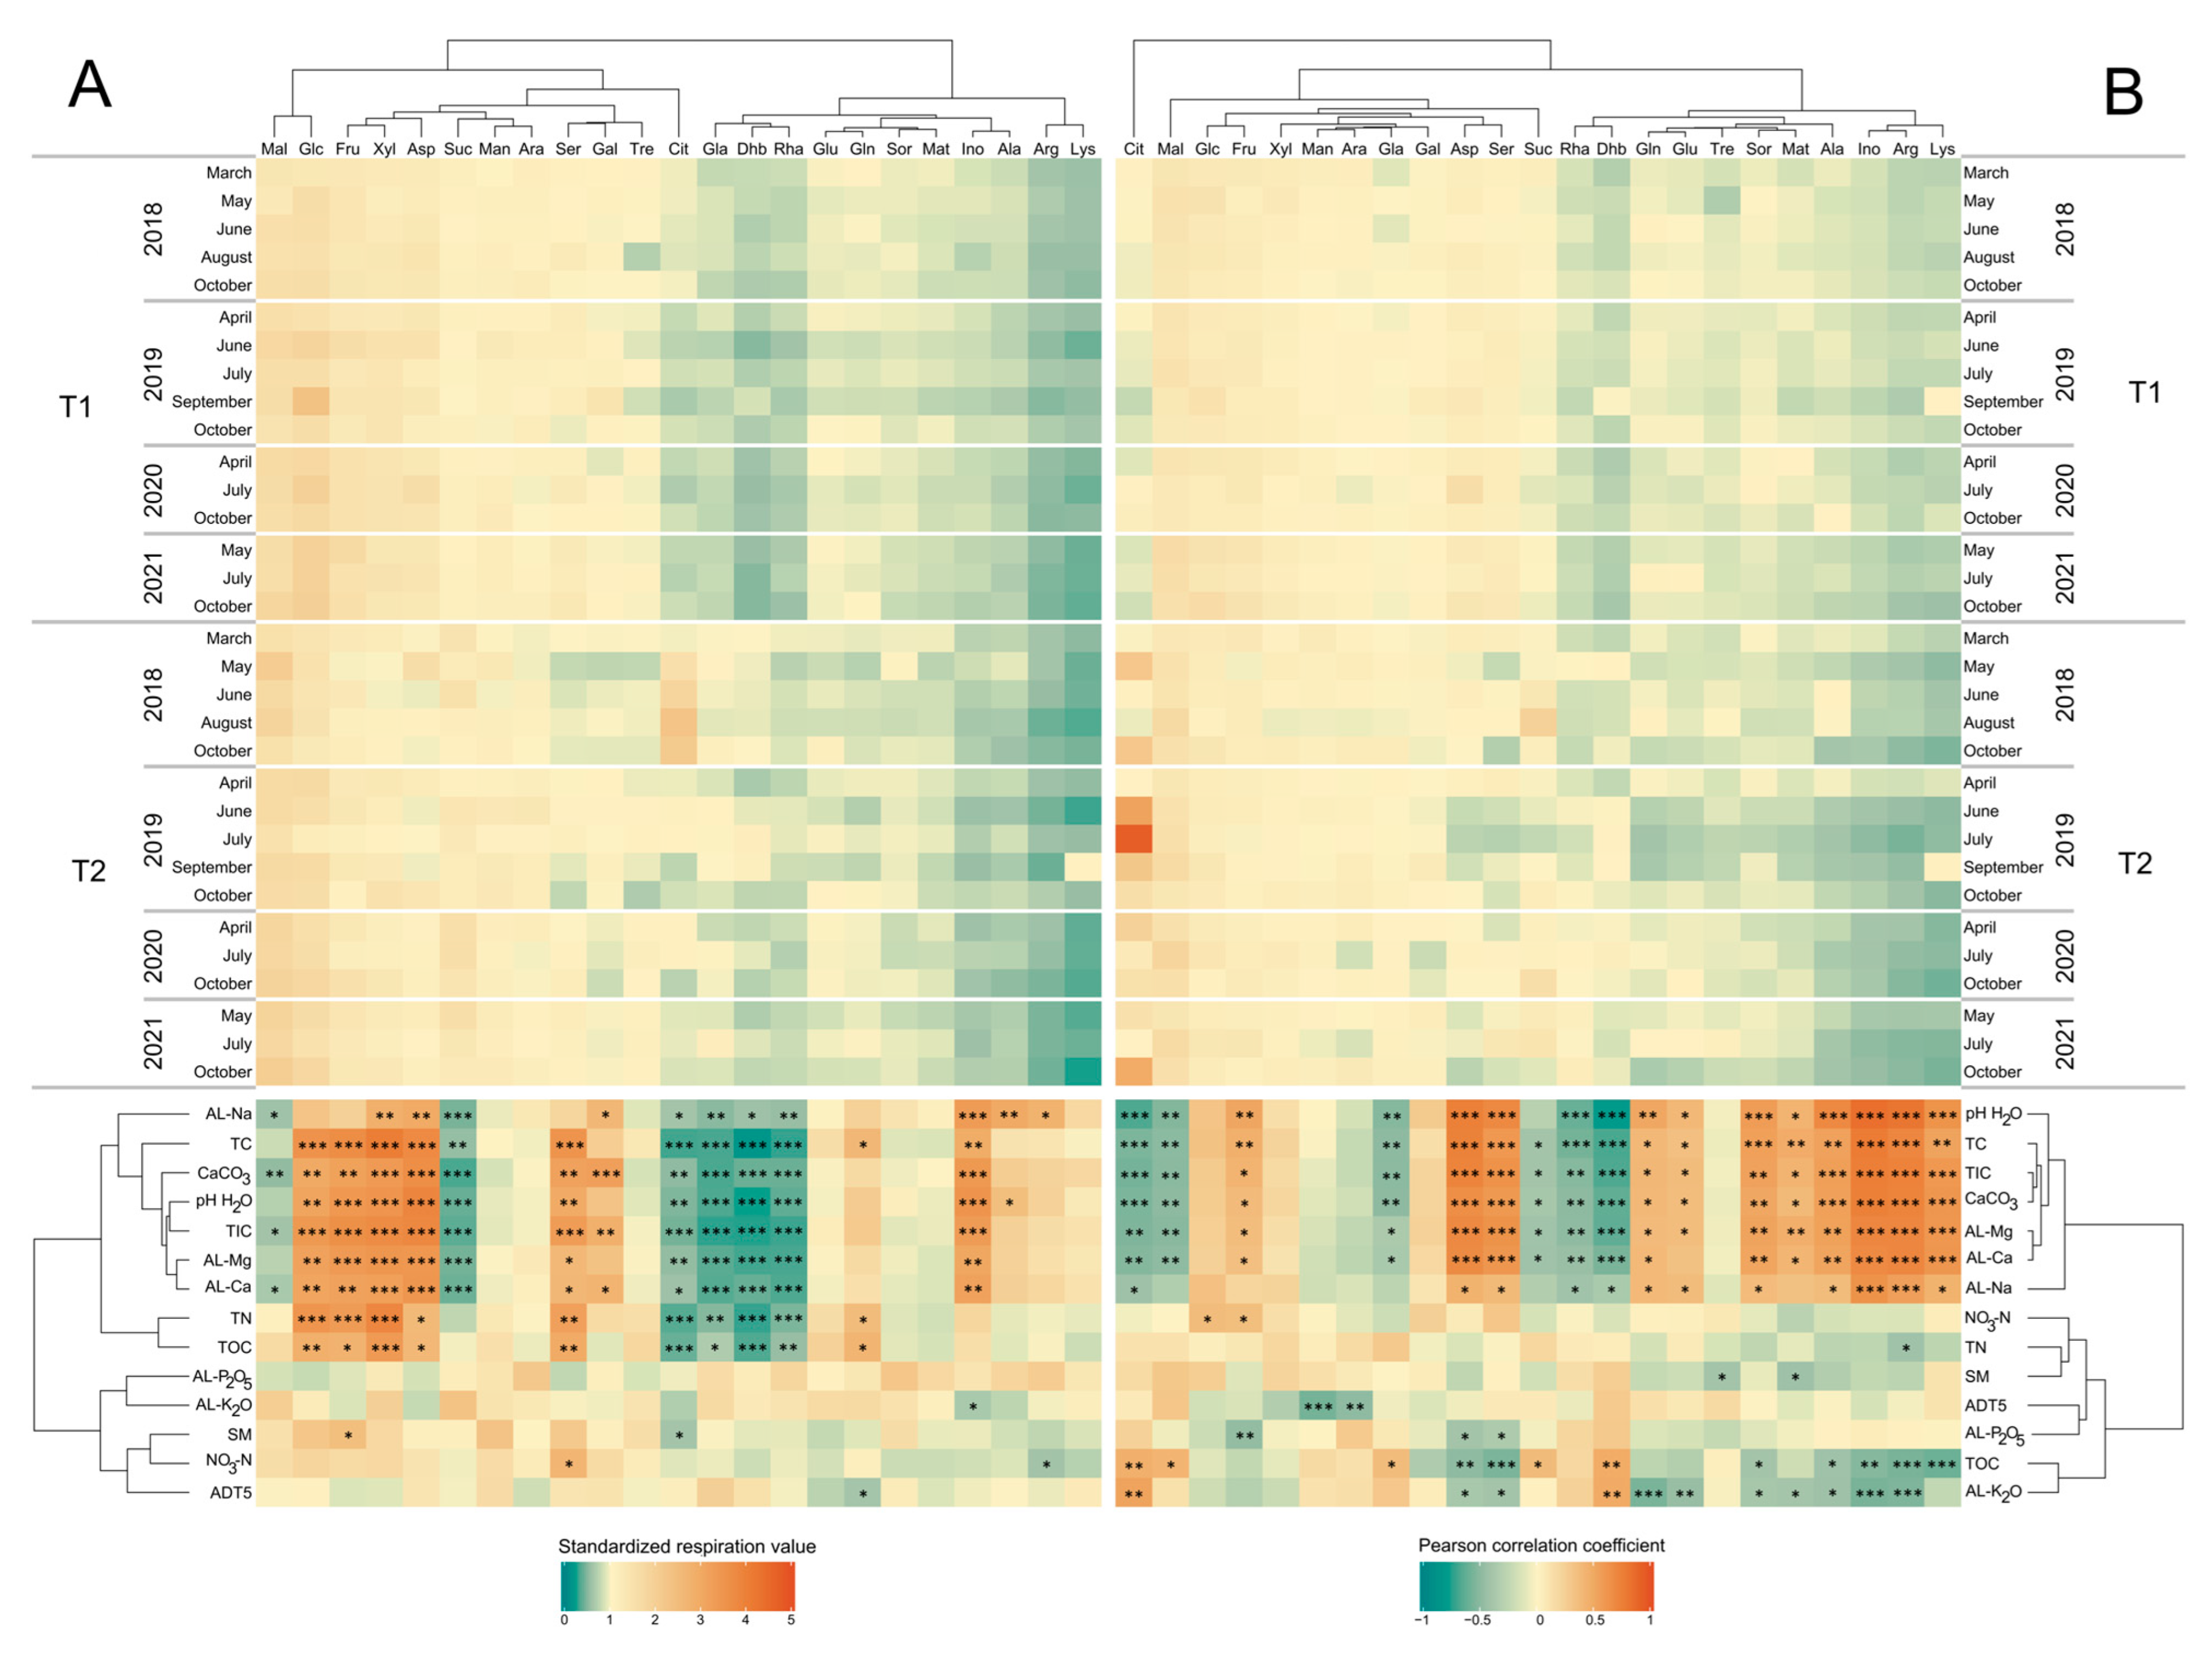
3.4. Microbial Respiration Activity

The mean substrate-induced bacterial respiration was higher in the main stand compared to the control area each year and layer and reached a paramount value in 2020 in layer A. The year after the harvest, a remarkable change in the mean substrate utilization occurred only in the deeper layer, but this change was not statistically significant (Figure S7). Considering the whole dataset, the five most utilized carbon substrates were Mal, Glc, Fru, Xyl, and Suc in layer A and Mal, Cit, Glc, Fru, and Suc in layer B (the average respiration values of all carbon sources are presented by stands and layers in Table S6). As for the comparison of the two forest stands, a very similar substrate utilization pattern was observed in the case of the primary substrates in both layers (Figure S8). Generally, in layer A, the substrate utilization increased firmly between 2018 and 2021 (the utilizations reached their peaks in 2020 in more cases), while in layer B, the substrate consumption was more balanced, without marked elevation in the study period. The only exception was Cit, whose utilization showed a different pattern: Cit utilization was generally balanced in both stands and layers and was markedly higher in T2 in all years.
Furthermore, only Cit consumption showed a statistically significant change directly after the clear-cutting in the T2 stand; this year, utilization decreased remarkably in layer B. Conversely, considering the standardized respiration data, the deeper layer was characterized by Cit overutilization in 2019, especially in the summer months (Figure 4). In addition, Cit overutilization was observed in the deeper layer in all years, and in the upper layer in 2018.

3.5. The Effects of Environmental Factors on Microbial Respiration

Like the bacterial community structure examination results, the forward selection analysis revealed pH as the best explanatory variable for the stands’ respiration patterns. This parameter was determinable in 2018 and 2019 in layer A and 2018, 2019, and 2020 in layer B samples. Furthermore, TC (in 2019, 2020, and 2021 in layer B), AL-Mg (in 2020 and 2021 in layer A), TN (in 2018 in layer A), CaCO3 (in 2018 in layer A), SM (in 2019 in layer A), and AL-K2O (in 2021 in layer A samples) were proven to be good predictors (R2 and p values of predictor variables are demonstrated in Table S7). As for the connection between pH and substrate utilization, according to the results of the Pearson correlation analysis, the six most utilized carbon substrates can be classified into two groups, consistently with their types. The carboxyl acids (Mal, Suc, and Cit) negatively correlated with pH, TC, TIC, and CaCO3 content, while sugars (Glc, Fru, and Xyl) positively correlated with them in both layers.
RDA highlighted the remarkable role of Cit in forming interstand variability in almost all years and layers. The effect on the variability of this carboxyl acid was outstanding in 2018 in layer A and in all years in layer B samples (Figure 5). Of the most abundant carbon substrates, Glc (in 2019 and 2021 in layer A), Mal (in 2018 and 2021 in layer A and 2020 in layer B), and Suc (in 2020 and 2021 in layer A and 2018, 2020, and 2021 in layer B) had a substantial effect on the variability.

4. Discussion

4.1. Changes in Bacterial Community Diversity

Our results on bacterial diversity analysis suggest that clear-cutting the T2 forest resulted in a mild relative diversity increase in the upper soil layer and a slight decrease in the deeper layer. The alteration of diversity in a positive direction after harvesting (clear-cutting or thinning) is not unprecedented; similar results were achieved by other studies, suggesting a change in rhizodeposition [59] or in the relative abundance of rare taxa as a cause [23]. The change in rhizodeposition may also have played a vital role in our case. The T2 stand was a highly closed forest before harvesting (92% canopy closure), having rare herbaceous vegetation. This state changed after the spring of 2019, when herbaceous plants colonized the area, probably forming a denser rhizosphere in layer A. Stefanowicz et al. [60] found a positive connection between herbaceous plant cover and soil microbial community composition in their comparative study, suggesting a prominent role of the rhizodeposition of plant roots in that process. Furthermore, Henneron et al. [61] proved a difference in rhizodeposition between herbaceous plants with different strategies: acquisitive species show higher photosynthesis and rhizodeposition activity than conservative species. The former group is more competitive and was likely to play a remarkable role in colonizing the freshly harvested area, contributing to increased bacterial diversity in the upper soil layer.
The opposite trend in bacterial diversity after the clear-cutting in the deeper layer of the T2 stand may also be related to the changes in the fine root system. Forest disturbances trigger a decrease in fine root biomass, production, and turnover [62,63], and the termination of root functioning changes the composition of the fungal and bacterial communities, favoring the microbes participating in root decomposition [24,64]. According to our assumption, the effect of the developing herbaceous roots was not determinant and could not compensate for the impact of root decomposition processes in this layer. These changes resulted in rather oligotrophic conditions, which caused a slight bacterial diversity loss. However, forest harvesting affects soil fungal communities more significantly than bacterial communities [10,64], and, in the case of bacteria, the functioning is more exposed to change than the community structure [11].

4.2. Soil Bacterial Community Compositions Changes after Forest Harvest

Considering the year-to-year comparison of stands, only slight changes were observable in the relative abundances of bacterial phyla, suggesting a less intense effect of harvesting on soil bacterial composition restructuring in the T2 stand; among the most abundant phyla, only Acidobacteriota (in layer B) and Verrucomicrobiota (in layer A) showed definite signs of harvesting-related changes. As for Acidobacteriota, the change of its relative abundance strictly followed the change in soil acidity, which was most pronounced in the deeper layer of the T2 stand (the strong negative relationship between the relative abundance of Acidobacteriota and soil pH was already observed in the case of the phylum’s more subdivisions by other studies [65,66]). This observation supposes that an acidification could happen in the deeper layer after the clear-cutting. However, although Achat et al. [67] reported that the increasing intensity of harvest (stem-only harvest compared to branch, foliage, or stump removal amendments) decreases soil pH, the cessation of root exudate production could also be a reason for acidification. Both Gramss et al. and Evangelou et al. [68,69] observed that the microbial degradation of sugars or organic acids increases soil pH; therefore, it is likely that the sudden termination of fresh root exudate release slowed the degradation processes, making possible a kind of reacidification of the soil after 2018. The decreased microbial activity in layer B of the T2 stand supports this theory: the average substrate-induced microbial respiration suddenly decreased after the clear-cutting. It approximated the preharvest level only in 2020 and 2021 again.
The member taxa of Verrucomicrobiota occupy diverse ecological niches and different horizons (depths) of soils [70] and show different ecological attributes; although Verrucomicrobiota is mainly considered oligotroph [71,72], between certain ecological circumstances, verrucomicrobial taxa can behave as copiotroph [73]. In our case, the sharp decrease in its relative abundance after the clear-cutting in the topsoil layer in the T2 stand suggests the former habit for Verrucomicrobiota. The emerged SM and TOC content likely favored the growth of more competitive bacteria, like Bacteroidota, and decreased the relative abundance of Verrucomicrobiota. Our results may strengthen the statement of Fierer et al. [74], namely, that verrucomicrobial taxa can thrive under nutrient-poor circumstances and are less competitive in soils well-supplied with nutrients.
The rise in the relative abundance of Actinobacteriota and Gemmatimonadota in 2019 in the layer B samples probably resulted from their ecological attributes. Both taxa seemed to behave in our study as oligotroph bacteria (they showed rather negative correlations with nutrients and TOC), suggesting that they were more competitive under nutrient-poor circumstances, like what arose in the deeper layer after clear-cutting (the TOC content decreased definitely from 2018 to 2019 in the deeper layer). However, Venture et al. [75] refer to more actinobacterial taxa as saprophytes, and some studies refer to Gemmatimonadota rather as copiotrophic bacteria [76,77].
Both NMDS and RDA analyses revealed a temporary similarity in bacterial community composition between the oak stands in 2019. As already known, soil pH is one of the most important parameters that form soil bacterial community structure [78,79]. Our forward selection analysis results strengthened this statement; namely, soil pH was the most relevant environmental factor that shaped the bacterial community structures of the stands (Table S5). The only year when other factors, namely, TN, SM (layer A), and AL-K2O (layer B), had a higher or similar effect on the community than pH or pH-related factors was 2019. This result suggests that the changes in pH, SM, TN, and AL-K2O in the T2 stand’s soil after the clear-cutting were commonly responsible for those edaphic alterations that temporarily made the stands’ soil bacterial community structures similar.

4.3. The Effect of Forest Harvesting on Substrate-Induced Respiration

Forest harvesting negatively affects soil microbial respiration [11,80], which is more pronounced in the mineral soil layer [11]. Our substrate-induced respiration data showed no changes in the upper layer but an evident decline in the deeper layer in the T2 forest in the first vegetation period after harvesting (2019), corresponding with the results of the studies cited above. After 2019, the microbial respiration of the T2 stand samples elevated and reached a higher level in layer A and a similar level in layer B than in 2018. This respiration elevation after 2019 was observable in the case of all highly utilized carbon substrates, which suggested a general and substantial microbial activity growth, especially in the organic layer. The enhanced microbial respiration under herbaceous plants and communities compared to bare soils is well known [81,82,83,84]; therefore, the appearance of herbaceous vegetation on the harvested area could partly explain the rapid expansion in respiration in the T2 stand after 2019. According to our hypothesis, the rapidly altered environmental conditions limited microbial activity (respiration) in 2019 when the colonization of the harvested area by herbaceous species was only in the initial phase. Considering that the colonization of harvested areas generally occurs gradually [85,86], the herbaceous vegetation reached a higher cover in the following years and, through its well-developed rhizosphere, created suitable conditions for higher microbial activity again.
As from the reviews of Nguyen, Jones et al., and Dennis et al. [87,88,89], ascertainable, as labile C sources, root exudates substantially contribute to enhancing microbial activity, among which sugars, amino acids, and carboxyl (organic) acids are the primary low molecular weight compounds. We have found that sugars and carboxyl acids were the most utilized compounds to a similar extent, followed by amino acids and sugar alcohols. However, the extent of sugar and carboxyl acid utilization changed with depth: sugar consumption was higher in layer A, while carboxyl acid utilization was higher in layer B samples. A radical decrease in sugar utilization with depth and a more balanced carboxyl acid utilization in the soil horizons were observed by Struecker and Joergensen [90], who highlighted the role of soil organic carbon content as a factor that primarily controls microbial growth and emphasized that the respiration rate of the different carbon compounds depends on their entry into the metabolic cycle (difference in substrate preference for anabolic utilization [91]).
According to our study, soil pH and TC were the most determinant factors in microbial respiration, while AL-Mg, TN, SM, and AL-K2O also proved to be good predictive factors in some years and layers. A strong connection between microbial respiration and pH, carbon, and nitrogen content was also observed in more studies [13,16,92], while Bongiorno et al. [93] found a significant correlation between Mg and K and multiple substrate-induced respiration investigating ten European agricultural long-term field experiments. SM greatly influences microbial community functioning [94]; in our study, the effect of SM on substrate-induced respiration was remarkable only in the upper layer in 2019 (the year after the harvest). Since citrate utilization showed a strong positive correlation with AL–K2O content in the layer B samples, further investigation of this connection needs more attention.

4.4. The Significance of Citrate in Bacterial Respiration

In our study, citrate proved to have the highest contribution to the between-stand variance of respiration (its effect was more expressed in both layers in 2018 and in layer B samples between 2019 and 2021). Based on the standardized data, citrate was a mostly underutilized compound in T1 and an overutilized compound in T2 before harvesting (2018) in both layers. One possible reason for this could be the difference in the necessity for phosphorous between the stands. Phosphorous deficiency enhances root citrate exudation, and the enhanced citrate content promotes phosphorous mobilization [95,96,97]. Although there were no consistent and significant differences in the AL-P2O5 content between the samples in 2018, it is conceivable that the highest need for phosphorous that arose from the differences in forest structure (mature trees versus trunk sprouts and seedlings) caused a higher citrate efflux in the rhizosphere to mobilize more phosphorous under the T2 stand (albeit, it should be noted that citrate did not show a significant correlation with AL-P2O5 in any layers). Therefore, it is assumed that a surplus caused by an enhanced efflux was responsible for the higher consumption of citrate in the T2 forest.
The relative utilization of citrate reached the highest level in the deeper soil layer after the harvest of the T2 stand. The reason for this significant overutilization of citrate compared to the other substrates, especially carboxyl acids, is unknown. One possible explanation for the enhanced citrate utilization could be a reaction by the microbes against the ecological stress that occurred through clear-cutting (changed solar radiation circumstances, terminated root exudate production). Citrate has more C atoms and is located before succinate and malate in the citric acid cycle [98]; since under aerobic conditions, citrate can be fed directly into the cycle by a citrate transporter [99], the process could allow for the production of more energy (GTP) or antioxidants for the microbe. In securing metabolism under ecological stress, citrate could have been an effective solution for oligotroph bacteria in the rhizosphere. Although the significance of the tricarboxylic acid cycle in stress response processes in bacteria has been proven by many studies [100,101,102], the possible role of citrate uptake and entry into the cycle needs further investigation.

5. Conclusions

Forest harvest did not occur as a considerable change in soil bacterial community diversity, structure, and activity. The change in the relative abundance of bacterial phyla followed a similar pattern in the case of most phyla in the stand-to-stand comparison, suggesting only a slight alteration in the bacterial community caused by forest disturbance. The higher differences occurred in the deeper layer and affected the bacteria that had oligotrophic attributes. The substrate-induced respiration showed only a temporary relapse after clear-cutting in the T2 stand; the bacterial activity reached and exceeded the 2018 level in 2020 and 2021. The citrate utilization was the most affected by harvesting, probably showing the prominent role of this substrate in the stress response processes of bacteria. The pH, TN, TC, SM, and AL-K2O contents were significant ecological predictors of forest soil bacterial community structure and functioning. Overall, our results suggest a firmer effect of soil attributes on soil bacterial community composition and activity than changes in forest structure.

Supplementary Materials

The following supporting information can be downloaded at: https://www.mdpi.com/article/10.3390/f15081284/s1, Figure S1: The control (T1)-related changes of edaphic parameters in T2 stand between 2018 and 2021. Homologous groups are indicated with the letters a and b; similar letters demonstrate no significant differences. Significant connections should be interpreted at layers. Abbreviations: T1: T1 oak forest, T2: T2 oak forest; A: 0–10 cm soil layer, B: 10–40 cm soil layer. Thick black lines represent medians, while dark grey squares represent mean values; Figure S2: The average number of OTUs revealed in soil samples of the different forest stands. Homologous groups are indicated with the letters a, b, c, and d; similar letters demonstrate no significant differences. Significant connections should be interpreted at layers. Abbreviations: T1: T1 oak forest, T2: T2 oak forest; A: 0–10 cm soil layer, B: 10–40 cm soil layer. Thick black lines represent medians, while dark grey squares represent mean values; Figure S3: Mean diversity index values of the different forest soil bacterial communities. Homologous groups are indicated with the letters a and b; similar letters demonstrate no significant differences. Significant connections should be interpreted at layers. Abbreviations: T1: T1 oak forest, T2: T2 oak forest; A: 0–10 cm soil layer, B: 10–40 cm soil layer. Thick black lines represent medians, while dark grey squares represent mean values; Figure S4: Rarefaction curves of the different samples based on 16S rRNA gene amplicon sequencing. Abbreviations: T1: T1 oak forest, T2: T2 oak forest; A: 0–10 cm soil layer, B: 10–40 cm soil layer; sampling date: (yyyymm); a: 2018, b: 2019, c: 2020, d: 2021; Figure S5: Relative abundances of major bacterial taxa at phylum level in the investigated forest soils. Relative abundance is expressed as the percentage of total sequences. Taxa under 1% are summarized and marked as Other (<1%). Abbreviations: T1: T1 oak forest, T2: T2 oak forest; A: 0–10 cm soil layer, B: 10–40 cm soil layer; a: 2018, b: 2019, c: 2020, d: 2021; sampling date: (yyyymm); Figure S6: Bacterial phyla’s relative abundance (upper) and Pearson correlation coefficient (under) heatmaps. Diagrams illustrate average relative abundance values determined at each site and the correlation between relative abundance data and environmental parameters. Asterisks indicate significant differences at a significance level of 0.01 < p ≤ 0.05 (*), 0.001 < p ≤ 0.01 (**), and p ≤ 0.001 (***), while empty cells indicate no significant differences (in the upper diagrams only). Abbreviations: T1: T1 oak forest, T2: T2 oak forest; A: 0–10 cm soil layer, B: 10–40 cm soil layer; ADT5: average daily temperature of five days before sampling (including sampling day). Abbreviations: Aci: Acidobacteriota, Pro: Proteobacteria, Act: Actinobacteriota, Ver: Verrucomicrobiota, Bac: Bacteroidota, Pla: Planctomycetota, Gem: Gemmatimonadota, Chl: Chloroflexi, Oth: Other (<1%), Bun: Bacteria unclassified, Myx: Myxococcota, Pat: Patescibacteria, Met: Methylomirabilota, Nit: Nitrospirota, Lat: Latescibacterota. Abbreviations of physicochemical parameters are shown in Table 1; Figure S7: Mean respiration values of forest stands expressed in µgCO2-C g–1 h–1. Homologous groups are indicated with the letters a, b, and c; similar letters demonstrate no significant differences. Significant connections should be interpreted at layers. Abbreviations: T1: T1 oak forest, T2: T2 oak forest; A: 0–10 cm soil layer, B: 10–40 cm soil layer. Thick black lines represent medians, while dark grey squares represent mean values; Figure S8: Mean substrate utilization values of forest stands (six primary utilized substrates are shown) expressed in µgCO2-C g–1 h–1. Homologous groups are indicated with the letters a, b, and c; similar letters demonstrate no significant differences. Significant connections should be interpreted at layers. Abbreviations: T1: T1 oak forest, T2: T2 oak forest; A: 0–10 cm soil layer, B: 10–40 cm soil layer. Thick black lines represent medians, while dark grey squares represent mean values; Table S1: Main characteristics of the studied forest stands; Table S2: Sampling dates; Table S3: Average daily temperatures (°C) of the sampling periods. Abbreviations: ADT5: average daily temperature of five days before sampling (including sampling day); Table S4: The number of bacterial sequences and operational taxonomic units (OTUs) detected during amplicon sequencing and sequence processing; Table S5: Predictor variables revealed by redundancy analysis of the relative abundance data of bacterial taxa. The variables included were proven to be good predictors of bacterial community structure. Abbreviations: A: 0–10 cm soil layer, B: 10–40 cm soil layer; R2: coefficient of determination, F: F-test value, p: significance level of the F-test. Abbreviations of physicochemical parameters are shown in Table 1; Table S6: Carbon source utilization (respiration) values of forest soil layers expressed in µgCO2-C g–1 h–1. Abbreviations: Lay.: soil layer, CS.: carbon substrates, M.: means, SD: standard deviations; T1: T1 oak forest, T2: T2 oak forest; A: 0–10 cm soil layer, B: 10–40 cm soil layer. Abbreviations of carbon sources are shown in Section 2.6.; Table S7: Predictor variables revealed by redundancy analysis on substrate-induced respiration data. The variables included were proven to be good predictors of bacterial community activity. Abbreviations: A: 0–10 cm soil layer, B: 10–40 cm soil layer; R2: coefficient of determination, F: F-test value, p: significance level of the F-test. Abbreviations of physicochemical parameters are shown in Table 1.

Author Contributions

Conceptualization, K.B., K.M., and G.I.; methodology, K.B., K.M., and G.I.; formal analysis, K.B., A.B., E.G.T., M.M., and T.S.-K.; investigation, K.B.; data curation, K.B., E.G.T., M.M., and K.K.; writing—original draft preparation, K.B. and A.B.; visualization, K.B., A.B., and B.B.L.; supervision, K.M. All authors have read and agreed to the published version of the manuscript.

Funding

This research was funded by the EU and co-financed by the European Regional Development Fund and the Hungarian Government under project no. GINOP -2.3.2-15-2016-00056.

Data Availability Statement

The raw 16S rRNA gene sequencing data are available at the NCBI Sequence Read Archive (SRA) (http://www.ncbi.nlm.nih.gov/sra, accessed on 31 January 2023) under accession number PRJNA929690 [SAMN32968865-32968894].

Acknowledgments

We thank Valter Toldi, Máté Farkas, Tamás Süle, and Melinda Nagy-Khell for their assistance in soil sampling. We thank Lászlóné Kiss, Éva Ilyés-Jakabfi, and Virág Jeczó for their cooperation in the laboratory work at the Ecology Laboratory of the Forest Research Institute (Sárvár, Hungary), University of Sopron. We thank the contribution of the colleagues of the soil laboratory of the Institute for Soil Sciences, HUN-REN Centre for Agricultural Research, for participating in the microrespiration analyses. Finally, we thank Prograd-Agrárcentrum Ltd. for providing their forest areas for our research.

Conflicts of Interest

The authors declare no conflicts of interest. The funders had no role in the design of the study; in the collection, analyses, or interpretation of data; in the writing of the manuscript; or in the decision to publish the results.

References

  1. Kembel, S.W.; Waters, I.; Shay, J.M. Short-Term Effects of Cut-to-Length versus Full-Tree Harvesting on Understorey Plant Communities and Understorey-Regeneration Associations in Manitoba Boreal Forests. For. Ecol. Manag. 2008, 255, 1848–1858. [Google Scholar] [CrossRef]
  2. Lencinas, M.V.; Martínez Pastur, G.; Gallo, E.; Cellini, J.M. Decreasing Negative Impacts of Harvesting over Insect Communities Using Variable Retention in Southern Patagonian Forests. J. Insect. Conserv. 2014, 18, 479–495. [Google Scholar] [CrossRef]
  3. Tozer, D.C.; Burke, D.M.; Nol, E.; Elliott, K.A. Short-Term Effects of Group-Selection Harvesting on Breeding Birds in a Northern Hardwood Forest. For. Ecol. Manag. 2010, 259, 1522–1529. [Google Scholar] [CrossRef]
  4. Closa, I.; Goicoechea, N. Seasonal Dynamics of the Physicochemical and Biological Properties of Soils in Naturally Regenerating, Unmanaged and Clear-Cut Beech Stands in Northern Spain. Eur. J. Soil Biol. 2010, 46, 190–199. [Google Scholar] [CrossRef]
  5. Nave, L.E.; Vance, E.D.; Swanston, C.W.; Curtis, P.S. Harvest Impacts on Soil Carbon Storage in Temperate Forests. For. Ecol. Manag. 2010, 259, 857–866. [Google Scholar] [CrossRef]
  6. Roy, M.-È.; Surget-Groba, Y.; Delagrange, S.; Rivest, D. Legacies of Forest Harvesting on Soil Properties along a Chronosequence in a Hardwood Temperate Forest. For. Ecol. Manag. 2021, 496, 119437. [Google Scholar] [CrossRef]
  7. Battigelli, J.P.; Spence, J.R.; Langor, D.W.; Berch, S.M. Short-Term Impact of Forest Soil Compaction and Organic Matter Removal on Soil Mesofauna Density and Oribatid Mite Diversity. Can. J. For. Res. 2004, 34, 1136–1149. [Google Scholar] [CrossRef]
  8. Elie, F.; Vincenot, L.; Berthe, T.; Quibel, E.; Zeller, B.; Saint-André, L.; Normand, M.; Chauvat, M.; Aubert, M. Soil Fauna as Bioindicators of Organic Matter Export in Temperate Forests. For. Ecol. Manag. 2018, 429, 549–557. [Google Scholar] [CrossRef]
  9. Rousseau, L.; Venier, L.; Aubin, I.; Gendreau-Berthiaume, B.; Moretti, M.; Salmon, S.; Handa, I.T. Woody Biomass Removal in Harvested Boreal Forest Leads to a Partial Functional Homogenization of Soil Mesofaunal Communities Relative to Unharvested Forest. Soil Biol. Biochem. 2019, 133, 129–136. [Google Scholar] [CrossRef]
  10. Hartmann, M.; Howes, C.G.; VanInsberghe, D.; Yu, H.; Bachar, D.; Christen, R.; Henrik Nilsson, R.; Hallam, S.J.; Mohn, W.W. Significant and Persistent Impact of Timber Harvesting on Soil Microbial Communities in Northern Coniferous Forests. ISME J. 2012, 6, 2199–2218. [Google Scholar] [CrossRef]
  11. Smenderovac, E.E.; Webster, K.; Caspersen, J.; Morris, D.; Hazlett, P.; Basiliko, N. Does Intensified Boreal Forest Harvesting Impact Soil Microbial Community Structure and Function? Can. J. For. Res. 2017, 47, 916–925. [Google Scholar] [CrossRef]
  12. Fierer, N. Embracing the Unknown: Disentangling the Complexities of the Soil Microbiome. Nat. Rev. Microbiol. 2017, 15, 579–590. [Google Scholar] [CrossRef]
  13. Creamer, R.E.; Stone, D.; Berry, P.; Kuiper, I. Measuring Respiration Profiles of Soil Microbial Communities across Europe Using MicroRespTM Method. Appl. Soil Ecol. 2016, 97, 36–43. [Google Scholar] [CrossRef]
  14. Fierer, N.; Leff, J.W.; Adams, B.J.; Nielsen, U.N.; Bates, S.T.; Lauber, C.L.; Owens, S.; Gilbert, J.A.; Wall, D.H.; Caporaso, J.G. Cross-Biome Metagenomic Analyses of Soil Microbial Communities and Their Functional Attributes. Proc. Natl. Acad. Sci. USA 2012, 109, 21390–21395. [Google Scholar] [CrossRef]
  15. Liu, Y.; Wang, S.; Wang, Z.; Zhang, Z.; Qin, H.; Wei, Z.; Feng, K.; Li, S.; Wu, Y.; Yin, H.; et al. Soil Microbiome Mediated Nutrients Decline during Forest Degradation Process. Soil Ecol. Lett. 2019, 1, 59–71. [Google Scholar] [CrossRef]
  16. Chodak, M.; Klimek, B.; Niklińska, M. Composition and Activity of Soil Microbial Communities in Different Types of Temperate Forests. Biol. Fertil. Soils 2016, 52, 1093–1104. [Google Scholar] [CrossRef]
  17. Dukunde, A.; Schneider, D.; Schmidt, M.; Veldkamp, E.; Daniel, R. Tree Species Shape Soil Bacterial Community Structure and Function in Temperate Deciduous Forests. Front. Microbiol. 2019, 10, 1519. [Google Scholar] [CrossRef]
  18. McCulley, R.L.; Archer, S.R.; Boutton, T.W.; Hons, F.M.; Zuberer, D.A. Soil Respiration and Nutrient Cycling in Wooded Communities Developing in Grassland. Ecology 2004, 85, 2804–2817. [Google Scholar] [CrossRef]
  19. Wu, S.-H.; Huang, B.-H.; Huang, C.-L.; Li, G.; Liao, P.-C. The Aboveground Vegetation Type and Underground Soil Property Mediate the Divergence of Soil Microbiomes and the Biological Interactions. Microb. Ecol. 2018, 75, 434–446. [Google Scholar] [CrossRef]
  20. Cardenas, E.; Kranabetter, J.M.; Hope, G.; Maas, K.R.; Hallam, S.; Mohn, W.W. Forest Harvesting Reduces the Soil Metagenomic Potential for Biomass Decomposition. ISME J. 2015, 9, 2465–2476. [Google Scholar] [CrossRef]
  21. Hynes, H.M.; Germida, J.J. Relationship between Ammonia Oxidizing Bacteria and Bioavailable Nitrogen in Harvested Forest Soils of Central Alberta. Soil Biol. Biochem 2012, 46, 18–25. [Google Scholar] [CrossRef]
  22. Mushinski, R.M.; Gentry, T.J.; Dorosky, R.J.; Boutton, T.W. Forest Harvest Intensity and Soil Depth Alter Inorganic Nitrogen Pool Sizes and Ammonia Oxidizer Community Composition. Soil Biol. Biochem 2017, 112, 216–227. [Google Scholar] [CrossRef]
  23. Danielson, R.E.; Mcginnis, M.L.; Holub, S.M.; Myrold, D.D. Soil Fungal and Prokaryotic Community Structure Exhibits Differential Short-Term Responses to Timber Harvest in the Pacific Northwest. Pedosphere 2020, 30, 109–125. [Google Scholar] [CrossRef]
  24. Kohout, P.; Charvátová, M.; Štursová, M.; Mašínová, T.; Tomšovský, M.; Baldrian, P. Clearcutting Alters Decomposition Processes and Initiates Complex Restructuring of Fungal Communities in Soil and Tree Roots. ISME J. 2018, 12, 692–703. [Google Scholar] [CrossRef]
  25. Churchland, C.; Bengtson, P.; Prescott, C.E.; Grayston, S.J. Dispersed Variable-Retention Harvesting Mitigates N Losses on Harvested Sites in Conjunction With Changes in Soil Microbial Community Structure. Front. For. Glob. Change 2021, 3, 609216. [Google Scholar] [CrossRef]
  26. Bååth, E.; Frostegård, Å.; Pennanen, T.; Fritze, H. Microbial Community Structure and pH Response in Relation to Soil Organic Matter Quality in Wood-Ash Fertilized, Clear-Cut or Burned Coniferous Forest Soils. Soil Biol. Biochem. 1995, 27, 229–240. [Google Scholar] [CrossRef]
  27. Wilhelm, R.C.; Cardenas, E.; Leung, H.; Szeitz, A.; Jensen, L.D.; Mohn, W.W. Long-Term Enrichment of Stress-Tolerant Cellulolytic Soil Populations Following Timber Harvesting Evidenced by Multi-Omic Stable Isotope Probing. Front. Microbiol. 2017, 8, 537. [Google Scholar] [CrossRef]
  28. Metzger, M.J.; Shkaruba, A.D.; Jongman, R.H.G.; Bunce, R.G.H. Descriptions of the European Environmental Zones and Strata; Alterra: Wageningen, The Netherlands, 2012; p. 154. [Google Scholar]
  29. Herlemann, D.P.; Labrenz, M.; Jürgens, K.; Bertilsson, S.; Waniek, J.J.; Andersson, A.F. Transitions in Bacterial Communities along the 2000 Km Salinity Gradient of the Baltic Sea. ISME J 2011, 5, 1571–1579. [Google Scholar] [CrossRef]
  30. Illumina 16S Metagenomic Sequencing Library Preparation. Available online: https://support.illumina.com/downloads/16s_metagenomic_sequencing_library_preparation.html (accessed on 13 February 2024).
  31. MSZ 21470-2:1981; Environmental Protection. Preparation of Soil Sample. Determination of Electrical Conduction, Humidity and pH. Hungarian Standards Institution: Budapest, Hungary, 1981. Available online: https://ugyintezes.mszt.hu/webaruhaz/szabvany-adatok?standard=79903 (accessed on 15 November 2018).
  32. MSZ-08-0206-2:1978; Evaluation of Some Chemical Properties of the Soil. Laboratory Tests. (pH Value, Phenolphtaleine Alkalinity Expressed in Soda, All Water Soluble Salts, Hydrolite (Yˇ1^-Value) and Exchanging Acidity (Yˇ2^-Value). Hungarian Standards Institution: Budapest, Hungary, 1978. Available online: https://ugyintezes.mszt.hu/webaruhaz/szabvanyadatok?standard=83417 (accessed on 15 November 2018).
  33. ISO 10694:1995; Soil Quality—Determination of Organic and Total Carbon after Dry Combustion (Elementary Analysis). International Organization for Standardization: Geneva, Switzerland, 1995. Available online: https://www.iso.org/standard/18782.html (accessed on 15 November 2018).
  34. ISO 13878:1998; Soil Quality—Determination of Total Nitrogen Content by Dry Combustion (“elemental Analysis”). International Organization for Standardization: Geneva, Switzerland, 1998. Available online: https://www.iso.org/standard/23117.html (accessed on 15 November 2018).
  35. MSZ 20135:1999; Determination of the Soluble Nutrient Element Content of the Soil. Hungarian Standards Institution: Budapest, Hungary, 1999. Available online: https://ugyintezes.mszt.hu/webaruhaz/szabvany-adatok?standard=97375 (accessed on 15 November 2018).
  36. Schloss, P.D.; Westcott, S.L.; Ryabin, T.; Hall, J.R.; Hartmann, M.; Hollister, E.B.; Lesniewski, R.A.; Oakley, B.B.; Parks, D.H.; Robinson, C.J.; et al. Introducing Mothur: Open-Source, Platform-Independent, Community-Supported Software for Describing and Comparing Microbial Communities. Appl. Environ. Microbiol. 2009, 75, 7537–7541. [Google Scholar] [CrossRef]
  37. Quast, C.; Pruesse, E.; Yilmaz, P.; Gerken, J.; Schweer, T.; Yarza, P.; Peplies, J.; Glöckner, F.O. The SILVA Ribosomal RNA Gene Database Project: Improved Data Processing and Web-Based Tools. Nucleic. Acids Res. 2013, 41, D590–D596. [Google Scholar] [CrossRef]
  38. Huse, S.M.; Welch, D.M.; Morrison, H.G.; Sogin, M.L. Ironing out the Wrinkles in the Rare Biosphere through Improved OTU Clustering. Environ. Microbiol. 2010, 12, 1889–1898. [Google Scholar] [CrossRef]
  39. Rognes, T.; Flouri, T.; Nichols, B.; Quince, C.; Mahé, F. VSEARCH: A Versatile Open Source Tool for Metagenomics. PeerJ 2016, 4, e2584. [Google Scholar] [CrossRef]
  40. Prodan, A.; Tremaroli, V.; Brolin, H.; Zwinderman, A.H.; Nieuwdorp, M.; Levin, E. Comparing Bioinformatic Pipelines for Microbial 16S rRNA Amplicon Sequencing. PLoS ONE 2020, 15, e0227434. [Google Scholar] [CrossRef] [PubMed]
  41. Wang, Q.; Garrity, G.M.; Tiedje, J.M.; Cole, J.R. Naive Bayesian Classifier for Rapid Assignment of rRNA Sequences into the New Bacterial Taxonomy. Appl. Environ. Microbiol. 2007, 73, 5261–5267. [Google Scholar] [CrossRef] [PubMed]
  42. Westcott, S.L.; Schloss, P.D. OptiClust, an Improved Method for Assigning Amplicon-Based Sequence Data to Operational Taxonomic Units. mSphere 2017, 2, e00073-17. [Google Scholar] [CrossRef]
  43. R Core Team R: A Language and Environment for Statistical Computing 2022. Available online: https://www.R-project.org/ (accessed on 22 April 2022).
  44. Campbell, C.D.; Chapman, S.J.; Cameron, C.M.; Davidson, M.S.; Potts, J.M. A Rapid Microtiter Plate Method To Measure Carbon Dioxide Evolved from Carbon Substrate Amendments so as To Determine the Physiological Profiles of Soil Microbial Communities by Using Whole Soil. Appl. Environ. Microbiol. 2003, 69, 3593–3599. [Google Scholar] [CrossRef]
  45. Wickham, H.; François, R.; Henry, L.; Müller, K.; Vaughan, D.; Software, P. PBC Dplyr: A Grammar of Data Manipulation 2023. Available online: https://dplyr.tidyverse.org/(accessed on 22 April 2023).
  46. Royston, J.P. Algorithm AS 181: The W Test for Normality. Appl. Stat. 1982, 31, 176. [Google Scholar] [CrossRef]
  47. Shapiro, S.S.; Wilk, M.B. An Analysis of Variance Test for Normality (Complete Samples). Biometrika 1965, 52, 591–611. [Google Scholar] [CrossRef]
  48. Girden, E.R. ANOVA: Repeated Measures; SAGE Publications, Inc.: Thousand Oaks, CA, USA, 1992; ISBN 978-1-4129-8341-9. [Google Scholar]
  49. Kruskal, W.H.; Wallis, W.A. Use of Ranks in One-Criterion Variance Analysis. J. Am. Stat. Assoc. 1952, 47, 583–621. [Google Scholar] [CrossRef]
  50. Lenth, R.V.; Bolker, B.; Buerkner, P.; Giné-Vázquez, I.; Herve, M.; Jung, M.; Love, J.; Miguez, F.; Riebl, H.; Singmann, H. Emmeans: Estimated Marginal Means, Aka Least-Squares Means, R Package Version 1.8.6. 2023. Available online: https://CRAN.Rproject.org/package=emmeans (accessed on 15 October 2023).
  51. Hothorn, T.; Bretz, F.; Westfall, P. Simultaneous Inference in General Parametric Models. Biom. J. 2008, 50, 346–363. [Google Scholar] [CrossRef]
  52. Freedman, D.; Pisani, R.; Purves, R. Statistics, 4th ed.; W.W. Norton & Co: New York, NY, USA, 2007; ISBN 978-0-393-92972-0. [Google Scholar]
  53. Oksanen, J.; Simpson, G.L.; Blanchet, F.G.; Kindt, R.; Legendre, P.; Minchin, P.R.; O’Hara, R.B.; Solymos, P.; Stevens, M.H.H.; Szoecs, E.; et al. Vegan: Community Ecology Package, R Package Version 2.6-2. 2022. Available online: https://CRAN.Rproject.org/package=vegan (accessed on 15 October 2023).
  54. Dray, S. Packfor: Forward Selection with Permutation (Canoco p.46), R Package Version 0.0-8/r136. 2016. Available online: https://RForge.R-project.org/projects/sedar/ (accessed on 15 October 2023).
  55. Kruskal, J.B. Nonmetric Multidimensional Scaling: A Numerical Method. Psychometrika 1964, 29, 115–129. [Google Scholar] [CrossRef]
  56. Wickham, H. Ggplot2: Elegant Graphics for Data Analysis, 2nd ed.; Use R! Springer International Publishing: Cham, Switzerland, 2016; ISBN 978-3-319-24277-4. [Google Scholar]
  57. Gu, Z.; Eils, R.; Schlesner, M. Complex Heatmaps Reveal Patterns and Correlations in Multidimensional Genomic Data. Bioinformatics 2016, 32, 2847–2849. [Google Scholar] [CrossRef] [PubMed]
  58. Brewster, R. Paint.Net 2023. Available online: https://getpaint.net/ (accessed on 15 December 2023).
  59. Lewandowski, T.E.; Forrester, J.A.; Mladenoff, D.J.; D’Amato, A.W.; Fassnacht, D.S.A.; Padley, E.; Martin, K.J. Do Biological Legacies Moderate the Effects of Forest Harvesting on Soil Microbial Community Composition and Soil Respiration. For. Ecol. Manag. 2019, 432, 298–308. [Google Scholar] [CrossRef]
  60. Stefanowicz, A.M.; Kapusta, P.; Stanek, M.; Rola, K.; Zubek, S. Herbaceous Plant Species Support Soil Microbial Performance in Deciduous Temperate Forests. Sci. Total Environ. 2022, 810, 151313. [Google Scholar] [CrossRef] [PubMed]
  61. Henneron, L.; Cros, C.; Picon-Cochard, C.; Rahimian, V.; Fontaine, S. Plant Economic Strategies of Grassland Species Control Soil Carbon Dynamics through Rhizodeposition. J. Ecol. 2020, 108, 528–545. [Google Scholar] [CrossRef]
  62. Cornejo, N.S.; Becker, J.N.; Hemp, A.; Hertel, D. Effects of Land-Use Change and Disturbance on the Fine Root Biomass, Dynamics, Morphology, and Related C and N Fluxes to the Soil of Forest Ecosystems at Different Elevations at Mt. Kilimanjaro (Tanzania). Oecologia 2023, 201, 1089–1107. [Google Scholar] [CrossRef]
  63. Ma, C.; Zhang, W.; Wu, M.; Xue, Y.; Ma, L.; Zhou, J. Effect of Aboveground Intervention on Fine Root Mass, Production, and Turnover Rate in a Chinese Cork Oak (Quercus variabilis Blume) Forest. Plant Soil 2013, 368, 201–214. [Google Scholar] [CrossRef]
  64. Martinović, T.; Kohout, P.; López-Mondéjar, R.; Algora Gallardo, C.; Starke, R.; Tomšovský, M.; Baldrian, P. Bacterial Community in Soil and Tree Roots of Picea abies Shows Little Response to Clearcutting. FEMS Microbiol. Ecol. 2022, 98, fiac118. [Google Scholar] [CrossRef] [PubMed]
  65. Mukherjee, S.; Juottonen, H.; Siivonen, P.; Lloret Quesada, C.; Tuomi, P.; Pulkkinen, P.; Yrjälä, K. Spatial Patterns of Microbial Diversity and Activity in an Aged Creosote-Contaminated Site. ISME J 2014, 8, 2131–2142. [Google Scholar] [CrossRef]
  66. Navarrete, A.A.; Kuramae, E.E.; de Hollander, M.; Pijl, A.S.; van Veen, J.A.; Tsai, S.M. Acidobacterial Community Responses to Agricultural Management of Soybean in Amazon Forest Soils. FEMS Microbiol. Ecol. 2013, 83, 607–621. [Google Scholar] [CrossRef]
  67. Achat, D.L.; Deleuze, C.; Landmann, G.; Pousse, N.; Ranger, J.; Augusto, L. Quantifying Consequences of Removing Harvesting Residues on Forest Soils and Tree Growth—A Meta-Analysis. For. Ecol. Manag. 2015, 348, 124–141. [Google Scholar] [CrossRef]
  68. Gramss, G.; Voigt, K.-D.; Bergmann, H. Plant Availability and Leaching of (Heavy) Metals from Ammonium-, Calcium-, Carbohydrate-, and Citric Acid-Treated Uranium-Mine-Dump Soil. J. Plant Nutr. Soil Sci. 2004, 167, 417–427. [Google Scholar] [CrossRef]
  69. Evangelou, M.W.H.; Ebel, M.; Hommes, G.; Schaeffer, A. Biodegradation: The Reason for the Inefficiency of Small Organic Acids in Chelant-Assisted Phytoextraction. Water Air Soil Pollut. 2008, 195, 177–188. [Google Scholar] [CrossRef]
  70. Bergmann, G.T.; Bates, S.T.; Eilers, K.G.; Lauber, C.L.; Caporaso, J.G.; Walters, W.A.; Knight, R.; Fierer, N. The Under-Recognized Dominance of Verrucomicrobia in Soil Bacterial Communities. Soil Biol. Biochem. 2011, 43, 1450–1455. [Google Scholar] [CrossRef] [PubMed]
  71. da Rocha, U.N.; Andreote, F.D.; de Azevedo, J.L.; van Elsas, J.D.; van Overbeek, L.S. Cultivation of Hitherto-Uncultured Bacteria Belonging to the Verrucomicrobia Subdivision 1 from the Potato (Solanum tuberosum L.). Rhizosphere. J. Soils Sediments 2010, 10, 326–339. [Google Scholar] [CrossRef]
  72. Shen, C.; Ge, Y.; Yang, T.; Chu, H. Verrucomicrobial Elevational Distribution Was Strongly Influenced by Soil pH and Carbon/Nitrogen Ratio. J. Soils. Sediments 2017, 17, 2449–2456. [Google Scholar] [CrossRef]
  73. Ranjan, K.; Paula, F.S.; Mueller, R.C.; Jesus, E.d.C.; Cenciani, K.; Bohannan, B.J.M.; Nüsslein, K.; Rodrigues, J.L.M. Forest-to-Pasture Conversion Increases the Diversity of the Phylum Verrucomicrobia in Amazon Rainforest Soils. Front. Microbiol. 2015, 6, 779. [Google Scholar] [CrossRef] [PubMed]
  74. Fierer, N.; Ladau, J.; Clemente, J.C.; Leff, J.W.; Owens, S.M.; Pollard, K.S.; Knight, R.; Gilbert, J.A.; McCulley, R.L. Reconstructing the Microbial Diversity and Function of Pre-Agricultural Tallgrass Prairie Soils in the United States. Science 2013, 342, 621–624. [Google Scholar] [CrossRef] [PubMed]
  75. Ventura, M.; Canchaya, C.; Tauch, A.; Chandra, G.; Fitzgerald, G.F.; Chater, K.F.; van Sinderen, D. Genomics of Actinobacteria: Tracing the Evolutionary History of an Ancient Phylum. Microbiol. Mol. Biol. Rev. 2007, 71, 495–548. [Google Scholar] [CrossRef] [PubMed]
  76. Deng, J.; Bai, X.; Zhou, Y.; Zhu, W.; Yin, Y. Variations of Soil Microbial Communities Accompanied by Different Vegetation Restoration in an Open-Cut Iron Mining Area. Sci. Total Environ. 2020, 704, 135243. [Google Scholar] [CrossRef]
  77. Lan, J.; Wang, S.; Wang, J.; Qi, X.; Long, Q.; Huang, M. The Shift of Soil Bacterial Community After Afforestation Influence Soil Organic Carbon and Aggregate Stability in Karst Region. Front. Microbiol. 2022, 13, 901126. [Google Scholar] [CrossRef]
  78. Kaiser, K.; Wemheuer, B.; Korolkow, V.; Wemheuer, F.; Nacke, H.; Schöning, I.; Schrumpf, M.; Daniel, R. Driving Forces of Soil Bacterial Community Structure, Diversity, and Function in Temperate Grasslands and Forests. Sci. Rep. 2016, 6, 33696. [Google Scholar] [CrossRef] [PubMed]
  79. Plassart, P.; Prévost-Bouré, N.C.; Uroz, S.; Dequiedt, S.; Stone, D.; Creamer, R.; Griffiths, R.I.; Bailey, M.J.; Ranjard, L.; Lemanceau, P. Soil Parameters, Land Use, and Geographical Distance Drive Soil Bacterial Communities along a European Transect. Sci. Rep. 2019, 9, 605. [Google Scholar] [CrossRef]
  80. Houston, A.P.C.; Visser, S.; Lautenschlager, R.A. Microbial Processes and Fungal Community Structure in Soils from Clear-Cut and Unharvested Areas of Two Mixedwood Forests. Can. J. Bot. 1998, 76, 630–640. [Google Scholar] [CrossRef]
  81. Johnson, D.; Booth, R.E.; Whiteley, A.S.; Bailey, M.J.; Read, D.J.; Grime, J.P.; Leake, J.R. Plant Community Composition Affects the Biomass, Activity and Diversity of Microorganisms in Limestone Grassland Soil. Eur. J. Soil Sci. 2003, 54, 671–678. [Google Scholar] [CrossRef]
  82. Orwin, K.H.; Buckland, S.M.; Johnson, D.; Turner, B.L.; Smart, S.; Oakley, S.; Bardgett, R.D. Linkages of Plant Traits to Soil Properties and the Functioning of Temperate Grassland. J. Ecol. 2010, 98, 1074–1083. [Google Scholar] [CrossRef]
  83. Stefanowicz, A.M.; Kapusta, P.; Błońska, A.; Kompała-Bąba, A.; Woźniak, G. Effects of Calamagrostis Epigejos, Chamaenerion Palustre and Tussilago Farfara on Nutrient Availability and Microbial Activity in the Surface Layer of Spoil Heaps after Hard Coal Mining. Ecol. Eng. 2015, 83, 328–337. [Google Scholar] [CrossRef]
  84. Stefanowicz, A.M.; Kapusta, P.; Stanek, M.; Rożek, K.; Rola, K.; Zubek, S. Herbaceous Plant Species and Their Combinations Positively Affect Soil Microorganisms and Processes and Modify Soil Physicochemical Properties in a Mesocosm Experiment. For. Ecol. Manag. 2023, 532, 120826. [Google Scholar] [CrossRef]
  85. Roberts, M.R.; Zhu, L. Early Response of the Herbaceous Layer to Harvesting in a Mixed Coniferous–Deciduous Forest in New Brunswick, Canada. For. Ecol. Manag. 2002, 155, 17–31. [Google Scholar] [CrossRef]
  86. de Graaf, M.; Roberts, M.R. Short-Term Response of the Herbaceous Layer within Leave Patches after Harvest. For. Ecol. Manag. 2009, 257, 1014–1025. [Google Scholar] [CrossRef]
  87. Nguyen, C. Rhizodeposition of Organic C by Plant: Mechanisms and Controls. In Sustainable Agriculture; Lichtfouse, E., Navarrete, M., Debaeke, P., Véronique, S., Alberola, C., Eds.; Springer: Dordrecht, The Netherlands, 2009; pp. 97–123. ISBN 978-90-481-2666-8. [Google Scholar]
  88. Jones, D.L.; Hodge, A.; Kuzyakov, Y. Plant and Mycorrhizal Regulation of Rhizodeposition. New Phytol. 2004, 163, 459–480. [Google Scholar] [CrossRef] [PubMed]
  89. Dennis, P.G.; Miller, A.J.; Hirsch, P.R. Are Root Exudates More Important than Other Sources of Rhizodeposits in Structuring Rhizosphere Bacterial Communities? FEMS Microbiol. Ecol. 2010, 72, 313–327. [Google Scholar] [CrossRef] [PubMed]
  90. Struecker, J.; Joergensen, R.G. Microorganisms and Their Substrate Utilization Patterns in Topsoil and Subsoil Layers of Two Silt Loams, Differing in Soil Organic C Accumulation Due to Colluvial Processes. Soil Biol. Biochem. 2015, 91, 310–317. [Google Scholar] [CrossRef]
  91. Gunina, A.; Dippold, M.A.; Glaser, B.; Kuzyakov, Y. Fate of Low Molecular Weight Organic Substances in an Arable Soil: From Microbial Uptake to Utilisation and Stabilisation. Soil Biol. Biochem. 2014, 77, 304–313. [Google Scholar] [CrossRef]
  92. Kaneda, S.; Krištůfek, V.; Baldrian, P.; Malý, S.; Frouz, J. Changes in Functional Response of Soil Microbial Community along Chronosequence of Spontaneous Succession on Post Mining Forest Sites Evaluated by Biolog and SIR Methods. Forests 2019, 10, 1005. [Google Scholar] [CrossRef]
  93. Bongiorno, G.; Bünemann, E.K.; Brussaard, L.; Mäder, P.; Oguejiofor, C.U.; de Goede, R.G.M. Soil Management Intensity Shifts Microbial Catabolic Profiles across a Range of European Long-Term Field Experiments. Appl. Soil Ecol. 2020, 154, 103596. [Google Scholar] [CrossRef]
  94. Brockett, B.F.T.; Prescott, C.E.; Grayston, S.J. Soil Moisture Is the Major Factor Influencing Microbial Community Structure and Enzyme Activities across Seven Biogeoclimatic Zones in Western Canada. Soil Biol. Biochem. 2012, 44, 9–20. [Google Scholar] [CrossRef]
  95. Kania, A.; Langlade, N.; Martinoia, E.; Neumann, G. Phosphorus Deficiency-Induced Modifications in Citrate Catabolism and in Cytosolic pH as Related to Citrate Exudation in Cluster Roots of White Lupin. Plant Soil 2003, 248, 117–127. [Google Scholar] [CrossRef]
  96. Menezes-Blackburn, D.; Paredes, C.; Zhang, H.; Giles, C.D.; Darch, T.; Stutter, M.; George, T.S.; Shand, C.; Lumsdon, D.; Cooper, P.; et al. Organic Acids Regulation of Chemical–Microbial Phosphorus Transformations in Soils. Environ. Sci. Technol. 2016, 50, 11521–11531. [Google Scholar] [CrossRef]
  97. Oral, A.; Uygur, V. Effects of Low-Molecular-Mass Organic Acids on P Nutrition and Some Plant Properties of Hordeum vulgare. J. Plant Nutr. 2018, 41, 1482–1490. [Google Scholar] [CrossRef]
  98. Akram, M. Citric Acid Cycle and Role of Its Intermediates in Metabolism. Cell Biochem. Biophys. 2014, 68, 475–478. [Google Scholar] [CrossRef] [PubMed]
  99. Dimroth, P. Molecular Basis for Bacterial Growth on Citrate or Malonate. EcoSal Plus 2004, 1. [Google Scholar] [CrossRef] [PubMed]
  100. Mailloux, R.J.; Bériault, R.; Lemire, J.; Singh, R.; Chénier, D.R.; Hamel, R.D.; Appanna, V.D. The Tricarboxylic Acid Cycle, an Ancient Metabolic Network with a Novel Twist. PLoS ONE 2007, 2, e690. [Google Scholar] [CrossRef] [PubMed]
  101. Meylan, S.; Porter, C.B.M.; Yang, J.H.; Belenky, P.; Gutierrez, A.; Lobritz, M.A.; Park, J.; Kim, S.H.; Moskowitz, S.M.; Collins, J.J. Carbon Sources Tune Antibiotic Susceptibility in Pseudomonas Aeruginosa via Tricarboxylic Acid Cycle Control. Cell Chem. Biol. 2017, 24, 195–206. [Google Scholar] [CrossRef]
  102. Ramond, E.; Gesbert, G.; Rigard, M.; Dairou, J.; Dupuis, M.; Dubail, I.; Meibom, K.; Henry, T.; Barel, M.; Charbit, A. Glutamate Utilization Couples Oxidative Stress Defense and the Tricarboxylic Acid Cycle in Francisella Phagosomal Escape. PLoS Pathog. 2014, 10, e1003893. [Google Scholar] [CrossRef]
Figure 1. Mean relative abundance values of the six primary phyla. Homologous groups are indicated with the letters a, b, and c; similar letters demonstrate no significant differences. Significant connections should be interpreted at layers. Abbreviations: T1: T1 oak forest, T2: T2 oak forest; A: 0–10 cm soil layer, B: 10–40 cm soil layer. Thick black lines represent medians, while dark grey squares represent mean values.
Forests 15 01284 g001
Figure 2. Nonmetric multidimensional scaling (NMDS) diagram. The results are based on dissimilarities in the composition of bacterial communities expressed as bacterial relative abundances. Density curves indicate the 95% probability level. Abbreviations: T1: T1 oak forest, T2: T2 oak forest; A: 0–10 cm soil layer, B: 10–40 cm soil layer.
Forests 15 01284 g002
Figure 3. Redundancy analysis correlation biplot of phylum relative abundances and soil parameter values. Arrow length refers to the extent of the contribution of variables to the total variance. The angle between arrows corresponds to the correlation between variables (an angle of 90° represents zero correlation, while an angle of 0° or 180° represents maximal positive or negative correlation, respectively). The biplot illustrates taxa (blue letters) with the highest variation among the samples. Abbreviations: T1: T1 oak forest, T2: T2 oak forest; A: 0–10 cm soil layer, B: 10–40 cm soil layer. Abbreviations of physicochemical parameters are shown in Table 1.
Forests 15 01284 g003
Figure 4. Standardized substrate-induced respiration (upper) and Pearson correlation coefficient (lower) heatmaps. Diagrams illustrate average standardized respiration values determined at each site and the correlation between respiration data and environmental parameters. Asterisks indicate significant differences at a significance level of 0.01 < p ≤ 0.05 (*), 0.001 < p ≤ 0.01 (**), and p ≤ 0.001 (***), while empty cells indicate no significant differences (in the upper diagrams only). Abbreviations: T1: T1 oak forest, T2: T2 oak forest; A: 0–10 cm soil layer, B: 10–40 cm soil layer; ADT5: average daily temperature of five days before sampling (including sampling day). Abbreviations of carbon sources are shown in Section 2.6. Abbreviations of physicochemical parameters are shown in Table 1.
Forests 15 01284 g004
Figure 5. Redundancy analysis correlation biplot of substrate utilization and soil parameter values. Arrow length refers to the extent of the contribution of variables to the total variance. The angle between arrows corresponds to the correlation between variables (an angle of 90° represents zero correlation, while an angle of 0° or 180° represents maximal positive or negative correlation, respectively). The biplot illustrates carbon substrates (blue letters) with the highest variation among the samples. Abbreviations: T1: T1 oak forest, T2: T2 oak forest; A: 0–10 cm soil layer, B: 10–40 cm soil layer. Abbreviations of carbon sources are shown in Section 2.6. Abbreviations of physicochemical parameters are shown in Table 1.
Forests 15 01284 g005
Table 1. Average soil physical and chemical properties of the samples collected in the forest stands. Abbreviations: T1: T1 oak forest, T2: T2 oak forest, A: 0–10 cm, B: 10–40 cm, SM: soil moisture, CaCO3: calcium carbonate, TN: total nitrogen, TC: total carbon, TOC: total organic carbon, TIC: total inorganic carbon, AL–P2O5: ammonium lactate soluble phosphorous, AL–K2O: ammonium lactate soluble potassium, AL–Na: ammonium lactate soluble sodium, AL–Mg: ammonium lactate soluble magnesium, AL–Ca: ammonium lactate soluble calcium, NO3–N: nitrate nitrogen. Significant differences at p = 0.05 are marked with bold characters, while homologous groups with the letters a, b, c and d. Compact letter displays are always relative to a given layer and soil parameter combination.
LayerStandYearSoil Moisture pH H 2 O CaCO3TNTCTOCTIC
%%%%%%
AT1201817.10 ± 6.67 a7.17 ± 0.09 b5.41 ± 1.15 b0.20 ± 0.01 ab3.65 ± 0.19 bc2.44 ± 0.13 ab1.17 ± 0.19 b
201917.0 ± 2.59 a7.31 ± 0.10 b7.02 ± 1.41 b0.26 ± 0.03 bc4.08 ± 0.28 cd2.80 ± 0.36 abc1.28 ± 0.22 b
202016.1 ± 3.29 a7.24 ± 0.04 b5.30 ± 2.10 b0.27 ± 0.01 bc4.45 ± 0.58 cd2.98 ± 0.34 bc1.47 ± 0.42 b
202123.1 ± 1.84 a7.59 ± 0.15 b4.92 ± 0.42 b0.31 ± 0.03 c4.68 ± 0.15 d3.26 ± 0.07 c1.42 ± 0.08 b
T2201815.5 ± 5.74 a5.82 ± 0.6 a0 ± 0 a0.16 ± 0.02 a2.38 ± 0.25 a2.22 ± 0.20 a0.17 ± 0.06 a
201918.5 ± 3.90 a5.76 ± 0.87 a0.22 ± 0.49 a0.22 ± 0.05 ab2.90 ± 0.53 ab2.58 ± 0.41 abc0.32 ± 0.16 a
202018.6 ± 7.08 a5.50 ± 0.61 a0 ± 0 a0.23 ± 0.06 abc3.19 ± 0.28 ab2.86 ± 0.21 abc0.33 ± 0.07 a
202120.1 ± 3.63 a6.44 ± 0.38 ab0.82 ± 1.42 a0.25 ± 0.05 bc3.53 ± 0.17 bc3.02 ± 0.25 bc0.51 ± 0.19 a
LayerStandYearAL-P2O5AL-K2OAL-NaAL-MgAL-CaNO3-N
mg 100 g−1mg 100 g−1mg kg−1mg g−1mg g−1mg kg−1
AT1201810.4 ± 3.21 a21.8 ± 1.86 a80.4 ± 21.7 c1.05 ± 0.53 abc25.0 ± 19.7 bcd2.81 ± 2.53 a
201910.0 ± 2.96 a29.2 ± 2.22 bc74.5 ± 15.1 bc1.20 ± 0.16 c30.9 ± 5.89 d0.92 ± 0.44 a
20206.74 ± 4.96 a29.2 ± 3.42 abc61.2 ± 7.04 abc1.27 ± 0.07 c30.6 ± 14.2 cd1.55 ± 2.02 a
20217.69 ± 0.98 a23.4 ± 0.69 ab60.6 ± 1.24 abc1.17 ± 0.03 bc25.7 ± 3.47 abcd4.41 ± 2.18 a
T220188.74 ± 2.18 a22.9 ± 2.32 ab42.6 ± 9.10 a0.51 ± 0.06 a2.43 ± 0.741 a1.29 ± 1.94 a
201912.7 ± 3.17 a35.5 ± 5.03 c49.0 ± 0.59 ab0.56 ± 0.15 ab3.26 ± 2.70 a1.18 ± 1.48 a
20208.64 ± 4.84 a35.6 ± 3.67 c50.3 ± 3.09 abc0.55 ± 0.11 ab2.28 ± 0.53 ab0.78 ± 1.35 a
20218.86 ± 0.76 a32.7 ± 0.31 c49.3 ± 8.53 abc0.71 ± 0.18 abc5.88 ± 5.61 abc4.59 ± 2.06 a
LayerStandYearSoil Moisture pH H 2 O CaCO3TNTCTOCTIC
%%%%%%
BT1201814.80 ± 5.69 a7.54 ± 0.16 b10.6 ± 2.39 b0.13 ± 0.01 a3.45 ± 0.34 b1.62 ± 0.14 ab1.81 ± 0.44 b
201915.1 ± 3.22 a7.73 ± 0.08 b9.83 ± 2.06 b0.14 ± 0.02 a3.15 ± 0.12 b1.42 ± 0.14 a1.73 ± 0.24 b
202012.4 ± 1.21 a7.60 ± 0.09 b8.70 ± 0.57 b0.15 ± 0.02 a3.30 ± 0.18 b1.49 ± 0.15 ab1.80 ± 0.22 b
202117.1 ± 1.07 a8.03 ± 0.18 b7.80 ± 1.47 b0.17 ± 0.02 a3.16 ± 0.14 b1.58 ± 0.19 ab1.58 ± 0.19 b
T2201814.00 ± 4.48 a6.37 ± 0.41 a0 ± 0 a0.15 ± 0.01 a2.22 ± 0.15 a2.06 ± 0.08 c0.20 ± 0.08 a
201917.9 ± 3.76 a6.03 ± 0.96 a1.41 ± 3.15 a0.16 ± 0.01 a2.26 ± 0.50 a1.80 ± 0.28 bc0.47 ± 0.63 a
202017.5 ± 2.81 a5.33 ± 0.28 a0 ± 0 a0.16 ± 0.05 a2.02 ± 0.13 a1.84 ± 0.11 bc0.18 ± 0.02 a
202117.2 ± 1.54 a5.86 ± 0.48 a0 ± 0 a0.16 ± 0.01 a2.00 ± 0.14 a1.81 ± 0.11 abc0.19 ± 0.03 a
LayerStandYearAL-P2O5AL-K2OAL-NaAL-MgAL-CaNO3-N
mg 100 g−1mg 100 g−1mg kg−1mg g−1mg g−1mg kg−1
BT120188.72 ± 3.30 a16.6 ± 2.15 a83.2 ± 22.0 bc1.22 ± 0.41 bc34.5 ± 20.1 cd0.75 ± 1.30 a
20197.64 ± 3.39 a21.3 ± 2.05 b85.5 ± 10.9 c1.35 ± 0.16 c47.6 ± 7.31 d1.70 ± 1.82 a
20203.91 ± 4.96 a23.0 ± 2.12 bc65.8 ± 17.4 abc1.49 ± 0.08 c43.3 ± 14.3 d0.64 ± 0.67 a
20214.26 ± 0.80 a19.1 ± 1.79 ab69.0 ± 4.61 abc1.24 ± 0.01 bc37.5 ± 4.55 bcd2.75 ± 1.61 a
T220188.41 ± 3.47 a22.1 ± 1.19 bc50.8 ± 7.16 a0.48 ± 0.04 a3.09 ± 0.81 a0.09 ± 0.19 a
201910.4 ± 2.75 a25.8 ± 2.83 c55.8 ± 12.7 ab0.66 ± 0.45 ab10.8 ± 19.0 abc0.81 ± 1.38 a
20205.37 ± 4.41 a23.9 ± 1.81 bc56.5 ± 4.75 abc0.47 ± 0.06 a2.28 ± 0.12 ab0.17 ± 0.23 a
20215.62 ± 1.76 a22.2 ± 0.28 bc47.0 ± 1.99 a0.49 ± 0.01 a2.33 ± 0.12 ab2.51 ± 0.76 a
Disclaimer/Publisher’s Note: The statements, opinions and data contained in all publications are solely those of the individual author(s) and contributor(s) and not of MDPI and/or the editor(s). MDPI and/or the editor(s) disclaim responsibility for any injury to people or property resulting from any ideas, methods, instructions or products referred to in the content.

