Article

Experimental and Statistical Determination of Convective Heat and Mass Transfer Coefficients for Eucalyptus nitens Sawn Wood Drying

1
Department of Wood Engineering, Faculty of Engineering, Universidad del Bío-Bío, Concepción 4030000, Chile
2
USDA Forest Service, Forest Products Laboratory, One Gifford Pinchot Drive, Madison, WI 53726, USA
3
Department of Business Management, Faculty of Management Sciences, Universidad del Bío-Bío, Chillán 3800708, Chile
4
Department of Industrial Engineering, Faculty of Engineering, Universidad del Bío-Bío, Concepción 4030000, Chile
5
Adhesives & Composites Materials Laboratory, Universidad del Bío-Bío, Concepción 4051381, Chile
6
Wood Design & Technology Laboratory, Universidad del Bío-Bío, Concepción 4051381, Chile
*
Author to whom correspondence should be addressed.
Forests 2024, 15(8), 1287; https://doi.org/10.3390/f15081287
Submission received: 13 June 2024 / Revised: 9 July 2024 / Accepted: 18 July 2024 / Published: 24 July 2024
(This article belongs to the Section Wood Science and Forest Products)

Abstract

:
This study aimed to develop a model using experimentally obtained convective heat and mass transfer coefficients to predict the effect of temperature, humidity, and drying rate on wood drying. Tangential wood samples of Eucalyptus nitens (H. Deane & Maiden) were used in the investigation. The experimental design consisted of two temperature levels (40 °C and 55 °C), two relative humidity levels (55% and 75%), and two air velocity settings (2 m·s−1 and 3 m·s−1). The experiments were conducted under a constant evaporation rate, spanning the maximum and critical moisture content in the wood. A statistical model using multivariate regression was created to predict the convective heat and mass transfer coefficients. The results indicated that the experimental data and empirical correlations exhibited an error margin of 37.77% and 37.86%, respectively. A significant positive correlation was found between the convective heat transfer coefficient and air velocity, temperature, and relative humidity, while the convective mass transfer coefficient showed a significant positive correlation only with air velocity and temperature. The model predicted the convective heat and mass transfer coefficients with high accuracy and statistical significance. Using the proposed method, we successfully obtained both convective coefficients, which enable accurate description of heat and mass flow during the convective drying of Eucalyptus nitens wood.

1. Introduction

The interaction between the inherent characteristics of wood and drying conditions is pivotal in the wood drying process. It entails a multifaceted dynamic involving concurrent heat and mass transfer, changes in water phases, wood properties, psychrometric variables, and more [1]. This interaction directly influences the rate of moisture evaporation within the wood, thereby defining both the duration and quality of the drying process [2,3,4,5].
In the wood drying process, moisture movement involves both evaporation from the wood surface and the internal transport of moisture through its structure. These mechanisms are typically elucidated using diffusion models, which utilize an apparent diffusion coefficient. This coefficient accounts for internal moisture transport effects, as well as heat and mass convection, thereby improving our understanding and ability to predict wood drying behavior [3,4,6,7,8,9,10,11,12]. Mathematically, convective heat and mass transfer are correlated with transport potential, either heat or mass, facilitating precise determination through mathematical analysis [9,13,14,15].
The exchange between a medium and its environment follows the principles of boundary layer theory [16]. These factors significantly impact the accuracy of models employed in forecasting wood drying processes [8,10,12,17,18]. Consequently, it is common practice to utilize empirical correlations that account for diverse geometries, air properties, and materials. Specifically, in convective wood drying, these correlations incorporate heat and mass flow parallel to a prismatic surface [2,7,8].
Another approach less commonly used involves experimentally determining convective coefficients, yielding precise values tailored to specific process conditions. This requires measuring variables such air properties, thermal diffusivity, and molecular diffusivity of water vapor [4,6,11], along with psychrometric variables and surface characteristics. While assessing these properties may be challenging in certain instances, the enhanced precision achieved for each drying condition and wood characteristic compensates for this complexity.
On the other hand, it must be recognized that experimental measurements are only viable when wood is within a moisture content range ranging from the fiber saturation point (FSP) to the critical moisture content. Within this span, theoretically, the wet bulb temperature matches the surface temperature of the wood. This theoretical alignment guarantees that heat transferred from the environment solely facilitates surface evaporation of the wood, streamlining effective monitoring [7,8]. However, once the evaporation front penetrates the wood’s interior, vapor and mass diffusion mechanisms are triggered, complicating direct experimental measurement. Generally, obtaining values for convective heat and mass coefficients accounts for the distinct characteristics of wood that empirical correlations fail to capture. These characteristics encompass wood permeability, porosity, and the specific conditions within the drying chamber where this process occurs. By effectively monitoring drying parameters, one can ensure an accurate prediction of surface behavior during wood drying.
By correlating experimental coefficients with the transport potential, both coefficients can be easily obtained [9,13,14,15]. Some researchers have employed this approach [8,19], stressing the significance of meticulous monitoring of psychrometric parameters throughout the drying process to achieve precise values. This highlights the importance of accurately simulating the wood drying process to ensure reliable outcomes. Surface evaporation mechanisms play a crucial role in determining the technological quality of wood, as the physical and anatomical characteristics dictate the drying rate. Additionally, these characteristics influence the formation of moisture gradients and stresses during drying.
He et al. investigated convective heat and mass transfer coefficients using a constant air velocity in a vacuum dryer at different temperatures and absolute pressures [9]. These coefficients have also been determined based on surface moisture content under a single relative humidity and temperature condition [17]. These authors indicated that inaccurate control of drying parameters leads to unreliable results.
Although empirical correlations are commonly employed, it remains a fact that there are no models that precisely capture this phenomenon during wood drying under specific conditions [1]. This lack of precision is notably consequential when attempting to simulate conventional wood drying, given that these coefficients demonstrate varying behaviors contingent upon the distinct attributes of each kiln, including its heating system, humidification, airflow, insulation level, and wood stacking method, among other factors.
These variables play a role in characterizing the behavior of convective heat or mass coefficients. However, in specific situations, empirical correlations fall short of encompassing all these complexities. To achieve greater precision in convective heat and mass transfer coefficients for conventional drying applications, alternative derivation methods are necessary. This would lead to a methodology that better reflects real-world drying conditions.
Traditionally, Eucalyptus nitens (H. Deane & Maiden) trees have been used mainly for pulp and paper production, with limited success in sawn timber production. Due to technological difficulties in processing trees from felling to drying, creating higher-value-added solid products has been a major challenge for the industry. Considering the importance of drying in the production of higher-value products, this study makes a significant contribution by determining convective heat and mass transfer coefficients that can be used for drying modeling. The coefficients obtained could be used to improve convection drying of Eucalyptus nitens wood, thereby enhancing its productivity. The aim of the study was to experimentally determine the convective heat and mass coefficients under various temperature, relative humidity, and air velocity settings, while maintaining a constant evaporation rate. Subsequently, a model was constructed using the collected data and compared against values derived from empirical correlations.

2. Materials and Methods

The essential steps for conducting this research are summarized in Figure 1, which will be detailed further below.

2.1. Origin and Sample Preparation

Ten 3.2-m-long logs were obtained from a 12-year-old Eucalyptus nitens plantation owned by CMPC Maderas company located in the Mulchén city at Biobío province, Chile. This region exhibits a Mediterranean climate (Csb), featuring distinct seasons with comparable dry and rainy periods [20]. The selection of Eucalyptus nitens at this age was based on the trend of harvesting trees from short rotation plantations. These trees have smaller diameters and contain a high proportion of juvenile wood. This type of wood has a higher tendency to develop defects during the drying process [5]. Logs were sawn tangentially using a band saw carriage, resulting in pieces with the dimensions of 36 × 100 × 1200 mm3 (thickness × width × length). Pieces free of knots and other surface defects were meticulously selected and primed for the drying process immediately after the sawing process. Moisture content (MC) of samples was determined according to the standard NCh 176/1 [21]. The results showed moisture levels around 90% with a margin of error of ±3%.

2.2. Experimental Design

Two drying temperatures (40 °C and 55 °C), two relative humidity levels (55% and 75%), and two drying air velocities (2 and 3 m s−1) were assessed. These conditions were chosen to closely resemble the drying protocols utilized in various Eucalyptus species, as indicated by prior research [5,22,23]. Based on these parameters, a 2k (k = 3 factors) factorial experimental design was implemented, with two specimens monitored per treatment (Table 1).

2.3. Drying Process

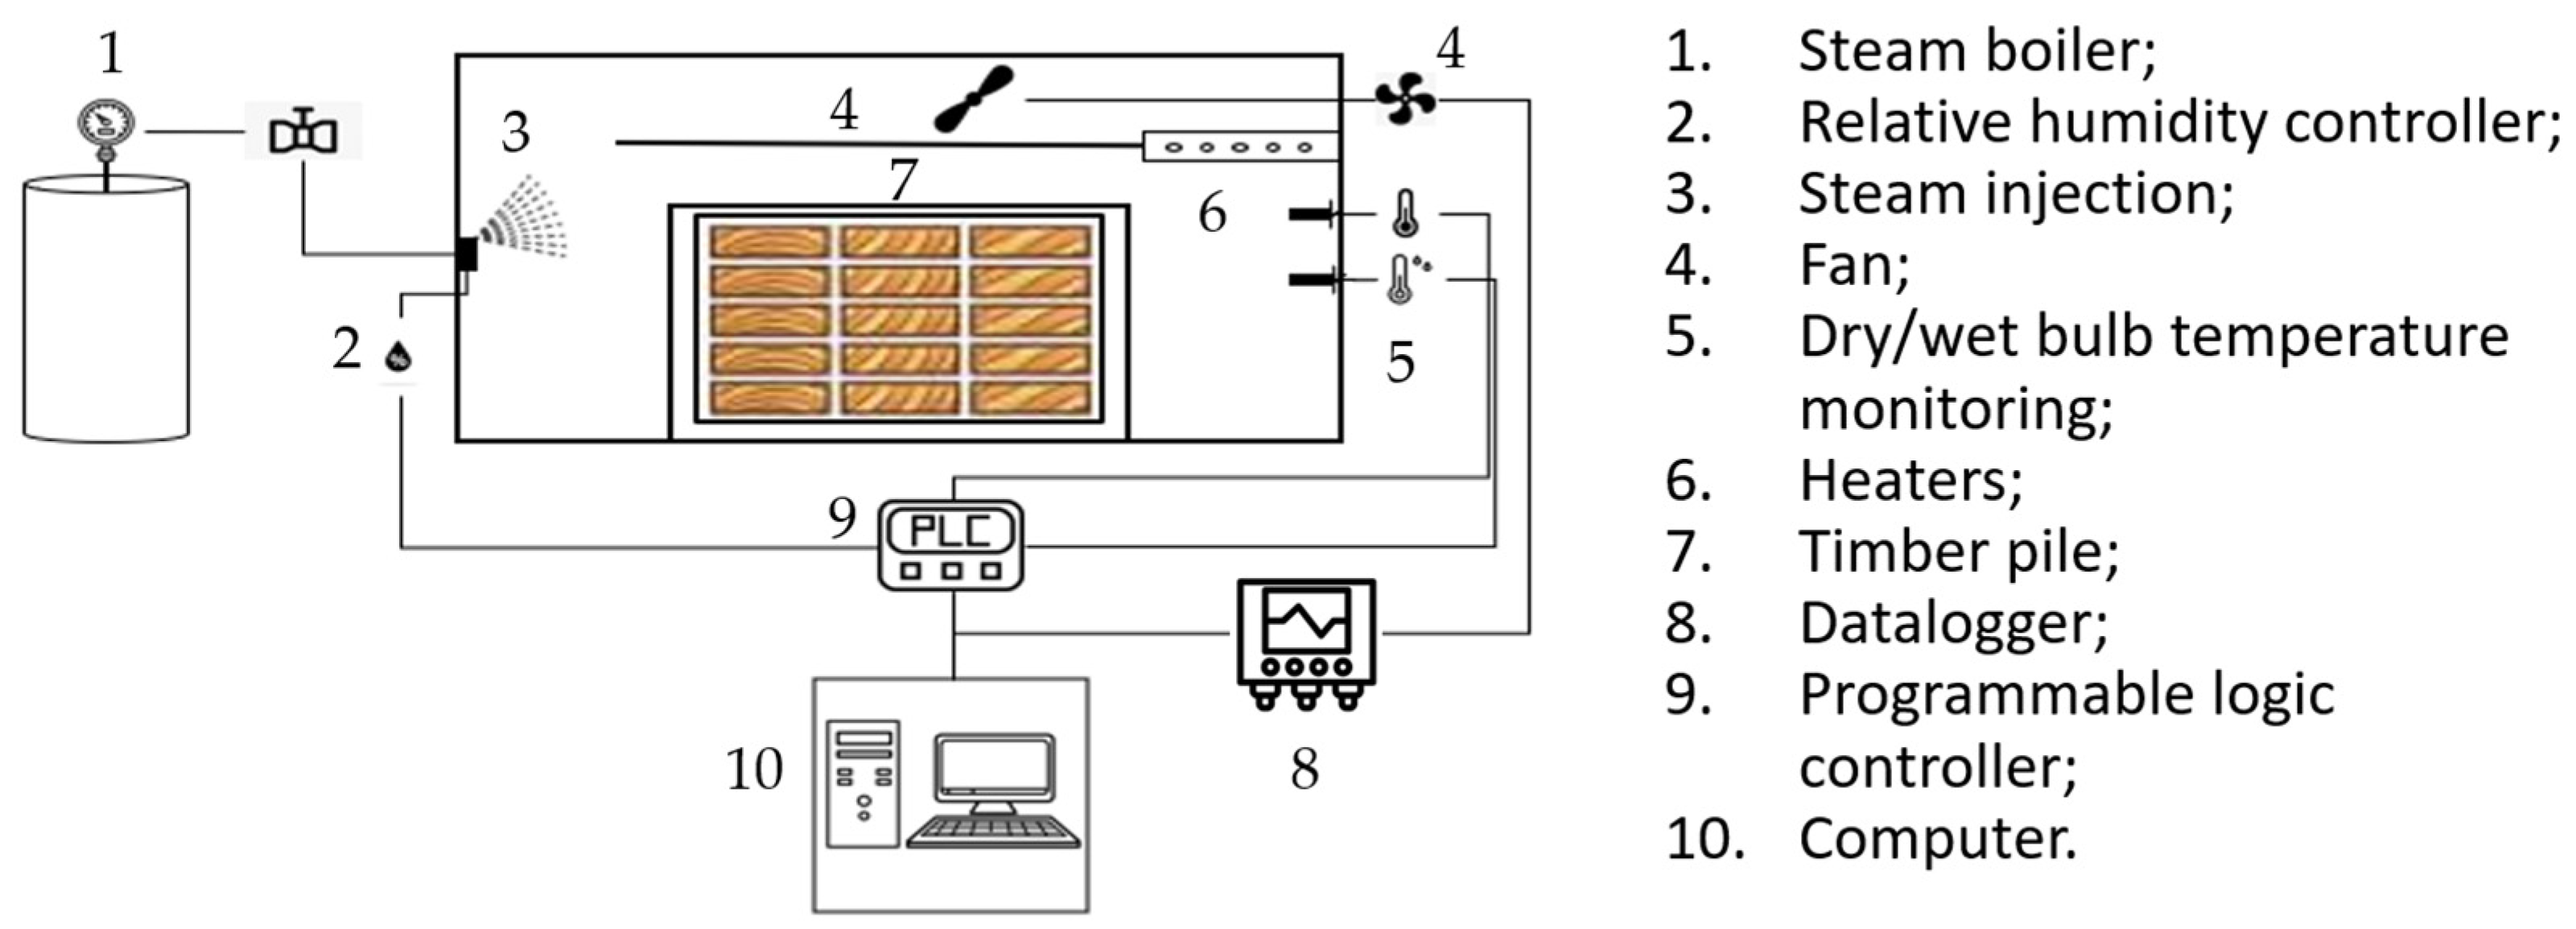
The experiments were conducted in a dry kiln with a capacity of 0.78 m3 that was capable of attaining temperatures of up to 90 °C and maintaining an air velocity of 4 m s−1. Steam was utilized for humidification, while electric resistance provided heating. Each experiment involved around 120 sawn pieces, including control samples. Psychrometric conditions were continuously monitored, with dry/wet bulb temperatures recorded using J-type thermocouples. Air velocity was regulated using a frequency converter and checked every five minutes with an anemometer. All data were stored using a data acquisition system (Data-Logger). Figure 2 shows a schematic of the kiln components.

2.4. Measurement of Mass Flow during Drying

Prior to measuring the evaporation rate, the control specimens underwent a 24 h conditioning period in a thermos-static tub held at wet bulb temperatures of 35 °C and 50 °C, ensuring consistent drying. This aims to homogenize the temperature of the specimens before the drying test, preventing water evaporation. Therefore, this ensures a constant drying temperature and rate. On the other hand, to minimize evaporation from the surfaces of the control samples, the edges and ends were sealed with aluminum foil secured with high-temperature silicone. Additionally, three J-type thermocouples were strategically placed on the wood surface to monitor its temperature. The rate of water evaporation (kg s−1·m−2) was calculated based on the evaporation area, determined with a precision meter accurate to 0.01 mm for width and length measurements. Evaporated water mass was tracked using a precision scale with 0.01 g accuracy that registered measurements at 5 min intervals. The experiment concluded once the surface thermocouples reached the wet bulb temperature recorded inside the kiln [19].

2.5. Experimental Determination of Convective Heat and Mass Transfer Coefficients

The experimental convective coefficients were derived utilizing equations from [8,9,24], which are specified in Equations (1) and (2). To accomplish this, measuring mass flow and monitoring the psychrometric parameters of the drying process were essential. Additionally, determination of the enthalpy of evaporation and absolute humidity was required, as outlined in Equations (3) and (4), respectively.
h c = F h e a t T d b T a i r M e v p A × t × λ T d b T w b
k m = F m a s d p v i p v a i r M e v p A × t × 1 A H 0 A H a i r
λ = 3.29 × 10 5 2806.6 × T b h
A H = 2167 × p v a T d b + 273.15
where
  • h c = Convective heat transfer coefficient (W m−2 K−1);
  • k m = Convective mass heat transfer coefficient (m s−1);
  • F m a s s = Convective mass flow (kg m−2 s−1);
  • F h e a t = Convective heat flow (kg m−2);
  • λ = Latent heat of vaporization (J kg−1) at Twb;
  • T d b = Dry bulb temperature (°C);
  • T w b = Wet bulb temperature (°C);
  • M e v p A × t = Evaporated water flow (kg s−1 m−2);
  • A H = Absolute humidity at a given Tdb y pv (kg m−3);
  • A H a i r = AH of the drying (kg m−3);
  • A H 0 = AH in control piece at Twb, equal to saturation absolute humidity (kg m−3);
  • p v a = Partial pressure of water vapor at Tdb (Pa);
  • p v = Partial pressure of vapor at given drying conditions (Pa).

2.6. Calculation of Convective Coefficients by Empirical Correlation

To compare the experimental results, we conducted necessary calculations to theoretically derive the convective heat (hc) and mass (km) coefficients via empirical correlation as detailed in Equations (5) and (6). Operating under identical psychrometric conditions, we derived the Nusselt number using the factor Ja from the Chilton–Colburn analogy for heat transfer [8] following Equation (7). Utilizing Equations (8)–(12), we determined the dimensional parameters essential for calculating both convective coefficients. This process included computing the dimensionless Sherwood number (Sh), which characterizes the relationship between convective mass transfer and diffusion, and which allows obtaining the convective mass coefficient (km) . As for the convective heat coefficient (hc), we utilized the Nusselt number (Nu), which provides a correlation between convective heat transfer and heat transfer by conduction [6,8,13,25].
h c = N u × k q a D h
k m = h c ρ g × c p a i r P r S c 2 3
J a = 0.023 × R e 1 / 5 = N u R e × P r 1 / 3
S h = k m × L D v
R e = V a × ρ g × D h μ g
D h = 4 × A P
P r = c p a i r × u g k q a
S c = u g D v × ρ g
where
  • h c = Convective heat coefficient (W m−2 K−1);
  • k m = Convective mass coefficient (m s−1);
  • k q a = Thermal conductivity of the air–vapor mixture (J s−1 m−1 K−1);
  • D h = Hydraulic diameter (m);
  • ρ g = Density of the air–vapor mixture (kg m−3);
  • c p a i r e = Specific heat of the air–vapor mixture (J kg−1 K−1);
  • J a = Chilton-Colburn analogy for heat transfer;
  • N u = Dimensionless Nusselt number;
  • R e = Dimensionless Reynolds number;
  • P r = Dimensionless Prandtl number;
  • S h = Dimensionless Sherwood number;
  • S c = Dimensionless Schmidt number;
  • D v = Diffusivity of water vapor in air (m−2 s−1);
  • Va = Air velocity (m s−1);
  • L = Heat and mass transfer surface area (m);
  • μ g = Viscosity of the air–vapor mixture (Pa s);
  • v g = Velocity of the air–vapor mixture (m s−1);
  • A = Cross-sectional area (m2) of the control piece;
  • P = Cross-sectional perimeter (m) of the control piece.

2.7. Statistical Analysis

We conducted an exploratory data analysis (EDA) to identify any outliers. Descriptive statistics were utilized to compute measures of central tendency and dispersion, along with maximum and minimum values and 95% confidence intervals. An analysis of variance (ANOVA) was executed with a significance level of 5% (p ≤ 0.05), followed by Tukey’s Honestly Significant Difference (HSD) test at the same significance level to detect statistically significant differences between treatments. Additionally, a multivariable regression statistical model was developed to mathematically predict both coefficients utilizing drying process variables as predictors, as detailed in Equation (13).
γ k n i j = β 0 + β 1 × T d b j + β 2 × R H k + β 3 × V n + ε
where
  • γ k n i j = Multivariable regression statistical model where; i-th convective coefficient obtained at the j-th dry bulb temperature, k-th relative humidity, and n-th air velocity, Ɐi: 1, 2; hc = 1, km = 2;
  • T d b j = j-th dry bulb temperature (°C), Ɐj: 40, …, 55;
  • R H k = k-th relative humidity (%); Ɐk: 55, …, 75;
  • V n = n-th air velocity (m s−1), Ɐn: 2, …, 3;
  • ɛ = Residual error;
  • β 0 , β 1 , β 2 , β 3 = Model parameters.
The model results were assessed by calculating their coefficients of determination (R2) and the relative error between the experimental value and the empirical correlation (Equation (14)) using MINITAB 16 (Minitab Inc., State College, PA, USA) software.
E r e l = Z e x p Z t Z t × 100
where
  • E r e l = Relative error between the experimental value and the empirical correlation (%);
  • Z e x p = Convective heat coefficient (W m−2 K−1) or experimental mass (m s−1);
  • Z t = Convective heat coefficient (W m−2 K−1) or mass (m s−1) obtained by the empirical correlation.

3. Results and Discussion

3.1. Isothermal Drying Process

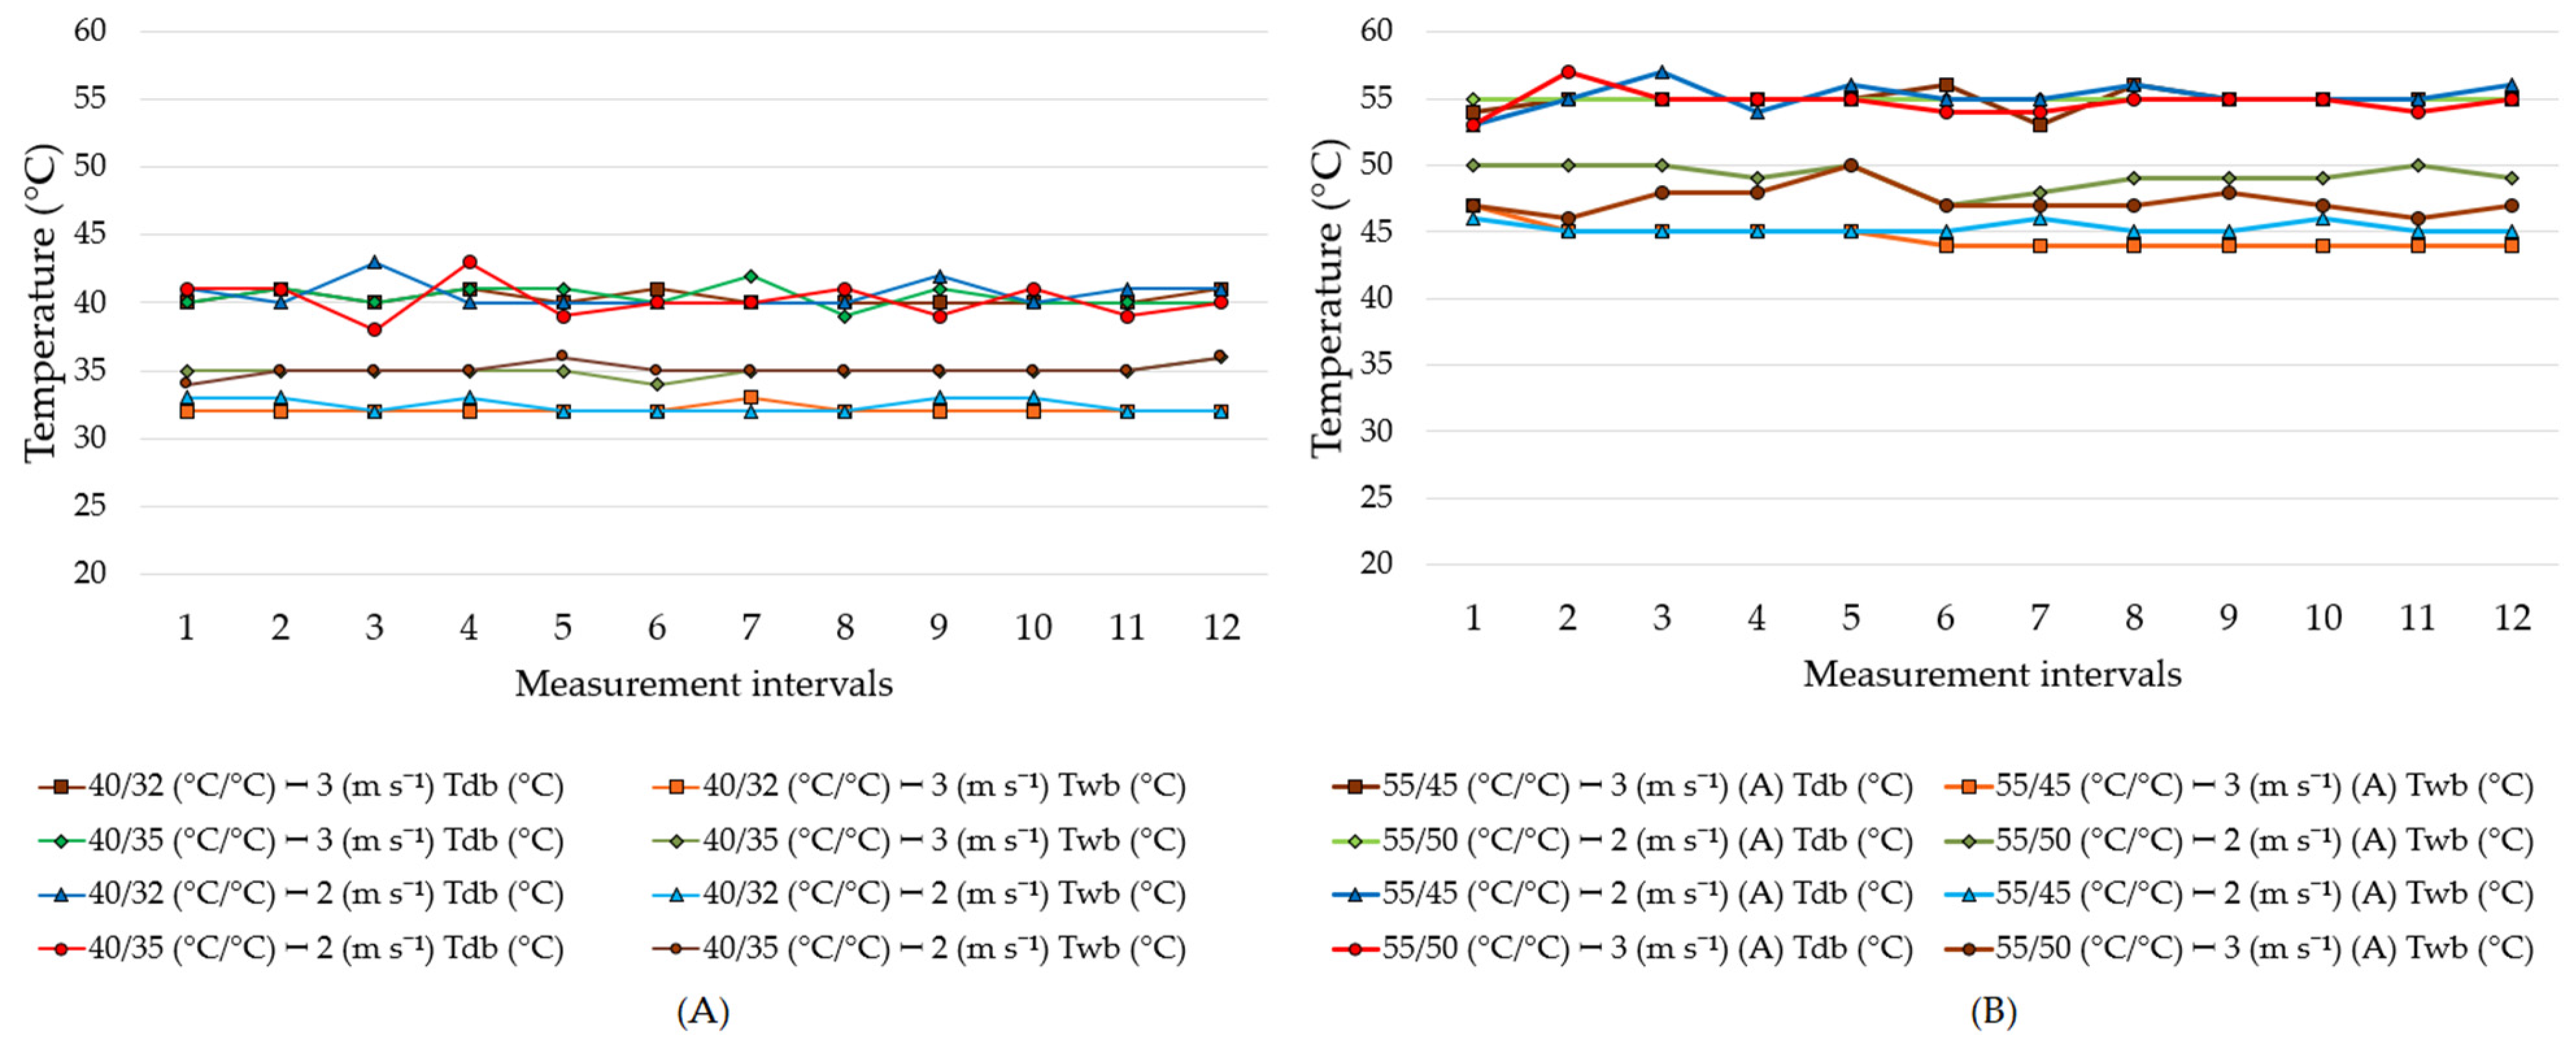
Figure 3 shows the distribution of dry bulb (Tdb) and wet bulb (Twb) temperatures for each treatment, where convective heat and mass coefficients were assessed.
Figure 4 shows the drying kinetics results for the samples corresponding to each evaluated treatment.

3.2. Convective Heat Transfer Coefficients

Table 2 presents the descriptive (measures of central tendency and dispersion) and inferential statistics for the experimental results of convective heat coefficients across each drying condition. The data revealed that the experimental convective heat coefficient exhibited an average variation between 10.84 and 25.50 W m−2 K−1, with coefficients of variation ranging from 8.1% to 23.1%, and standard deviations between 0.89 and 4.56 W m−2 K−1. The results showed low standard deviation and coefficients of variation in the measured values for each drying condition. The greatest variability was observed at the highest drying temperature (55 °C) and air velocity of 3 m s−1.
Recorded minimum values occurred at a temperature of 40 °C and an air velocity of 2 m s−1, whereas maximum values were observed at 55 °C and 2 m s−1. Moreover, an increase in relative error was noted with rising temperatures, which, in certain cases, revealed significant differences, particularly between measurements taken at 40 °C and 55 °C. It was determined that temperature (p < 0.001), relative humidity (p < 0.001), and air velocity (p < 0.001) are the significant factors influencing the variation in the convective heat coefficient.
In general, the experimental values were higher than those obtained through empirical correlation. This phenomenon was also reported by [3,7], who attributed it to the variability of psychrometric conditions during the drying process. Regarding the significant effect of temperature, relative humidity, and air velocity, our results partially differ from those reported by [26,27], who only considered air velocity as the factor explaining the variation in the convective heat coefficient. Therefore, considering all these variables allows for greater accuracy in simulating the drying process and predicting this coefficient more precisely.

3.3. Convective Mass Transfer Coefficient

Table 3 shows that the average experimental convective mass transfer coefficients ranged from 0.0048 to 0.0107 m s−1, with coefficients of variation between 4.3% and 21.4%, and standard deviations ranging from 0.0005 to 0.0019 m s−1.
The lowest value was recorded when the temperature was 40 °C and the air velocity was 2 m s−1 and mainly related to the lowest air velocity whereas the highest value was observed at 55 °C and 3 m s−1 for both RH (55% and 75%) A discrepancy of 37.86% was observed between the experimental convective mass transfer coefficients and those derived from empirical correlation, a difference that grew with air velocity. Furthermore, the research revealed the significant impacts of temperature (p < 0.001) and air velocity (p < 0.001) on the convective mass transfer coefficient.
The substantial influence of temperature and air velocity on the convective mass transfer coefficients aligns with the observation made by [17,25], both of whom also recognized the significance of these factors. Moreover, the analysis of variance unveiled notable levels of statistical significance (p < 0.001), suggesting a probability of less than 0.01% that any unaccounted factors impacted the outcomes of this study.
It is noteworthy that both the convective heat and mass coefficients displayed comparable relative errors, underscoring the intricacy of their experimental determination, particularly as temperature and air velocity increase. Nabhani et al. [25] contended that the disparity between empirical and experimental values stems from the failure of empirical correlation to account for the surface properties and density of wood, which significantly impact surface evaporation. Conversely, Haque [7] attributed this divergence to the uneven airflow inside the kiln. In light of these findings, Rozas [8] proposed that, under specific circumstances, employing empirical correlations may constitute a viable approach for estimating both convective coefficients.

3.4. Modeling of Convective Heat and Mass Transfer Coefficients

Building upon the preceding analysis, we implemented a multivariable linear regression model selected for its favorable coefficient of determination (R2), robust statistical significance (p < 0.001), and mathematical simplicity. This model facilitated the estimation of convective heat and mass coefficients, leveraging significant variables discernible through analysis of variance. The relevant parameters and statistics are delineated in Table 4, accentuating the model’s considerable significance (p < 0.001) and its strong fit, demonstrated by strong positive correlation (R2) values of 0.77 and 0.89 for hc and km, respectively.
The proposed model exhibited a linear increase in the convective mass transfer coefficient with temperature and air velocity, consistent with findings from various studies [7,17,28,29]. Additionally, under constant drying conditions, the model showed that the convective heat transfer coefficient increased linearly with air velocity, relative humidity, and dry bulb temperature. This behavior corroborates results reported in several investigations [7,17,25,26,27]. Notably, the model’s comprehensive scope and methodology provide a viable alternative approach for determining convective heat and mass coefficients. One potential application of these results is to support computational fluid dynamics modeling of convective drying chambers. This approach would enable a detailed analysis of convective coefficients and their interactions with wood surfaces [30]. Another potential application is in phase-field modeling for simulating drying processes. This method enables the capture of the evolution of interfaces between solid, liquid, and gaseous phases during drying. Incorporating convective coefficients into these models provides a deeper understanding of drying behavior [31]. Another important aspect is investigating the effect of wood stacking in drying kilns. Different stacking configurations alter the airflow and temperature distribution. Overall, the combination of theoretical models, experimental data, and innovative techniques can effectively contribute to optimizing the drying processes of E. nitens wood. Therefore, these results underscore the importance of a novel methodological approach to defining surface conditions for conventional wood drying. This approach contributes to modeling and determining the operating parameters of the drying process.

4. Conclusions

The convective heat and mass coefficients for tangential wood of E. nitens were experimentally determined under isothermal drying conditions. Significant correlations were observed between the convective heat transfer coefficient and the convective mass transfer coefficient with air velocity, temperature, and relative humidity under isothermal drying conditions. Additionally, the convective mass coefficient showed significant correlation with air velocity and temperature.
The multivariable regression model successfully facilitated the calculation of both coefficients, pinpointing temperature and air velocity as the primary influencers in prediction.
To enhance our understanding further, we advocate for extending this investigation to encompass various psychrometric drying conditions that were not explored in this study. Additionally, considering factors such as wood surface characteristics and wood stack in the drying kiln would enrich the predictive capacity of the drying process. This comprehensive approach would help to expand our understanding of the intricacies involved in the drying process. The combination of theorical models, experimental data, and innovative techniques can contribute to effectively optimizing the drying process of E. nitens wood.

Author Contributions

Conceptualization, C.R. and C.M.; methodology, C.R. and C.M.; validation, C.R., C.M. and V.O.-A.; formal analysis, R.L., V.O.-A., O.E. and C.R.; investigation, R.L., C.M. and C.R.; resources, C.R.; data curation, R.L., O.E. and C.M.; writing—original draft preparation, O.E. and C.M.; writing—review and editing, C.R., O.E., C.M., V.O.-A. and R.L.; visualization, O.E., C.R., C.M. and V.O.-A.; supervision, C.R.; project administration, C.R. All authors have read and agreed to the published version of the manuscript.

Funding

This research received no external funding.

Data Availability Statement

The data presented in this article are available upon reasonable request from the corresponding author.

Acknowledgments

The authors would like to acknowledge the Universidad del Bío-Bío and the Projects CD-INES I+D 22-17 and GI2380142 for the support in conducting this research.

Conflicts of Interest

The authors declare no conflicts of interest.

References

  1. Zhao, J.; Fu, Z.; Jia, X.; Cai, Y. Modeling Conventional Drying of Wood: Inclusion of a Moving Evaporation Interface. Dry. Technol. 2016, 34, 530–538. [Google Scholar] [CrossRef]
  2. Salin, J. External Heat and Mass Transfer—Some Remarks. In Proceedings of the 8th International IUFRO Wood Drying Conference, Brasov, Romania, 24–29 August 2003. [Google Scholar]
  3. Sargent, R.; Riley, S.; Schöttle, L. Measurement of Dynamic Sorption Behaviour of Small Specimens of Pinus radiata—Influence of Wood Type and Moisture Content on Difusion Rate. Maderas Cienc. Tecnol. 2010, 12, 93–103. [Google Scholar] [CrossRef]
  4. Salin, J.G. Inclusion of the Sorption Hysteresis Phenomenon in Future Drying Models. Some Basic Considerations. Maderas Cienc. Tecnol. 2011, 13, 173–182. [Google Scholar] [CrossRef]
  5. Montero, C.; Rozas, C. Exploratory Study for the Characterization of the Wood Drying Rate of Eucalyptus nitens Timber, Applying Multiple Regression Models. Sci. For. Sci. 2019, 47, 105–113. [Google Scholar] [CrossRef]
  6. Sanchez, R. Mathematical Correlation to Get Mass Transfer Coefficient in Solids Drying. Maderas Cienc. Tecnol. 2007, 9, 245–258. [Google Scholar]
  7. Haque, M.N. Analysis of Heat and Mass Transfer during High Temperature Drying of Pinus radiata. Dry. Technol. 2007, 25, 379–389. [Google Scholar] [CrossRef]
  8. Rozas, C. Modelo de Transferência de Calor e Massa Na Secagem de Madeira Serrada de Pinus. Ph.D. Thesis, Universidade Federal do Paraná, Curitiba, Brazil, 2007. [Google Scholar]
  9. He, Z.; Zhao, Z.; Zhang, Y.; Lv, H.; Yi, S. Convective Heat and Mass Transfer during Vacuum Drying Process. Wood Res. 2015, 60, 929–938. [Google Scholar]
  10. Skuratov, N.; Sapozhnikov, I.; Alexeeva, I. Measurements during Wood Drying Based on X-ray and Slicing Tecnhiques and Computation of Diffusion Coefficients. Pro Ligno 2015, 11, 383–388. [Google Scholar]
  11. Ratanawilai, T.; Nuntadusit, C.; Promtong, N. Drying Characteristics of Rubberwood by Impinging Hot-Air and Microwave Heating. Wood Res. 2015, 60, 59–70. [Google Scholar]
  12. Montero, C.; Rozas, C.; Picarte, C. Simulación Del Secado En Madera de Eucalyptus nitens Usando Modelos de Difusión Bajo Condiciones Unidimensionales e Isotérmicas. Sci. For. 2020, 48, e2957. [Google Scholar] [CrossRef]
  13. Siau, J. Wood: Influence of Moisture on Physical Properties; Department of Wood Science and Forest Products, Virginia Polytechnic Institute and State University: Blacksburg, VA, USA, 1995; 227p. [Google Scholar]
  14. Hrčka, R.; Babiak, M. Wood Thermal Properties. In Wood in Civil Engineering; IntechOpen: London, UK, 2017. [Google Scholar] [CrossRef]
  15. Zadin, V.; Kasemägi, H.; Valdna, V.; Vigonski, S.; Veske, M.; Aabloo, A. Application of Multiphysics and Multiscale Simulations to Optimize Industrial Wood Drying Kilns. Appl. Math. Comput. 2015, 267, 465–475. [Google Scholar] [CrossRef]
  16. Erriguible, A.; Bernada, P.; Couture, F.; Roques, M.A. Modeling of Heat and Mass Transfer at the Boundary between a Porous Medium and Its Surroundings. Dry. Technol. 2005, 23, 455–472. [Google Scholar] [CrossRef]
  17. Tremblay, C.; Cloutier, A.; Fortin, Y. Experimental Determination of the Convective Heat and Mass Transfer Coefficients for Wood Drying. Wood Sci. Technol. 2000, 34, 253–276. [Google Scholar] [CrossRef]
  18. Harris, D. An Investigation of Ambient Drying of Eucalyptus Grandis Wood. Master’s Thesis, University of Hawaii, Honolulu, HI, USA, 2016. [Google Scholar]
  19. Rozas, C.; Tomaselli, I.; Zanoelo, E.F. Internal Mass Transfer Coefficient during Drying of Softwood (Pinus elliottii Engelm.) Boards. Wood Sci. Technol. 2009, 43, 361–373. [Google Scholar] [CrossRef]
  20. Sarricolea, P.; Herrera-Ossandon, M.; Meseguer-Ruiz, Ó. Climatic Regionalisation of Continental Chile. J. Maps 2017, 13, 66–73. [Google Scholar] [CrossRef]
  21. NCh 176/1:2019; Madera—Parte 1: Determinación de Contenido de Humedad. Instituto Nacional de Normalización: Santiago, Chile, 2019.
  22. Vermaas, H.F. Drying Eucalypts for Quality: Material Characteristics, Pre-Drying Treatments, Drying Methods, Schedules and Optimisation of Drying Quality. S. Afr. For. J. 1995, 174, 41–49. [Google Scholar] [CrossRef]
  23. Jankowsky, I.; Dos Santos, G. Drying Behavior and Permeability of Eucalyptus Grandis Lumber. Maderas Cienc. Tecnol. 2005, 7, 17–25. [Google Scholar] [CrossRef]
  24. Welty, J.; Wicks, C.; Wilson, R.; Rorrer, G. Fundamentals of Momentum, Heat, and Mass Transfer; John Wiley & Sons, Inc.: Hoboken, NJ, USA, 2008; 729p. [Google Scholar]
  25. Nabhani, M.; Remblay, C.; Fortin, Y. Experimental Determination of Convective Heat and Mass Transfer Coefficients During Wood Drying. In Proceedings of the 8th International IUFRO Wood Drying Conference, Brasov, Romania, 24–29 August 2003; pp. 225–230. [Google Scholar]
  26. Pang, S. External Heat and Mass Transfer Coefficients for Kiln Drying of Timber. Dry. Technol. 1996, 14, 859–871. [Google Scholar] [CrossRef]
  27. Hukka, A. The Effective Diffusion Coefficient and Mass Transfer Coefficient of Nordic Softwoods as Calculated from Direct Drying Experiments. Holzforschung 1999, 53, 534–540. [Google Scholar] [CrossRef]
  28. Simpson, W.; Liu, J. Dependence of the Water Vapor Diffusion Coefficient of Aspen (Populus Spec.) on Moisture Content. Wood Sci. Technol. 1991, 26, 9–21. [Google Scholar] [CrossRef]
  29. Simpson, W.; Liu, J. An Optimization Technique to Determine Red Oak Surface and Internal Moisture Transfer Coefficients during Drying. Wood Fiber Sci. 1997, 29, 312–318. [Google Scholar]
  30. Daza-Gómez, M.; Gómez, C.; Gómez, J.; Ratkovich, N. 3D Computational Fluid Dynamics Analysis of a Convective Drying Chamber. Processes 2022, 10, 2721. [Google Scholar] [CrossRef]
  31. Maier, L.; Brosch, S.; Gaehr, M.; Linkhorst, J. Convective Drying of Porous Media: Comparison of Phase—Field Simulations with Microfluidic Experiments. Transp. Porous Media 2024, 151, 559–583. [Google Scholar] [CrossRef]
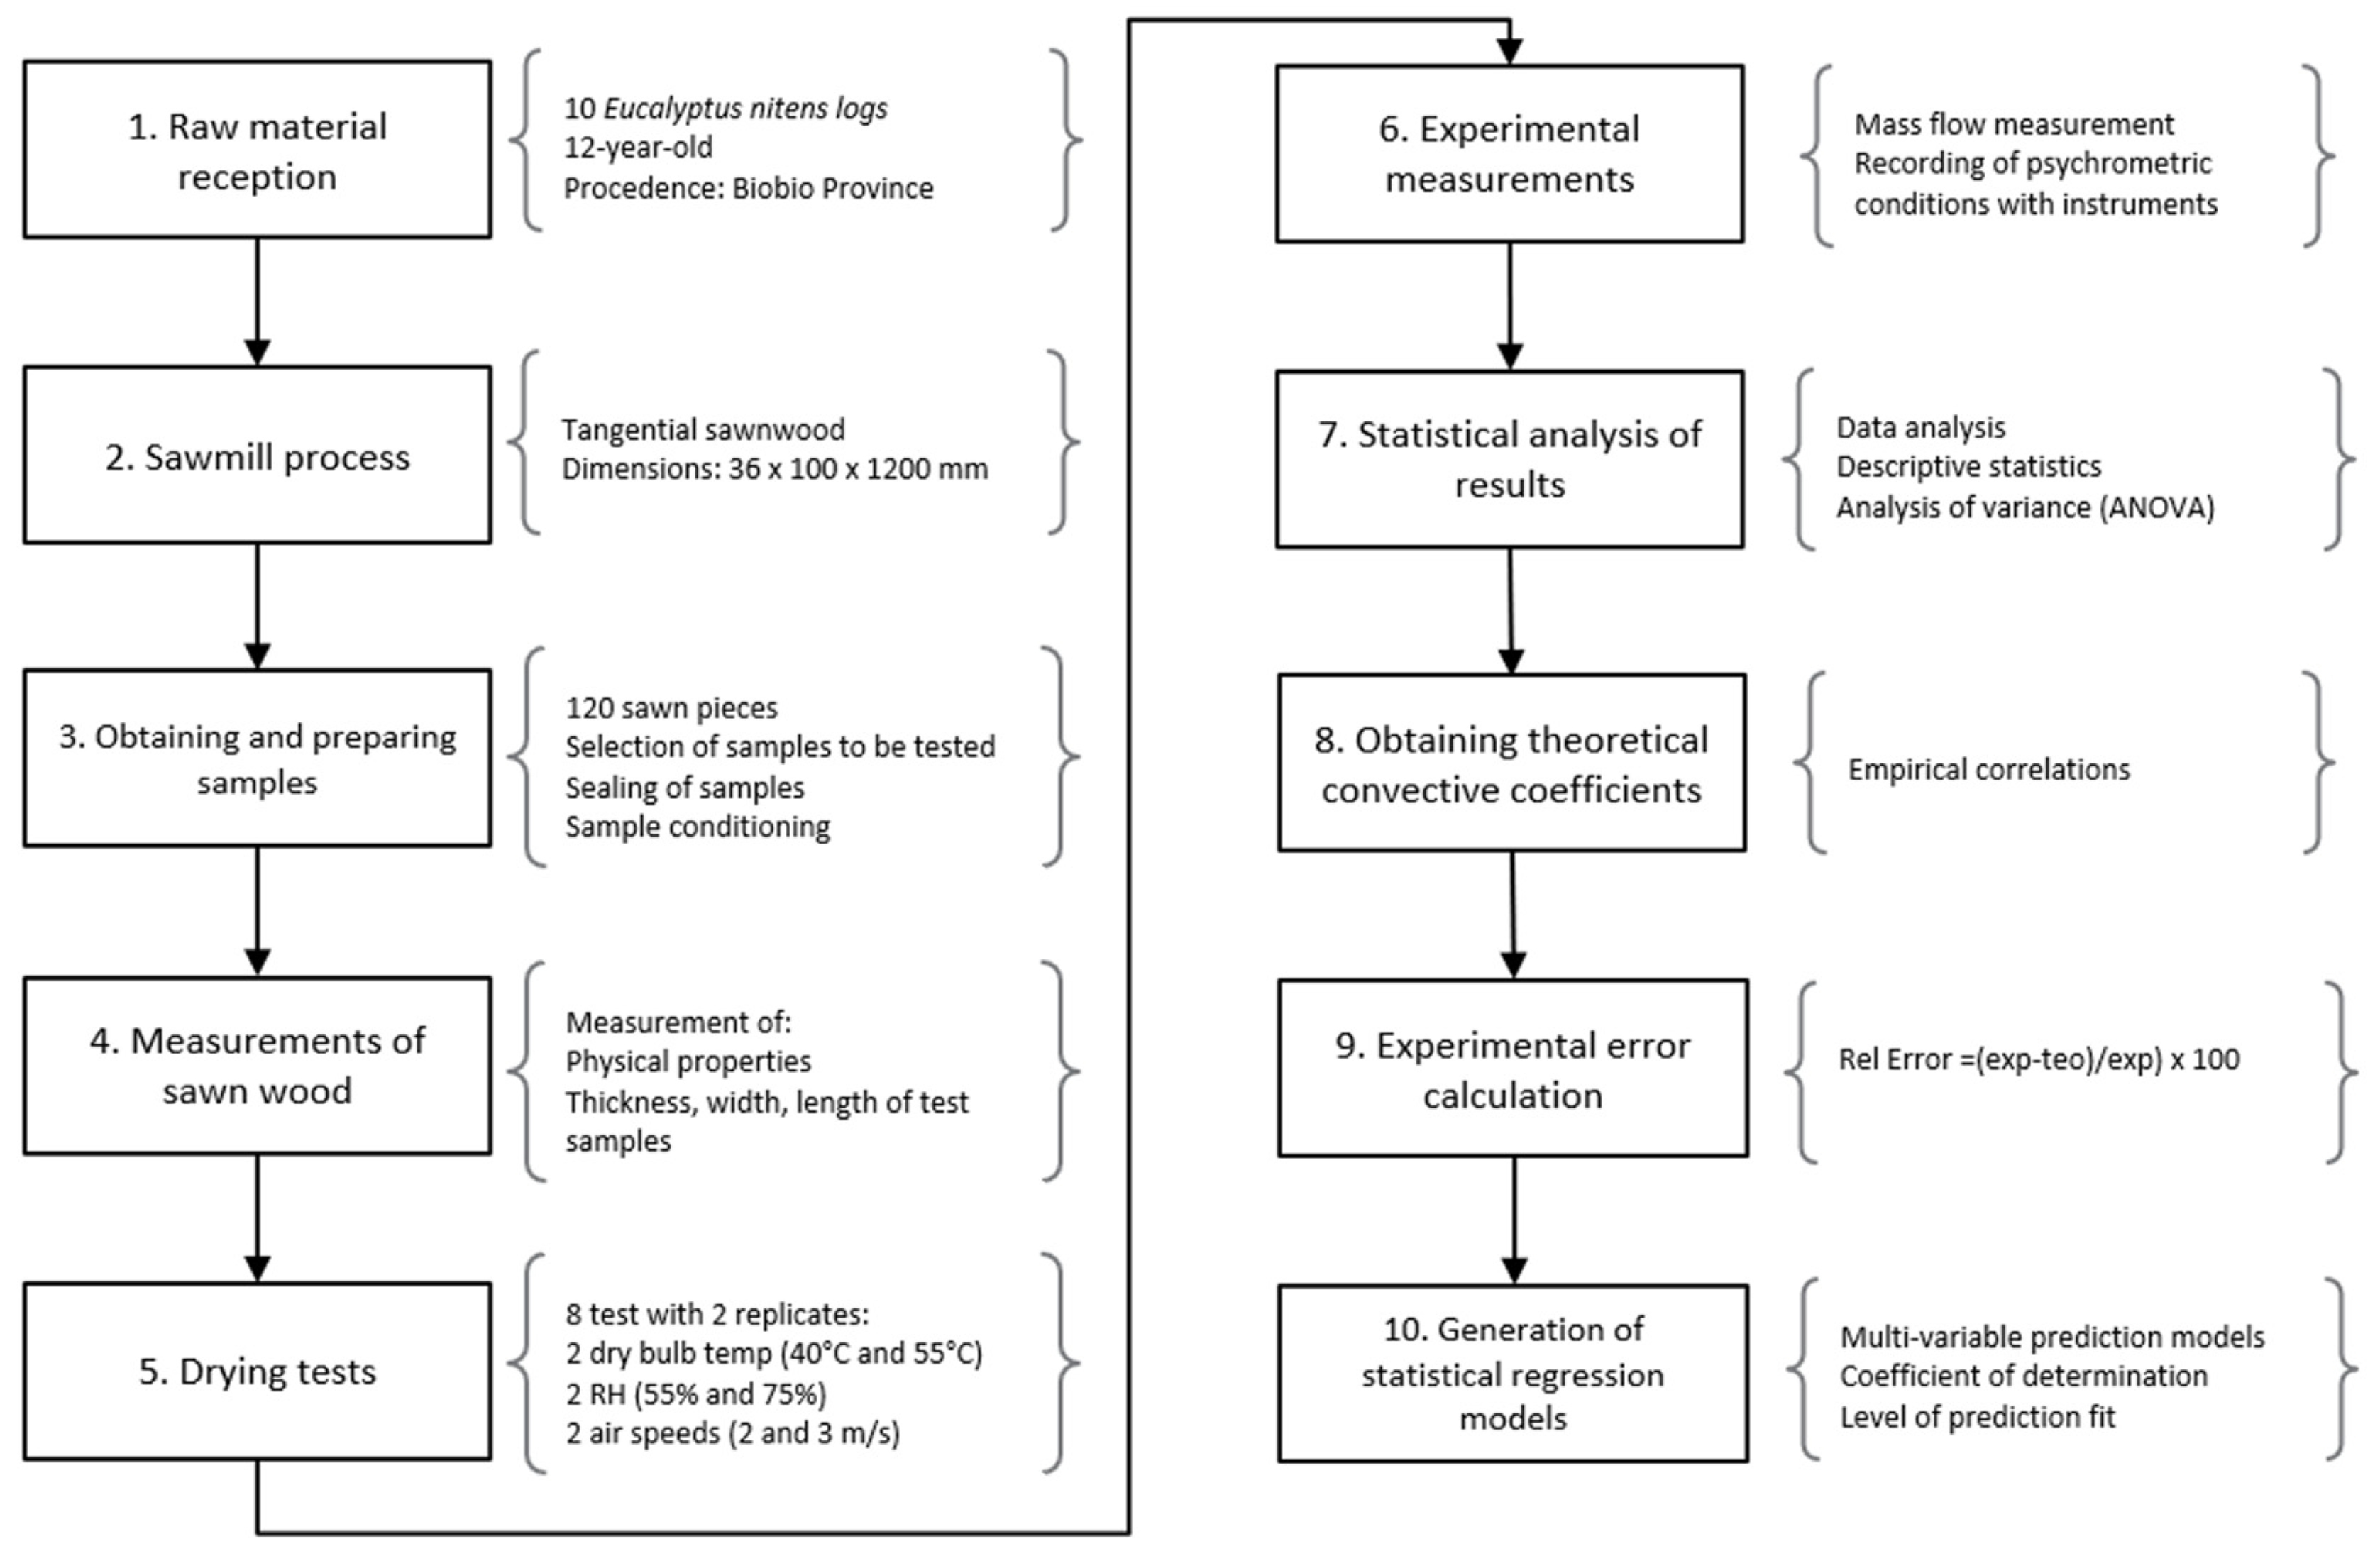
Figure 1. Steps for obtaining and validating convective heat and mass coefficients.
Forests 15 01287 g001
Figure 2. Measurement components of the dry kiln.
Forests 15 01287 g002
Figure 3. Dry and wet bulb temperatures measured during the experiments at dry bulb temperatures of 40 °C (A) and 55 °C (B).
Forests 15 01287 g003
Figure 4. Drying rate during each treatment at dry bulb temperatures of 40 °C (A) and 55 °C (B).
Forests 15 01287 g004
Table 1. Conditions of the drying process.
Dry Bulb
Temperature (Tdb)
(°C)
Relative
Humidity (RH)
(%)
Air
Velocity (Vair)
(m s−1)
55753
55553
55752
55552
40753
40553
40752
40552
Table 2. ANOVA and descriptive statistics for the convective heat transfer coefficients (hc).
Tdb
(°C)
RH
(%)
Vair
m s−1
nMean ** (±SD)
(W m−2·K−1)
CV
(%)
MinMaxICCEErel **
557533025.50 (4.28) A16.817.1529.1823.77–27.2216.5352.4 B
555533024.31 (2.2) AB9.119.7327.5323.42–25.1916.349.5 B
557523020.76 (3.36) B13.215.0727.7913.40–22.1511.9576.5 C
555523019.30 (4.56) B23.113.5626.8917.50–21.1011.7863.8 BC
407533014.31 (2.52) B17.79.618.7913.29–15.3216.8216.4 A
405533013.17 (1.79) B13.68.7415.6512.45–13.8916.7223.0 A
405523010.84 (0.89) C8.19.4112.7310.49–11.1912.0911.2 A
407523011.68 (0.97) C8.310.0113.5711.35–12.0212.158.5 A
Mean Erel37.66
ModelTdbHRVair
F:491.011170.9431.30175.47
p-value<0.001 *<0.001 *<0.001 *<0.001 *
* Significant at significance level of 5%, with F-test ** Mean values followed by the same letter are not significantly different according to Tukey’s HSD test at p ≤ 0.05. n: measurements per treatment. CV: coefficient of variation (%). IC: 95% confidence interval. CE: value derived from the empirical correlation. Erel: relative error between the empirical and experimental value (%).
Table 3. ANOVA and descriptive statistics for the convective mass transfer coefficients (km).
Tdb
(°C)
RH
(%)
Vair
m s−1
nMean ** (±SD)
(m s−1)
CV
(%)
MinMaxICCEErel **
55753220.0107 (0.0005) A4.30.00950.01140.0105–0.01090.016936.2 BC
55553260.0098 (0.0009) AB8.80.0080.01110.0094–0.01020.016841.8 AB
40753260.0094 (0.0017) B17.80.00620.01220.0087–0.01010.016542.9 AB
40553260.0091 (0.0012) B13.30.00610.01070.0086–0.00960.016548.4 A
55552260.0090 (0.0019) B21.40.00530.01250.0082–0.00980.012226.6 D
40752380.0080 (0.0011) C13.90.00620.01010.0077–0.00840.011932.7 CD
55752260.0076 (0.0013) C17.50.00560.01030.0071–0.00810.012237.0 ABC
40552260.0048 (0.0006) D7.70.00640.00890.0072–0.00770.011937.3 BC
Mean Erel37.86
ModelTdbHRVair
F241.2010.270.21424.09
p-value<0.001 *<0.001 *0.6535<0.001 *
* Significant at significance level of 5%, with F-test ** Mean values followed by the same letter are not significantly different according to Tukey’s HSD test at p ≤ 0.05. n: measurements per treatment. CV: coefficient of variation (%). IC: 95% confidence interval. CE: value derived from the empirical correlation. Erel: relative error between the empirical and experimental value (%).
Table 4. Model parameters γ k n i j = β 0 + β 1 × T b s j + β 2 × R H k + β 3 × V n + ε to determine the convective heat (hc) and mass (km) coefficients.
γijknParametersR2p-Value
−5β0β1β2β3
km17.41 × 10−52.50 × 10⁻⁵-236.50 × 10−50.74<0.001 *
hc−33.380.727610.514.0940.89<0.001 *
γ k n i j =  i-th convective coefficient obtained at the j-th dry bulb temperature, k-th relative humidity and n-th air velocity, Ɐi: 1, 2; hc = 1, km = 2. β 0 , β 1 , β 2 , β 3 = Model parameters. R2 = coefficient of determination. * = F test at 5% of probability.
Disclaimer/Publisher’s Note: The statements, opinions and data contained in all publications are solely those of the individual author(s) and contributor(s) and not of MDPI and/or the editor(s). MDPI and/or the editor(s) disclaim responsibility for any injury to people or property resulting from any ideas, methods, instructions or products referred to in the content.