Article

Predicting Potential Suitable Areas of Dendrocalamus brandisii under Global Climate Change

1
Research Institute of Bamboo and Rattan, Cluster Bamboo Engineering Technology Research Center, College of Forestry, Southwest Forestry University, Kunming 650224, China
2
Centre for Planetary Health and Food Security, School of Environment and Science, Griffith University, Nathan, Brisbane, QSD 4111, Australia
3
International Center for Bamboo and Rattan, Key Laboratory of National Forestry and Grassland Administration, Beijing 100102, China
*
Authors to whom correspondence should be addressed.
Forests 2024, 15(8), 1301; https://doi.org/10.3390/f15081301
Submission received: 20 May 2024 / Revised: 20 July 2024 / Accepted: 23 July 2024 / Published: 25 July 2024
(This article belongs to the Special Issue Ecological Research in Bamboo Forests)

Abstract

:
Climate change restricts and alters the distribution range of plant species. Predicting potential distribution and population dynamics is crucial to understanding species’ geographical distribution characteristics to harness their economic and ecological benefits. This study uses Dendrocalamus brandisii as the research subject, aiming to accurately reveal the impact of climate change on this plant. The findings offer important insights for developing practical conservation and utilization strategies, and guidance for future introduction and cultivation. The MaxEnt model was optimized using regularization multiplier (RM) and feature combination (FC) from the ‘Kuenm’ package in R language, coupled with ArcGIS for modeling 142 distribution points and 29 environmental factors of D. brandisii. This article explored the key environmental factors influencing the potential suitable regions for D. brandisii, and predicted trends in habitat changes under SSPs2.6 and SSPs8.5 climate scenarios for the current era, the 2050s, 2070s, and 2090s. (1) The results show that when FC = QPH and RM = 1, the AUC = 0.989, indicating that the model prediction is accurate with the lowest complexity and overfitting. The key environmental factors affecting its primary suitable distribution, determined by jackknife training gain and single-factor response curve, are the precipitation of warmest quarter (bio18), the temperature seasonality (bio4), the minimum average monthly radiation (uvb-4), and elevation (Elev), contributing 93.6% collectively. It was established that the optimal range for D. brandisii is precipitation of warmest quarter of between 657 and 999 mm, temperature seasonality from 351% to 442%, minimum average monthly radiation from 2420 to 2786 J/m2/day, at elevation from 1099 to 2217 m. (2) The current potential habitat distribution is somewhat fragmented, covering an area of 92.17 × 10⁴ km2, mainly located in southwest, south, and southeast China, central Nepal, southern Bhutan, eastern India, northwestern Myanmar, northern Laos, and northern Vietnam. (3) In future periods, under different climate scenario models, the potential habitat of D. brandisii will change in varying degrees to become more fragmented, with its distribution center generally shifting westward. The SSP8.5 scenario is not as favorable for the growth of D. brandisii as the SSPs2.6. Central Nepal, southern Bhutan, and the southeastern coastal areas of China have the potential to become another significant cultivation region for D. brandisii. The results provide a scientific basis for the planning of priority planting locations for potential introduction of D. brandisii in consideration of its cultivation ranges.

1. Introduction

Current uncontrolled human activities such as deforestation and increased greenhouse gas emissions have triggered a series of ecological imbalances affecting Earth’s complex climate dynamics [1]. Under current global climate change modelling, these multifaceted interactions pose a significant threat to plant life. Plants are the pillars of life on Earth, providing an essential resource for human welfare in the form of food, medicine, materials, and oxygen, while also responsible for maintaining soil and water resources, regulating the climate, and preserving biodiversity [2]. However, current climate change has restricted and altered the distribution range of many plants, resulting in numerous plant species migrating and adapting to more suitable regions [3]. This has directly impacted plant growth, reproduction, and adaptability [4], and the distribution range, diversity, and ecosystem function of these species. Climate change can increase the level of phenological changes, climatic extremes like droughts and floods, and the prevalence of pests and diseases, thereby increasing the number of plant deaths, and potential extinctions with total ecosystem disruption [5]. To protect these plant species effectively and promote their sustainable development, it is necessary to analyze and evaluate the changing trends in plant distribution patterns over different time periods. Therefore, studying the potential distribution range and historical population dynamics of species at different times helps us understand the impact of environmental changes on ecosystems and the adaptability of different species to these changes.
The increasing reliance on traditional forest materials has led to environmental degradation and timber shortages [6]. Bamboo is a plant that has a short growth cycle, is inexpensive to establish and maintain, and is currently grown in large commercial quantities across the world. Due to its natural composite material with superior physical and mechanical properties, it is considered a new type of ‘green material’ [7] and has numerous utilization prospects [8].
Dendrocalamus brandisii is a large Sympodial bamboo species in the subfamily Bambusoideae of the Poaceae family. Its culms are 15 to 20 m high, with diameters of 10 to 15 cm and internode lengths of 34 to 43 cm [9]. It is widely used in various industries, including agriculture and construction [10]. The yield of D. brandisii ranges from 4030 kg/hm2~13,689 kg/hm2, with an economic value ranging from 40,628 yuan/hm2~195,338 yuan/hm2 [11]. In addition to this, D. brandisii has significant medicinal value, with its leaves containing rich flavonoids [12]. More importantly, long-term cultivation of D. brandisii can alter soil environmental factors, thereby affecting the structure, diversity, and functional groups of soil bacterial communities. This indicates that D. brandisii plays a significant role in improving soil quality [13]. Currently, the distribution of D. brandisii is relatively narrow, mainly concentrated in Yunnan Province, China, and there have been a few successful introductions in Guangdong, Guangxi, Fujian, and other provinces [14,15]. Due to its short growth cycle, wide application of its culms, high nutritional value, and excellent ecological benefits, such as water conservation, soil and water conservation, and environmental beautification, it has become a superior bamboo species for shoot and timber development [16]. As the value of D. brandisii becomes more apparent and its development becomes more scaled, issues such as sporadic flowering, low seed-setting rate, scattered suitable areas, rapid decay, and population degradation have become more severe. Exploring suitable potential habitats is indispensable for its utilization and introduction for cultivation. To date, the majority of research on D. brandisii has mainly focused on its nutritional components, preservation technology, and bamboo forest cultivation [17,18,19,20]. The study of population dynamic changes and potential suitable regions for cultivation has been relatively minimal. Therefore, researching the potential distribution and population dynamic changes of D. brandisii and analyzing the key environmental factors that influence its geographical distribution have significant scientific and economic implications.
Most species suitability prediction models are based on niche theory and its concept of “ecological niche”, as first introduced by Joseph Grinnell in 1917. He defined the ecological niche as “the position of a species in a community in terms of its requirements and its relationships with other species” [21]. Species distribution models (SDM), also known as ecological niche models (ENM) or species habitat models, have been increasingly used in conjunction with the rise of ecological statistical models and Geographic Information Systems (GIS) technology [22]. These technological developments have assisted the prediction of species’ potential distributions and have been widely applied in research fields such as ecology, evolution, and resource conservation [23]. The MaxEnt model is a machine learning algorithm that uses the principle of maximum entropy to estimate species probability distribution based on presence data and environmental variables. The model assumes that the probability distribution should be as uniform as possible, constrained only by the available data. Compared with other ENM methods, MaxEnt has the advantage of dealing with presence-only data, complex interactions among environmental variables, and high prediction accuracy. It is currently one of the best-performing and most widely used ecological niche models (ENM), mainly used for predicting species distribution areas [24]. For example, correlational study found that climatic factors such as the precipitation of the driest month, annual average precipitation, and temperature annual range are key to the potential distribution of Cyclobalanopsis gilva in China [25]. Scientists used the MaxEnt model to simulate potential distribution of bamboo forests under future climate scenarios and concluded that precipitation and temperature are important climatic factors limiting the distribution of bamboo forests, which would greatly affect the potential distribution of bamboo forests in the future [26]. Under future climate scenarios, the distribution areas of Guadua inermis and Otatea acuminata, two bamboo species in Mexico, are predicted to decrease [27].
The geographical distribution range and change trends of species under different time periods and climate models are related to environmental factors, leading to certain differences in potential distribution areas. This study uses the MaxEnt model and ArcGIS software to investigate the potential distribution and population dynamic trends of D. brandisii in the current climate background (1970–2000) and future periods: the 2050s (2041–2060), 2070s (2061–2080), and 2090s (2081–2100). This research identifies key environmental factors that influence the distribution of D. brandisii and its potential distribution range. These findings related to the potential distribution and population dynamic trends, as key environmental factors influencing its geographical distribution, provide a reference basis for resource conservation and the introduction for cultivation.

2. Materials and Methods

2.1. Data Collection and Processing

The distribution data of D. brandisii required for this study were obtained from global biodiversity databases like GBIF (http://www.gbif.org (accessed on 8 May 2023)), China Virtual Herbarium (http://www.cvh.org.cn (accessed on 8 May 2023)), China’s Nature Reserve Biological Specimen Resource Sharing Platform (http://mnh.scu.edu.cn (accessed on 8 May 2023)), the national specimen resource sharing patform NSII (http://www.nsii.org.cn (accessed on 8 May 2023)), etc. These collated data were used alongside the collection of 619 distribution records based on field community surveys. The data were stored in CSV format in the form of species name, longitude, and latitude [28]. To avoid spatial autocorrelation caused by species distribution distance, a neighborhood analysis buffer zone was set for the distribution points. Only one point was retained within a range of 10 km × 10 km to enhance the sensitivity of D. brandisii distribution data, resulting in 142 effective D. brandisii distribution points (Figure 1a).

2.2. Acquisition and Selection of Environmental Data

This study chose 29 environmental factors for niche modeling. The climatic data include 19 bioclimatic variables (BIO1~BIO19) from the commonly used WorldClim database (http://www.worldclim.org (accessed on 8 May 2023)). These 19 bioclimatic variables can be divided into two main parts, temperature and precipitation, which include specific data layers such as annual average temperature, maximum and minimum temperature, average daily difference, and precipitation. The data for the current (1970–2000) and future (2050s, 2070s, 2090s) periods were downloaded with a resolution of 2.5 min (5 km × 5 km) [29]. Future data were selected under the sustainable development path (SSPs2.6) and conventional development path (SSPs8.5) of the shared socio-economic pathways (SSP) in the Coupled Model Intercomparison Project (CMIP6) of BCC-CSM2-MR [30]. The WorldClim database also includes global elevation data (ELE), which were converted to slope variables (SLOPE) using ArcGIS (10.8, Esri, Redlands, CA, USA) software. Additionally, four types of soil texture data (T-USDA-TEX, T-BS, T-OC, T-PH) were downloaded from the Food and Agriculture Organization of the United Nations (http://www.fao.org/soils-portal/en/ (accessed on 8 May 2023)). The properties of the upper soil layer (0–30 cm) are indicated by the attribute fields beginning with T [31]. Four radiation variables (uvb-1–4) were also downloaded from the Global Solar Radiation Database (https://www.ufz.de/gluv/ (accessed on 8 May 2023)) [32]. All environmental layer data were harmonized to a spatial resolution of 2.5 min (5 km × 5 km) to obtain consistent grid information of environmental factor data after resampling. However, collinearity exists between all environmental factors, which could lead to overfitting of the model and reduction in simulation accuracy [33]. Therefore, based on the contribution rate of model training environmental factors and Pearson correlation analysis in R (4.2.3, Ross Ihaka, Auckland, New Zealand), environmental factors with a correlation coefficient greater than 0.8 and a contribution rate of less than 1% were excluded (Figure 1b). Eventually, seven environmental factors with statistical and biological significance were selected for modeling (Table 1) [34].

2.3. Model Optimization

The ‘Kuenm’ package is used for parameter optimization of the MaxEnt model [35], using the regularization multiplier (RM) and feature combination (FC) to reduce model complexity and improve accuracy [36]. The RM parameter is set from 1 to 5, increasing by 0.5 each time, for a total of 9 adjustment frequencies [37]. FC includes Linear (L), Threshold (T), Quadratic (Q), Hinge (H), and Product (P), producing 31 combinations [38], for a total of 279 combinations. Based on statistical significance (partial ROC), omission rate (E = 5%), and the Akaike information criterion (AICc), models with an omission rate ≤ 5% and AICc ≤ 2 are chosen as the best models in this collection [39].

2.4. Model Construction and Accuracy Assessment

The MaxEnt (3.4.3, AMNH and AT&T-Research, Princeton, NJ, USA) model is used to predict the potential suitable areas for D. brandisii. The contemporary distribution data and the selected environmental layer data for D. brandisii are imported in CSV format. The model parameters are set using the cut method, with output in Logistic format with 25% of the distribution points selected as the test dataset, and 75% of the distribution points as the training dataset. The optimized RM combination and FC values are chosen, and the model run 10 times with other parameters set to MaxEnt default settings. The final output ASCII result file is the average of 10 runs [40]. The result file is imported into ArcGIS software and run with the reclassify command. The suitable areas are divided into four grades using the natural breakpoint classification method and actual distribution areas: unsuitable (p < 0.1), low suitability (0.1 ≤ p < 0.3), medium suitability (0.3 ≤ p < 0.5), and high suitability (≥0.5) [41]. The accuracy of the model is evaluated by the area under curve (AUC) value of the receiver operating characteristic curve (ROC), with values ranging from 0 to 1, where values closer to 1 indicate better prediction results [42].

2.5. Changes in Spatial Patterns and Centroid Shift of D. brandisii’s Suitable Areas

The distribution probability is divided into unsuitable and suitable areas based on 0.1 and assigned values of 0 and 1, respectively, to obtain a binary matrix of unsuitable/suitable. The areas where the distribution changes from non-existence to existence (0→1) are considered newly added distribution areas for D. brandisii, from existence to non-existence (1→0) are lost areas, and from existence to existence (1→1) are retained areas. The area and spatial pattern changes of D. brandisii’s newly added, retained, and lost areas can be obtained by calculating the area changes between the geographical distribution results under different scenarios at different times and the current distribution. Considering the suitable distribution area of D. brandisii as a whole and reducing it to a vector centroid, the shift in spatial distribution can be reflected by calculating the position of the geometric center of the suitable area at different times [43].

3. Results

3.1. Model Optimization Results and Accuracy Evaluation

Based on the cross-validation of species distribution points and environmental factor data with the regularization parameters and feature combinations in the ‘Kuenm’ package, the author obtained RM = 1, FC = QPH, and the minimum information criterion Delta. AICc = 0. The parameters RM = 1 and FC = QPH were selected for modeling. The area under the receiver operating characteristic curve (AUC) value after parameter optimization was 0.989 ± 0.006, which indicates that the model performance is good and the prediction results are accurate (Figure 2).

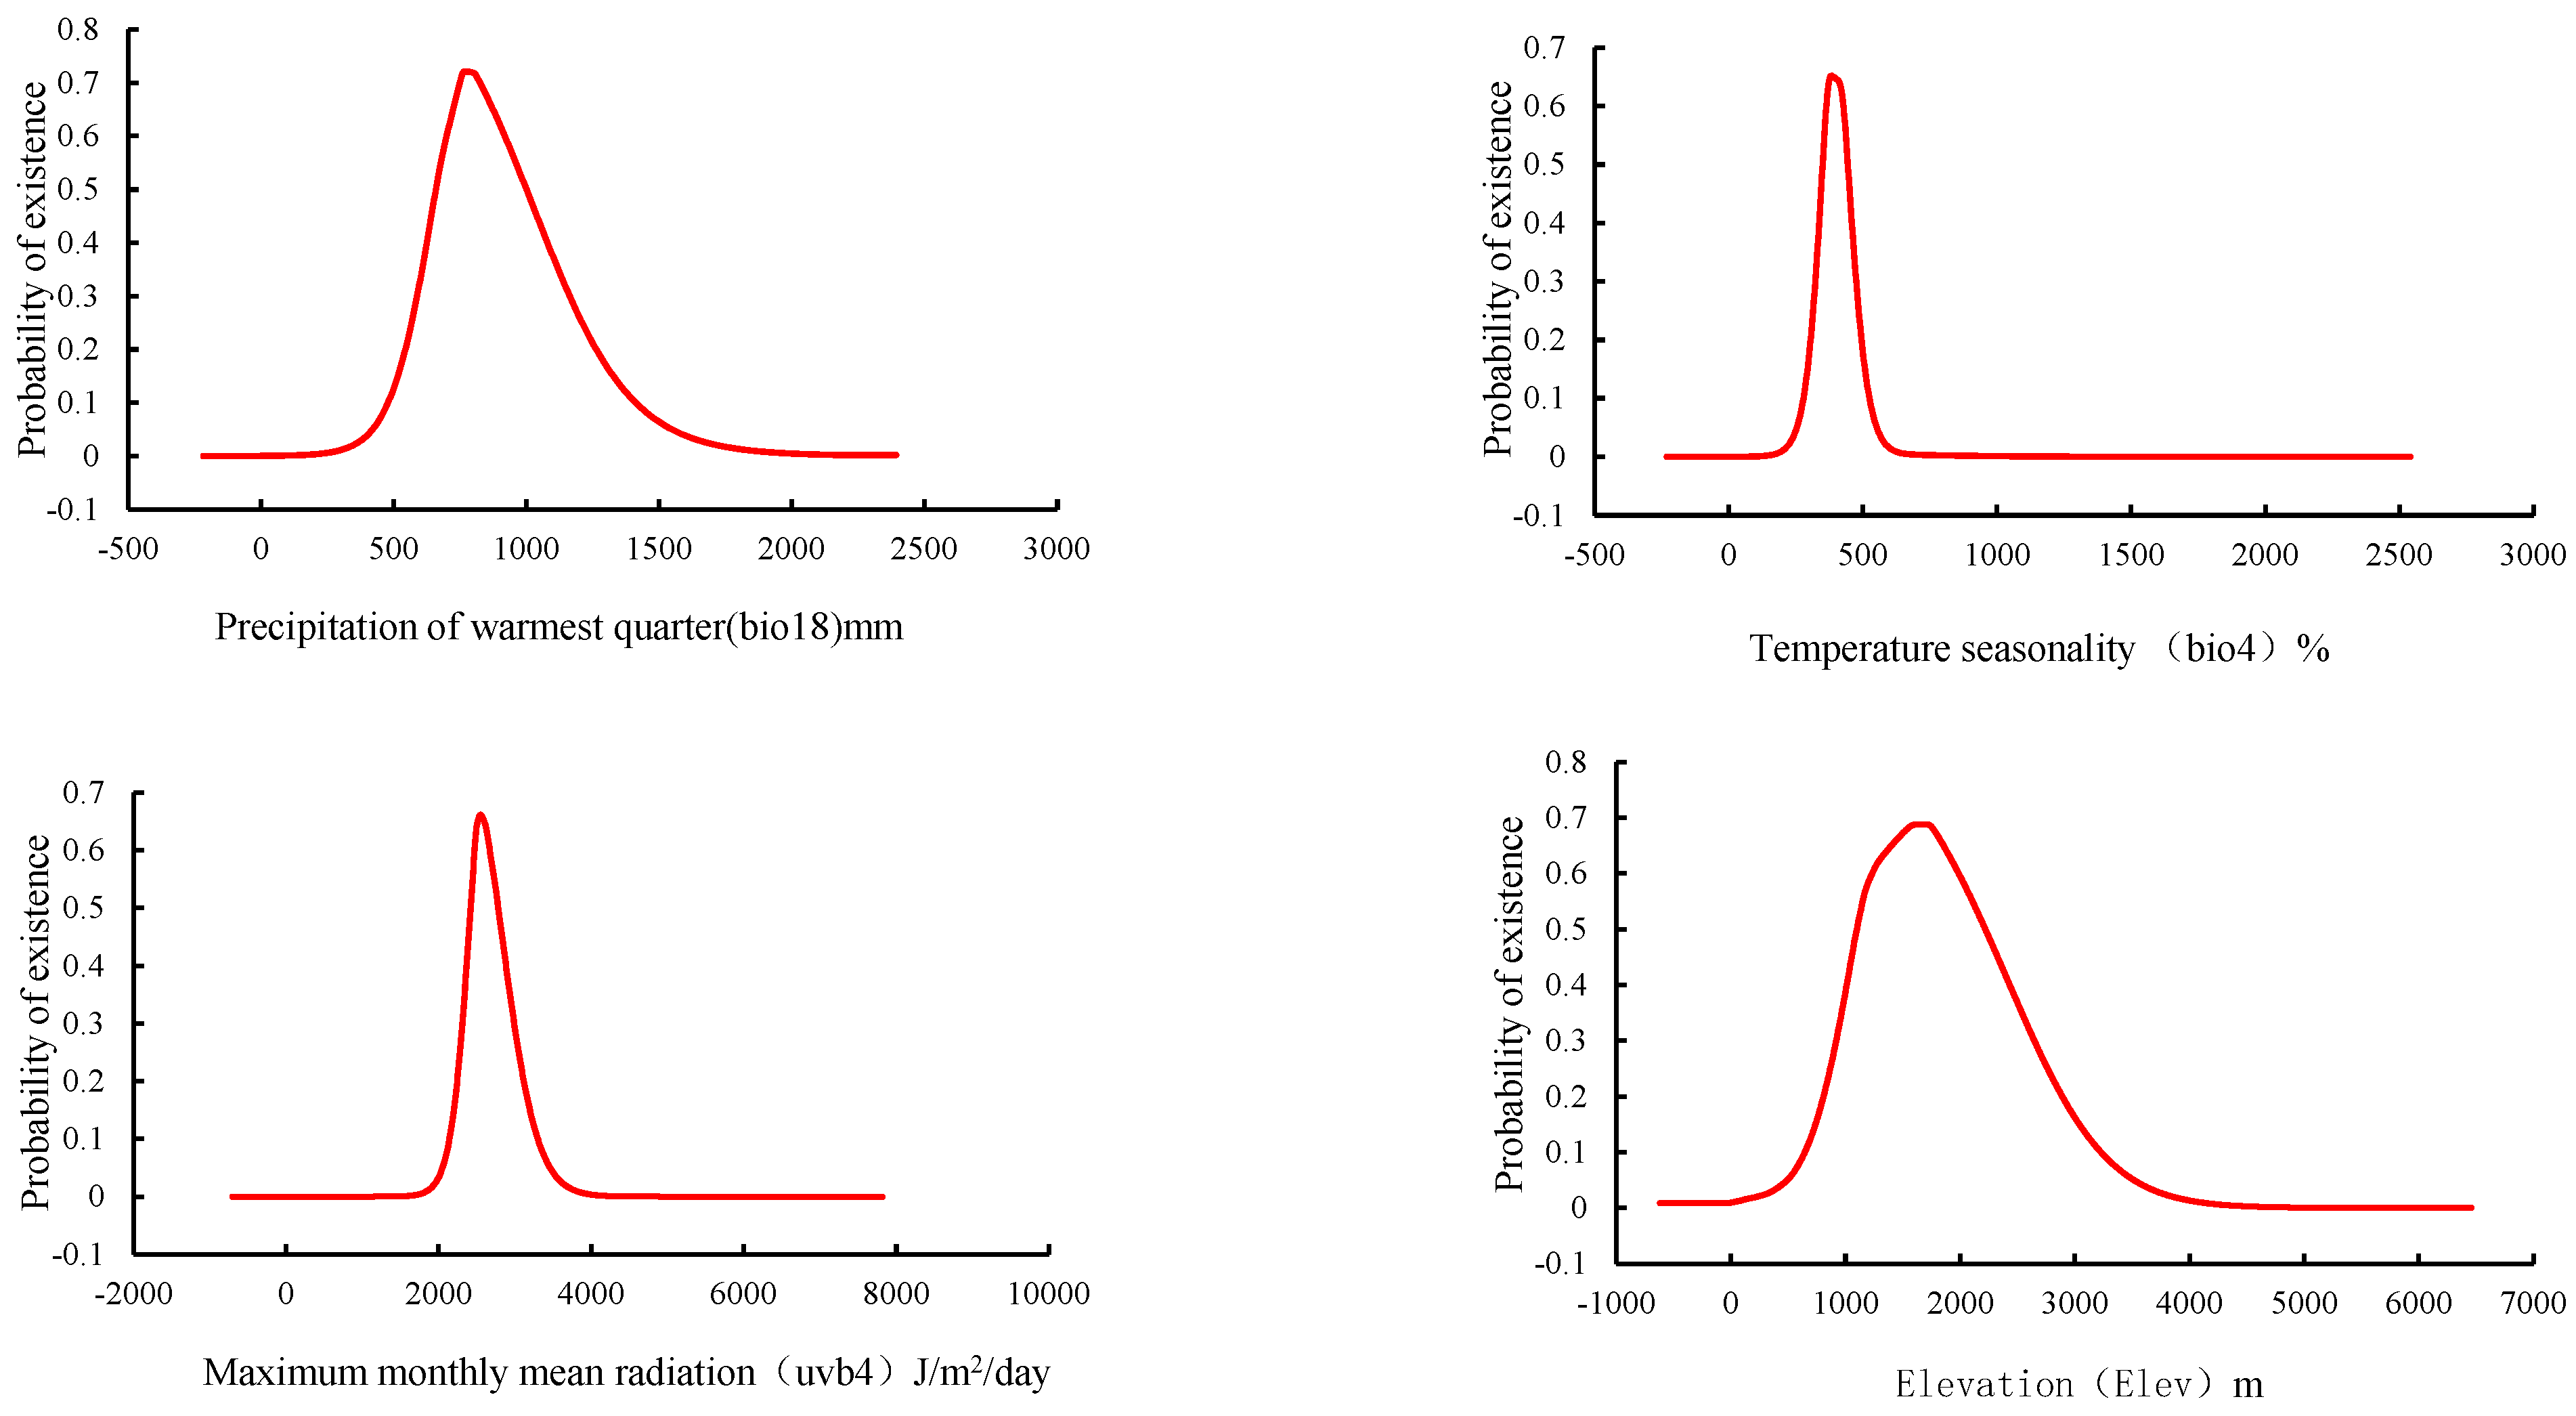
3.2. Key Factors Affecting the Potential Distribution of D. brandisii

The key environmental variables affecting D. brandisii’s geographical distribution are revealed through the analysis of the regularized training gain contribution, permutation importance, and single-factor response curves obtained by the jackknife method. As shown in Table 1 and Figure 3, the key environmental variables affecting the distribution of D. brandisii are the precipitation of the warmest quarter (bio-18), temperature seasonality (bio-4), minimum monthly mean radiation (uvb-4), and altitude (Elev). These four environmental variables have a cumulative contribution rate of 93.6% and a permutation importance of 96.6%.
The average values of the single-factor response curves for the dominant factor were exported by running them ten times (Figure 4). The single factor response curve represents a different model, that is, a model created using only the corresponding variable, reflecting the correlation of the predicted suitability to the selected variable. The existence threshold is usually set to 0.5, which can be regarded as the most suitable growth range for the species. As can be seen from the single-factor response curve, when the value of precipitation of the warmest quarter is less than 480 mm, D. brandisii basically does not exist. Its existence probability trend shows a single-peak curve that rises and then falls. When the value of precipitation of the warmest quarter is 775 mm, the probability of D. brandisii distribution reaches its peak. Therefore, the most suitable range of precipitation of warmest quarter for its distribution is 657–999 mm. Similar to the value of precipitation of the warmest quarter, the existence probability of D. brandisii increases with the rise of temperature seasonality, maximum monthly mean radiation, and elevation, and it starts to decrease after reaching a certain peak. The most suitable peaks are 384%, 2547 J/m2/day, and 1672 m, respectively, and the most suitable distribution ranges 351%–442%, 2420–2786 J/m2/day, and 1099–2217 m.

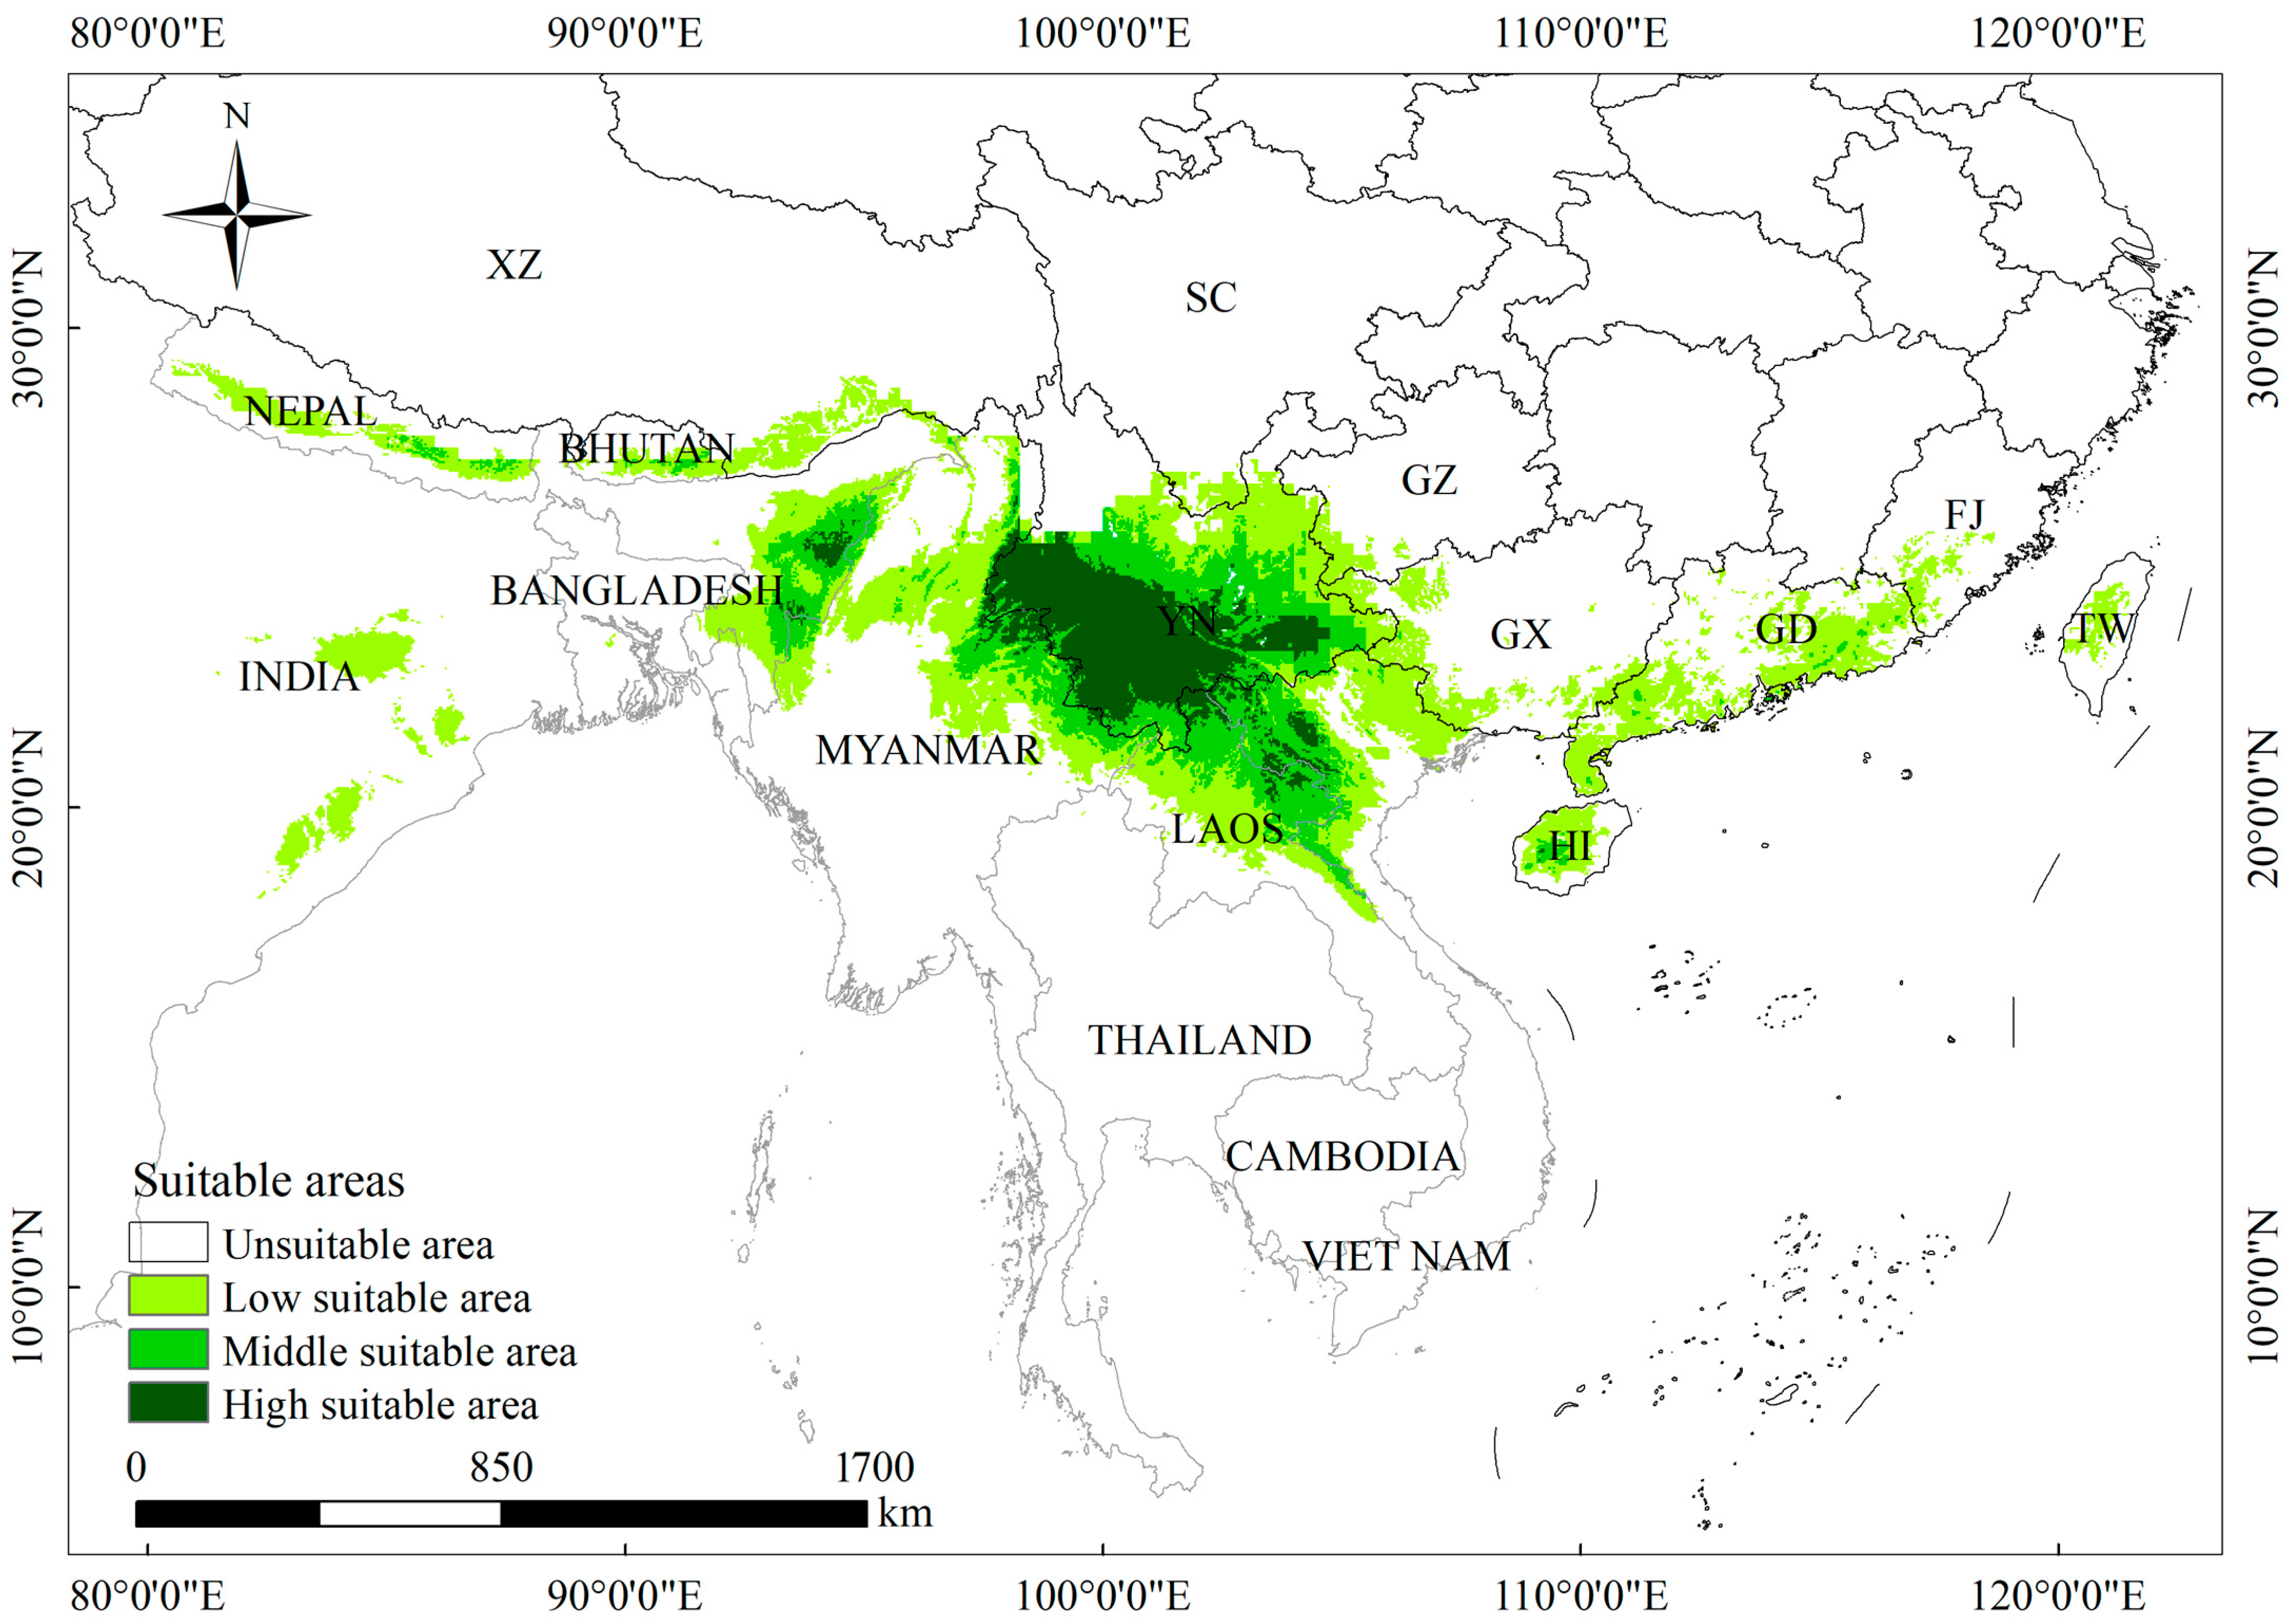
3.3. Current Climate Potential Distribution of D. brandisii

As seen in Figure 5, the potential suitable range for D. brandisii is 17°–30° N, 77°–122° E, which is largely located in the southwest, south, and southeast of China, central Nepal, southern Bhutan, eastern India, northwest Myanmar, northern Laos, and northern Vietnam. The total suitable habitat area is 92.17 × 10⁴ km2. Within the potential suitable range, China (47.88%), Myanmar (16.75%), India (11.82%), and Vietnam (10.02%) have the largest proportions. The low-suitability area is 55.90 × 10⁴ km2, accounting for 60.65% of the total suitable habitat area; the medium-suitability area is 21.16 × 10⁴ km2, accounting for 22.96% of the total suitable habitat area; and the high-suitability area is 15.11 × 10⁴ km2, accounting for 16.39% of the total suitable habitat area, mainly distributed in China (78.33%), Myanmar (7.14%), and Vietnam (6.78%). The current potential suitable area extends along longitude and latitude from the existing distribution records, and the range of extension with latitude is larger than that of longitude, resulting in a more fragmented distribution of potential distribution areas (Table 2).

3.4. Simulation of Future Potential Suitable Areas for D. brandisii

This study forecasts the potential distribution of D. brandisii in the 2050s (2041–2060), 2070s (2061–2080), and 2090s (2081–2100), selecting the sustainable development pathway (SSPs2.6) and business-as-usual development pathway (SSPs8.5) from shared socioeconomic pathways.
From Table 3 and Figure 6, it can be seen that the overall trend of D. brandisii distribution from the present to the future under a low greenhouse gas emission concentration (SSPs2.6) increases first, then decreases, and subsequently increases. Under a high greenhouse gas emission concentration (SSPs8.5), the distribution gradually diminishes. Specifically, under the SSPs2.6 scenario in the 2050s, the total suitable habitat area has increased by 11.84 × 10⁴ km2 compared to the present, and the highly suitable area has increased by 0.31 × 10⁴ km2. Under the SSPs8.5 scenario in the 2050s, the total suitable habitat area has increased by 5.21 × 10⁴ km2 compared to the present, although the highly suitable area has decreased by 1.46 × 10⁴ km2. In the 2070s SSPs2.6 scenario, the total suitable habitat area is 0.52 × 10⁴ km2 less than the present, and the highly suitable area has decreased by 2.23 × 10⁴ km2. Under the 2070s SSPs8.5 scenario, the total suitable area is 0.79 × 10⁴ km2 less than the present, and the highly suitable area has decreased by 0.24 × 10⁴ km2. Under both different emission scenarios in the 2070s, the total suitable area is slightly less than the present. In the 2090s SSPs2.6 scenario, the total suitable habitat area has increased by 5.27 × 10⁴ km2 compared to the present, and the highly suitable area has decreased by 0.45 × 10⁴ km2. In the 2090s SSPs8.5 scenario, the total suitable area is 2.17 × 10⁴ km2 less than the present, and the highly suitable area has increased by 0.89 × 10⁴ km2.
Overall, the suitable habitat area under a high-concentration scenario tends to decrease compared to the low-concentration scenario in the three future periods. The highly suitable areas are primarily situated in the Yunnan Province in China, along the border regions between China and Myanmar, Laos, and Vietnam, and along the border area between northeastern Laos and northwestern Vietnam. The medium- and low-suitability areas extend from these high-suitability areas. The projections indicate that in the 2050s, the overall distribution area is less fragmented than at present, but the distribution fragments again by the 2070s and 2090s.

3.5. Changes in the Spatial Pattern of D. brandisii’s Potential Suitable Habitat

When comparing the results from Table 4 and Figure 7 with the present, the growth rates under the low greenhouse gas emission concentration (SSPs2.6) and the high greenhouse gas emission concentration (SSPs8.5) in the 2050s (2041–2060) for the two shared socio-economic pathways are 17.90% and 18.11%, respectively. The retention rates for SSPs2.6 are 94.94% and 87.53% for SSPs8.5, with loss rates of 5.06% and 12.46%, respectively, indicating that the area of habitat loss gradually increases alongside rising greenhouse gas concentration. By the 2050s, the SSPs2.6 climate scenario is more advantageous for the development of D. brandisii than the SSPs8.5 scenario. In the 2070s (2061–2080), both scenarios show negative growth, with the SSPs2.6 rate at −0.56% and the SSPs8.5 rate at −0.86%. In the 2090s (2081–2100s), the newly expanded area shows a gradual decline trend with increasing greenhouse gas concentration; for the SSPs8.5 this new area is less than the loss area, with the newly added area being 9.54 × 10⁴ km2, the loss area being 11.71 × 10⁴ km2, and the change rate being −2.35%. These data show that the future potentially suitable area for D. brandisii has a negative growth state, with the loss area in the 2090s consistent with that in the 2050s. However, the loss area has extended, with potential suitable habitat loss beginning to appear in central India during this period.
Overall, it is worth noting that the loss area gradually moves to lower latitudes, and then moves to higher latitudes after the 2070s. According to the prediction of the model, the newly expanded planting regions are mainly concentrated in central-southern and eastern India, central Bangladesh, and northern Vietnam. The loss areas are largely concentrated in central Nepal, eastern India, northern and central-eastern Myanmar, central-eastern Laos, northern Vietnam, and coastal areas in southeastern China as well as some areas on the border between Yunnan and Sichuan provinces. This suggests that these regions may be sensitive areas for the future distribution of D. brandisii and should be given more attention.

3.6. Shift of Suitable Habitat Centroid

The geometrical center of the centroid of D. brandisii’s suitable habitat matrix was used to establish the centroid migration changes of suitable habitats for D. brandisii under different climatic backgrounds in the different periods (Table 5 and Figure 8). Through the migration of the centroid, it can be observed that in the SSPs2.6 climate scenario, the suitable habitat centroid moved westward by 10.31 km, 16.40 km, and 21.93 km, respectively. Under the condition of the SSPs8.5 scenario, the centroid first migrated 11.25 km and 19.20 km westward, then moved 5.64 km eastward. In the case of the 2090s SSP2.6 scenario, the centroid migration distance is the longest, while in the 2090s SSP8.5 scenario, the centroid moved the shortest distance.

4. Discussion

4.1. Evaluation of Prediction Results

The MaxEnt model is widely used in ecology and conservation biology, and achieving appropriate model complexity is crucial for obtaining better predictive accuracy [44]. Over-reliance on default settings can lead to model over-complexity and overfitting, which may reduce the transferability and accuracy of species distribution, causing niche shifts [45]. This necessitates the adjustment of parameters such as regularization multiplier and feature types to mitigate these issues. Calibrating the model and selecting the best parameters, after model optimization, results in a more rigorous model evaluation process, allowing the testing of different sets of environmental variables. Additionally, the uncertainty of future climate change needs to be comprehensively assessed through multiple scenario simulations. These measures will help improve the consistency and reliability of species distribution predictions across different temporal and spatial scales [46]. In this study, after optimizing the model parameters, RM = 1 and FC = QPH were selected as the optimal parameters. The model’s AUC value reached 0.989, indicating high accuracy.

4.2. Impact of Environmental Variables on the Habitability Zone of D. brandisii

Climate change has increasingly affected biodiversity and ecosystem functions, of which water availability and temperature stability are considered to be the major factors contributing to contemporary species diversity patterns [47]. This study, in conjunction with MaxEnt and ArcGIS, conducted a knife-cut training gain and correlation analysis of environmental factors. The results revealed that the key environmental factors affecting the distribution of D. brandisii are precipitation during the warmest season, temperature seasonality, minimum monthly average radiation, and altitude. Among these key environmental variables, the one with the highest gain when modelled individually was precipitation of warmest quarter (bio18). This factor has the most obvious impact on D. brandisii, with the optimal range of precipitation for D. brandisii distribution being 657~999 mm. When omitted, the environmental variable with the greatest reduction in gain is temperature seasonality (bio4), which contains more information than the other variables. In their simulation of the current and future distribution of giant bamboo, it was found that the distribution of the “straight type” giant bamboo is mainly influenced by temperature seasonality [48]. Research on the impact of environmental factors and climate change on the unique Chinese bamboo species, Iron Bamboo, highlighted that isothermality and precipitation of warmest quarter are the main factors affecting its distribution [49], which validates our research findings. Thus, it is apparent that variables related to precipitation and temperature play a dominant role in the distribution of D. brandisii. Secondary influencing factors, including the minimum monthly average radiation, altitude, and UV-B, have a significant impact on plant morphology and physiology, as well as the ability of plants to resist environmental stress [50]. However, little research has been done on the effects of UV-B on the growth of D. brandisii, indicating a knowledge gap and an opportunity for further research. As the extent of climate change corresponds with changes in altitude [51], the optimal altitude predicted in this study is between 1099 and 2217 m, which aligns with previous research [52]. Nonetheless, the distribution of D. brandisii is not only influenced by climate and soil, but also by factors such as reproduction methods, natural selection and genetic variation, and human interference. In future research, the above factors could be incorporated to develop a more accurate prediction model.

4.3. Spatial Distribution Pattern of the Potential Habitability Zone of D. brandisii

Since this simulation is based on the existing distribution records, with ambiguous, missing, and repeated coordinates removed, the predicted distribution could be biased due to incomplete resource distribution. The forecast shows that the potential main distribution areas of D. brandisii range from 17°–30° N to 77°–122° E, which are mainly concentrated in southwestern, southern, and southeastern China, central Nepal, southern Bhutan, eastern India, northwestern Myanmar, northern Laos, and northern Vietnam. This generally corresponds to Hui et al.’s [53] illustration of D. brandisii’s main distribution, stretching from the tropical northern edge (seasonal rainforest and semi-evergreen seasonal rainforest laterite zone in southern Yunnan) to the subtropical southern region (subtropical southern monsoon evergreen broadleaf forest laterite zone on the Yunnan plateau), and even extending northward to subtropical northern regions (semi-humid evergreen broadleaf forest laterite zone in the subtropical northern Yunnan plateau) and other low-altitude areas. The only difference observed in this study is that in addition to the actual found distribution points, the suitable regions also include areas like the Yarlung Zangbo River canyon in Motuo County, Tibet, and the central and southern parts of the Himalayas in Nepal and Bhutan. This could be because Motuo County has a vast altitudinal difference, the most comprehensive vertical mountain climate zone spectrum in China, possessing a tropical, subtropical, and other three-dimensional climates, enabling the growth of plants from alpine cold zones to tropical zones [54]. The Himalayan barrier aids in forming a stable microclimate, which provides suitable growth conditions for D. brandisii [55]. Meanwhile, related scholars have discovered Dendrocalamus hamiltonii in Bhutan, which shares similar living habits with D. brandisii [56]. It was also found that the core distribution area of D. brandisii is primarily located in the Lancang River basin in China, the downstream area of the Li Xian River, and the Mekong River basin. This is likely because D. brandisii is a thermophilic large clumping bamboo, and these river valley regions are more abundant in temperature and precipitation, exhibiting clear latitudinal zonality on a large scale [57]. Alongside the influence of factors like isothermality and temperature seasonality, the potential distribution areas of D. brandisii are more concentrated in these regions. The contemporary potential suitable area for D. brandisii is rather fragmented, which is similar to the previous research results [58]. This condition may be attributed to global temperature changes, fluctuations between warmth and coldness, and severe impacts on the ecosystem, intensifying habitat fragmentation. Under different climate scenarios in the 2050s, the potential habitable area for D. brandisii shows an increasing trend. However, in the 2070s, the potential habitable area for D. brandisii decreases compared with the contemporary scenario. Under the SSPs8.5 scenario, the potential habitable area gradually decreases over time, which is consistent with the results of the previous study that indicated a reduction in species distribution range under conventional development scenarios [59]. As the concentration of greenhouse gases increases over time, leading to a warmer and more humid climate, this provides plants with a longer growing period [60] and could result in an expansion of the potential habitable range for D. brandisii compared to the present. However, excessively high emission concentrations could negatively impact plant growth, potentially resulting in a reduction of their distribution area or even leading to extinction [61]. The impact of climate change on plants could be viewed as a long-term process. The slow increase in greenhouse gas concentration over a short period of time might not cause significant changes in the potential habitable area for plants, because plants have certain self-regulation and expansion capabilities [62]. We also speculate that there might be a threshold of greenhouse gas concentration affecting the distribution of D. brandisii. When the concentration exceeds this threshold, it could cause significant changes in the potential habitable area for D. brandisii, namely, the reduction of suitable areas and the expansion of unsuitable areas [63]. This is why the potential habitable area for D. brandisii begins to shrink with the passage of time and the increase in greenhouse gas concentration in the 2070s (Figure 8).

4.4. Conservation and Cultivation of D. brandisii

Based on the predictive model of this study, a hot and humid environment is conducive to the growth of D. brandisii. However, the current ability for humans to regulate and control the climate is somewhat limited. Considering the sporadic flowering, low fruiting rate, and rapid decline of D. brandisii, it is imperative to develop conservation strategies and promote its cultivation. Comparing the current and future distribution of D. brandisii, it is relatively stable in Yunnan Province, China. For introduction and cultivation, Yunnan can serve as a core region, extending outward for cultivation, with central Nepal, southern Bhutan, and the southeastern coastal region of China identified as potential cultivation areas. This would expand the cultivation area of D. brandisii and better exploit its economic value.

5. Conclusions

This study optimized the MaxEnt model using the ‘Kuenm’ package, modeling for the first time the habitat suitability and spatial distribution pattern of D. brandisii under six different future scenarios. The findings indicate that:
The potential suitable area for D. brandisii under the current climate is 92.17 × 10⁴ km2. The potential suitable range is 17°–30° N, 77°–122° E, mainly concentrated in southwestern, southern, and southeastern China, central Nepal, southern Bhutan, eastern India, northwestern Myanmar, northern Laos, and northern Vietnam.
The key environmental factors influencing the potential distribution of D. brandisii are precipitation in the warmest season, temperature seasonality, minimum monthly average radiation, and altitude. The best survival probability for D. brandisii appears when precipitation of warmest quarter is 657~999 mm, temperature seasonality range is 351%–442%, minimum monthly average radiation range is 2420–2786 J/m2/day, and Elev is 1099–2217 m. Moreover, precipitation of warmest quarter is the most significant environmental factor affecting D. brandisii’s distribution.
The potential suitable area distribution is fragmented at present. Overall, under different future climate scenario models, the potential suitable area of D. brandisii increases to a certain extent in the 2050s. However, after the 2050s, under the high greenhouse gas emission concentration (SSPs8.5) scenario, this gradually decreases. This indicates that these conditions are not conducive to the growth of D. brandisii from a sustainable utilization and development point of view. The centroid analysis shows a general westward shift of the distribution centroid, with the future centroid of D. brandisii distribution still located in low-latitude areas.
With time, the potential suitable area for this species may also vary with climate change. Therefore, it is urgent to propose D. brandisii germplasm protection at the molecular level, such as the genome and proteome, as a mitigation tool against the impact of current climate change on its habitat. Considering the reduction of other human interference and control of some greenhouse gas emissions, the future climate of moderate warming and increased humidity could provide a conducive environment for D. brandisii, increasing its potential suitable area of habitation and exploitation of its economic and ecological benefits.

Author Contributions

Conceptualization, H.T. and W.L.; methodology, L.G.; software, H.T.; validation, H.T. and W.L.; formal analysis, H.T.; investigation, H.T.; resources, G.L.; data curation, H.T.; writing—original draft preparation, H.T.; writing—review and editing, K.K., Z.X. and S.H.B.; visualization, L.G.; supervision, C.H. and W.L.; project administration, W.L.; funding acquisition, W.L. All authors have read and agreed to the published version of the manuscript.

Funding

This study was funded by the National Key R&D Program of China (2023YFD220120102), the Basic Research Special Project of Yunnan Province (202201AT070053), the Joint Special Project of Yunnan Province Agriculture (202301BD070001-123), and the Monitoring Fund of “Dian Nan Bamboo Forest Ecosystem Positioning Observation Research Station” (2022-YN-15). It was also supported by the Bamboo and Rattan Research Institute of Southwest Forestry University.

Data Availability Statement

All of the data in this paper were downloaded from the publicly accessible websites cited in the main text. The species occurrence data are available on request from the corresponding author.

Conflicts of Interest

The authors declare that they have no known competing financial interests or personal relationships that could affect the work reported here.

References

  1. Menezes-Silva, P.E.; Loram-Lourenço, L.; Alves, R.D.F.B.; Sousa, L.F.; da Silva Almeida, S.E.; Farnese, F.S. Different ways to die in a changing world: Consequences of climate change for tree species performance and survival through an ecophysiological perspective. Ecol. Evol. 2019, 9, 11979–11999. [Google Scholar] [CrossRef] [PubMed]
  2. Díaz, S.M.; Settele, J.; Brondízio, E.; Ngo, H.; Guèze, M.; Agard, J.; Arneth, A.; Balvanera, P.; Brauman, K.; Butchart, S.; et al. (Eds.) The Global Assessment Report on Biodiversity and Ecosystem Services: Summary for Policy Makers; IPBES Secretariat: Bonn, Germany, 2019. [Google Scholar] [CrossRef]
  3. Parmesan, C.; Yohe, G. A globally coherent fingerprint of climate change impacts across natural systems. Nature 2003, 421, 37–42. [Google Scholar] [CrossRef] [PubMed]
  4. Xu, W.-B.; Svenning, J.-C.; Chen, G.-K.; Zhang, M.-G.; Huang, J.-H.; Chen, B.; Ordonez, A.; Ma, K.-P. Human activities have opposing effects on distributions of narrow-ranged and widespread plant species in China. Proc. Natl. Acad. Sci. USA 2019, 116, 26674–26681. [Google Scholar] [CrossRef] [PubMed]
  5. Allen, C.D.; Macalady, A.K.; Chenchouni, H.; Bachelet, D.; McDowell, N.; Vennetier, M.; Kitzberger, T.; Rigling, A.; Breshears, D.D.; Hogg, E.H.; et al. A global overview of drought and heat-induced tree mortality reveals emerging climate change risks for forests. For. Ecol. Manag. 2010, 259, 660–684. [Google Scholar] [CrossRef]
  6. Yadav, M.; Mathur, A. Bamboo as a sustainable material in the construction industry: An overview. Mater. Today Proc. 2021, 43, 2872–2876. [Google Scholar] [CrossRef]
  7. Gupta, A.; Kumar, A. Potential of bamboo in sustainable development. Asia Pac. Bus. Rev. 2008, 4, 100–107. [Google Scholar] [CrossRef]
  8. Sawarkar, A.D.; Shrimankar, D.D.; Kumar, A.; Kumar, A.; Singh, E.; Singh, L.; Kumar, S.; Kumar, R. Commercial clustering of sustainable bamboo species in India. Ind. Crops Prod. 2020, 154, 112693. [Google Scholar] [CrossRef]
  9. Zhang, W.J.; Liu, W.Y.; Zhu, L.Y.; Tu, D.D.; Zhu, S.H.; Zhao, X.T.; Hui, C.M. Effects of Different Cultivation Modes of Dendrocalamus brandisii. World Bamboo Ratt. 2022, 20, 36–42. [Google Scholar]
  10. Wang, Y.; Zhan, H.; Ding, Y.; Wang, S.; Lin, S. Variability of anatomical and chemical properties with age and height in Dendrocalamus brandisii. BioResources 2016, 11, 1202–1213. [Google Scholar] [CrossRef]
  11. Liu, W.Y.; Hui, C.M.; Zou, X.M.; Wang, Y. Effects of Soil Temperature and Water Content on the Early Germination and Yield Improvement of Dendrocalamus brandisii Bamboo Shoots. J. Bamboo Res. 2019, 38, 39–48. [Google Scholar] [CrossRef]
  12. Hua, M.; Chen, J.; Bi, W.; Kong, J.J.; Hu, Y.L.; LI, Y.Q.; Yang, Y.M.; Wang, J. Determination of Total Flavonoids and Vitexin, Isovitexin, Orientin, Isoorientin in Cluster Bamboo by High-performance Liquid Chromatography. J. West China For. Sci. 2018, 47, 86–90. [Google Scholar] [CrossRef]
  13. Zhu, S.H.; Zhao, X.T.; Hui, C.M.; Zhang, Z.F.; Zhang, R.L.; Su, W.H.; Liu, W.Y. Effects of different planting durations of Dendrocalamus brandisii on the soil bacterial community. J. Soils Sediments 2023, 23, 3891–3902. [Google Scholar] [CrossRef]
  14. Meng, L.Y.; Huang, X.F.; Huang, D.Y.; Tang, W.; Pan, Y.G.; Deng, L.M.; Yu, H.L.; Wei, Y.N. The bamboo shoot yield and correlation analysis of six large clustered bamboos after afforestation. J. Cent. South Univ. For. Technol. 2022, 42, 46–54. [Google Scholar] [CrossRef]
  15. Zheng, S.Q. Research on Introduction and Planting Technology for Dendrocalamus brandisii. World Bamboo Ratt. 2016, 14, 18–21. [Google Scholar] [CrossRef]
  16. Zhao, X.T.; Hui, C.M.; Zhu, S.H.; Liu, W.Y.; Cai, C.L.; Zhang, W.J.; Tu, D.D.; Zhu, L.Y. Response of Soil Organic Matter Content and Its Infrared Spectral Characteristics to Different Planting Durations of Dendrocalamus brandisii. Acta Agric. Univ. Jiangxiensis 2022, 44, 1448–1456. [Google Scholar] [CrossRef]
  17. Huang, L.; Chu, C.H.; Deng, L.; Zhan, H.; Wang, S.G. Leaf Anatomy and Photosynthetic Characteristics in Dendrocalamus brandisii Seedlings under Different Cultivations. J. West China For. Sci. 2020, 49, 68–74. [Google Scholar] [CrossRef]
  18. Pei, J.L.; Li, P.C.; Wang, Q.; Wang, S.G. Comparison of Bamboo Shoot Nutrients of Dendrocalamus brandisii among Different Provenances. J. Northwest For. Univ. 2018, 33, 156–161. [Google Scholar] [CrossRef]
  19. Yufan, D.; Qin, L.; Yihe, Z.; Jianxin, C. Effects of ultrasonic assisted high-temperature cooking method on the physicochemical structure characteristics and in vitro antioxidant capacities of dietary fiber from Dendrocalamus brandisii Munro shoots. Ultrason. Sonochem. 2023, 97, 106462. [Google Scholar] [CrossRef]
  20. Zhang, X.F.; Zhao, Y.H.; Li, Q. Effects of Three Biological Preservatives on the Lignification of Postharvest Dendrocalamus brandisii Bamboo Shoots. J. West China For. Sci. 2022, 51, 43–49. [Google Scholar] [CrossRef]
  21. Zhang, H.J.; Chen, Y.; Huang, J.L.; Lie, H.W. Predicting potential geographic distribution of Mikania micrantha planting based on ecological niche models in China. Trans. Chin. Soc. Agric. Eng. 2011, 27, 413–418. [Google Scholar]
  22. Elith, J.; Leathwick, J.R. Species distribution models: Ecological explanation and prediction across space and time. Annu. Rev. Ecol. Evol. Syst. 2009, 40, 677–697. [Google Scholar] [CrossRef]
  23. Xu, J.; Cao, B.; Bai, C.K. Prediction of potential suitable distribution of endangered plant Kingdonia uniflora in China with MaxEnt. Chin. J. Ecol. 2015, 34, 3354–3359. [Google Scholar] [CrossRef]
  24. Warren, D.L.; Seifert, S.N. Ecological niche modeling in Maxent: The importance of model complexity and the performance of model selection criteria. Ecol. Appl. 2011, 21, 335–342. [Google Scholar] [CrossRef] [PubMed]
  25. Ouyang, Z.Y.; Li, Z.H.; Ouyang, S.L.; Cheng, Y.; Zhou, Z.C.; Wu, J.Y. Prediction of the potential distribution of Cyclobalanopsis gilva in China based on the Maxent and ArcGIS model. J. Cent. South Univ. For. Technol. 2023, 43, 19–26. [Google Scholar] [CrossRef]
  26. Li, X.; Mao, F.; Du, H.; Zhou, G.; Xing, L.; Liu, T.; Han, N.; Liu, Y.; Zheng, J.; Dong, L. Spatiotemporal evolution and impacts of climate change on bamboo distribution in China. J. Environ. Manag. 2019, 248, 109265. [Google Scholar] [CrossRef] [PubMed]
  27. Ruiz-Sanchez, E.; Mendoza-Gonzalez, G.; Rojas-Soto, O. Mexican priority bamboo species under scenarios of climate change. Bot. Sci. 2018, 96, 11–23. [Google Scholar] [CrossRef]
  28. Song, H.F.; Dang, X.H.; Gao, Y.; Meng, Z.J.; Sun, Y.L. Potential Distribution of Pinus sylvestris in Inner Mongolia Autonomous Region Based on MaxEnt Model. J. Sichuan Agric. Univ. 2023, 41, 203–208. [Google Scholar] [CrossRef]
  29. Shi, X.; Wang, J.; Zhang, L.; Chen, S.; Zhao, A.; Ning, X.; Fan, G.; Wu, N.; Zhang, L.; Wang, Z. Prediction of the potentially suitable areas of Litsea cubeba in China based on future climate change using the optimized MaxEnt model. Ecol. Indic. 2023, 148, 110093. [Google Scholar] [CrossRef]
  30. Zhou, T.J.; Zou, L.W.; Chen, X.L. Commentary on the Coupled Model Intercomparison Project Phase 6 (CMIP6). Clim. Change Res. 2019, 15, 445–456. [Google Scholar] [CrossRef]
  31. Liu, J.Q.; Wei, G.K.; Shi, C.Q.; Zhao, T.N.; Qian, Y.K. Suitable distribution area of drought-resistant afforestation tree species in north China based on MaxEnt model. J. Beijing For. Univ. 2022, 44, 63–77. [Google Scholar] [CrossRef]
  32. Beckmann, M.; Václavík, T.; Manceur, A.M.; Šprtová, L.; von Wehrden, H.; Welk, E.; Cord, A.F. glUV: A global UV-B radiation data set for macroecological studies. Methods Ecol. Evol. 2014, 5, 372–383. [Google Scholar] [CrossRef]
  33. Chen, H.J.; Nie, Y.; Liu, X.H.; Liu, B.; Zhang, H. Research on prediction of potential suitable areas of Populus euphratica based on MaxEnt model. China Agric. Inform. 2021, 33, 46–55. [Google Scholar] [CrossRef]
  34. Ranjitkar, S.; Xu, J.; Shrestha, K.K.; Kindt, R. Ensemble forecast of climate suitability for the Trans-Himalayan Nyctaginaceae species. Ecol. Model. 2014, 282, 18–24. [Google Scholar] [CrossRef]
  35. Cobos, M.E.; Peterson, A.T.; Barve, N.; Osorio-Olvera, L. kuenm: An R package for detailed development of ecological niche models using Maxent. PeerJ 2019, 7, e6281. [Google Scholar] [CrossRef] [PubMed]
  36. Ye, X.Z.; Zhang, M.Z.; Lai, W.F.; Yang, M.M.; Fan, H.H.; Zhang, G.F.; Chen, S.P.; Liu, B. Prediction of potential suitable distribution of Phoebe bournei based on MaxEnt optimization model. Acta Ecol. Sin. 2021, 41, 8135–8144. [Google Scholar] [CrossRef]
  37. Kong, W.Y.; Li, X.H.; Zou, H.F. Optimizing MaxEnt model in the prediction of species distribution. Chin. J. Appl. Ecol. 2019, 30, 2116–2128. [Google Scholar] [CrossRef]
  38. Phillips, S.J.; Anderson, R.P.; Dudík, M.; Schapire, R.E.; Blair, M.E. Opening the black box: An open-source release of Maxent. Ecography 2017, 40, 887–893. [Google Scholar] [CrossRef]
  39. Alkishe, A.; Peterson, A.T. Climate change influences on the geographic distributional potential of the spotted fever vectors Amblyomma maculatum and Dermacentor andersoni. PeerJ 2022, 10, e13279. [Google Scholar] [CrossRef]
  40. Li, Y.; Zhang, X.W.; Fang, Y.M. Responses of the distribution pattern of Quercus chenii to climate change following the Last Glacial Maximum. Chin. J. Plant Ecol. 2016, 40, 1164–1178. [Google Scholar] [CrossRef]
  41. Ning, Y.; Lei, J.R.; Song, X.Q.; Han, S.M.; Zhong, Y.F. Modeling the potential suitable habitat of Impatiens hainanensis, a limestone-endemic plant. Chin. J. Plant Ecol. 2018, 42, 946–954. [Google Scholar] [CrossRef]
  42. Syfert, M.M.; Smith, M.J.; Coomes, D.A. The effects of sampling bias and model complexity on the predictive performance of MaxEnt species distribution models. PLoS ONE 2013, 8, e55158. [Google Scholar] [CrossRef]
  43. Zhang, Y.B.; Liu, Y.L.; Qin, H.; Meng, Q.X. Prediction on spatial migration of suitable distribution of Elaeagnus mollis under climate change conditions in Shanxi Province, China. Chin. J. Appl. Ecol. 2019, 30, 496–502. [Google Scholar] [CrossRef]
  44. Pan, S.; Peng, D.-L.; Li, Y.-M.; Chen, Z.-J.; Zhai, Y.-Y.; Liu, C.; Hong, B. Potential global distribution of the guava root-knot nematode Meloidogyne enterolobii under different climate change scenarios using MaxEnt ecological niche modeling. J. Integr. Agric. 2023, 22, 2138–2150. [Google Scholar] [CrossRef]
  45. He, X.G.; Liu, H.; Zhang, J.; Cheng, W.; Ding, P.; Jia, F.M.; Li, Q.; Liu, C. Predicting potential suitable distribution areas for Juniperus przewalskii in QinghaiProvince of northwestern China based on the optimized MaxEnt model. J. Beijing For. Univ. 2023, 45, 19–31. [Google Scholar] [CrossRef]
  46. Porfirio, L.L.; Harris, R.M.B.; Lefroy, E.C.; Hugh, S.; Gould, S.F.; Lee, G.; Bindoff, N.L.; Mackey, B. Improving the Use of Species Distribution Models in Conservation Planning and Management under Climate Change. PLoS ONE 2014, 9, e113749. [Google Scholar] [CrossRef] [PubMed]
  47. Huang, J.; Chen, B.; Liu, C.; Lai, J.; Zhang, J.; Ma, K. Identifying hotspots of endemic woody seed plant diversity in China. Divers. Distrib. 2012, 18, 673–688. [Google Scholar] [CrossRef]
  48. Dou, P.; Dong, Y.; Chen, L.; Yang, H.-Q. Modeling the potential distribution of different types of Dendrocalamus sinicus, the strongest woody bamboo in the world, with MaxEnt model. PeerJ 2022, 10, e13847. [Google Scholar] [CrossRef] [PubMed]
  49. He, H.; Zheng, X.; Wang, Y.; Wang, W.; Li, M.; Wang, S.; Wang, J.; Wang, C.; Zhan, H. Effects of Climate Change and Environmental Factors on Bamboo (Ferrocalamus strictus), a PSESP Unique to China. Forests 2022, 13, 2108. [Google Scholar] [CrossRef]
  50. Kong, F.; Tang, L.; He, H.; Yang, F.; Tao, J.; Wang, W. Assessing the impact of climate change on the distribution of Osmanthus fragrans using Maxent. Environ. Sci. Pollut. Res. 2021, 28, 34655–34663. [Google Scholar] [CrossRef]
  51. Lai, Y.Y.; Feng, J.M.; Yuan, Y.Y. The Influences of Climate Change on the Elevational Patterns of Tropical Plants in Nepal. J. Xinyang Norm. Univ. (Nat. Sci. Ed.) 2018, 31, 233–239. [Google Scholar] [CrossRef]
  52. Gao, Y.Q.; Cai, T.T.; Yang, Y.X.; Zhang, G.C.; Wan, X.L.; Liu, S.P.; Li, X.J.; Tie, X.J.; Huang, S.K.; Shi, D.H.; et al. Effects of Different Types of Mulch on Growth and Quality of Dendrocalamus brandisii Shoots. World Bamboo Ratt. 2023, 21, 45–49. [Google Scholar]
  53. Hui, C.M.; He, X.H.; Liu, W.Y.; Shi, Z.J.; Sun, M.S. Promoting the Development of Dendrocalamus brandisii Industry for Rural Vitalization. World Bamboo Ratt. 2022, 20, 66–69. [Google Scholar]
  54. Wu, Y.X.; Wang, J.L.; Han, B.M.; Yan, X.R. Forest classification for Motuo County: A method based on spatio-temporal-spectral characteristics. Remote Sens. Nat. Resour. 2023, 35, 180–188. [Google Scholar] [CrossRef]
  55. Enquist, B.J.; Feng, X.; Boyle, B.; Maitner, B.; Newman, E.A.; Jørgensen, P.M.; Roehrdanz, P.R.; Thiers, B.M.; Burger, J.R.; Corlett, R.T. The commonness of rarity: Global and future distribution of rarity across land plants. Sci. Adv. 2019, 5, eaaz0414. [Google Scholar] [CrossRef]
  56. Darabant, A.; Rai, P.B.; Staudhammer, C.L.; Dorji, T. Designing and evaluating bamboo harvesting methods for local needs: Integrating local ecological knowledge and science. Environ. Manag. 2016, 58, 312–322. [Google Scholar] [CrossRef] [PubMed]
  57. Zhai, H.J.; Dong, S.K. Analyses on arbor distribution pattern and its environmental influence factors in the middle and lower reaches of Lancang River Basin. J. Plant Resour. Environ. 2018, 27, 65–71. [Google Scholar] [CrossRef]
  58. Wang, X.F.; Duan, Y.X.; Jin, L.L.; Wang, C.Y.; Peng, M.C.; Li, Y.; Wang, X.H.; Ma, Y.F. Prediction of historical, present and future distribution of Quercus sect. Heterobalanus based on the optimized MaxEnt model in China. Acta Ecol. Sin. 2023, 43, 6590–6604. [Google Scholar]
  59. Thomas, C.D.; Cameron, A.; Green, R.E.; Bakkenes, M.; Beaumont, L.J.; Collingham, Y.C.; Erasmus, B.F.; De Siqueira, M.F.; Grainger, A.; Hannah, L. Extinction risk from climate change. Nature 2004, 427, 145–148. [Google Scholar] [CrossRef]
  60. Bartlein, P.J.; Harrison, S.; Brewer, S.; Connor, S.; Davis, B.; Gajewski, K.; Guiot, J.; Harrison-Prentice, T.; Henderson, A.; Peyron, O. Pollen-based continental climate reconstructions at 6 and 21 ka: A global synthesis. Clim. Dyn. 2011, 37, 775–802. [Google Scholar] [CrossRef]
  61. Li, J.; Fan, G.; He, Y. Predicting the current and future distribution of three Coptis herbs in China under climate change conditions, using the MaxEnt model and chemical analysis. Sci. Total Environ. 2020, 698, 134141. [Google Scholar] [CrossRef]
  62. Liu, L.; Guan, L.; Zhao, H.; Huang, Y.; Mou, Q.; Liu, K.; Chen, T.; Wang, X.; Zhang, Y.; Wei, B. Modeling habitat suitability of Houttuynia cordata Thunb (Ceercao) using MaxEnt under climate change in China. Ecol. Inform. 2021, 63, 101324. [Google Scholar] [CrossRef]
  63. Zhang, M.Z.; Ye, X.Z.; Li, J.H.; Liu, Y.P.; Chen, S.P.; Liu, B. Prediction of potential suitable area of Ulmus elongata in China under climate change scenario. Chin. J. Ecol. 2021, 40, 3822–3835. [Google Scholar] [CrossRef]
Figure 1. Distribution records of D. brandisii after screening (a). Heatmap analysis of environmental variables correlation involved in model construction (b).
Forests 15 01301 g001
Figure 2. The model selection results in R program (a). The ROC curve of the MaxEnt model (b).
Forests 15 01301 g002
Figure 3. Evaluation of main environmental factors by jackknife method.
Forests 15 01301 g003
Figure 4. Relationship between potential suitable area and single-factor response variables.
Forests 15 01301 g004
Figure 5. Potential suitable areas for D. brandisii under current climatic conditions.
Forests 15 01301 g005
Figure 6. Represents 2050s SSPs2.6 (a), 2050s SSPs8.5 (b), 2070s SSPs2.6 (c), 2070s SSPs8.5 (d), 2090s SSPs2.6 (e), and 2090s SSPs8.5 (f).
Forests 15 01301 g006
Figure 7. Represents 2050s SSPs2.6 (a), 2050s SSPs8.5 (b), 2070s SSPs2.6 (c), 2070s SSPs8.5 (d), 2090s SSPs2.6 (e), and 2090s SSPs8.5 (f).
Forests 15 01301 g007
Figure 8. Location of D. brandisii’s suitable habitat centroid migration under different climate scenarios/km. The numbers in the figure represent the distance from that period to the present.
Forests 15 01301 g008
Table 1. Importance of environmental variables for the distribution of D. brandisii.
NumberVariablePercent
Contribution
Permutation
Importance
1Precipitation of warmest quarter (bio18)43.84.5
2Temperature seasonality (bio4)18.417.2
3Maximum monthly mean radiation
(uvb-4)
16.674.1
4Elevation (Elev)14.80.8
5Precipitation of coldest quarter (bio19)2.50.7
6Seasonal radiation (uvb-2)2.42
7Precipitation of wettest quarter (bio16)1.50.7
Table 2. Potential suitable distribution areas predicted by current climate.
NationUninhabitable Area
(×104 km2)
Low-Suitability Area
(×104 km2)
Medium-Suitability Area
(×104 km2)
High-Suitability Area
(×104 km2)
Total Suitable Area
(×104 km2)
The
Proportion of High
Suitability Area (%)
Total Suitable Area Proportion (%)
China918.8923.948.3611.8444.1478.3347.88
Bangladesh11.970.130.000.000.130.000.14
Nepal10.642.630.280.002.910.003.16
Laos11.364.423.210.708.334.629.03
Burma42.7210.623.741.0815.447.1416.75
Thailand43.370.010.000.000.010.000.01
Vietnam18.595.232.981.029.246.7810.02
India261.497.992.440.4710.903.1411.82
Bhutan2.360.930.150.001.080.001.17
Table 3. Shows the changes in D. brandisii area (in 10,000 km2) under the same climate scenario at different times.
PeriodCurrent2050s (2041–2060)2070s (2061–2080)2090s (2081–2100)
SSPs2.6SSPs8.5SSPs2.6SSPs8.5SSPs2.6SSPs8.5
Low-Suitability Area 55.968.7864.9260.0856.3565.0854.25
Medium-Suitability Area21.1619.8118.8118.6920.1917.7019.75
High-Suitability Area15.1115.4213.6512.8814.8414.6616.00
Total Suitable Area92.17104.0197.3891.6591.3897.4490.00
Table 4. Changes in the spatial pattern of D. brandisii’s suitable habitat under different climate scenarios.
PeriodArea/(×104 km2)Change Rate/%
IncreaseReservedLostChangeIncreaseReservedLostChange
2050sSSPs2.616.5087.514.6611.8417.9094.945.0612.85
2050sSSPs8.516.6980.6811.485.2118.1187.5312.465.65
2070sSSPs2.612.9178.7413.43−0.5214.0085.4314.57−0.56
2070sSSPs8.511.5579.8312.34−0.7912.5386.6113.39−0.86
2090sSSPs2.618.4778.9713.205.2720.0485.6814.325.72
2090sSSPs8.59.5480.4611.71−2.1710.3587.3012.70−2.35
Table 5. Changes in the latitude and longitude of the centroid of the suitable area for D. brandisii’s under different climate scenarios.
PeriodCurrent2041–2060s SSPs2.62041–2060s SSPs8.52061–2080s SSPs2.62061–2080s SSPs8.52081–2100s SSPs2.62081–2100s SSPs8.5
longitude/(°)100.8199.7899.7299.1398.8498.55101.30
latitude/(°)23.4823.2423.1523.2623.2623.3223.22
Disclaimer/Publisher’s Note: The statements, opinions and data contained in all publications are solely those of the individual author(s) and contributor(s) and not of MDPI and/or the editor(s). MDPI and/or the editor(s) disclaim responsibility for any injury to people or property resulting from any ideas, methods, instructions or products referred to in the content.

