Abstract
Larix kaempferi is in high demand in Korea due to its value in timber and afforestation. However, it faces challenges in terms of propagation and the collection of physiological information for seedling production. In particular, moisture supply is crucial in seedling production. Therefore, establishing efficient irrigation regimes based on optical measurements is essential. Optical measurement methods are expected to be non-destructive, rapid, and reduce labor consumption in nursery systems. This study applied optical measurements using vegetation indices (VIs), chlorophyll fluorescence (FL) imaging, and thermal (TH) imaging to explore the efficient irrigation period for one-year-old Larix kaempferi seedlings in greenhouse conditions under drought stress and perform rehydration experiments. It was observed that all the seedlings survived without irrigation until day 4 (D4) (soil moisture content: 5.3%). Upon rehydration on D6, 83.33% of the seedlings survived until D14. According to the optical measurement results, the TH parameters, PRI (photochemical reflectance index), and Fm (maximum fluorescence in a dark-adapted state) showed sensitive stress responses in all drought treatment pots on D6. Among them, thermal imaging was found to have the highest potential for addressing limitations and being utilized in the greenhouse. The results of this study are expected to provide foundational data for the development of smart nursery systems for efficient irrigation in the future.
1. Introduction
Larix is one of the most sought-after tree species in the Northern Hemisphere due to its value in timber and ecological restoration [,,]. The demand for Larix kaempferi (Japanese larch), known for its drought tolerance in response to climate change and widely used in afforestation efforts, is the highest in Korea [,,]. In 2023, it was planted on 4932 ha of land, and this trend has been continuously increasing since 2018 []. However, the irregularity of seed production cycles and difficulties in Larix kaempferi propagation due to factors such as slow germination rates and seedling production issues pose challenges to its distribution. Furthermore, the trend of future climate change is predicted to decrease the growth of Larix due to the limits of its drought tolerance [,]. To address climate change, improve seedling production, and reduce costs, the development of smart nursery systems for efficient irrigation is required to support decision-making in nursery management [].
Maintaining an adequate moisture supply is crucial for sustaining high-quality seedling production. Moisture is among the most limiting factors among various environmental factors influencing plant growth, and seedlings are particularly vulnerable to moisture stress compared to mature trees. When moisture becomes insufficient, plants encounter decreased cell turgor pressure and disruptions in moisture-related metabolic activities, leading to impaired photosynthesis and growth [,]. Some research has been conducted on the development of smart irrigation systems targeting coniferous trees []. However, there is a shortage of research on this topic compared to that on the use of irrigation systems for agricultural crops. Since the application of smart irrigation systems may vary depending on the tree’s species and age, basic data collection should be continuously conducted to enable practical field application.
To collect physiological information on seedlings based on smart nursery systems, it will be necessary to develop phenotyping methods based on optical characteristics. Especially for 1–2-year-old seedlings, specialized pots optimized for growth are used, and due to the difficulty in measuring coniferous trees, such technical applications are indispensable [,]. Destructive methods such as chlorophyll content and water status for measuring tree physiology can adversely affect growth limits [,,]. In the case of a one-year-old Larix kaempferi seedling, the dense distribution of needles around the one main shoot makes contact-based non-destructive methods, such as measuring leaf gas exchange status, challenging [,].
There are various approaches to optical measurement methods to overcome these challenges. A vegetation index (VI) is an optical measurement technique used to assess the state of plants. It involves measuring the extent to which light of specific wavelengths is absorbed or reflected by plants, allowing an estimation of their biological status []. Plants under stress try to use wavelengths outside the PAR (Photosynthetically Active Radiation) range to alleviate physiological stress, and this principle can be used to diagnose plant stress [,,,]. Fluorescence (FL) imaging captures the FL emitted by plants under specific conditions to track physiological and environmental changes []. The mechanism in photosynthesis, where light energy is absorbed by receptors (primarily chlorophyll a), and some is emitted as FL or thermal dissipation, is useful for evaluating photosynthetic efficiency and diagnosing a plant’s condition [].
Thermal (TH) imaging assesses the condition of plants by measuring temperature changes when they are exposed to stress []. During drought conditions, leaf temperature increases, and to withstand drought stress, plants close their stomata to conserve moisture or open them to lower internal temperatures. Accordingly, it is able to detect stomatal responses to drought stress more quickly than traditional gas exchange measurement methods []. TH imaging typically applies the CWSI (crop water stress index), similar to the VIs and FL parameters, to manage irrigation across various crops. In particular, numerous studies have been conducted on trees, applying the CWSI by measuring canopy temperature [,,]. These TH imaging-based data can serve as valuable resources for future applications in deep learning, underscoring the need for ongoing fundamental research in precision agriculture and forestry [].
For these reasons, this study explored the efficient irrigation period for one-year-old pot-grown Larix kaempferi seedlings through drought and rehydration experiments using optical measurements (VIs, FL imaging, and TH imaging) in greenhouse conditions, based on the current nursery system in Korea []. This will lead to the exploration of the irrigation threshold for Larix kaempferi, enabling the proposal of an efficient irrigation regime. Moreover, if parameters that can be non-destructively diagnosed early are explored, this study is expected to provide foundational data for the development of smart nursery systems.
2. Materials and Methods
2.1. Experimental Materials
This experiment was conducted using one-year-old Larix kaempferi seedlings. Each pot (made of black polypropylene) consisted of 24 cells with dimensions 42 cm in width, 28 cm in length, and 14 cm in height. Each cell had a diameter of Φ 64 mm at the top and Φ 42 mm at the bottom and a height of 14 cm, with a capacity of 320 mL (Figure 1a). Before the experiment, the seedlings were sown in pots in a growth medium consisting of peat moss, perlite, and vermiculite (1:1:1, v/v), with the seeds soaked for two days in April 2023 before sowing. They were cultivated in a greenhouse covered with polyolefin film at the Forest Management Technology Research Institute (37°45′39″ N, 127°10′13″ E). From April to June 2023, 20 L m−2 was applied daily using sprinklers []. During the growth period, the average temperature inside the greenhouse was 18.0 ± 6.4 °C, and the average humidity was 62.63 ± 5.8%. The physicochemical properties of the growth medium are shown in Table 1 [].
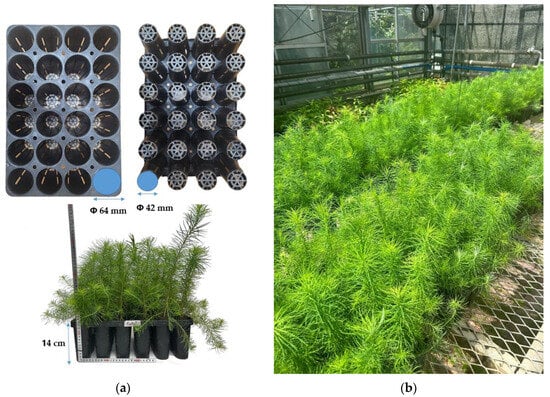
Figure 1.
Overview of experimental environment. (a) Nursery pot cell specification; (b) Larix kaempferi seedlings in greenhouse conditions.

Table 1.
The physical and chemical properties of growth medium before nursery culture.
2.2. Drought Stress and Rehydration Treatments
On 16 August 2023, the pot seedlings were transferred to the greenhouse of the College of Forest and Environmental Sciences at Kangwon National University for acclimatization (37°52′00″ N, 127°44′51″ E) (Figure 1b). The drought treatment was conducted for two weeks, starting on 3 September 2023 (D1). One pot of Control (irrigation) and seven pots of drought (non-irrigation before rehydration) and rehydration treatments (non-irrigation after rehydration) were set up for each pot (2D-RH, 4D-RH, 6D-RH, 8D-RH, 10D-RH, 12D-RH, and 14D-RH). The “O”D-RH treatment refers to rehydration on day “O” (D“O”) following the drought treatment. Irrigation and rehydration were carried out daily using a watering can, with each pot receiving approximately 2.35 L of water, similar to the amount used in the Forest Technology and Management Research Center greenhouse. Irrigation and rehydration were conducted at 6 p.m. KST after the completion of all-optical measurements to ensure that the leaves were not affected by moisture during TH imaging.
2.3. Greenhouse and Soil Environment
Data on greenhouse temperature and humidity were collected at 30 min intervals using two Hobo data loggers (UX100-011A, Onset, Bourne, MA, USA) set up at a height of 2 m at each end of the greenhouse. To measure soil temperature and moisture, two Hobo temperature sensors (S-SMD-M005, Onset, Bourne, MA, USA) and two humidity sensors (S-TMB-M002, Onset, Bourne, MA, USA) with Hobo micro-stations (H21-USB, Onset, Bourne, MA, USA) were installed per pot in each irrigation and drought treatment. The sensors were placed at a depth of 10 cm inside the soil, one in the inner cell of the pot and one in the corner cell of the pot, and set to measure at 30 min intervals.
During the experimental period (D0–D14), the greenhouse temperature was maintained at 25.8 ± 2.4 °C, with a humidity of 82.1 ± 8.5% (Figure 2a). The soil moisture of the Control was maintained at 30.5 ± 0.5% throughout the experimental period (Figure 2b). In contrast, under the drought treatment, the soil moisture decreased drastically, reaching 26.6% on D0, 22.9% on D1, 20.3% on D2, 14.2% on D3, and 5.3% on D4, eventually approaching 0% on D5. The soil temperature did not exhibit a significant difference, unlike the soil moisture, and was 0.7 ± 0.3 °C higher in the drought treatment than in the Control throughout the experimental period.
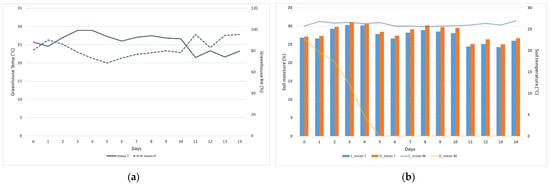
Figure 2.
Greenhouse and soil environment during the experimental period. (a) Greenhouse temperature and humidity; (b) soil temperature and moisture. C: Control; D: drought; T: temperature; H: humidity; M: moisture.
2.4. Growth Characteristic Measurements
The survival rate was measured every other day. The criterion for wilting was when the top of the seedling observed became visually dry, indicating death. Shoot height (SH) and diameter of root collar (DRC) measurements were conducted before the drought treatment (D0) and after the experiment was completed (D14). Leaf relative water content (RWC) was measured after the experiment was completed (D14). In one treatment, the fresh weight (FW) of randomly selected leaves (1 g) was measured using an infrared moisture analyzer (FD-660, Kett, Tokyo, Japan), and the leaves were then dried at 105 °C for 20 min to obtain the dry weight (DW). The turgid weight (TW) was measured by soaking randomly selected leaves (1 g) in water for 4 h and measuring their weight. The RWC was calculated by applying the following formula to the FW, DW, and TW (Equation (1)).
RWC = (FW − DW)/(TW − DW) × 100
2.5. Optical Measurements
Optical measurements were conducted by selecting the four seedlings with the tallest SH per treatment (n = 22 to 24 per pot). The VIs were measured from 9 a.m. to 12 p.m. KST in greenhouse. Each seedling was measured 10 times, totaling 40 measurements per treatment. The upper leaves of the seedlings were arranged without overlapping to ensure a width of at least 7 mm, and spectral reflectance was measured using a handheld spectrophotometer (PolyPen RP 410, Photon Systems Instruments, Drásov, Czech Republic). The VIs used in this study were automatically calculated simultaneously (Table 2).
After measuring the VIs, FL images were obtained using a handheld FluorCam (FC 1000-H, PSI, Drásov, Czech Republic) from 10 a.m. to 4 p.m. KST. Prior to measurement, the pots were acclimated in a dark-adapted environment similar to greenhouse conditions for 30 min. An image of the top of one seedling was captured from a distance of 10 cm. The measurement protocol was set to quenching analysis mode with the following parameters: shutter = 1 (20 μs), sensitivity = 10.1%, FAR-LED = 28%, actinic light 2 = 100%, actinic light 1 = 22.4%, and super pulse = 30.4%. Following this, the FL parameters were measured (Table 2). One image (35 × 46 mm) was selected by dividing five areas after extracting only the leaves, and five measurements were collected per seedling using the software FluorCam7 ver. 1.2.4.4 (PSI, Drásov, Czech).
The TH images were taken from 4:30 p.m. to 6 p.m. KST using an infrared camera (PI 160i, Optris, Berlin, Germany). One TH image was captured simultaneously for both the Control and drought and rehydration treatments at a height of 2 m above the ground for 10 min. The Tc (leaf temperature of the Control) and Tl (leaf temperature of the target) were obtained by measuring the leaf temperature (LT) at 30 points on four selected seedlings in the Control and drought and rehydration treatments. To calculate the CWSI before capturing the TH images, calibration TH images were taken (Table 2). Four seedlings were selected from the Control, and the Td (highest leaf temperature) was collected by applying petroleum jelly (Vaseline) to their leaves []. A cooling treatment involving the spraying of water was applied to four other seedlings to collect the Tw (lowest leaf temperature). This protocol was consistently applied to the same seedlings every day during TH imaging. All the optical measurements were impracticable, as most samples wilted and became unmeasurable from D10.
Table 2.
Overview of principles and equations for optical measurement parameters.
Table 2.
Overview of principles and equations for optical measurement parameters.
| Type | Parameter | Principle and Equation | Reference |
|---|---|---|---|
| VI | NDVI | (RNIR − RRed)/(RNIR + RRed) | [] |
| OSAVI | (1 + 0.16) × (R790 − R670)/(R790 − R670 + 0.16) | [] | |
| MCARI | [(R700 − R670) − 0.2 × (R700 − R550)] × (R700/R670) | [] | |
| PRI | (R415 − R435)/(R415 + R435) | [] | |
| FL imaging | Fo | Minimum fluorescence in a dark-adapted state | [] |
| Fm | Maximum fluorescence in a dark-adapted state | [] | |
| QY_max | (Fm − Fo)/Fm | [] | |
| QY_Lss | (Fm_Lss − Ft_Lss)/Fm_Lss | ||
| NPQ_Lss | (Fm − Fm_Lss)/Fm_Lss | [] | |
| Rfd_Lss | (Fp − Ft_Lss)/Ft_Lss | [] | |
| TH imaging | CWSI | (Tl − Tw)/(Td − Tw) | [] |
| LTD | Tc − Tl |
NDVI: normalized difference vegetation index; OSAVI: optimized soil-adjusted vegetation index; MCARI: modified chlorophyll absorption in reflectance index; PRI: photochemical reflectance index; QY_max: maximum PSII quantum yield in a dark-adapted state (Fv/Fm); QY_Lss: effective PSII quantum yield in steady state (ΦPSII); NPQ_Lss: non-photochemical quenching in steady state; Rfd_Lss: fluorescence decline ratio in steady state; CWSI: crop water stress index; LTD: leaf temperature difference; VI: vegetation index; FL: fluorescence; TH: thermal; R: reflectance; NIR: near-infrared; PSII: photosystem II; Fm_Lss: steady state maximum fluorescence in light; Ft_Lss: steady-state fluorescence in light; Fp: peak fluorescence during the initial phase of the Kautsky effect; Tc: leaf temperature of the Control; Tl: leaf temperature of the target; Tw: lowest leaf temperature; Td: highest leaf temperature.
2.6. Statistical Analysis
A one-way ANOVA (post hoc: Tukey’s HSD test, p < 0.05) and a Pearson correlation analysis were conducted using SPSS ver. 26 (IBM, Armonk, NY, USA). The one-way ANOVA was used to analyze the Control to 14D treatments on D0 and D14 for SH and DRC, while RWC analyzed the Control to 14D treatments on D14. The VI (NDVI, OSAVI, MACARI, and PRI), FL (Fo, Fm, QY_max, QY_Lss, NPQ_Lss, and Rfd_Lss), and TH parameters (CWSI and LTD) were analyzed for the same treatments on different days and different treatments on the same days. The Pearson correlation analysis was conducted on the VI, FL, and TH parameters from D2 to D8 for each treatment (2D-RH, 4D-RH, 6D-RH, and 8D-RH). Principal Component Analysis (PCA) was performed using R ver. 3.6.1 (R Core Team, Vienna, Austria) with the ‘psych’ package ver. 2.4.3 and the ‘ggbiplot’ library. The PCA was conducted on the VI, FL, and TH parameters from 2D-RH to 8D-RH for each day (D2, D4, D6, and D8).
3. Results
3.1. Results of Growth Characteristics
Until D4 of no irrigation, all the seedlings survived. However, symptoms of withering due to drought stress appeared from D6 onwards (Table 3). On D8, a survival rate of less than 50% was observed, excluding 6D-RH, and seedlings affected by drought stress (leaf wilting) did not show signs of recovery, even after rehydration, and eventually died.
Table 3.
The survival rate results from the drought and rehydration treatments.
Before the drought treatment (D0), there was no significant difference in SH among all treatments (Table 4). By D14, the Control exhibited the highest SH growth, while 8D-RH showed the lowest SH growth. Although 10D-RH did not die, it exhibited a decrease in SH due to wilting. Meanwhile, the DRC decreased in 8D-RH, 10D-RH, and 14D-RH. The RWC started to show a significant decrease from 6D-RH, with a significant decrease observed between treatments as the drought treatment duration increased. After the SMC reached 0% on D5, a significant decrease in RWC and seedling mortality was observed, identifying D6 as the point where visually distinguishable drought damage began (Table 3).
Table 4.
The SH, DRC, and RWC results of the drought and rehydration treatments.
3.2. The Results of the ANOVA
The NDVI and OSAVI measurement results showed no significant difference between treatments from D2 to D6 (Figure 3a,b). In contrast, on D8, 8D-RH exhibited significantly lower values (NDVI: 0.64 ± 0.09, OSAVI: 0.69 ± 0.11) compared to the other treatments. No significant difference was observed over time for 8D-RH. The values of 2D-RH and 4D-RH were initially lower but showed a trend of recovery over time. The MCARI measurement results indicated that 8D-RH had significantly lower values (D6: 0.41 ± 0.14, D8: 0.36 ± 0.18) than the other treatments from D6 onwards (Figure 3c). However, similar to the NDVI and OSAVI, no significant difference over time was observed for 8D-RH. The PRI measurement results showed a more sensitive response compared to the other VIs (Figure 3d). Significant differences between treatments were observed from D2. The 6D-RH and 8D-RH showed significantly lower values than the other rehydration treatments starting from D6. Significantly, 6D-RH began to exhibit negative values, unlike the other treatments. The PRI was shown to enable relatively rapid stress detection around the day (D6) after SMC reached 0% (D5), when the average survival rate was 80%, compared to other VIs (Table 3).
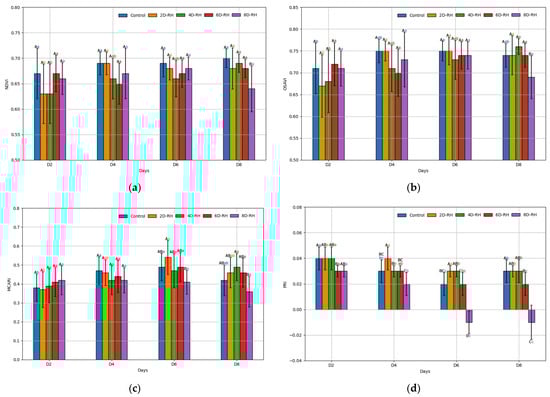
Figure 3.
The results of the ANOVA on the VI parameters. (a) NDVI (normalized difference vegetation index); (b) OSAVI (optimized soil-adjusted vegetation index); (c) MCARI (modified chlorophyll absorption in reflectance index); (d) PRI (photochemical reflectance index). Post hoc analysis was conducted using the Tukey test (p < 0.05), where capital letters indicate a comparison between five treatments on the same day, and lower-case letters indicate a comparison between four days within the same treatment. The error bars represent standard deviation.
Fo maintained 317.37 ± 59.41 in the Control throughout the experiment, whereas on D8, 8D-RH exhibited 362.36 ± 133.58 and increased sharply (Figure 4a). In contrast, Fm appeared to decrease as drought conditions continued (Figure 4b). The 6D-RH (770.74 ± 378.53) and 8D-RH (677.76 ± 359.85) on D6 showed a significant decrease compared to the rehydration treatments (Control, 2D-RH, and −4D-RH). There was a tendency for Fm recovery in 6D-RH on D8 after rehydration, while recovery seemed improbable in 8D-RH (Figure 5). This seemed to reflect that, unlike the rehydration treatments (8D-RH on 14D) after D8, which had a survival rate below 50%, 6D-RH maintained a high survival rate of over 80% after rehydration (Table 3). Similar to Fm, QY_max also showed a decreasing trend (Figure 4c). However, it appeared to be less sensitive to stress compared to Fm. 6D-RH did not show significant differences from the rehydration treatments on D6 (0.69 ± 0.06) and D8 (0.72 ± 0.02). QY_Lss showed that 6D-RH (0.30 ± 0.05) had higher values than Control (0.29 ± 0.05) and 2D-RH (0.29 ± 0.02) on D6, indicating non-stress responses (Figure 4d). NPQ_Lss and Rfd_Lss trends were less clear but similar to other FL parameters; 8D-RH showed a significant decrease on D8 (NPQ_Lss: 0.90 ± 0.79, Rfd_Lss: 0.34 ± 0.30) (Figure 4e,f).
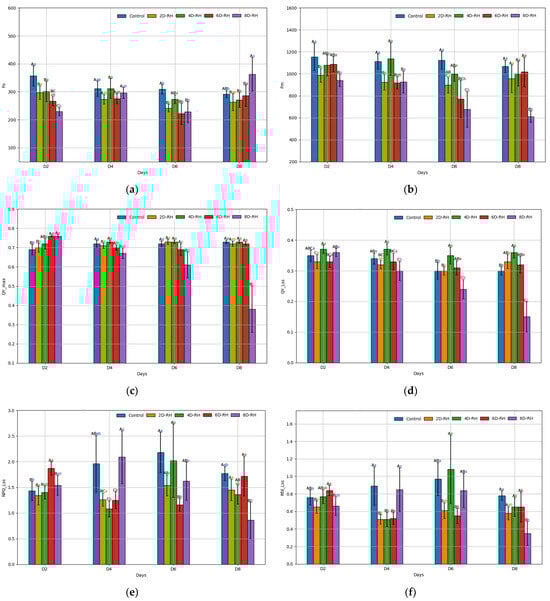
Figure 4.
The results of the ANOVA on the FL parameters. (a) Fo (minimum fluorescence in a dark-adapted state); (b) Fm (maximum fluorescence in a dark-adapted state); (c) QY_max (maximum PSII quantum yield in a dark-adapted state); (d) QY_Lss (effective PSII quantum yield in steady state); (e) NPQ_Lss (non-photochemical quenching in steady state); (f) Rfd_Lss (fluorescence decline ratio in steady state). Post hoc analysis was conducted using the Tukey test (p < 0.05), where capital letters indicate a comparison between five treatments on the same day, and lower-case letters indicate a comparison between four days within the same treatment. The error bars represent standard deviation.
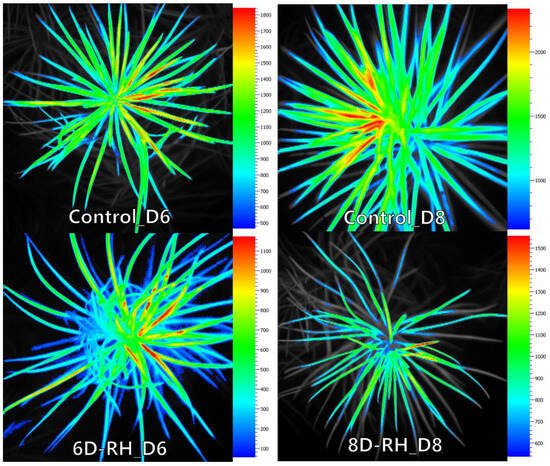
Figure 5.
D6 and D8 FL imaging results (Fm).
From D4 onwards, significant stress responses were observed as the TH parameters increased in 8D-RH (Figure 6). From D6, there was a particularly notable increase in the CWSI and LTD under both 6D-RH and 8D-RH. Starting from D6, where mortality appeared and RWC showed a significant decrease, the LTD values of 6D-RH and 8D-RH changed from negative to positive (Table 3 and Table 4). Compared to PRI, where only 8D-RH changed from a positive to a negative value, thermal imaging showed a higher sensitivity in detecting stress (Figure 3). Even with rehydration on D6 in 6D-RH, stress continued on D8, unlike Fm (Figure 4). This necessitated an analysis through correlation with SMC to determine which parameter showed a more similar trend. Unlike other parameters, when observed solely through thermal images, 6D-RH on D6 exhibited higher LT compared to 8D-RH on D8, indicating higher stress (Figure 7). This appeared to be due to the influence of weather, which caused shaded areas to be reflected in the images.
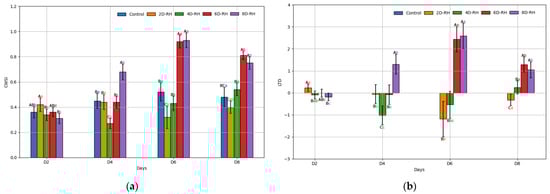
Figure 6.
The results of the ANOVA on the TH parameters. (a) CWSI (crop water stress index); (b) LTD (leaf temperature difference). Post hoc analysis was conducted using the Tukey test (p < 0.05), where capital letters indicate a comparison between five treatments on the same day, and lower-case letters indicate a comparison between four days within the same treatment. The error bars represent standard deviation.
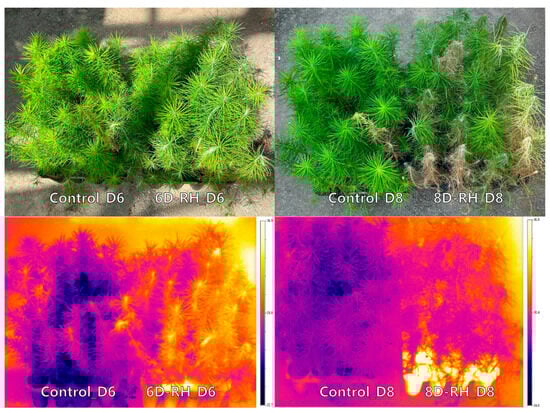
Figure 7.
D6 and D8 TH imaging results.
3.3. The Results of the Correlation Analysis
It was found that a consistent trend in specific parameters appeared starting from D6 when mortality was observed (Table 3, Figure 8). Among the VI parameters, PRI was the only one to show significant correlation coefficients with SMC in both 6D-RH (r = 0.458) and 8D-RH (r = 0.551). Additionally, it showed significant correlation coefficients with most FL and TH parameters. Fm and QY_max consistently showed positive correlation coefficients with SMC in both 6D-RH and 8D-RH. In particular, Fm exhibited the highest negative correlation coefficients with the TH parameters compared to QY_max. The TH parameters showed the highest negative correlation coefficients with SMC compared to PRI and Fo, with 6D-RH (CWSI: r = −0.743, LTD: r = −0.631) and 8D-RH (CWSI: r = −0.827, LTD: r = −0.555). This indicates that the TH parameters most closely resembled the trends associated with drought stress.
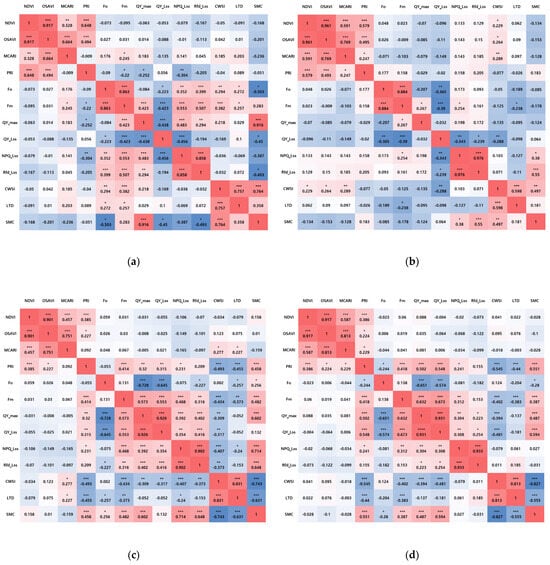
Figure 8.
The results of the correlation analysis by treatment from D2 to D8 (n = 80): (a) 2D-RH; (b) 4D-RH; (c) 6D-RH; (d) 8D-RH. * p < 0.05, ** p < 0.01, *** p < 0.001. NDVI: normalized difference vegetation index; OSAVI: optimized soil-adjusted vegetation index; MCARI: modified chlorophyll absorption in reflectance index; PRI: photochemical reflectance index; Fo: minimum fluorescence in a dark-adapted state; Fm: maximum fluorescence in a dark-adapted state; QY_max: maximum PSII quantum yield in a dark-adapted state; QY_Lss: effective PSII quantum yield in steady state; NPQ_Lss: non-photochemical quenching in steady state; Rfd_Lss: fluorescence decline ratio in steady state; CWSI: crop water stress index; LTD: leaf temperature difference; SMC: soil moisture content.
3.4. The Results of the PCA
On D2, the treatments were not clearly distinguished (Figure 9a). By D4, there was a tendency for the relative distance to increase between 4D-RH and 8D-RH (Figure 9b). 4D-RH appeared to be influenced by FL parameters such as QY_Lss, Fo, Fm, and QY_max. On the other hand, 8D-RH was influenced by the TH parameters and by the VI parameters. By D6, distinct plots were observed between the Control with rehydration treatments and the drought treatments (Figure 9c). The influence of the TH parameters was most evident in the 6D-RH and 8D-RH. By D8, a clear distinction was evident (Figure 9d). In particular, the rehydration in 6D-RH was still classified as a different treatment from the rest of the rehydration treatments. This seemed to reflect the slight decrease in the survival rate of 6D-RH observed on D14, indicating that the damage from stress was not fully recovered even after rehydration. Additionally, Fo showed a positive influence in the 6D-RH and 8D-RH on D8, indicating the point at which the plants underwent irrecoverable drought stress.
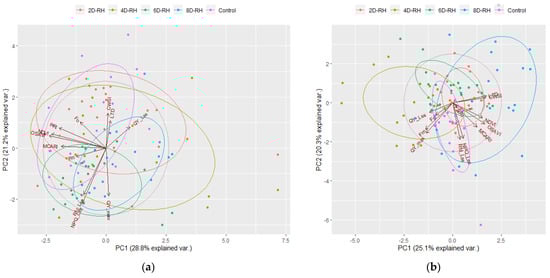
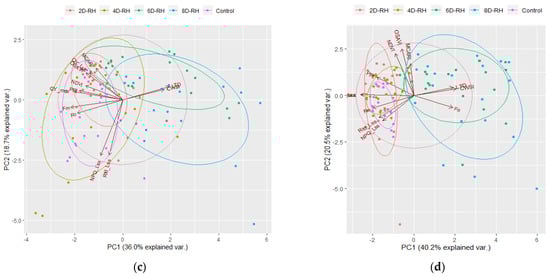
Figure 9.
The results of PCA by day (n = 20). (a) D2; (b) D4; (c) D6; (d) D8. NDVI: normalized difference vegetation index; OSAVI: optimized soil-adjusted vegetation index; MCARI: modified chlorophyll absorption in reflectance index; PRI: photochemical reflectance index; Fo: minimum fluorescence in a dark-adapted state; Fm: maximum fluorescence in a dark-adapted state; QY_max: maximum PSII quantum yield in a dark-adapted state; QY_Lss: effective PSII quantum yield in steady state; NPQ_Lss: non-photochemical quenching in steady state; Rfd_Lss: fluorescence decline ratio in steady state; CWSI: crop water stress index; LTD: leaf temperature difference.
4. Discussion
It was found that among the greenhouse and soil environmental factors, the SMC within the pots had a significant impact on seedling survival and the RWC. Low SMC due to limited water supply can reduce root water potential, inhibit water uptake for photosynthesis and plant respiration, and negatively affect growth []. In particular, the water potential difference between organs focuses more on protecting the stem than the leaves []. In severe drought stress, such as in this study, the reduction in leaf turgor pressure can lead to a significant decrease in RWC, making the plant, as well as the leaves, nearly irrecoverable. In various species, wilting symptoms have been reported under severe drought stress, even at higher SMC levels than those observed in this study [,].
In this study, the size of the cells was considered to be the main influencing factor, indicating a drastic decrease in SMC. Small pot sizes can cause SMC deficiency, which can inhibit various plant growth factors []. This can induce severe drought stress more quickly, making physiological recovery of the seedlings impossible even after rehydration [,]. Despite the existence of existing non-destructive physiological measurement methods, limitations arise when destructive measurements must be made depending on the sample type []. Therefore, in a nursery system like the one in this study, precise and efficient irrigation regimes are necessary, and optical measurement methods that can be quickly and non-destructively applied are essential.
Consequently, the development of optical technology-based methods for diagnosing plant stress has been widely researched recently [,]. Multi-dimensional approaches, especially involving VI, FL, and TH parameters, are helpful for complex plant stress identification and prediction []. However, the big data for developing a smart nursery system continues to face challenges. Therefore, there is a need for the continuous accumulation of foundational data.
In this study, the PRI, Fm, and TH parameters demonstrated potential for the non-destructive early detection of drought stress. Based on our correlation analysis results, the PRI is considered to be a useful alternative measurement method to FL and TH parameters among VIs. While typically used to measure chlorophyll and carotenoid content, it has been reported to have potential application as a rapid evaluation method for leaf water status [,]. Zarco-Tejada et al. [] reported that the normalized PRI is comparable to the TH parameter in measuring water stress. In a study by Tan et al. [], temporal data on a wheat canopy were collected, and VIs were analyzed for their correlation with QY_max (Fv/Fm). The PRI exhibited an r-value of 0.602, indicating higher correlation coefficients compared to this study. In the case of Larix kaempferi, it has been reported that the correlation with photosynthetic parameters on a daily basis is higher in the PRI than in the NDVI []. The PRI has also been investigated for its effectiveness in the measurement of water stress in previous studies [,,,].
Among the FL parameters, Fm exhibited stress responses early on D6 under both 6D-RH and 8D-RH. Generally, Fv/Fm is widely utilized, but it has also been reported to have low sensitivity to stress responses []. Nevertheless, detecting stress early with Fm is more challenging compared to the PRI and TH parameters because there are limitations to capturing them in real time due to the requirement for dark adaptation periods []. Meanwhile, Sandmann et al. [] proposed the method of taking nighttime measurements in greenhouse environments without a dark room. However, considering the differences in plants’ photosynthetic and respiratory mechanisms between day and night, stress responses may vary, indicating the need for further research. To complement Sandmann et al.’s research, Xia et al. [] proposed a method for determining chlorophyll a fluorescence using the LSSVM (Least Squares Support Vector Machine) model without dark adaptation.
In this study, significant correlations were found between the TH parameters and FL parameters. These two imaging techniques have been reported to be useful for measuring various crop stresses, including drought stress [,,,,]. Vítek et al. [] reported similar changes over time in leaf TH images and Fv/Fm FL images due to herbicide treatment in Chenopodium album. Belin et al. [] reported that TH images were more useful than Fo FL images for the detection and quantification of apple scab at the surface of leaves, showing a higher linear regression with the percentage of diseased leaf area.
It was found that TH imaging can overcome limitations related to measurement range and equipment cost. TH imaging has been seen as a viable method for evaluating physiological responses to water stress in natural coniferous forest stands. In particular, soil moisture was identified as a major factor affecting the difference between leaf and air temperature, similar to the findings of this study. In experiments with two-year-old Larix kaempferi, it was shown that physiological stress could be detected using miniature thermal cameras [].
TH imaging is primarily compared with other methods in relation to leaf water and gas exchange status []. LT is closely related to stomatal movement, and its measurement of gs has been reported to be applicable in various species and stress conditions [,,,]. In previous studies by Grant et al. [], it was observed that, under greenhouse conditions, grapevines exhibited a significant decrease in gs, leading to an increase in LT due to drought stress. Additionally, in experiments using Quercus suber L., a correlation was found between LT and gs but not with Fv/Fm []. On the other hand, in experiments using Pinus taeda, gs increased under high temperatures, while net photosynthesis showed a decrease []. This seems to be a physiological response where the stomata open to increase transpiration in order to regulate plant temperature while photosynthetic activity is reduced. Previous studies like these demonstrate the correlation between LT and physiological responses, providing evidence that TH imaging can be used as a diagnostic tool for stress.
While TH imaging enables the real-time analysis of spatial and temporal variations, its sensitivity to environmental changes underscores the importance of calibration. Various TH indices, such as the modified CWSI, can compensate for this, but accurately diagnosing stress can be challenging due to the real-time fluctuation in leaf energy balance influenced by the surrounding environmental conditions [,,,,]. However, establishing a system to measure various environmental factors to improve the effectiveness of the modified CWSI could lead to an increase in the cost of seedling production.
In greenhouse environments, where limitations due to external environmental factors are minimized, there is significant potential for the CWSI’s utilization. In experiments using Firmiana platanifolia, it was found that a simplified CWSI can be effectively used under controlled environmental conditions. The research results showed, similar to this study, that decreased SMC increased LT and CWSI []. However, in this study, fluctuations in calibration values due to the measurement period and weather conditions posed challenges for calculating the CWSI. Therefore, comparing CWSI values measured on different dates may be difficult, and it is deemed necessary to determine stress based on relative CWSI values when measured simultaneously. When utilizing the simplified CWSI, it is advisable to standardize the LT threshold with the SMC threshold during periods of high water stress in greenhouse conditions for calibration purposes and then apply it to the method used in this study. For instance, in the seedling environment used in this study, the Td could be determined based on the threshold SMC. Variations in drought tolerance are anticipated depending on the species and environment, indicating the necessity of accumulating data on such variations for future research [,].
In this study, the threshold SMC at which all seedlings survived was D4 SMC 5.3%, and by D6, some level of recovery was observed even below the threshold, where a significant damage response (wilting) was absent. However, varying survival rates on D6 were observed among pots under the same drought treatment, likely attributed to differences in light intensity and photoperiod due to greenhouse facilities (e.g., minimal shading effects from greenhouse structures such as walls or columns) (Table 3). Therefore, soil environment manipulation considering soil moisture retention capacity will be necessary. Mulching is considered one of the methods to maintain seedling survival during drought by retaining SMC []. Methods such as biodegradable spray mulching in nursery pots can be considered []. Sufficient nitrogen (300 mg N container−1) is also reported to increase drought tolerance in Larix kaempferi, even with limited irrigation []. These nursery regimes are expected to improve the condition of seedlings in a nursery environment and subsequently influence their adaptability after field planting [,].
5. Conclusions
It was found that one-year-old Larix kaempferi seedlings in nursery pots could survive without irrigation until D4 (SMC: 5.3%). After reaching 0% SMC on D5, rehydration on the following day (D6) was able to reduce the mortality rate. The PRI, Fm, and TH parameters (CWSI and LTD) exhibited sensitive stress responses using optical measurement methods on D6. The greenhouse applicability was assessed in the order of TH imaging, PRI, and Fm. In particular, TH imaging emerged as a significant factor in distinguishing drought stress according to PCA results, showing the highest potential for detecting SMC thresholds. These findings provide foundational data for establishing an effective irrigation regime using optical measurements for Larix kaempferi in nursery pots under greenhouse conditions.
Author Contributions
Conceptualization, U.J., S.H.H. and E.J.C.; methodology, U.J. and E.J.C.; resources, S.H.H.; investigation, U.J., D.K. and S.K.; analysis, U.J., S.H.H. and D.K.; writing—original draft preparation, U.J.; writing—review and editing, U.J., S.H.H. and E.J.C.; visualization, U.J. and D.K.; supervision, U.J., S.H.H. and E.J.C.; project administration, E.J.C.; funding acquisition, S.H.H. All authors have read and agreed to the published version of the manuscript.
Funding
This research was funded by the National Institute of Forest Science, grant number SC0300-2023-01-2023.
Data Availability Statement
The data presented in this study are available upon request from the corresponding authors.
Conflicts of Interest
The authors declare no conflicts of interest.
References
- Plesa, I.M.; González-Orenga, S.; Al Hassan, M.; Sestras, A.F.; Vicente, O.; Prohens, J.; Sestras, R.E.; Boscaiu, M. Effects of drought and salinity on European Larch (Larix decidua Mill.) seedlings. Forests 2018, 9, 320. [Google Scholar] [CrossRef]
- Sparks, A.M.; Talhelm, A.F.; Feltrin, R.P.; Smith, A.M.; Johnson, D.M.; Kolden, C.A.; Boschetti, L. An experimental assessment of the impact of drought and fire on western larch injury, mortality and recovery. Int. J. Wildland Fire 2018, 27, 490–497. [Google Scholar] [CrossRef]
- Kitao, M.; Agathokleous, E.; Harayama, H.; Kitaoka, S.; Uemura, A.; Yazaki, K.; Tobita, H. Tolerance of Japanese larch to drought is modified by nitrogen and water regimes during cultivation of container seedlings. Eur. J. For. Res. 2022, 141, 699–712. [Google Scholar] [CrossRef]
- Bhusal, N.; Lee, M.; Han, A.R.; Han, A.; Kim, H.S. Responses to drought stress in Prunus sargentii and Larix kaempferi seedlings using morphological and physiological parameters. For. Ecol. Manag. 2020, 465, 118099. [Google Scholar] [CrossRef]
- Noh, N.J.; Kim, G.J.; Son, Y.; Cho, M.S. Early growth responses of Larix kaempferi (Lamb.) carr. seedling to short-term extreme climate events in summer. Forests 2021, 12, 1595. [Google Scholar] [CrossRef]
- Sasani, N.; Pâques, L.E.; Boulanger, G.; Singh, A.P.; Gierlinger, N.; Rosner, S.; Brendel, O. Physiological and anatomical responses to drought stress differ between two larch species and their hybrid. Trees 2021, 35, 1467–1484. [Google Scholar] [CrossRef] [PubMed]
- Korea Forest Service. Statistical Yearbook of Forestry; Korea Forest Service: Daejeon, Republic of Korea, 2023. (In Korean) [Google Scholar]
- Dulamsuren, C.; Hauck, M.; Leuschner, C. Recent drought stress leads to growth reductions in Larix sibirica in the western Khentey, Mongolia. Glob. Chang. Biol. 2010, 16, 3024–3035. [Google Scholar] [CrossRef]
- Zhang, X.; Li, X.; Manzanedo, R.D.; D’Orangeville, L.; Lv, P.; Wang, C.; Xu, C.; Hou, M.; Huang, X.; Rademacher, T. High risk of growth cessation of planted larch under extreme drought. Environ. Res. Lett. 2021, 16, 014040. [Google Scholar] [CrossRef]
- Naik, M.S.; Desai, S.; Sairam, K.; Chaitra, S.N. IoT-Based Nursery Management System. In Advances in Artificial Intelligence and Data Engineering: Select Proceedings of AIDE 2019, 1st ed.; Chiplunkar, N.N., Fukao, T., Eds.; Springer Nature: Singapore, 2020; Volume 1133, pp. 1335–1344. [Google Scholar]
- Dünisch, O. Relationship between the anatomical structure and the swelling of conditioned wood surfaces. IAWA J. 2013, 34, 197–208. [Google Scholar] [CrossRef]
- Sicher, R.C.; Timlin, D.; Bailey, B. Responses of growth and primary metabolism of water-stressed barley roots to rehydration. J. Plant Physiol. 2012, 169, 686–695. [Google Scholar] [CrossRef]
- Florea, A.; Popa, D.I.; Morariu, D.; Maniu, I.; Berntzen, L.; Fiore, U. Digital farming based on a smart and user-friendly IoT irrigation system: A conifer nursery case study. IET Cyber-Phys. Syst. Theory Appl. 2023, 9, 150–168. [Google Scholar] [CrossRef]
- South, D.B.; Starkey, T.E.; Enebak, S.A. Forest nursery practices in the southern United States. Reforesta 2016, 1, 106–146. [Google Scholar] [CrossRef]
- Korea Forest Service. The Guidelines for Seed and Nursery Practices; Korea Forest Service: Daejeon, Republic of Korea, 2020. (In Korean) [Google Scholar]
- Arnon, D.I. Copper enzymes in isolated chloroplasts. Polyphenoloxidase in Beta vulgaris. Plant Physiol. 1949, 24, 1–15. [Google Scholar] [CrossRef] [PubMed]
- Boyer, J. Leaf water potentials measured with a pressure chamber. Plant Physiol. 1967, 42, 133–137. [Google Scholar] [CrossRef] [PubMed]
- Smart, R.E.; Bingham, G.E. Rapid estimates of relative water content. Plant Physiol. 1974, 53, 258–260. [Google Scholar] [CrossRef]
- Cernusak, L.A.; Ubierna, N.; Jenkins, M.W.; Garrity, S.R.; Rahn, T.; Powers, H.H.; Hanson, D.T.; Sevanto, S.; Wong, S.C.; McDowell, N.G.; et al. Unsaturation of vapour pressure inside leaves of two conifer species. Sci. Rep. 2018, 8, 7667. [Google Scholar] [CrossRef] [PubMed]
- Batke, S.P.; Yiotis, C.; Elliott-Kingston, C.; Holohan, A.; McElwain, J. Plant responses to decadal scale increments in atmospheric CO2 concentration: Comparing two stomatal conductance sampling methods. Planta 2020, 251, 52. [Google Scholar] [CrossRef] [PubMed]
- Xue, J.; Su, B. Significant Remote Sensing Vegetation Indices: A Review of Developments and Applications. J. Sens. 2017, 2017, 1353691. [Google Scholar] [CrossRef]
- Huang, S.; Tang, L.; Hupy, J.P.; Wang, Y.; Shao, G. A commentary review on the use of normalized difference vegetation index (NDVI) in the era of popular remote sensing. J. For. Res. 2021, 32, 1–6. [Google Scholar] [CrossRef]
- Kyratzis, A.; Skarlatos, D.; Fotopoulos, V.; Vamvakousis, V.; Katsiotis, A. Investigating correlation among NDVI index derived by unmanned aerial vehicle photography and grain yield under late drought stress conditions. Procedia Environ. Sci. 2015, 29, 225–226. [Google Scholar] [CrossRef][Green Version]
- Thapa, S.; Rudd, J.C.; Xue, Q.; Bhandari, M.; Reddy, S.K.; Jessup, K.E.; Liu, S.; Devkota, R.N.; Baker, J.; Baker, S. Use of NDVI for characterizing winter wheat response to water stress in a semi-arid environment. J. Crop Improv. 2019, 33, 633–648. [Google Scholar] [CrossRef]
- Rondeaux, G.; Steven, M.; Baret, F. Optimization of soil-adjusted vegetation indices. Remote Sens. Environ. 1996, 55, 95–107. [Google Scholar] [CrossRef]
- Moustaka, J.; Moustakas, M. Early-stage detection of biotic and abiotic stress on plants by chlorophyll fluorescence imaging analysis. Biosensors 2023, 13, 796. [Google Scholar] [CrossRef] [PubMed]
- Niyogi, K.K. Safety valves for photosynthesis. Curr. Opin. Plant Biol. 2000, 3, 455–460. [Google Scholar] [CrossRef] [PubMed]
- Pineda, M.; Barón, M.; Pérez-Bueno, M.L. Thermal imaging for plant stress detection and phenotyping. Remote Sens. 2020, 13, 68. [Google Scholar] [CrossRef]
- Guilioni, L.; Jones, H.G.; Leinonen, I.; Lhomme, J.P. On the relationships between stomatal resistance and leaf temperatures in thermography. Agric. For. Meteorol. 2008, 148, 1908–1912. [Google Scholar] [CrossRef]
- Berni, J.A.J.; Zarco-Tejada, P.J.; Sepulcre-Cantó, G.; Fereres, E.; Villalobos, F. Mapping canopy conductance and CWSI in olive orchards using high resolution thermal remote sensing imagery. Remote Sens. Environ. 2009, 113, 2380–2388. [Google Scholar] [CrossRef]
- Köksal, E.S.; Candoğan, B.N.; Yıldırım, Y.E.; Yazgan, S. Determination of water use and water stress of cherry trees based on canopy temperature, leaf water potential and resistance. ZEMDIRBYSTE 2010, 97, 57–64. [Google Scholar]
- Yun, S.K.; Kim, S.J.; Nam, E.Y.; Kwon, J.H.; Do, Y.S.; Song, S.Y.; Kim, M.; Choi, Y.; Kim, G.; Shin, H. Evaluation of Water Stress Using Canopy Temperature and Crop Water Stress Index (CWSI) in Peach Trees. J. Bio-Enviorn. Con. 2020, 29, 20–27. (In Korean) [Google Scholar] [CrossRef]
- Zhou, Z.; Majeed, Y.; Naranjo, G.D.; Gambacorta, E.M. Assessment for crop water stress with infrared thermal imagery in precision agriculture: A review and future prospects for deep learning applications. Comput. Electron. Agric. 2021, 182, 106019. [Google Scholar] [CrossRef]
- National Institute of Agricultural Science and Technology. Methods of Soil and Plant Analysis; Rural Development Administration (NIAST): Suwon, Republic of Korea, 2000. (In Korean) [Google Scholar]
- Jones, H.G.; Stoll, M.; Santos, T.; Sousa, C.D.; Chaves, M.M.; Grant, O.M. Use of infrared thermography for monitoring stomatal closure in the field: Application to grapevine. J. Exp. Bot. 2002, 53, 2249–2260. [Google Scholar] [CrossRef] [PubMed]
- Rouse, J.W., Jr.; Deering, D.W.; Schell, J.A.; Harlan, J.C. Monitoring the Vernal Advancement and Retrogradation (Green Wave Effect) of Natural Vegetation; NASA: Greenbelt, MD, USA, 1974. [Google Scholar]
- Daughtry, C.S.; Walthall, C.L.; Kim, M.S.; De Colstoun, E.B.; McMurtrey Iii, J.E. Estimating corn leaf chlorophyll concentration from leaf and canopy reflectance. Remote Sens. Environ. 2000, 74, 229–239. [Google Scholar] [CrossRef]
- Barnes, J.D.; Balaguer, L.; Manrique, E.; Elvira, S.; Davison, A.W. A reappraisal of the use of DMSO for the extraction and determination of chlorophylls a and b in lichens and higher plants. Environ. Exp. Bot. 1992, 32, 85–100. [Google Scholar] [CrossRef]
- Serôdio, J.; Marques da Silva, J.; Catarino, F. Nondestructive Tracing of Migratory Rhythms of Intertidal Benthic Microalgae Using In Vivo Chlorophyll a Fluorescence. J. Phycol. 1997, 33, 542–553. [Google Scholar] [CrossRef]
- Rysgaard, S.; Kühl, M.; Glud, R.N.; Hansen, J.W. Biomass, production and horizontal patchiness of sea ice algae in a high-Arctic fjord (Young Sound, NE Greenland). Mar. Ecol. Prog. Ser. 2001, 223, 15–26. [Google Scholar] [CrossRef]
- Schreiber, U.; Schliwa, U.; Bilger, W. Continuous recording of photochemical and non-photochemical chlorophyll fluorescence quenching with a new type of modulation fluorometer. Photosynth. Res. 1986, 10, 51–62. [Google Scholar] [CrossRef]
- Bilger, W.; Björkman, O. Role of the xanthophyll cycle in photoprotection elucidated by measurements of light-induced absorbance changes, fluorescence and photosynthesis in leaves of Hedera canariensis. Photosynth. Res. 1990, 25, 173–185. [Google Scholar] [CrossRef]
- Lichtenthaler, H.K.; Buschmann, C.; Knapp, M. How to correctly determine the different chlorophyll fluorescence parameters and the chlorophyll fluorescence decrease ratio RFd of leaves with the PAM fluorometer. Photosynthetica 2005, 43, 379–393. [Google Scholar]
- Jones, H.G. Plants and Microclimate: A Quantitative Approach to Environmental Plant Physiology, 3rd ed.; Cambridge University Press: New York, NY, USA, 2013. [Google Scholar]
- Flexas, J.; Gallé, A.; Galmés, J.; Ribas-Carbo, M.; Medrano, H. The response of photosynthesis to soil water stress. In Plant Responses to Drought Stress: From Morphological to Molecular Features; Aroca, R., Ed.; Springer: Heidelberg, Germany, 2012; pp. 129–144. [Google Scholar]
- Bartlett, M.K.; Klein, T.; Jansen, S.; Choat, B.; Sack, L. The correlations and sequence of plant stomatal, hydraulic, and wilting responses to drought. Proc. Natl. Acad. Sci. USA 2016, 113, 13098–13103. [Google Scholar] [PubMed]
- Blake, T.J.; Li, J. Hydraulic adjustment in jack pine and black spruce seedlings under controlled cycles of dehydration and rehydration. Physiol. Plant. 2003, 117, 532–539. [Google Scholar] [CrossRef]
- Rolando, C.A.; Little, K.M. Measuring water stress in Eucalyptus grandis Hill ex Maiden seedlings planted into pots. S. Afr. J. Bot. 2008, 74, 133–138. [Google Scholar] [CrossRef][Green Version]
- Turner, N.C. Imposing and maintaining soil water deficits in drought studies in pots. Plant Soil 2019, 439, 45–55. [Google Scholar] [CrossRef]
- Brodribb, T.J.; Cochard, H. Hydraulic failure defines the recovery and point of death in water-stressed conifers. Plant Physiol. 2009, 149, 575–584. [Google Scholar] [CrossRef] [PubMed]
- Ang, M.C.Y.; Lew, T.T.S. Non-destructive technologies for plant health diagnosis. Front. Plant Sci. 2022, 13, 884454. [Google Scholar] [CrossRef] [PubMed]
- Asaari, M.S.M.; Mertens, S.; Verbraeken, L.; Dhondt, S.; Inzé, D.; Bikram, K.; Scheunders, P. Non-destructive analysis of plant physiological traits using hyperspectral imaging: A case study on drought stress. Comput. Electron. Agric. 2022, 195, 106806. [Google Scholar] [CrossRef]
- Ye, D.; Wu, L.; Li, X.; Atoba, T.O.; Wu, W.; Weng, H. A synthetic review of various dimensions of non-destructive plant stress phenotyping. Plants 2023, 12, 1698. [Google Scholar] [CrossRef] [PubMed]
- Thénot, F.; Méthy, M.; Winkel, T. The Photochemical Reflectance Index (PRI) as a water-stress index. Int. J. Remote Sens. 2002, 23, 5135–5139. [Google Scholar] [CrossRef]
- Kovar, M.; Brestic, M.; Sytar, O.; Barek, V.; Hauptvogel, P.; Zivcak, M. Evaluation of hyperspectral reflectance parameters to _gassess the leaf water content in soybean. Water 2019, 11, 443. [Google Scholar] [CrossRef]
- Zarco-Tejada, P.J.; González-Dugo, V.; Williams, L.E.; Suarez, L.; Berni, J.A.; Goldhamer, D.; Fereres, E. A PRI-based water stress index combining structural and chlorophyll effects: Assessment using diurnal narrow-band airborne imagery and the CWSI thermal index. Remote Sens. Environ. 2013, 138, 38–50. [Google Scholar] [CrossRef]
- Tan, C.W.; Wang, D.L.; Zhou, J.; Du, Y.; Luo, M.; Zhang, Y.J.; Guo, W.S. Assessment of Fv/Fm absorbed by wheat canopies employing in-situ hyperspectral vegetation indexes. Sci. Rep. 2018, 8, 9525. [Google Scholar] [CrossRef]
- Nakaji, T.; Takeda, T.; Mukai, Y.; Koike, T.; Oguma, H.; Fujinuma, Y. Relationships between Photosynthesis and Spectral Reflectance Indices in Japanese Larch Needles. J. Jpn. For. Soc. 2003, 85, 205–213. (In Japanese) [Google Scholar]
- Suárez, L.; Zarco-Tejada, P.J.; Sepulcre-Cantó, G.; Pérez-Priego, O.; Miller, J.R.; Jiménez-Muñoz, J.C.; Sobrino, J. Assessing canopy PRI for water stress detection with diurnal airborne imagery. Remote Sens. Environ. 2008, 112, 560–575. [Google Scholar] [CrossRef]
- Suárez, L.; Zarco-Tejada, P.J.; Berni, J.A.J.; González-Dugo, V.; Fereres, E. Modelling PRI for water stress detection using radiative transfer models. Remote Sens. Environ. 2009, 113, 730–744. [Google Scholar] [CrossRef]
- Panigada, C.; Rossini, M.; Meroni, M.; Cilia, C.; Busetto, L.; Amaducci, S.; Boschetti, M.; Cogliati, S.; Picchi, V.; Pinto, F.; et al. Fluorescence, PRI and canopy temperature for water stress detection in cereal crops. Int. J. Appl. Earth Obs. Geoinf. 2014, 30, 167–178. [Google Scholar] [CrossRef]
- Banks, J.M. Chlorophyll fluorescence as a tool to identify drought stress in Acer genotypes. Environ. Exp. Bot. 2018, 155, 118–127. [Google Scholar] [CrossRef]
- Arief, M.A.A.; Kim, H.; Kurniawan, H.; Nugroho, A.P.; Kim, T.; Cho, B.K. Chlorophyll fluorescence imaging for early detection of drought and heat stress in strawberry plants. Plants 2023, 12, 1387. [Google Scholar] [CrossRef] [PubMed]
- Sandmann, M.; Grosch, R.; Graefe, J. The use of features from fluorescence, thermography, and NDVI imaging to detect biotic stress in lettuce. Plant Dis. 2018, 102, 1101–1107. [Google Scholar] [CrossRef] [PubMed]
- Xia, Q.; Tang, H.; Fu, L.; Tan, J.; Govindjee, G.; Guo, Y. Determination of Fv/Fm from chlorophyll a fluorescence without dark adaptation by an LSSVM model. Plant Phenomics 2023, 5, 0034. [Google Scholar] [CrossRef] [PubMed]
- Belin, É.; Rousseau, D.; Boureau, T.; Caffier, V. Thermography versus chlorophyll fluorescence imaging for detection and quantification of apple scab. Comput. Electron. Agric. 2013, 90, 159–163. [Google Scholar] [CrossRef]
- Granum, E.; Pérez-Bueno, M.L.; Calderón, C.E.; Ramos, C.; de Vicente, A.; Cazorla, F.M.; Barón, M. Metabolic responses of avocado plants to stress induced by Rosellinia necatrix analysed by fluorescence and thermal imaging. Eur. J. Plant Pathol. 2015, 142, 625–632. [Google Scholar]
- Saglam, A.; Chaerle, L.; Van Der Straeten, D.; Valcke, R. Promising monitoring techniques for plant science: Thermal and chlorophyll fluorescence imaging. In Photosynthesis, Productivity and Environmental Stress; Wiley: Hoboken, NJ, USA, 2019; pp. 241–266. [Google Scholar]
- Wang, L.; Poque, S.; Valkonen, J.P. Phenotyping viral infection in sweetpotato using a high-throughput chlorophyll fluorescence and thermal imaging platform. Plant Methods 2019, 15, 116. [Google Scholar] [CrossRef] [PubMed]
- Vítek, P.; Veselá, B.; Klem, K. Spatial and temporal variability of plant leaf responses cascade after PSII inhibition: Raman, chlorophyll fluorescence and infrared thermal imaging. Sensors 2020, 20, 1015. [Google Scholar] [CrossRef] [PubMed]
- Smigaj, M.; Gaulton, R.; Suarez, J.C.; Barr, S.L. Use of miniature thermal cameras for detection of physiological stress in conifers. Remote Sens. 2017, 9, 957. [Google Scholar] [CrossRef]
- Jones, H.G. Use of infrared thermometry for estimation of stomatal conductance as a possible aid to irrigation scheduling. Agric. For. Meteorol. 1999, 95, 139–149. [Google Scholar] [CrossRef]
- Bajons, P.; Klinger, G.; Schlosser, V. Determination of stomatal conductance by means of infrared thermography. Infrared Phys. Technol. 2005, 46, 429–439. [Google Scholar] [CrossRef]
- Siddiqui, Z.S.; Cho, J.I.; Park, S.H.; Kwon, T.R.; Ahn, B.O.; Lee, G.S.; Jeong, M.J.; Kim, K.W.; Lee, S.K.; Park, S.C. Phenotyping of rice in salt stress environment using high-throughput infrared imaging. Acta Bot. Croat. 2014, 73, 149–158. [Google Scholar] [CrossRef]
- Sobejano-Paz, V.; Mikkelsen, T.N.; Baum, A.; Mo, X.; Liu, S.; Köppl, C.J.; Johnson, M.S.; Gulyas, L.; García, M. Hyperspectral and thermal sensing of stomatal conductance, transpiration, and photosynthesis for soybean and maize under drought. Remote Sens. 2020, 12, 3182. [Google Scholar] [CrossRef]
- Grant, O.M.; Chaves, M.M.; Jones, H.G. Optimizing thermal imaging as a technique for detecting stomatal closure induced by drought stress under greenhouse conditions. Physiol. Plant. 2006, 127, 507–518. [Google Scholar] [CrossRef]
- Grant, O.M.; Tronina, Ł.; Ramalho, J.C.; Kurz Besson, C.; Lobo-do-Vale, R.; Santos Pereira, J.; Jones, H.G.; Chaves, M.M. The impact of drought on leaf physiology of Quercus suber L. trees: Comparison of an extreme drought event with chronic rainfall reduction. J. Exp. Bot. 2010, 61, 4361–4371. [Google Scholar] [CrossRef]
- Urban, J.; Ingwers, M.W.; McGuire, M.A.; Teskey, R.O. Increase in leaf temperature opens stomata and decouples net photosynthesis from stomatal conductance in Pinus taeda and Populus deltoides x nigra. J. Exp. Bot. 2017, 68, 1757–1767. [Google Scholar] [CrossRef]
- Jones, H.G.; Leinonen, I. Thermal imaging for the study of plant water relations. J. Agric. Meteorol. 2003, 59, 205–217. [Google Scholar] [CrossRef]
- Dhillon, R.; Rojo, F.; Roach, J.; Upadhyaya, S.; Delwiche, M.A. Continuous leaf monitoring system for precision irrigation management in orchard crops. Tarım Mak. Bilim. Derg. 2014, 10, 267–272. [Google Scholar]
- Prashar, A.; Jones, H.G. Assessing drought responses using thermal infrared imaging. In Environmental Responses in Plants; Humana Press: New York, NY, USA, 2016; pp. 209–219. [Google Scholar]
- Camoglu, G.; Demirel, K.; Genc, L. Use of infrared thermography and hyperspectral data to detect effects of water stress on pepper. Quant. InfraRed Thermogr. J. 2018, 15, 81–94. [Google Scholar] [CrossRef]
- Lee, W.; Choi, H.M.; Kim, D.; Honda, Y.; Guo, Y.L.L.; Kim, H. Synergic effect between high temperature and air pollution on mortality in Northeast Asia. Environ. Res. 2019, 178, 108735. [Google Scholar] [CrossRef]
- Yu, M.H.; Ding, G.D.; Gao, G.L.; Zhao, Y.Y.; Yan, L.; Sai, K. Using plant temperature to evaluate the response of stomatal conductance to soil moisture deficit. Forests 2015, 6, 3748–3762. [Google Scholar] [CrossRef]
- Mao, Z.; Jiang, H.; Wang, Y.; Zu, Y.; Voronin, P.Y. Water balance of birch and larch leaves and their resistance to short and progressive soil drought. Russ. J. Plant Physiol. 2004, 51, 697–701. [Google Scholar] [CrossRef]
- Waseem, M.; Ali, A.; Tahir, M.; Nadeem, M.A.; Ayub, M.; Tanveer, A.; Ahmad, R.; Hussain, M. Mechanism of drought tolerance in plant and its management through different methods. Cont. J. Agric. Sci. 2011, 5, 10–25. [Google Scholar]
- Kader, M.A.; Senge, M.; Mojid, M.A.; Ito, K. Recent advances in mulching materials and methods for modifying soil environment. Soil Tillage Res. 2017, 168, 155–166. [Google Scholar] [CrossRef]
- Santagata, G.; Schettini, E.; Vox, G.; Immirzi, B.; Scarascia Mugnozza, G.; Malinconico, M. Biodegradable spray mulching and nursery pots: New frontiers for research. In Soil Degradable Bioplastics for a Sustainable Modern Agriculture; Springer: Berlin, Germany, 2017; pp. 105–137. [Google Scholar]
- Sanchez-Aguilar, H.; Aldrete, A.; Vargas-Hernandez, J.; Ordaz-Chaparro, V. Influence of container type and color on seedling growth of pine in nursery. Agrociencia 2016, 50, 481–492. [Google Scholar]
- South, D.B.; Starkey, T.E.; Lyons, A. Why healthy pine seedlings die after they leave the nursery. Forests 2023, 14, 645. [Google Scholar] [CrossRef]
Disclaimer/Publisher’s Note: The statements, opinions and data contained in all publications are solely those of the individual author(s) and contributor(s) and not of MDPI and/or the editor(s). MDPI and/or the editor(s) disclaim responsibility for any injury to people or property resulting from any ideas, methods, instructions or products referred to in the content. |
© 2024 by the authors. Licensee MDPI, Basel, Switzerland. This article is an open access article distributed under the terms and conditions of the Creative Commons Attribution (CC BY) license (https://creativecommons.org/licenses/by/4.0/).