


Satellite Remote Sensing Images of Crown Segmentation and Forest Inventory Based on BlendMask

 , ,
, ,
Abstract
:1. Introduction
- Using the satellite remote sensing images of Beijing Jingyue Ecological Forestry as experimental data, using the BlendMask network to segment the crown and identify the species of the trees in the forest field, and counting the number of each type of tree species. respectively.
- Evaluate the inference ability of the model using relevant accuracy-evaluation indexes.
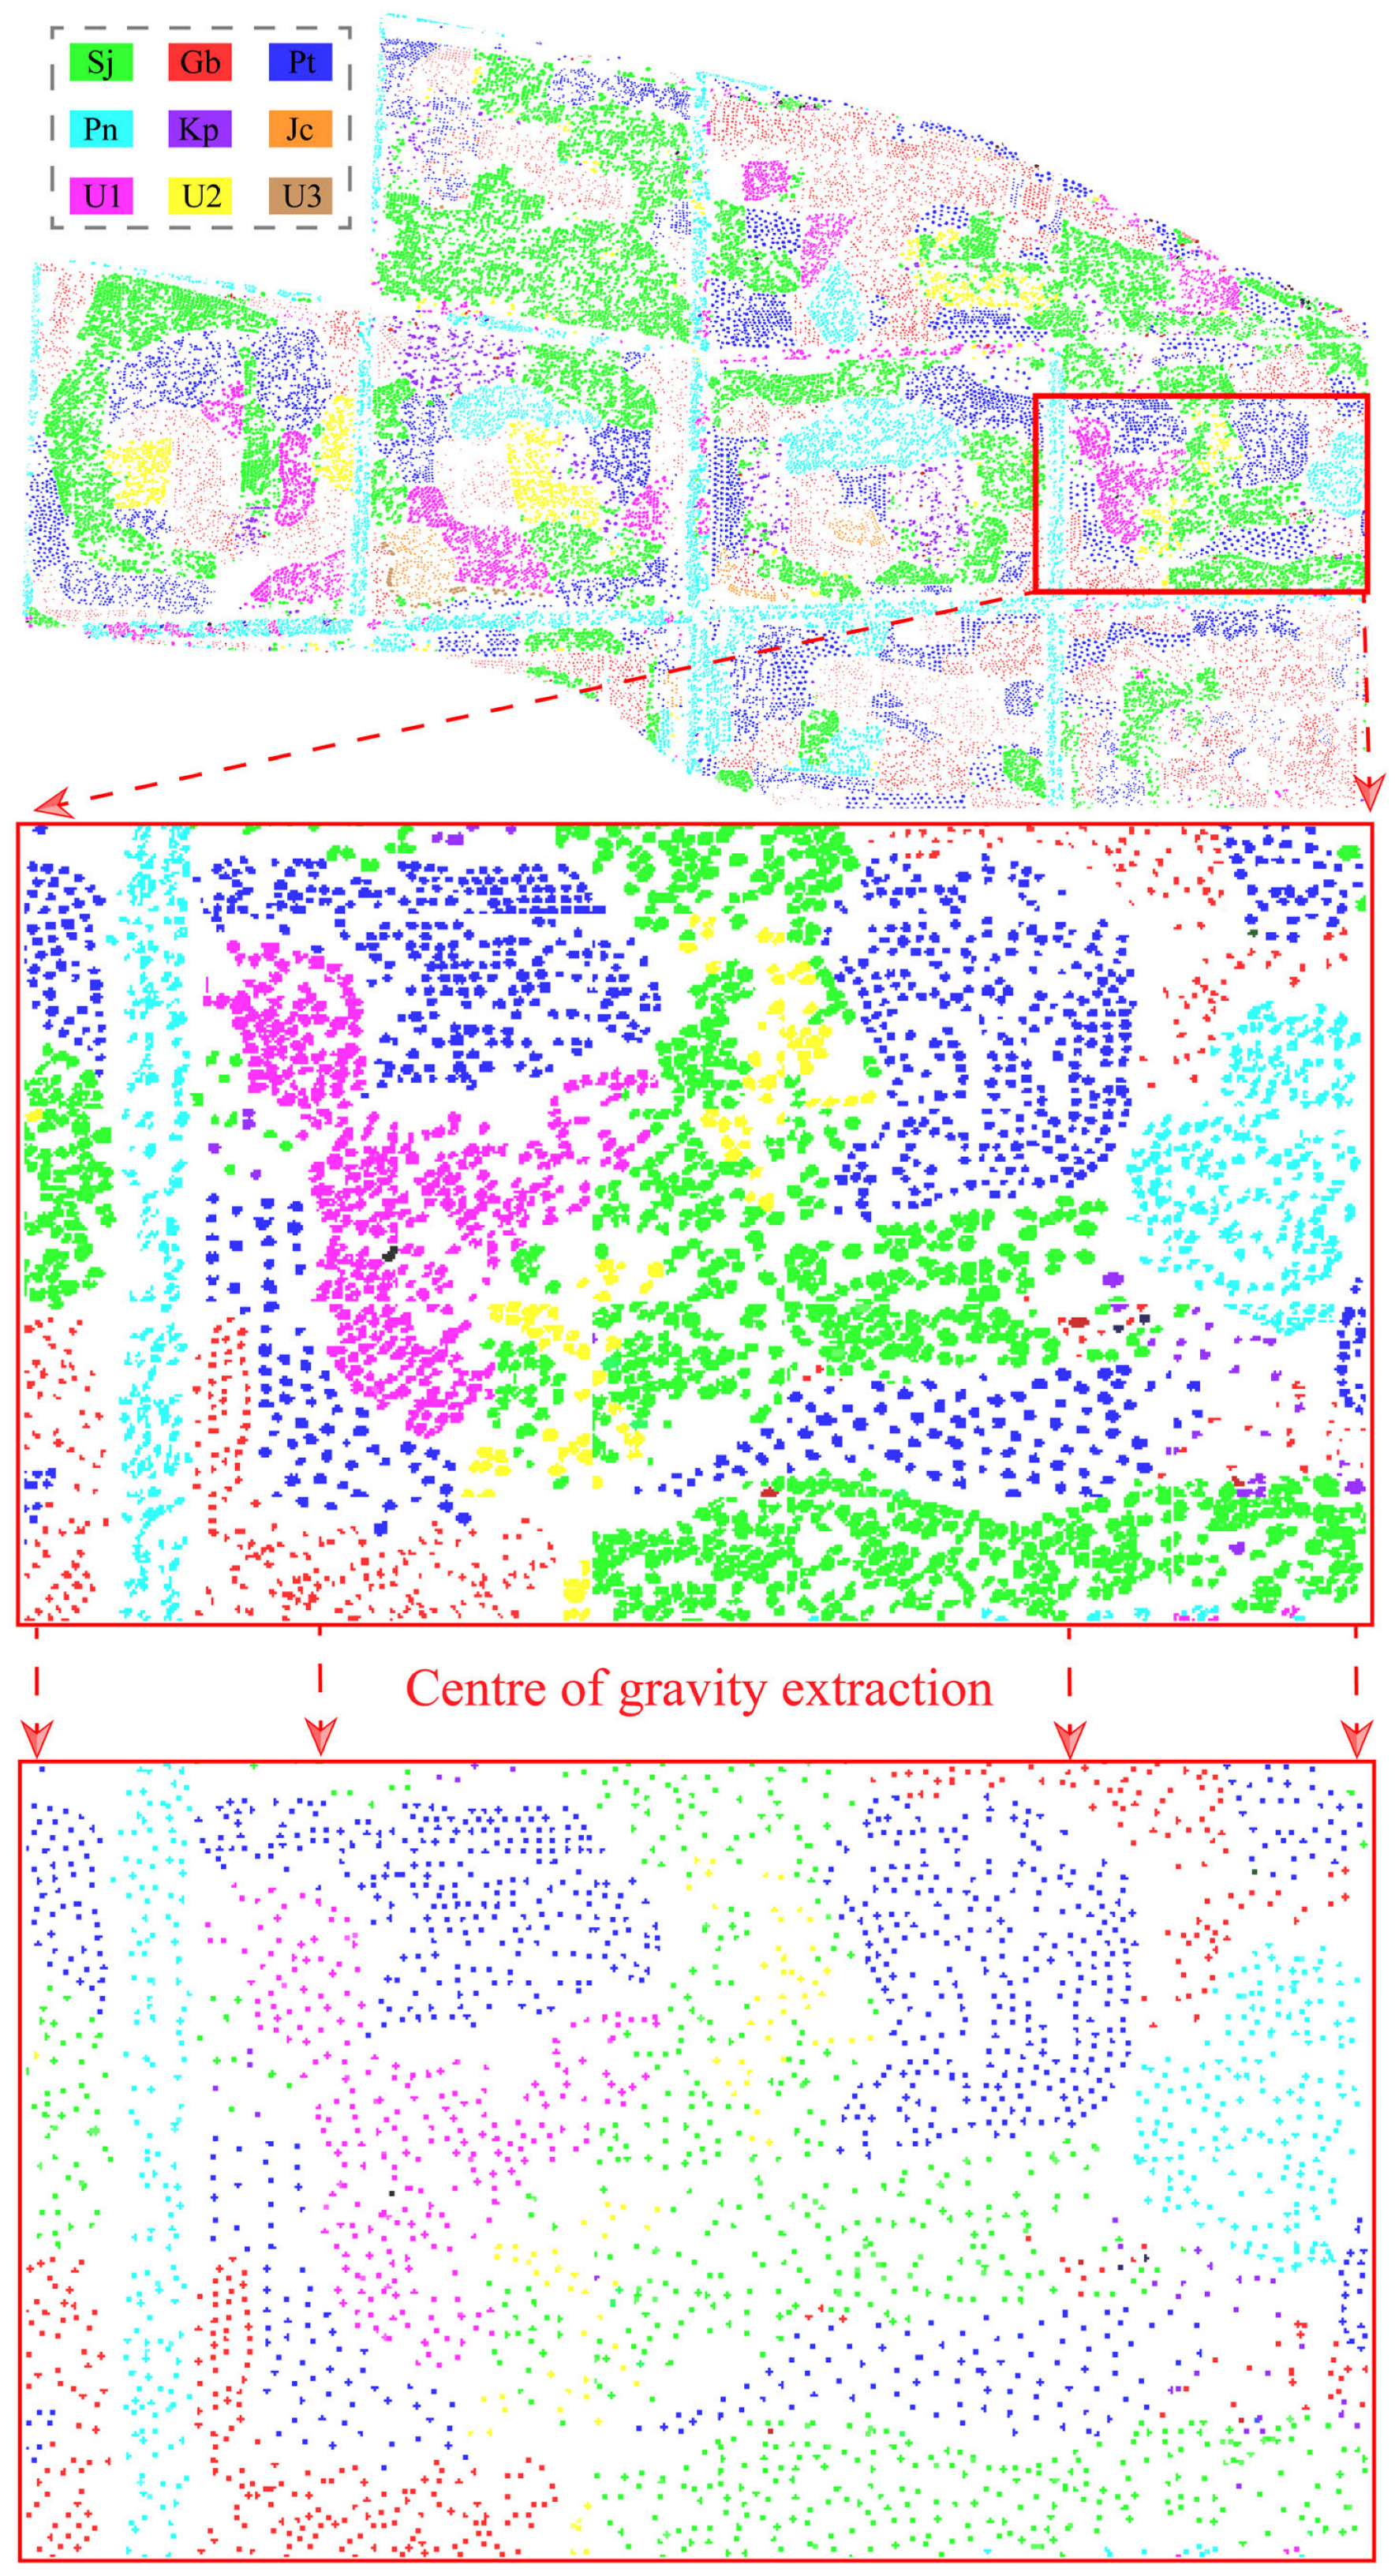
- Positioning of the centre of gravity of individual trees, calculation of forest crown projection area, canopy cover and other indicators based on the results of the model testing.
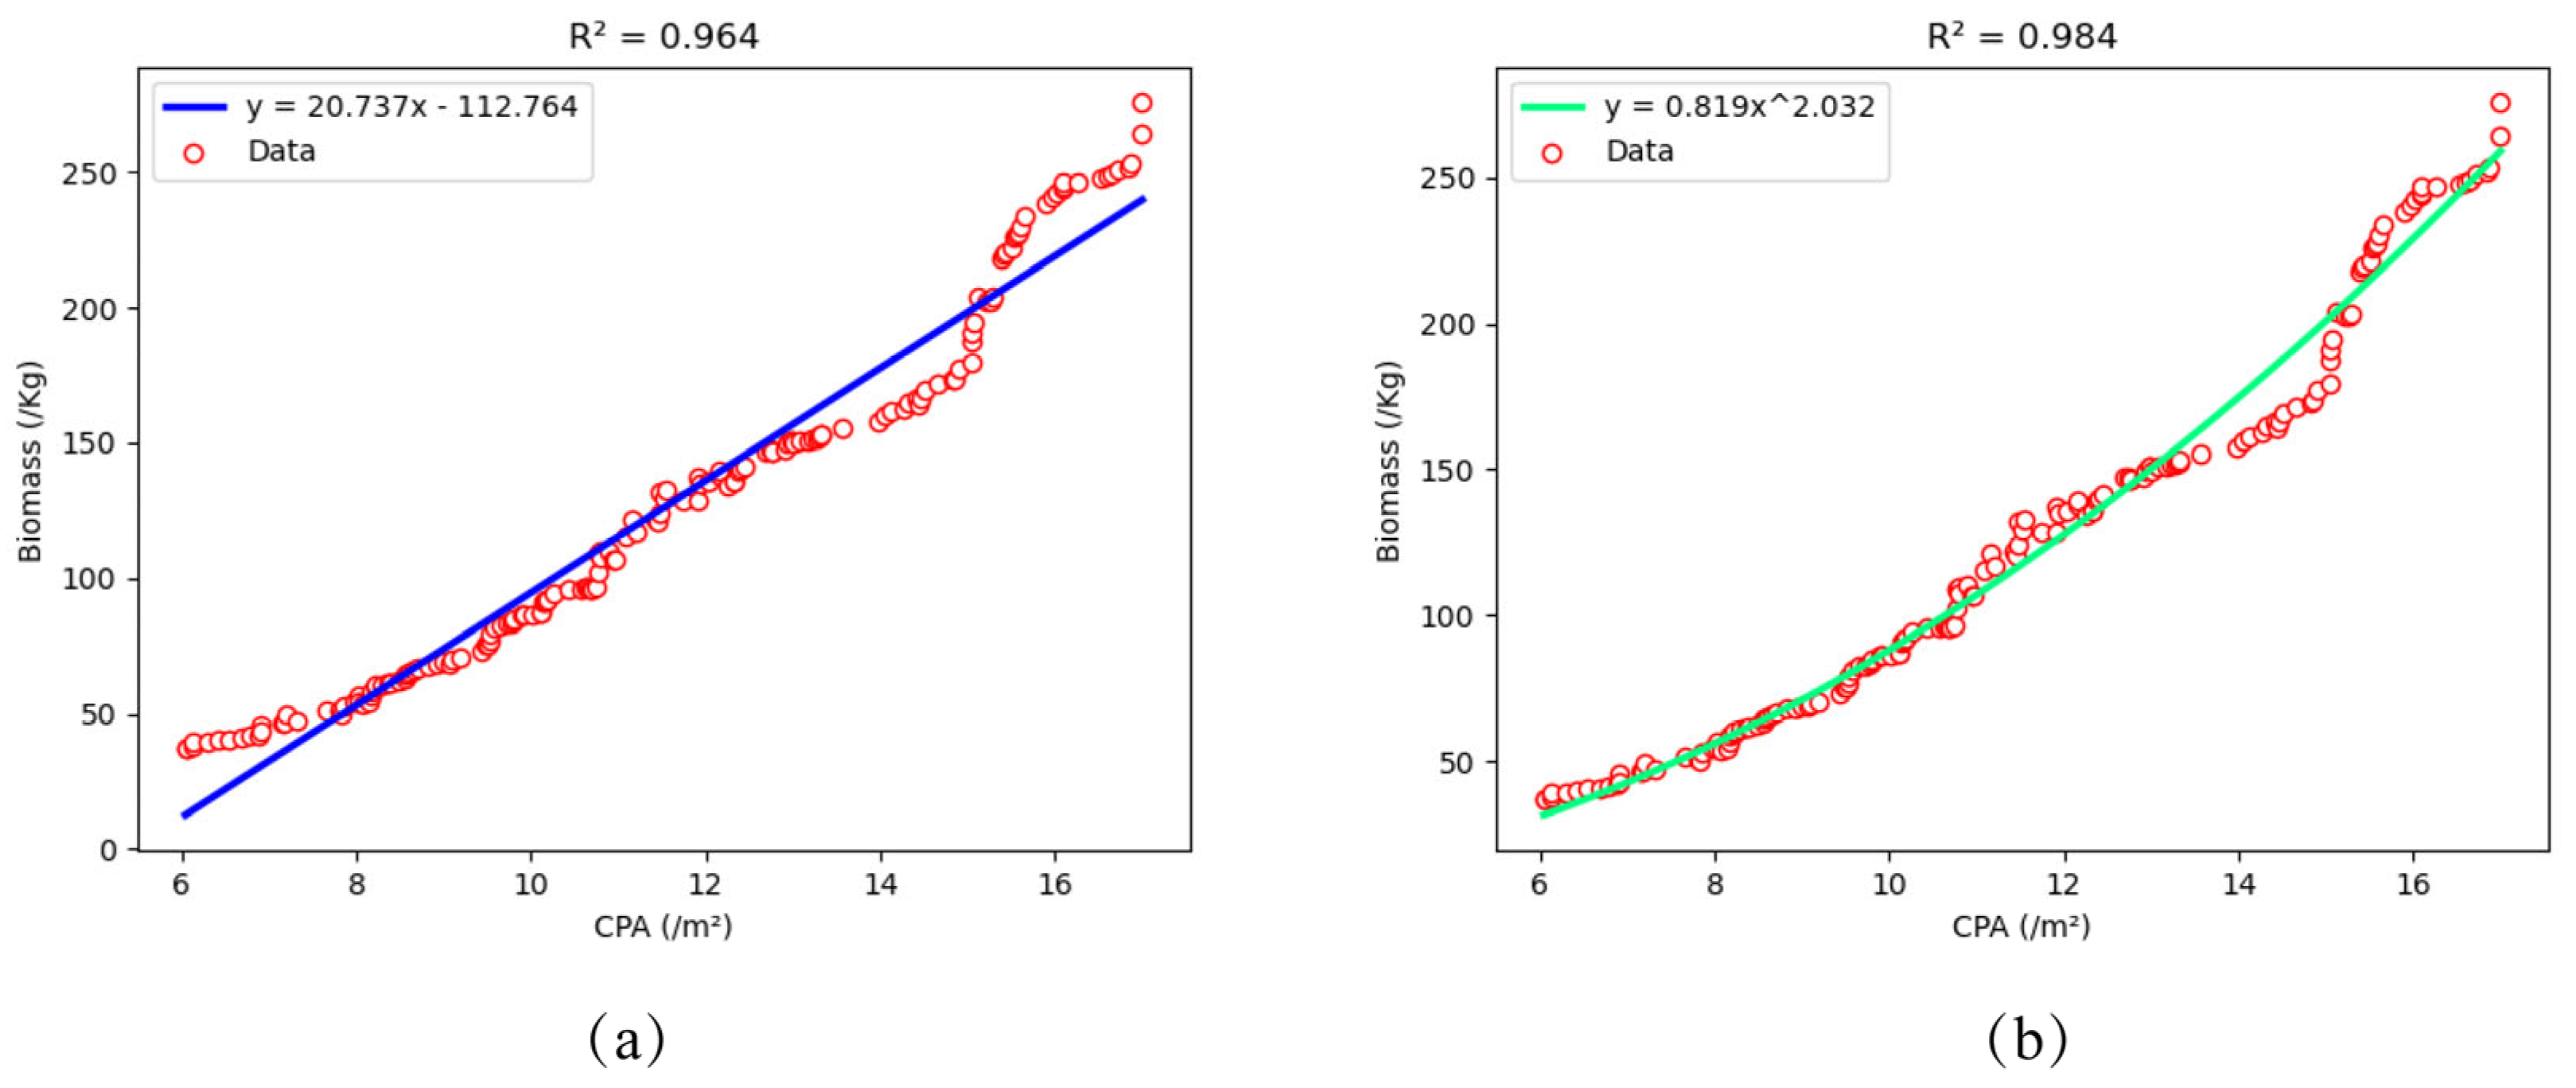
- Establishing biomass regression models for carbon estimation in oil pine (Pinus tabulaeformis) species.
2. Materials and Methods
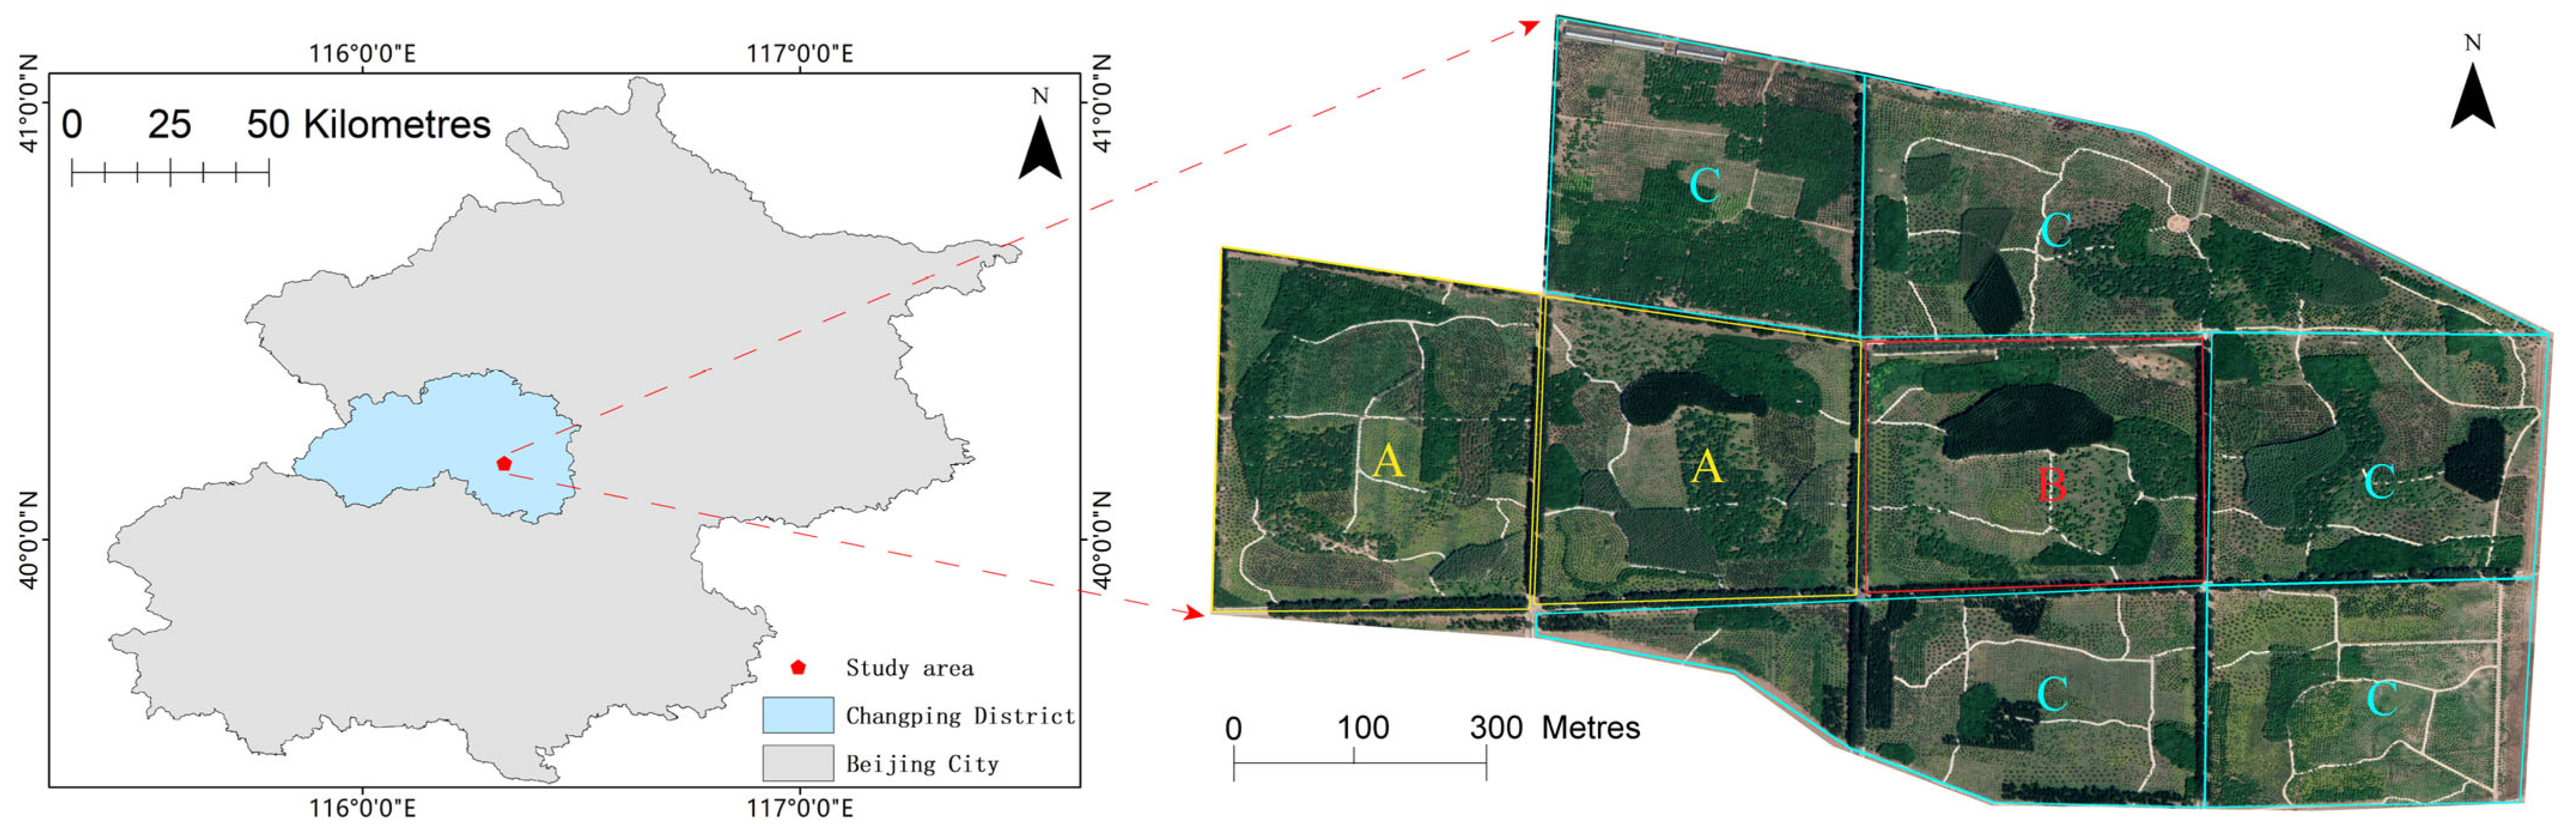
2.1. Study Area
2.2. Collection of Remote Sensing Images and Field Survey
2.3. Data Set Construction
2.4. Overall Workflow
2.5. BlendMask Algorithm
2.6. Model Training
2.7. Precision Evaluation
2.8. Biomass Assessment
3. Results
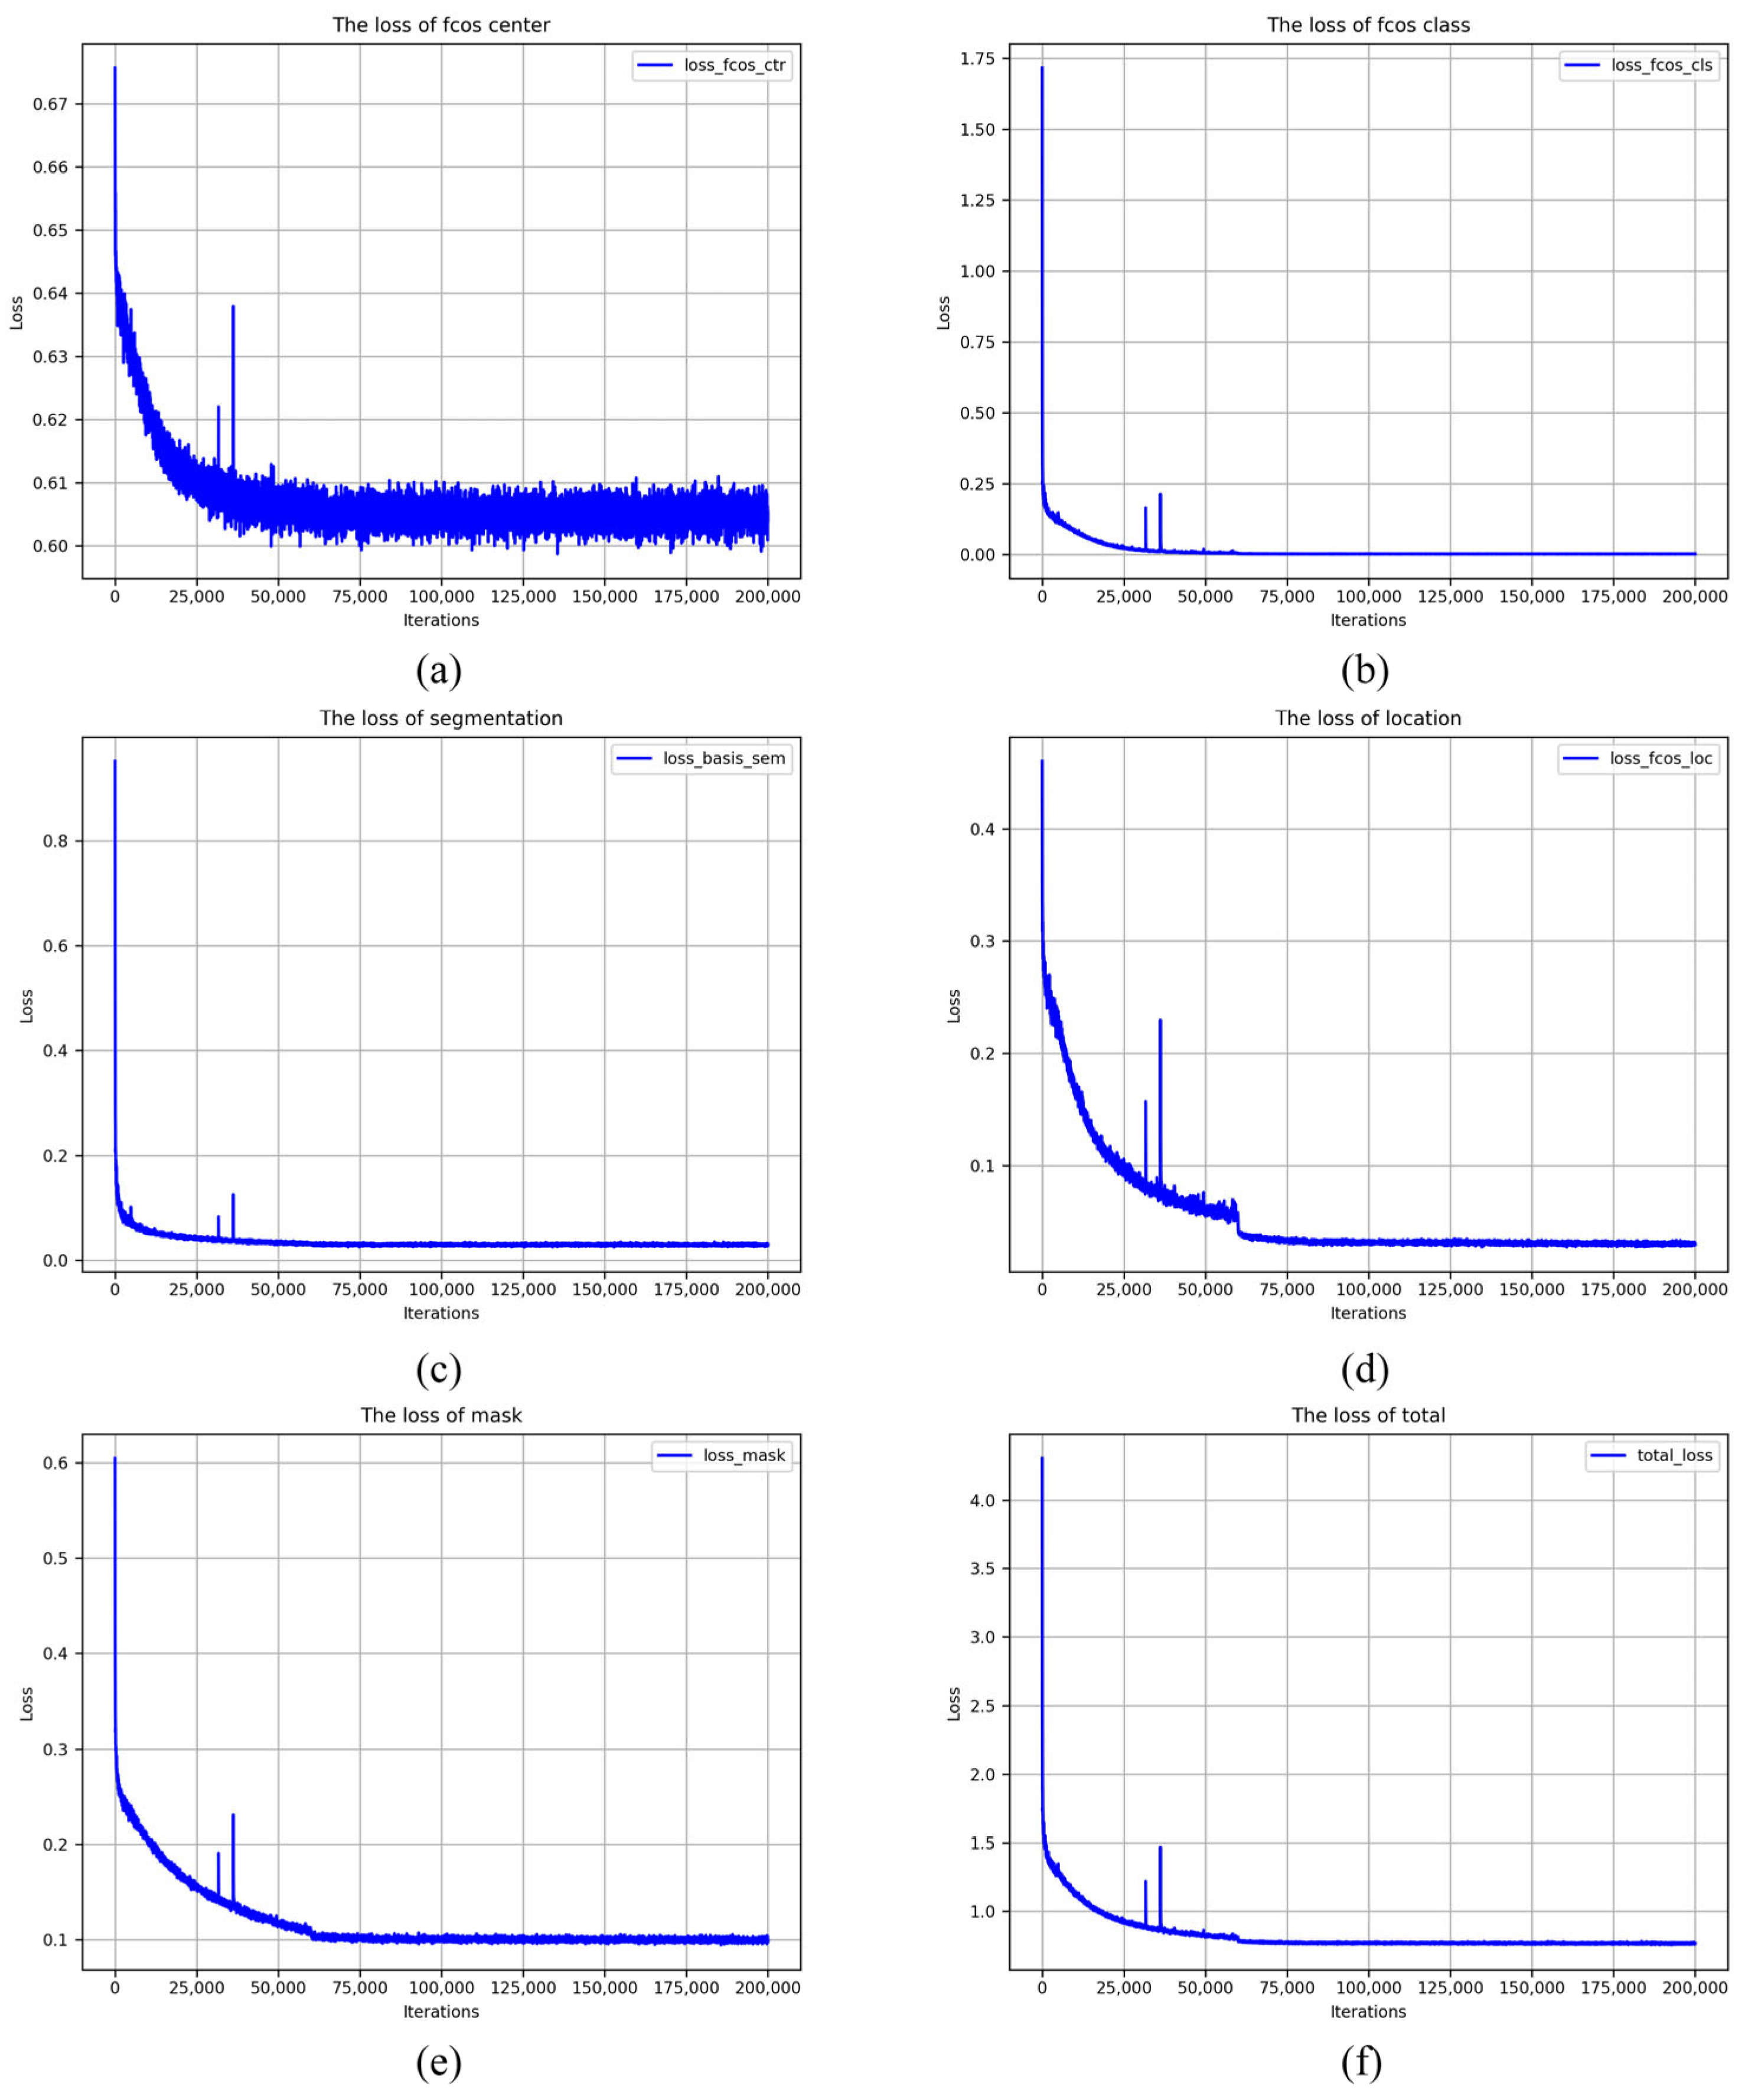
3.1. Model Training Losses
3.2. Validation Accuracy
3.3. Model Detection in the Study Area
3.4. Carbon Assessment of Single Tree Species
4. Discussion
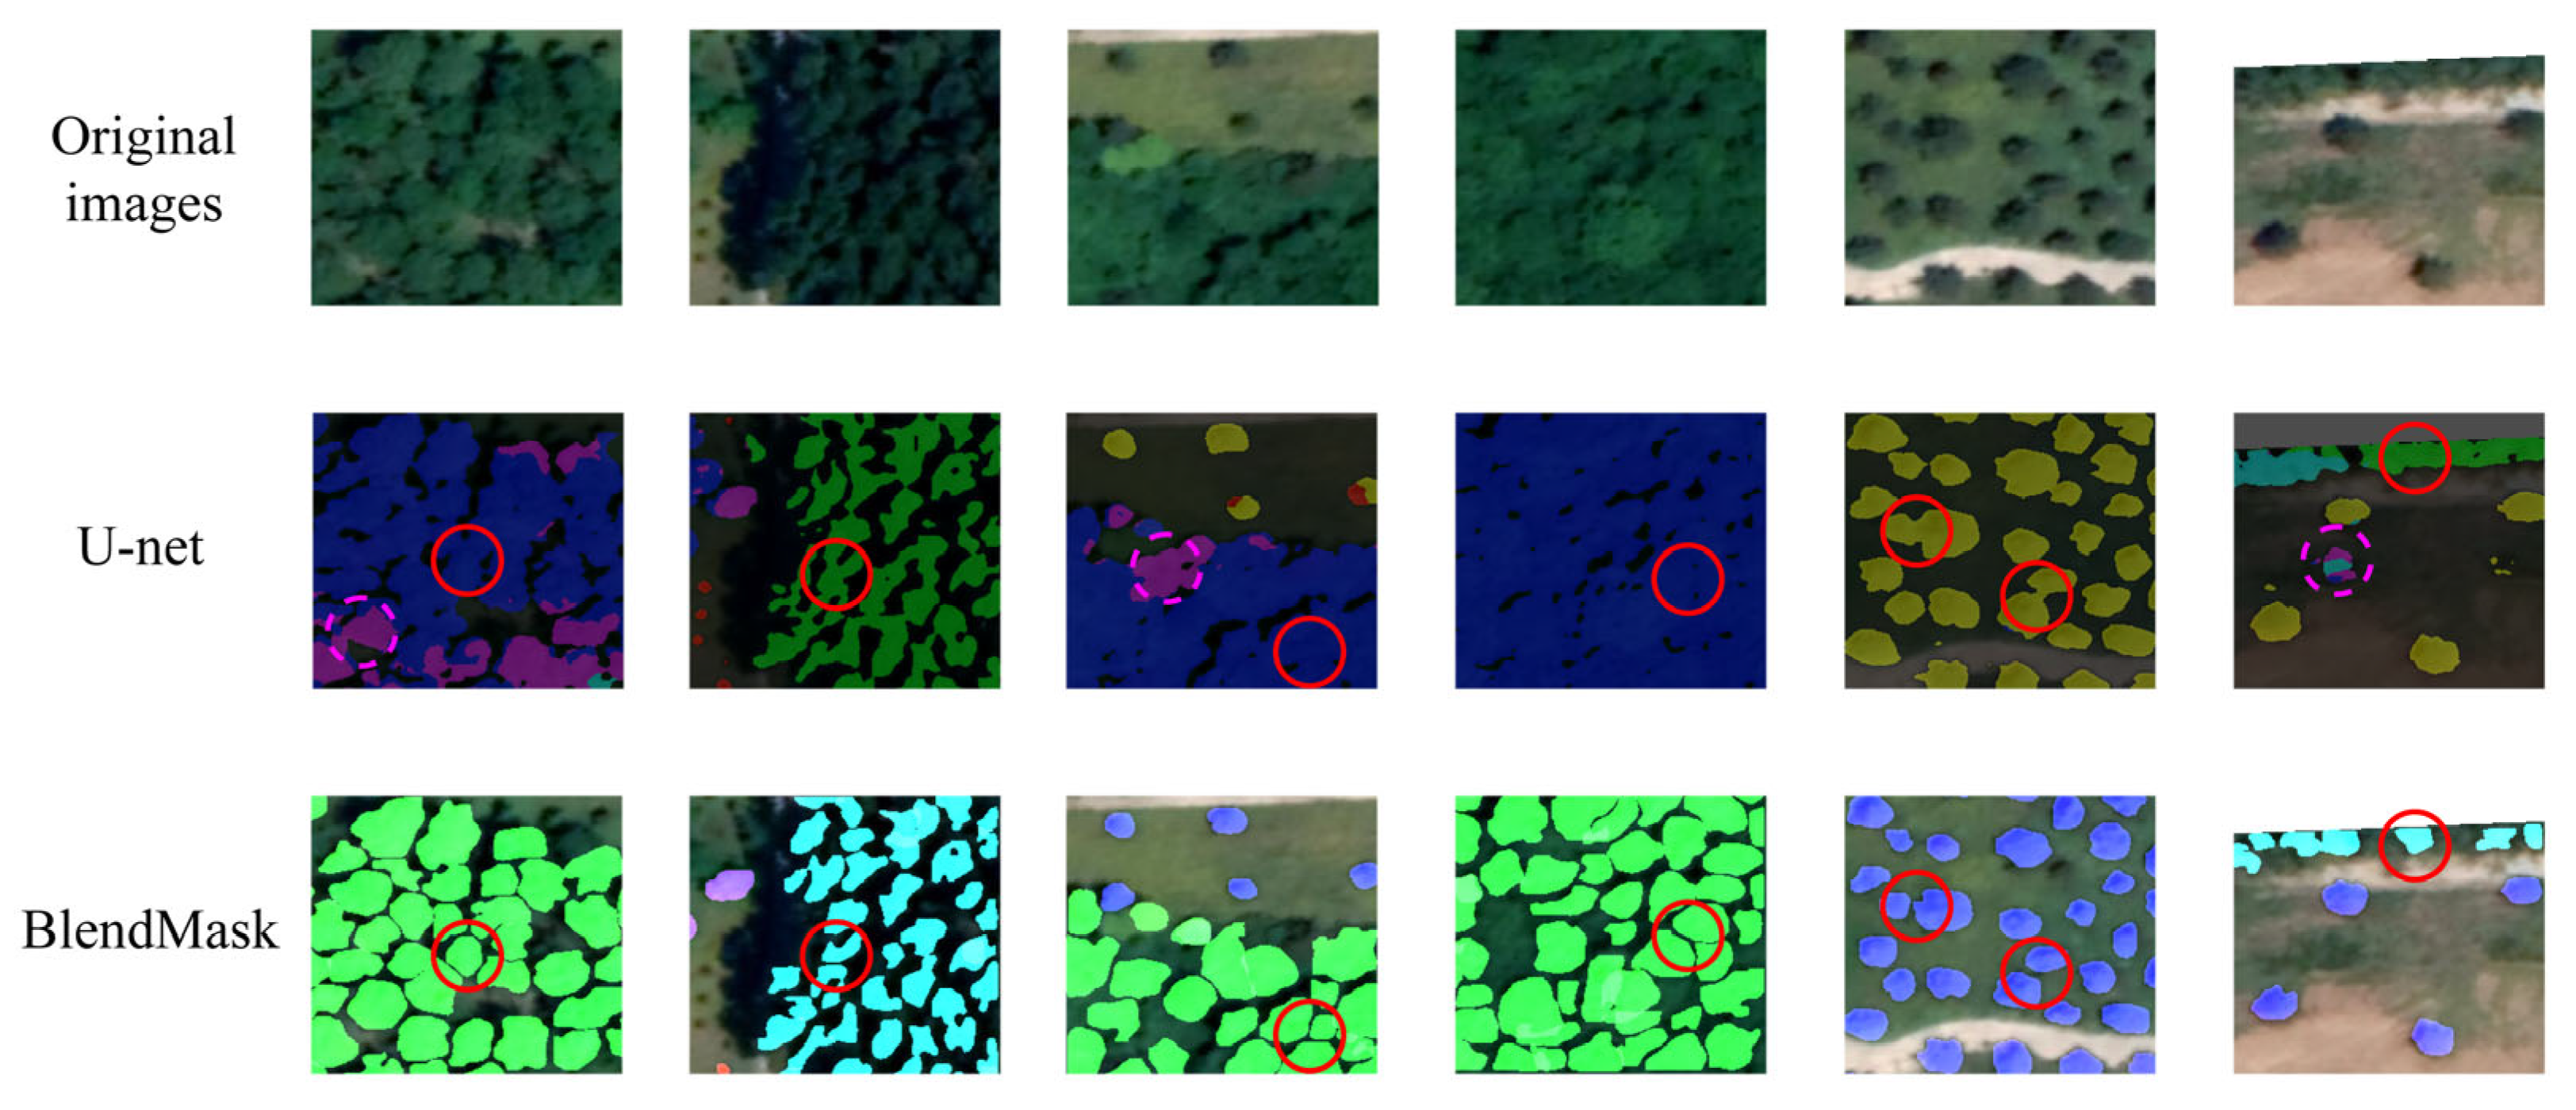
4.1. Comparison of BlendMask with U-Net Network
4.2. Effectiveness of Model Detection in the Study Area
5. Conclusions
Author Contributions
Funding
Data Availability Statement
Acknowledgments
Conflicts of Interest
References
- Costa, G.; Silva, C.; Mendes, K.R.; Bezerra, B.; Rodrigues, T.R.; Silva, J.B.; Dalmagro, H.J.; Nunes, H.; Gomes, A.; Silva, G.; et al. The Relevance of Maintaining Standing Forests for Global Climate Balance: A Case Study in Brazilian Forests. In Tropical Forests—Ecology, Diversity and Conservation Status; IntechOpen: London, UK, 2023; ISBN 978-1-83768-575-2. [Google Scholar]
- Lindner, M.; Maroschek, M.; Netherer, S.; Kremer, A.; Barbati, A.; Garcia-Gonzalo, J.; Seidl, R.; Delzon, S.; Corona, P.; Kolström, M.; et al. Climate Change Impacts, Adaptive Capacity, and Vulnerability of European Forest Ecosystems. For. Ecol. Manag. 2010, 259, 698–709. [Google Scholar] [CrossRef]
- Findlay, A. Climate Mitigation through Indigenous Forest Management. Nat. Clim. Chang. 2021, 11, 371–373. [Google Scholar] [CrossRef]
- Li, L.; Lin, J.; Zhou, J. The Brief Analysis of Problems and Countermeasures for Forest Resources Management. World J. For. 2021, 10, 60. [Google Scholar] [CrossRef]
- Terryn, L.; Calders, K.; Bartholomeus, H.; Bartolo, R.E.; Brede, B.; D’hont, B.; Disney, M.; Herold, M.; Lau, A.; Shenkin, A.; et al. Quantifying Tropical Forest Structure through Terrestrial and UAV Laser Scanning Fusion in Australian Rainforests. Remote Sens. Environ. 2022, 271, 112912. [Google Scholar] [CrossRef]
- Dainelli, R.; Toscano, P.; Di Gennaro, S.F.; Matese, A. Recent Advances in Unmanned Aerial Vehicle Forest Remote Sensing—A Systematic Review. Part I: A General Framework. Forests 2021, 12, 327. [Google Scholar] [CrossRef]
- Harikumar, A.; Bovolo, F.; Bruzzone, L. A Local Projection-Based Approach to Individual Tree Detection and 3-D Crown Delineation in Multistoried Coniferous Forests Using High-Density Airborne LiDAR Data. IEEE Trans. Geosci. Remote Sens. 2018, 57, 1168–1182. [Google Scholar] [CrossRef]
- Sothe, C.; La Rosa, L.E.C.; De Almeida, C.M.; Gonsamo, A.; Schimalski, M.B.; Castro, J.D.B.; Feitosa, R.Q.; Dalponte, M.; Lima, C.L.; Liesenberg, V.; et al. Evaluating a convolutional neural network for feature extraction and tree species classification using uav-hyperspectral images. ISPRS Ann. Photogramm. Remote Sens. Spatial Inf. Sci. 2020. [Google Scholar] [CrossRef]
- Briechle, S.; Krzystek, P.; Vosselman, G. Silvi-Net—A Dual-CNN Approach for Combined Classification of Tree Species and Standing Dead Trees from Remote Sensing Data. Int. J. Appl. Earth Obs. Geoinf. 2021, 98, 102292. [Google Scholar] [CrossRef]
- Liu, L.; Pang, Y.; Sang, G.; Li, Z.; Hu, B. Applying High Resolution Remote Sensing to Assess Tree Species Diversity of Monsoonal Broad-Leaved Evergreen Forest in Pu’er City. Acta Ecol. Sin. 2022, 42, 8398–8413. [Google Scholar] [CrossRef]
- Hovi, A.; Schraik, D.; Kuusinen, N.; Fabiánek, T.; Hanuš, J.; Homolová, L.; Juola, J.; Lukeš, P.; Rautiainen, M. Synergistic Use of Multi- and Hyperspectral Remote Sensing Data and Airborne LiDAR to Retrieve Forest Floor Reflectance. Remote Sens. Environ. 2023, 293, 113610. [Google Scholar] [CrossRef]
- Denisova, A.; Kavelenova, L.; Korchikov, E.; Prokhorova, N.; Terentieva, D.; Fedoseev, V. Tree Species Classification in Samara Region Using Sentinel-2 Remote Sensing Images and Forest Inventory Data. Sovrem. Probl. Distantsionnogo Zondirovaniya Zemli Iz Kosmosa 2019, 16, 86–101. [Google Scholar] [CrossRef]
- Hastings, J.; Sullivan, F.; Ollinger, S.V.; Ouimette, A.; Palace, M.W. Using Aircraft Remote Sensing to Map Tree Species Distribution at Harvard Forest, Massachusetts, USA; American Geophysical Union: Washington, DC, USA, 2018; Volume 2018, p. B33K-2823. [Google Scholar]
- Junttila, V.; Kauranne, T. Distribution Statistics Preserving Post-Processing Method With Plot Level Uncertainty Analysis for Remotely Sensed Data-Based Forest Inventory Predictions. Remote Sens. 2018, 10, 1677. [Google Scholar] [CrossRef]
- Hartling, S.; Sagan, V.; Maimaitijiang, M. Urban Tree Species Classification Using UAV-Based Multi-Sensor Data Fusion and Machine Learning. GIScience Remote Sens. 2021, 58, 1250–1275. [Google Scholar] [CrossRef]
- Song, G.; Wang, Q. Species Classification from Hyperspectral Leaf Information Using Machine Learning Approaches. Ecol. Inform. 2023, 76, 102141. [Google Scholar] [CrossRef]
- Jain, H. Tree Species Classification Based on Machine Learning Techniques: Mapping Chir Pine in Indian Western Himalayas. In Proceedings of the Remote Sensing for Agriculture, Ecosystems, and Hydrology XXIV; Neale, C.M., Maltese, A., Eds.; SPIE: Berlin, Germany, 2022; p. 21. [Google Scholar]
- Wang, N.; Wang, G. Tree Species Classification Using Machine Learning Algorithms with OHS-2 Hyperspectral Image. Sci. For. 2023, 51, e3991. [Google Scholar] [CrossRef]
- Cetin, Z.; Yastikli, N. The Use of Machine Learning Algorithms in Urban Tree Species Classification. ISPRS Int. J. Geo-Inf. 2022, 11, 226. [Google Scholar] [CrossRef]
- Sumsion, G.R.; Bradshaw, M.S.; Hill, K.T.; Pinto, L.D.G.; Piccolo, S.R. Remote Sensing Tree Classification with a Multilayer Perceptron. PeerJ 2019, 7, e6101. [Google Scholar] [CrossRef]
- Hologa, R.; Scheffczyk, K.; Dreiser, C.; Gärtner, S. Tree Species Classification in a Temperate Mixed Mountain Forest Landscape Using Random Forest and Multiple Datasets. Remote Sens. 2021, 13, 4657. [Google Scholar] [CrossRef]
- Li, Q.; Hu, B.; Shang, J.; Li, H. Fusion Approaches to Individual Tree Species Classification Using Multisource Remote Sensing Data. Forests 2023, 14, 1392. [Google Scholar] [CrossRef]
- Weinstein, B.G.; Marconi, S.; Bohlman, S.; Zare, A.; White, E. Individual Tree-Crown Detection in RGB Imagery Using Semi-Supervised Deep Learning Neural Networks. Remote Sens. 2019, 11, 1309. [Google Scholar] [CrossRef]
- Jing, L.; Hu, B.; Noland, T.; Li, J. An Individual Tree Crown Delineation Method Based on Multi-Scale Segmentation of Imagery. ISPRS J. Photogramm. Remote Sens. 2012, 70, 88–98. [Google Scholar] [CrossRef]
- Guo, X.; Li, H.; Jing, L.; Wang, P. Individual Tree Species Classification Based on Convolutional Neural Networks and Multitemporal High-Resolution Remote Sensing Images. Sensors 2022, 22, 3157. [Google Scholar] [CrossRef] [PubMed]
- Zhao, H.; Morgenroth, J.; Pearse, G.; Schindler, J. A Systematic Review of Individual Tree Crown Detection and Delineation with Convolutional Neural Networks (CNN). Curr. For. Rep. 2023, 9, 149–170. [Google Scholar] [CrossRef]
- Wang, X.; Wang, J.; Lian, Z.; Yang, N. Semi-Supervised Tree Species Classification for Multi-Source Remote Sensing Images Based on a Graph Convolutional Neural Network. Forests 2023, 14, 1211. [Google Scholar] [CrossRef]
- Li, S.; Brandt, M.; Fensholt, R.; Kariryaa, A.; Igel, C.; Gieseke, F.; Nord-Larsen, T.; Oehmcke, S.; Carlsen, A.H.; Junttila, S.; et al. Deep Learning Enables Image-Based Tree Counting, Crown Segmentation, and Height Prediction at National Scale. PNAS Nexus 2023, 2, pgad076. [Google Scholar] [CrossRef] [PubMed]
- Wu, J.; Yang, G.; Yang, H.; Zhu, Y.; Li, Z.; Lei, L.; Zhao, C. Extracting Apple Tree Crown Information from Remote Imagery Using Deep Learning. Comput. Electron. Agric. 2020, 174, 105504. [Google Scholar] [CrossRef]
- Chakraborty, D.; Deka, B. UAV Sensing-Based Semantic Image Segmentation of Litchi Tree Crown Using Deep Learning. In Proceedings of the 2023 IEEE Applied Sensing Conference (APSCON), Bengaluru, India, 23–25 January 2023; pp. 1–3. [Google Scholar]
- Lassalle, G.; Ferreira, M.P.; La Rosa, L.E.C.; De Souza Filho, C.R. Deep Learning-Based Individual Tree Crown Delineation in Mangrove Forests Using Very-High-Resolution Satellite Imagery. ISPRS J. Photogramm. Remote Sens. 2022, 189, 220–235. [Google Scholar] [CrossRef]
- Nurhabib, I.; Seminar, K.B. Recognition and Counting of Oil Palm Tree with Deep Learning Using Satellite Image. IOP Conf. Ser. Earth Environ. Sci. 2022, 974, 012058. [Google Scholar] [CrossRef]
- Palacio, J.C.R.; Bunn, C.; Rahn, E.; Little-Savage, D.; Schmidt, P.G.; Ryo, M. Geographic-Scale Coffee Cherry Counting with Smartphones and Deep Learning. Plant Phenomics 2024, 6, 0165. [Google Scholar] [CrossRef] [PubMed]
- Roslan, Z.; Long, Z.A.; Ismail, R. Individual Tree Crown Detection Using GAN and RetinaNet on Tropical Forest. In Proceedings of the 2021 15th International Conference on Ubiquitous Information Management and Communication (IMCOM), Seoul, Republic of Korea, 4–6 January 2021; pp. 1–7. [Google Scholar] [CrossRef]
- Huang, Y.; Wen, X.; Gao, Y.; Zhang, Y.; Lin, G. Tree Species Classification in UAV Remote Sensing Images Based on Super-Resolution Reconstruction and Deep Learning. Remote Sens. 2023, 15, 2942. [Google Scholar] [CrossRef]
- Chen, H.; Sun, K.; Tian, Z.; Shen, C.; Huang, Y.; Yan, Y. BlendMask: Top-Down Meets Bottom-Up for Instance Segmentation. In Proceedings of the 2020 IEEE/CVF Conference on Computer Vision and Pattern Recognition (CVPR), Seattle, WA, USA, 13–19 June 2020; pp. 8570–8578. [Google Scholar]
- Geng, P.; Jia, M.; Ren, X. Tunnel Lining Water Leakage Image Segmentation Based on Improved BlendMask. Struct. Health Monit. 2023, 22, 865–878. [Google Scholar] [CrossRef]
- Gao, Y.; Wang, H.; Li, M.; Su, W.-H. Automatic Tandem Dual BlendMask Networks for Severity Assessment of Wheat Fusarium Head Blight. Agriculture 2022, 12, 1493. [Google Scholar] [CrossRef]
- Longzhe, Q.; Wu, B.; Mao, S.R.; Feng, H.; Yang, C.; Wei, J.; Li, H. Instance Segmentation Based Method to Obtain the Phenotypic Information of Weeds in Complex Field Environments. Res. Sq. 2020. [Google Scholar] [CrossRef]
- Yang, L.; Chen, Y.; Shen, T.; Yu, H.; Li, D. A BlendMask-VoVNetV2 Method for Quantifying Fish School Feeding Behavior in Industrial Aquaculture. Comput. Electron. Agric. 2023, 211, 108005. [Google Scholar] [CrossRef]
- Wang, J.; Zhang, Z.; Wu, M.; Ye, Y.; Wang, S.; Cao, Y.; Yang, H. Improved BlendMask: Nuclei Instance Segmentation for Medical Microscopy Images. IET Image Process. 2023, 17, 2284–2296. [Google Scholar] [CrossRef]
- Kirillov, A.; Mintun, E.; Ravi, N.; Mao, H.; Rolland, C.; Gustafson, L.; Xiao, T.; Whitehead, S.; Berg, A.C.; Lo, W.-Y.; et al. Segment Anything. arXiv 2023, arXiv:2304.02643. [Google Scholar]
- Moghimi, A.; Welzel, M.; Celik, T.; Schlurmann, T. A Comparative Performance Analysis of Popular Deep Learning Models and Segment Anything Model (SAM) for River Water Segmentation in Close-Range Remote Sensing Imagery. IEEE Access 2024, 12, 52067–52085. [Google Scholar] [CrossRef]
- Jiang, Z. A Comparative Evaluation of Machine Learning Algorithms for Network Anomaly Detection. Appl. Comput. Eng. 2023, 19, 234–240. [Google Scholar] [CrossRef]
- Cheng, X.; Han, H.; Kang, F.; Song, Y.; Liu, K. Variation in Biomass and Carbon Storage by Stand Age in Pine (Pinus tabulaeformis) Planted Ecosystem in Mt. Taiyue, Shanxi, China. J. Plant Interact. 2013, 9, 521–528. [Google Scholar] [CrossRef]
- Ogbemudia, F.; Ita, R.E.; Anwana, E. Tree-Based Carbon Sequestration and Storage Abilities Vary in Natural and Plantation Forest Ecosystems. World J. Appl. Sci. Technol. 2023, 15, 19–25. [Google Scholar] [CrossRef]
- Ronneberger, O.; Fischer, P.; Brox, T. U-Net: Convolutional Networks for Biomedical Image Segmentation. In Medical Image Computing and Computer-Assisted Intervention—MICCAI 2015; Springer: Cham, Switzerland, 2015. [Google Scholar]


| Scientific Name | Common Name | Abbreviation | Training Instance Count |
|---|---|---|---|
| Ginkgo biloba | Ginkgo | Gb | 2455 |
| Sophora japonica | Locust tree | Sj | 3421 |
| Pinus tabulaeformis | Oil pine | Pt | 2847 |
| Populus nigra | Black poplar | Pn | 1425 |
| Juniperus chinensis | Chinese juniper | Jc | 420 |
| Koelreuteria paniculata | Golden rain tree | Kp | 75 |
| Unknown 1 | \ | U1 | 1454 |
| Unknown 2 | \ | U2 | 1265 |
| Unknown 3 | \ | U3 | 154 |
| Tree Species | Mask Colour | Predict Quantity | Precision | Recall | F1-Score | Accuracy |
|---|---|---|---|---|---|---|
| Ginkgo biloba | Red | 463 | 94.3% | 72.1% | 81.6% | 93.3% |
| Sophora japonica | Green | 905 | 90.7% | 84.1% | 87.4% | 94.8% |
| Pinus tabulaeformis | Blue | 746 | 94.0% | 78.8% | 85.7% | 92.2% |
| Populus nigra | Cyan | 661 | 97.3% | 67.3% | 79.6% | 88.6% |
| Koelreuteria paniculata | Purple | 201 | 93.3% | 80.1% | 86.3% | 98.5% |
| Juniperus chinensis | Orange | 197 | 98.5% | 61.7% | 75.8% | 95.7% |
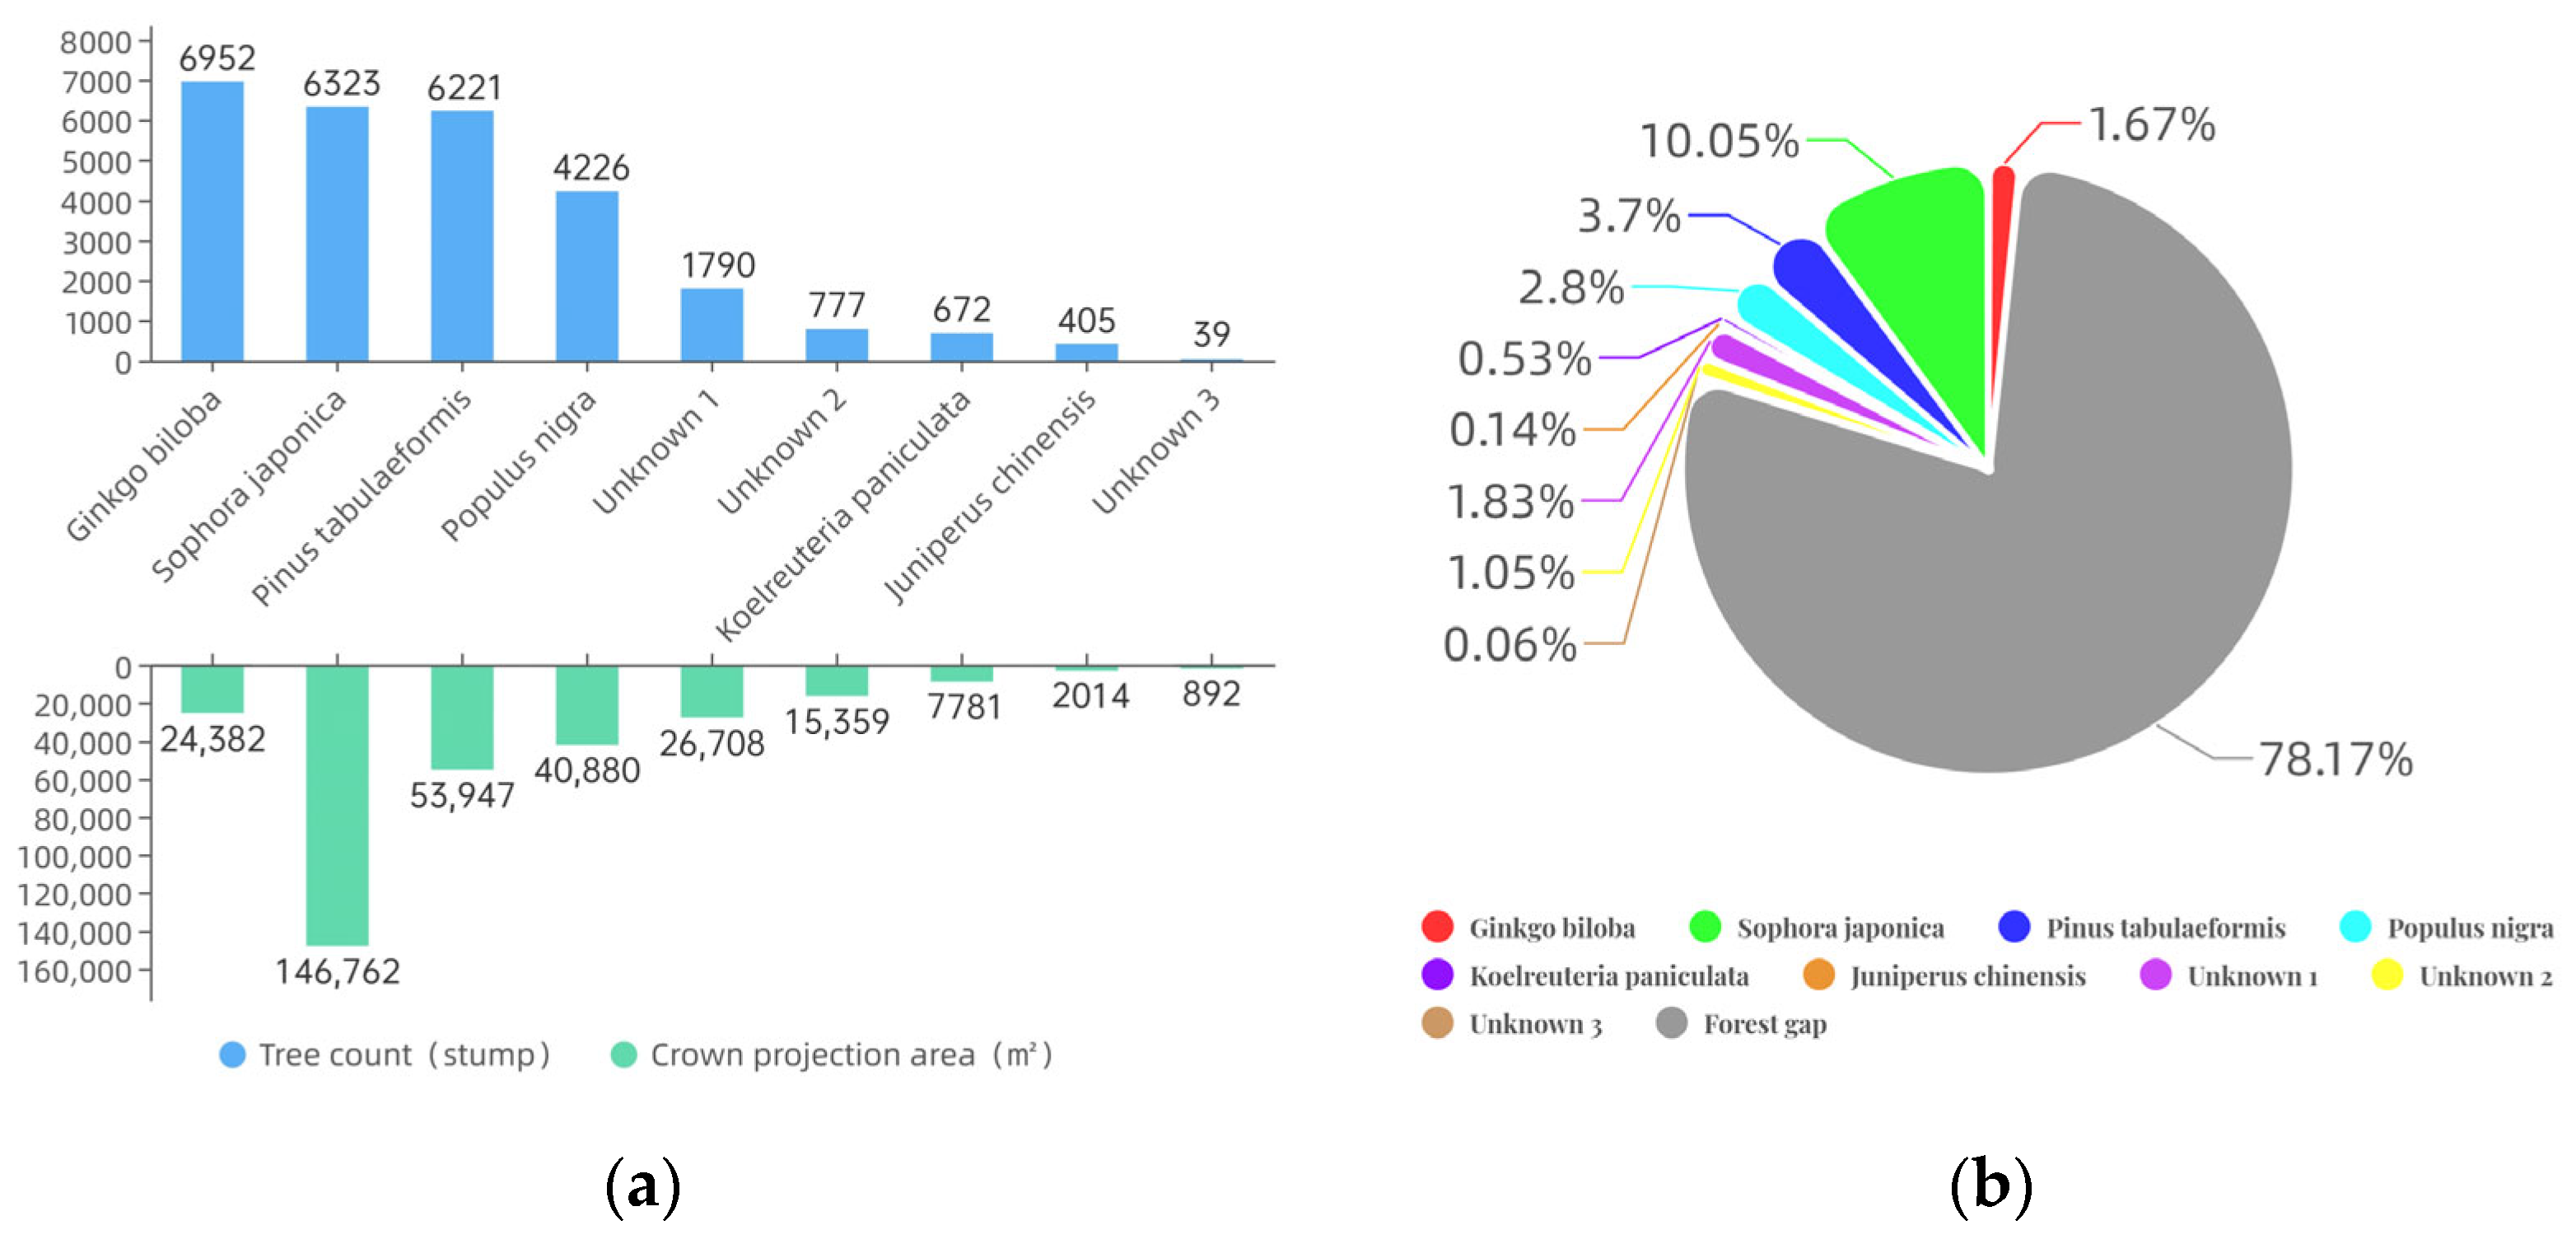
| Tree Species | Mask Colour | Tree Count (Stump) | Crown Projection Area (m2) | Canopy Cover |
|---|---|---|---|---|
| Ginkgo biloba | Red | 6952 | 24,382 | 1.67% |
| Sophora japonica | Green | 6323 | 146,762 | 10.05% |
| Pinus tabulaeformis | Blue | 6221 | 53,947 | 3.70% |
| Populus nigra | Cyan | 4226 | 40,880 | 2.80% |
| Koelreuteria paniculata | Purple | 672 | 7781 | 0.53% |
| Juniperus chinensis | Orange | 405 | 2014 | 0.14% |
| Unknown 1 | Pink | 1790 | 26,708 | 1.83% |
| Unknown 2 | Yellow | 777 | 15,359 | 1.05% |
| Unknown 3 | Brown | 39 | 892 | 0.06% |
| Total | \ | 27,403 | 318,725 | 21.83% |
| a | b | Standard Error of the Estimate SEE | Coefficient of Determination R2 |
|---|---|---|---|
| −1.659 | 2.335 | 0.118 | 0.983 |
| Method | Mean Absolute Error MAE | Root Mean Square Error RMSE | Coefficient of Determination R2 |
|---|---|---|---|
| Linear regression | 9.581 | 12.199 | 0.964 |
| Nonlinear regression | 5.574 | 8.026 | 0.984 |
| Tree Species | Common Name | Average Single-Tree Crown Projection (m2) | Biomass of a Single Plant (Kg) | Biomass (Kg) | Carbon Assessment (Kg) |
|---|---|---|---|---|---|
| Pinus tabulaeformis | Oil pine | 8.67 | 65.97 | 410,399.37 | 205,199.69 |
| Network | Precision | F1-Score | Accuracy |
|---|---|---|---|
| U-net | 84.92% | 74.10% | 86.04% |
| BlendMask | 93.83% | 81.84% | 92.68% |
Disclaimer/Publisher’s Note: The statements, opinions and data contained in all publications are solely those of the individual author(s) and contributor(s) and not of MDPI and/or the editor(s). MDPI and/or the editor(s) disclaim responsibility for any injury to people or property resulting from any ideas, methods, instructions or products referred to in the content. |
© 2024 by the authors. Licensee MDPI, Basel, Switzerland. This article is an open access article distributed under the terms and conditions of the Creative Commons Attribution (CC BY) license (https://creativecommons.org/licenses/by/4.0/).
Share and Cite
Ji, Z.; Xu, J.; Yan, L.; Ma, J.; Chen, B.; Zhang, Y.; Zhang, L.; Wang, P. Satellite Remote Sensing Images of Crown Segmentation and Forest Inventory Based on BlendMask. Forests 2024, 15, 1320. https://doi.org/10.3390/f15081320
Ji Z, Xu J, Yan L, Ma J, Chen B, Zhang Y, Zhang L, Wang P. Satellite Remote Sensing Images of Crown Segmentation and Forest Inventory Based on BlendMask. Forests. 2024; 15(8):1320. https://doi.org/10.3390/f15081320
Chicago/Turabian StyleJi, Zicheng, Jie Xu, Lingxiao Yan, Jiayi Ma, Baozhe Chen, Yanfeng Zhang, Li Zhang, and Pei Wang. 2024. "Satellite Remote Sensing Images of Crown Segmentation and Forest Inventory Based on BlendMask" Forests 15, no. 8: 1320. https://doi.org/10.3390/f15081320