Article

The Role of Leaching in Soil Carbon, Nitrogen, and Phosphorus Distributions in Subalpine Coniferous Forests on Gongga Mountain, Southwest China

1
College of Resource Environment and Tourism, Hubei University of Arts and Sciences, Xiangyang 441053, China
2
Institute of Mountain Hazards and Environment, Chinese Academy of Sciences, Chengdu 610041, China
3
University of Chinese Academy of Sciences, Beijing 100049, China
*
Author to whom correspondence should be addressed.
Forests 2024, 15(8), 1326; https://doi.org/10.3390/f15081326
Submission received: 17 June 2024 / Revised: 21 July 2024 / Accepted: 25 July 2024 / Published: 30 July 2024
(This article belongs to the Special Issue Carbon, Nitrogen, and Phosphorus Storage and Cycling in Forest Soil)

Abstract

:
To explore the role of leaching in mountainous nutrient cycling, we investigated the altitudinal distribution of soil carbon (C), nitrogen (N), and phosphorus (P) in the subalpine coniferous forest ranging from 2628 to 3044 m on the eastern slope of Mt. Gongga. The results revealed that concentrations of C and N, as well as the atomic ratios of C:N and N:P, showed no significant difference among the sampling sites (p > 0.05) in O horizons. The concentrations of P in O horizons increased gradually with altitude. In contrast, notable variations in C, N, and P concentrations and stoichiometry were observed in the mineral horizons. Lower concentrations of C, N, and P were found in A horizons, while higher contents were present in B and C horizons compared to previous studies. Additionally, results of the random forest model indicated that C and N concentrations in the O, B, and C horizons, as well as P concentration in the B horizons, were primarily influenced by Feox concentrations. This suggested that these nutrients leached from O horizons and accumulated in B and C horizons alongside Feox. Except for C:N ratios in the O horizon, the C:N, C:P, and N:P ratios in the O, B, and C horizons were mainly affected by concentrations of Feox or Alox. These results underscored the substantial impact of leaching processes on the spatial distribution of soil C, N, and P, ultimately leading to changes in the gradient distribution of soil C:N:P stoichiometry. Specifically, the C:N ratio in the mineral horizons at the 2781 m site was significantly higher compared to other sites (p < 0.05), indicating a greater movement of C relative to N. The C:P and N:P ratios in the B horizon at the 2781 m site were notably higher than at other sampling sites (p < 0.05). Conversely, the N:P ratio in the A horizon at the 2781 m site was relatively low. Furthermore, concentrations of C and N in the B horizon at the 2781 m site were significantly higher than in other sampling points, while P concentrations were notably lower (p < 0.05). This suggested a more pronounced downward leaching of C and N compared to P at the 2781 site, indicating stronger leaching effects. Overall, this study emphasizes the significant influence of leaching processes on the spatial distributions of soil C, N, and P in subalpine coniferous forests in Southwest China.

1. Introduction

Soil nutrients, especially carbon (C), nitrogen (N), and phosphorus (P), are crucial for plant growth and vegetation succession [1,2]. Recent research on soil nutrients in forest ecosystems considers a range of factors such as land use patterns, forest age, succession stages, and elevation gradients [3,4,5,6]. Consequently, the altitudinal distributions of C, N, and P in mountain soils exhibit notable spatial variations.
For instance, research in the Qinling Mountains revealed that concentrations of soil C and N increased with elevation in a mixed forest of pine and oak, while soil P remained relatively consistent across different sampling sites [7]. Similarly, a study in Maxian Mountain on the Loess Plateau found that soil C and N concentrations in the top soils increased with elevation, with no significant change in P content [8]. These findings suggested that soil nutrient contents were primarily influenced by soil moisture. In the Dayekou Watershed of the Qilian Mountains, soil C and N initially increased and then decreased with elevation, while P content remained stable [9]. In the Nanling Mountains, soil C, N, and P concentrations were higher at the middle and high altitudes compared to low altitudes [10]. Furthermore, research on seaberry (Hippophae rhamnoides L.) shrubs in the upper Min River area showed a gradual increase in C, N, and P below 2900 m, with fluctuations occurring above this altitude in Miyaluo and a decline in nutrients with elevation in Chuanzhusi. The variations in nutrients in Hippophae rhamnoides L. shrubs soil with altitude were attributed to differences in precipitation, temperature, and vegetation in different regions [11]. These collective studies enhanced our understanding of soil nutrients in mountainous areas, focusing primarily on biochemical processes that influence spatial distribution, while the impact of geochemical processes was often underestimated.
Geochemical processes, particularly leaching, play crucial roles in mountain ecosystems characterized by steep slopes and high runoff [12]. The vertical movement of soil elements through leaching has been documented in various ecosystems, including boreal coniferous forests [13], subtropical plantations in China [14], and unmanaged mountain Norway spruce forests [15]. Different intensities of leaching can lead to changes in other biotic and abiotic factors, such as soil development [16], microbial activities [17,18], and dynamics of organic matter [19]. These alterations, in turn, affect the cycling of C, N, and P. Therefore, it is important to focus on the influences of leaching on the altitudinal distributions of soil C, N, and P.
Located at the southeastern edge of the Tibetan Plateau, Gongga Mountain offers a unique opportunity to study how leaching impacts the distribution of soil C, N, and P with altitude. The fir (Abies fabri (Mast.) Craib) forest (2628–3044 m a.s.l.) on the eastern slope of Gongga Mountain is known for its high precipitation [20]. Leaching processes in brown and dark-brown forest soils result in the rapid movement of soil solutes [21,22]. Despite similar bedrocks and vegetation, reduced litter production at higher elevations leads to lower levels of C, N, and P returning to surface soils [23,24], causing soil C, N, and P concentrations to decrease with altitude [10,11]. However, when accounting for leaching effects, this altitudinal decline may be disrupted, resulting in varied patterns of concentrations and atomic ratios of C, N, and P across different horizons. In this study, we measured the concentrations of soil C, N, and P, as well as related soil properties in the Abies fabri (Mast.) Craib forest is located at an elevation of 2600–3000 m on Gongga Mountain’s eastern slope. The objectives were (1) to explore the distributions of C, N, and P concentrations and atomic ratios in soils across the altitudinal gradient and (2) to elucidate the impacts of leaching on the distributions of soil C, N, and P in the subalpine coniferous forest.

2. Materials and Methods
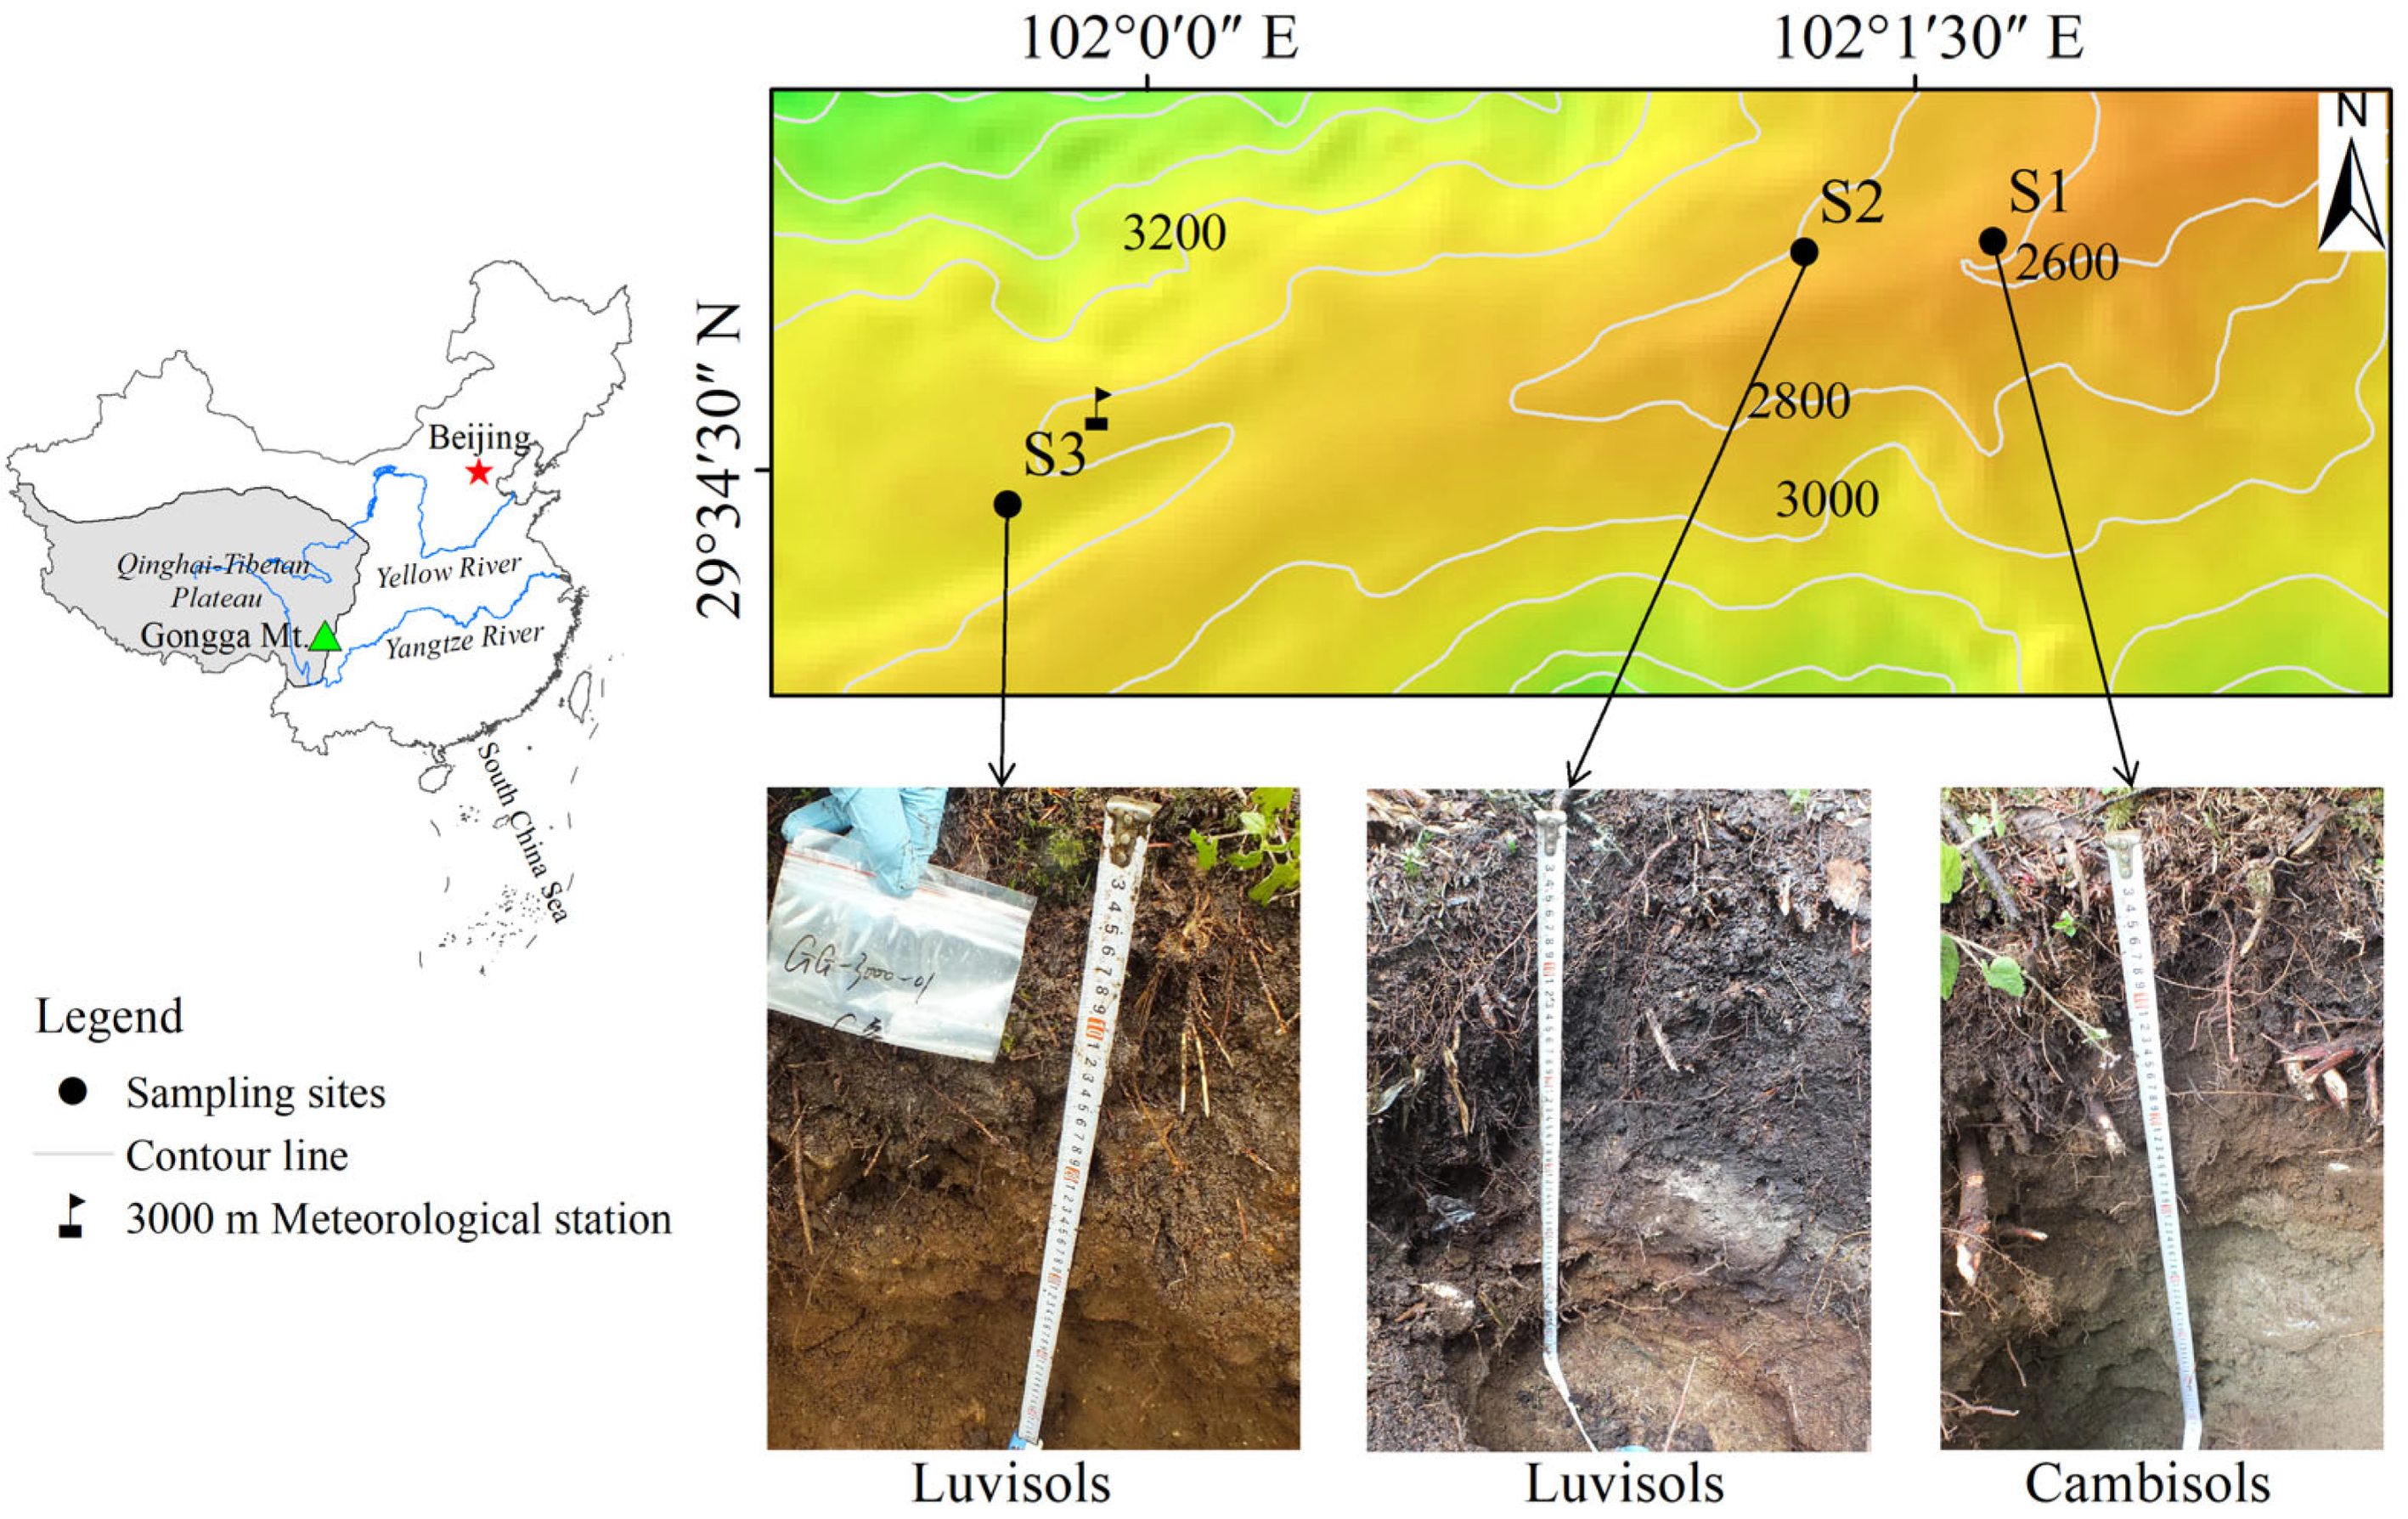
2.1. Study Region

Gongga Mountain, located on the southeastern margin of the Qinghai–Tibet Plateau in China, has a summit elevation of 7556 m (Figure 1). The significant altitude variation of 6 km results in distinct altitudinal patterns of soil and vegetation. The eastern slope of Gongga Mountain is distinguished by subalpine coniferous forests with pristine vegetation [25]. This area is predominantly influenced by Eastern Asian monsoons, with an average annual temperature of 4.2 °C and monthly temperatures ranging from −4.6 °C in January to 12.5 °C in July, based on data from the 3000 m meteorological station. The average annual precipitation, humidity, and potential evaporation are approximately 1947 mm, 90%, and 327 mm, respectively [20]. The soil parent material is predominantly granite [26]. According to the China soil classification system, the soil types are identified as brown forest soil at elevations of 2600–2800 m and dark-brown forest soil at elevations of 2800–3200 m [26]. Additionally, based on the world reference base (WRB) for soil resources [27], the soil types are classified as Cambisols at the 2628 m site and Luvisols at the 2781 and 3044 m sites, as illustrated in Figure 1.

2.2. Soil Sampling

Three sampling sites were set up at altitudes of 2628 m (S1), 2781 m (S2), and 3044 m (S3) under the canopies of Abies fabri (Mast.) Craib on the eastern slope of Gongga Mountain. Each site included six randomly selected soil profiles with a slope of less than 30° and profiles spaced at intervals greater than 10 m. These profiles were categorized into five horizons, including OL, O, A, B, and C horizons (Figure 1). The OL horizon represented the litter layer, primarily composed of fermented and shredded litter. The O horizon contained soils with a brown color and humified organic matter. The A horizon comprised organic mineral soils with a dark brown color. The B horizon consisted of soils with illuvial and/or eluvial materials. The C horizon represented the soil parent materials. Sampling began with plant litter in the OL horizons, followed by a hierarchical collection of soil samples from the C to O horizons based on soil occurrence. Subsequently, soil temperature was monitored using Hygrochron temperature logger iButtons (Maxim DS 1923, Wodisen Electronic Technology Co., Ltd., Shanghai, China) embedded in the O, A, and B horizons, with a sampling interval of 1 h for continuous monitoring. All samples were packaged in polyethylene bags and brought back in an icebox.

2.3. Chemical Analysis

Samples of OL horizons were air-dried and then ground, passing through a sieve (<0.075 mm) before analysis. Soil samples were sieved (<2 mm) and divided into air-dried and fresh soils (stored at 4 °C). The monthly average soil temperature (Temp.) in May was calculated for the O, A, and B horizons based on continuous monitoring. Soil moisture (Mois.) was determined using the oven-drying method [28]. Soil pH was measured using the electrode method, with a water-to-soil ratio of 10:1 for O horizons and 2.5:1 for A, B, and C horizons. The concentrations of amorphous iron (Feox) and aluminum (Alox) were extracted using the acid ammonium-oxalate method [29]. The concentrations of C and N were acquired using an element analyzer (Vario ISOTOPE cube, Elementar, Langenselbold, Germany). In OL horizons, the concentrations of C and N represented the contents of C and N in litters (Clit and Nlit), respectively. The concentrations of P were measured using the molybdate colorimetric method [30]. In OL horizons, concentrations of P represented the contents of P in litters (Plit) and were determined by digesting with a HNO3-HClO4 solution. In the other four horizons, P was digested with an H2SO4-HClO4 solution. Soil microbial biomass C (MBC), microbial biomass N (MBN), and microbial biomass P (MBP) were analyzed according to the chloroform fumigation–extraction method [31].

2.4. Data Analysis

Soil properties were compared among different sampling sites using a one-way analysis of variance (ANOVA). If the variables showed homogeneity, Ryan–Einot–Gabriel–Welsch F (R) post hoc tests were conducted; otherwise, Tamhane’s post hoc tests were applied. Statistical significance was determined at p < 0.05. A random forest model was conducted for each horizon to rank the impacts of soil properties on the concentrations of C, N, and P and C:N:P stoichiometry. The random forest model employed the increase in mean squared error (%IncMSE) as the criterion for assessing the importance of soil properties. %IncMSE values can be positive or negative. A positive value signifies a more pronounced positive effect on the predicted variables, encompassing the concentrations of C, N, and P, as well as C:N:P stoichiometry. Conversely, a negative %IncMSE indicates that removing this soil property does not notably escalate the mean squared error, suggesting a limited impact on the predicted variables. This analysis was carried out using SPSS 19.0, Origin 8.0, and R 4.0.5 software.

3. Results

3.1. Soil Properties

Soil temperatures decreased significantly with elevation (p < 0.05, Table 1). However, there was no clear gradient trend observed for Mois., pH, Feox, Alox, MBC, MBN, MBP, Clit, Nlit, and Plit, which were particularly noticeable at the S2 site. Mois. content was the highest at the S2 site, except for the A horizon. pH values were the lowest at the S2 site for all horizons. Feox concentrations in the O and A horizons were the lowest at the S2 site, whereas Feox and Alox in the B and C horizons were significantly higher compared to other sites (p < 0.05). Concentrations of MBC, MBN, and MBP in A horizons were observed to be the lowest at the S2 site. Concentrations of Clit, Plit, and Clit:Nlit ratios were the highest at the S2 site, while Nlit concentrations, Clit:Plit, and Nlit:Plit ratios were the lowest.
By comparing the average values of each soil property among horizons, it was noted that the average pH value in the A horizon was the lowest among the four horizons, with a measurement of 4.6 ± 0.1. Concentrations of Feox and Alox were found to be the lowest in O horizons, while they were the highest in B horizons compared to other horizons (p < 0.05).

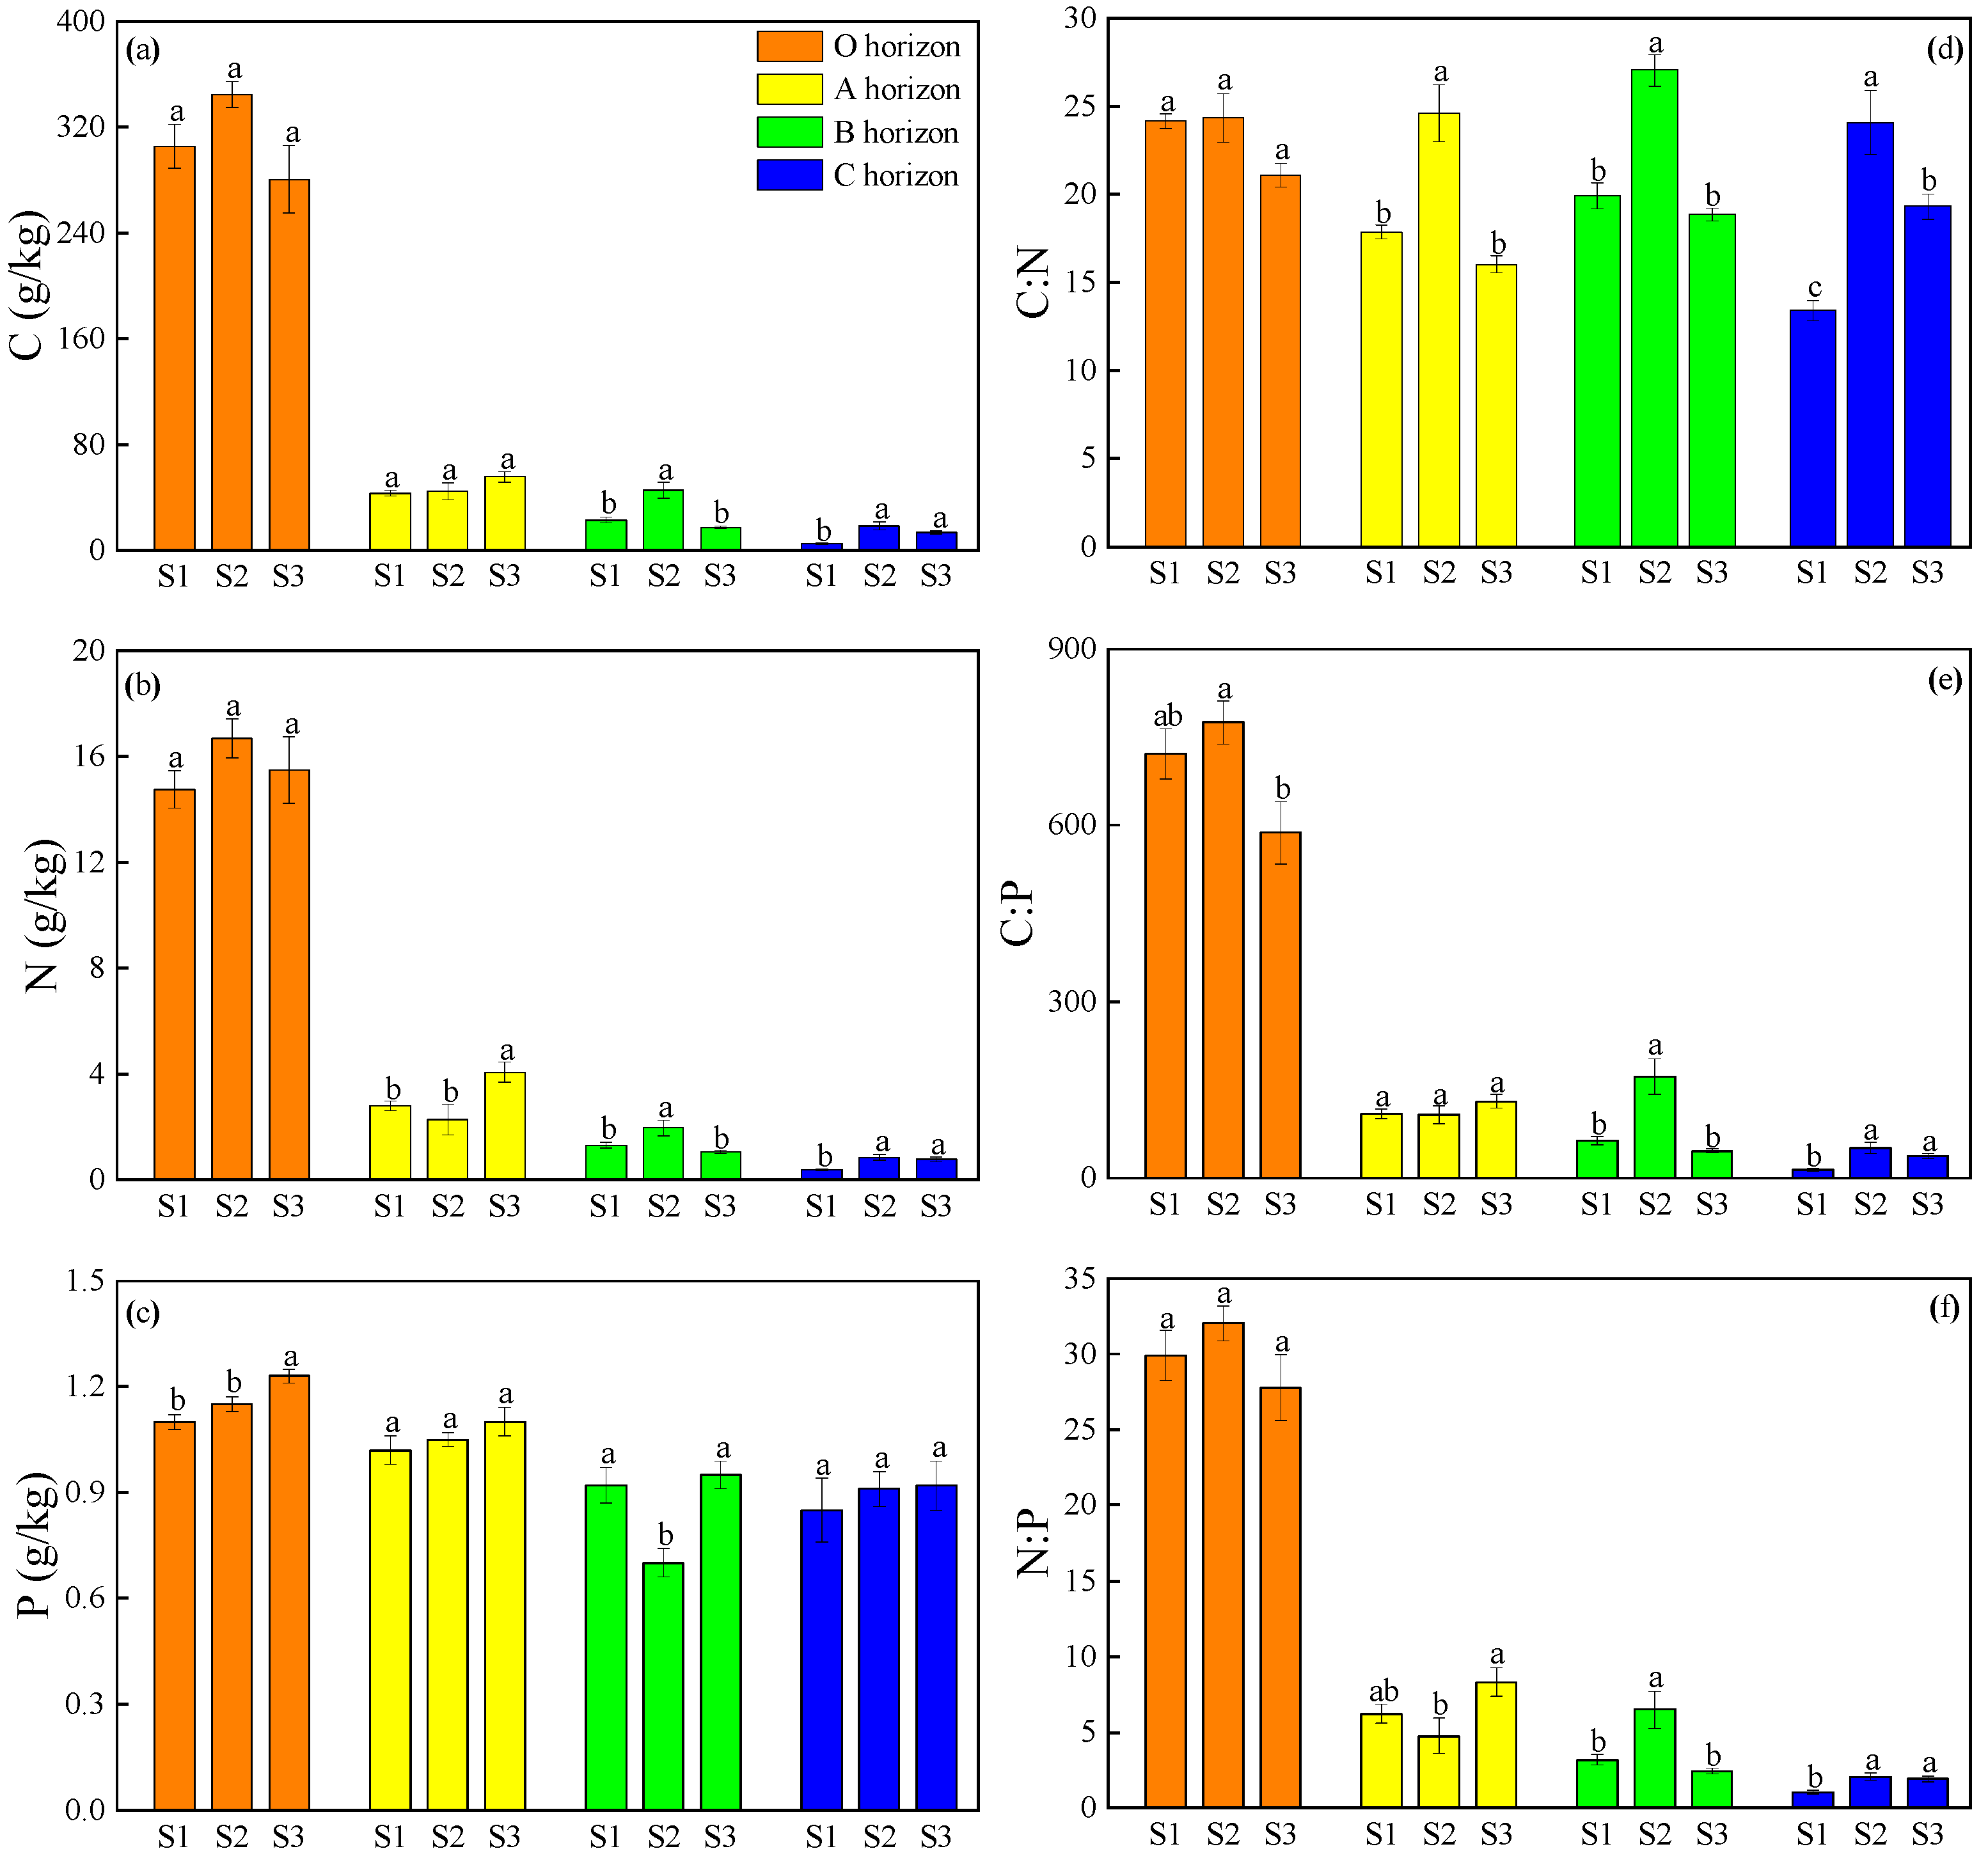
3.2. The Concentrations and Atomic Ratios of C, N, and P in Soils

Concentrations of C and N, as well as the atomic ratios of C:N and N:P, did not show significant differences among the sampling sites (p > 0.05) in O horizons (Figure 2a,b,d,f). The concentrations of P in O horizons increased gradually with altitude (Figure 2c). The highest atomic ratio of C:P in the O horizon was observed at the S2 sites (Figure 2e).
Both C and N concentrations showed a significant decrease in soil depth (p < 0.05), with the most noticeable decline in the A horizons at the S2 site, where they decreased by 87.2% and 86.4%, respectively. In the A horizons, there were no significant differences in the concentrations of C and P, as well as in the atomic ratios of C:P, among the sampling sites (p > 0.05). The lowest concentrations of N and atomic ratios of N:P were observed at the S2 site, while the highest atomic ratios of C:N were found at the same sample site. For B and C horizons, the highest values for concentrations of C and N, as well as the atomic ratios of C:N, C:P, and N:P, were recorded at the S2 site. However, the P concentration was the lowest at the S2 site in the B horizon.

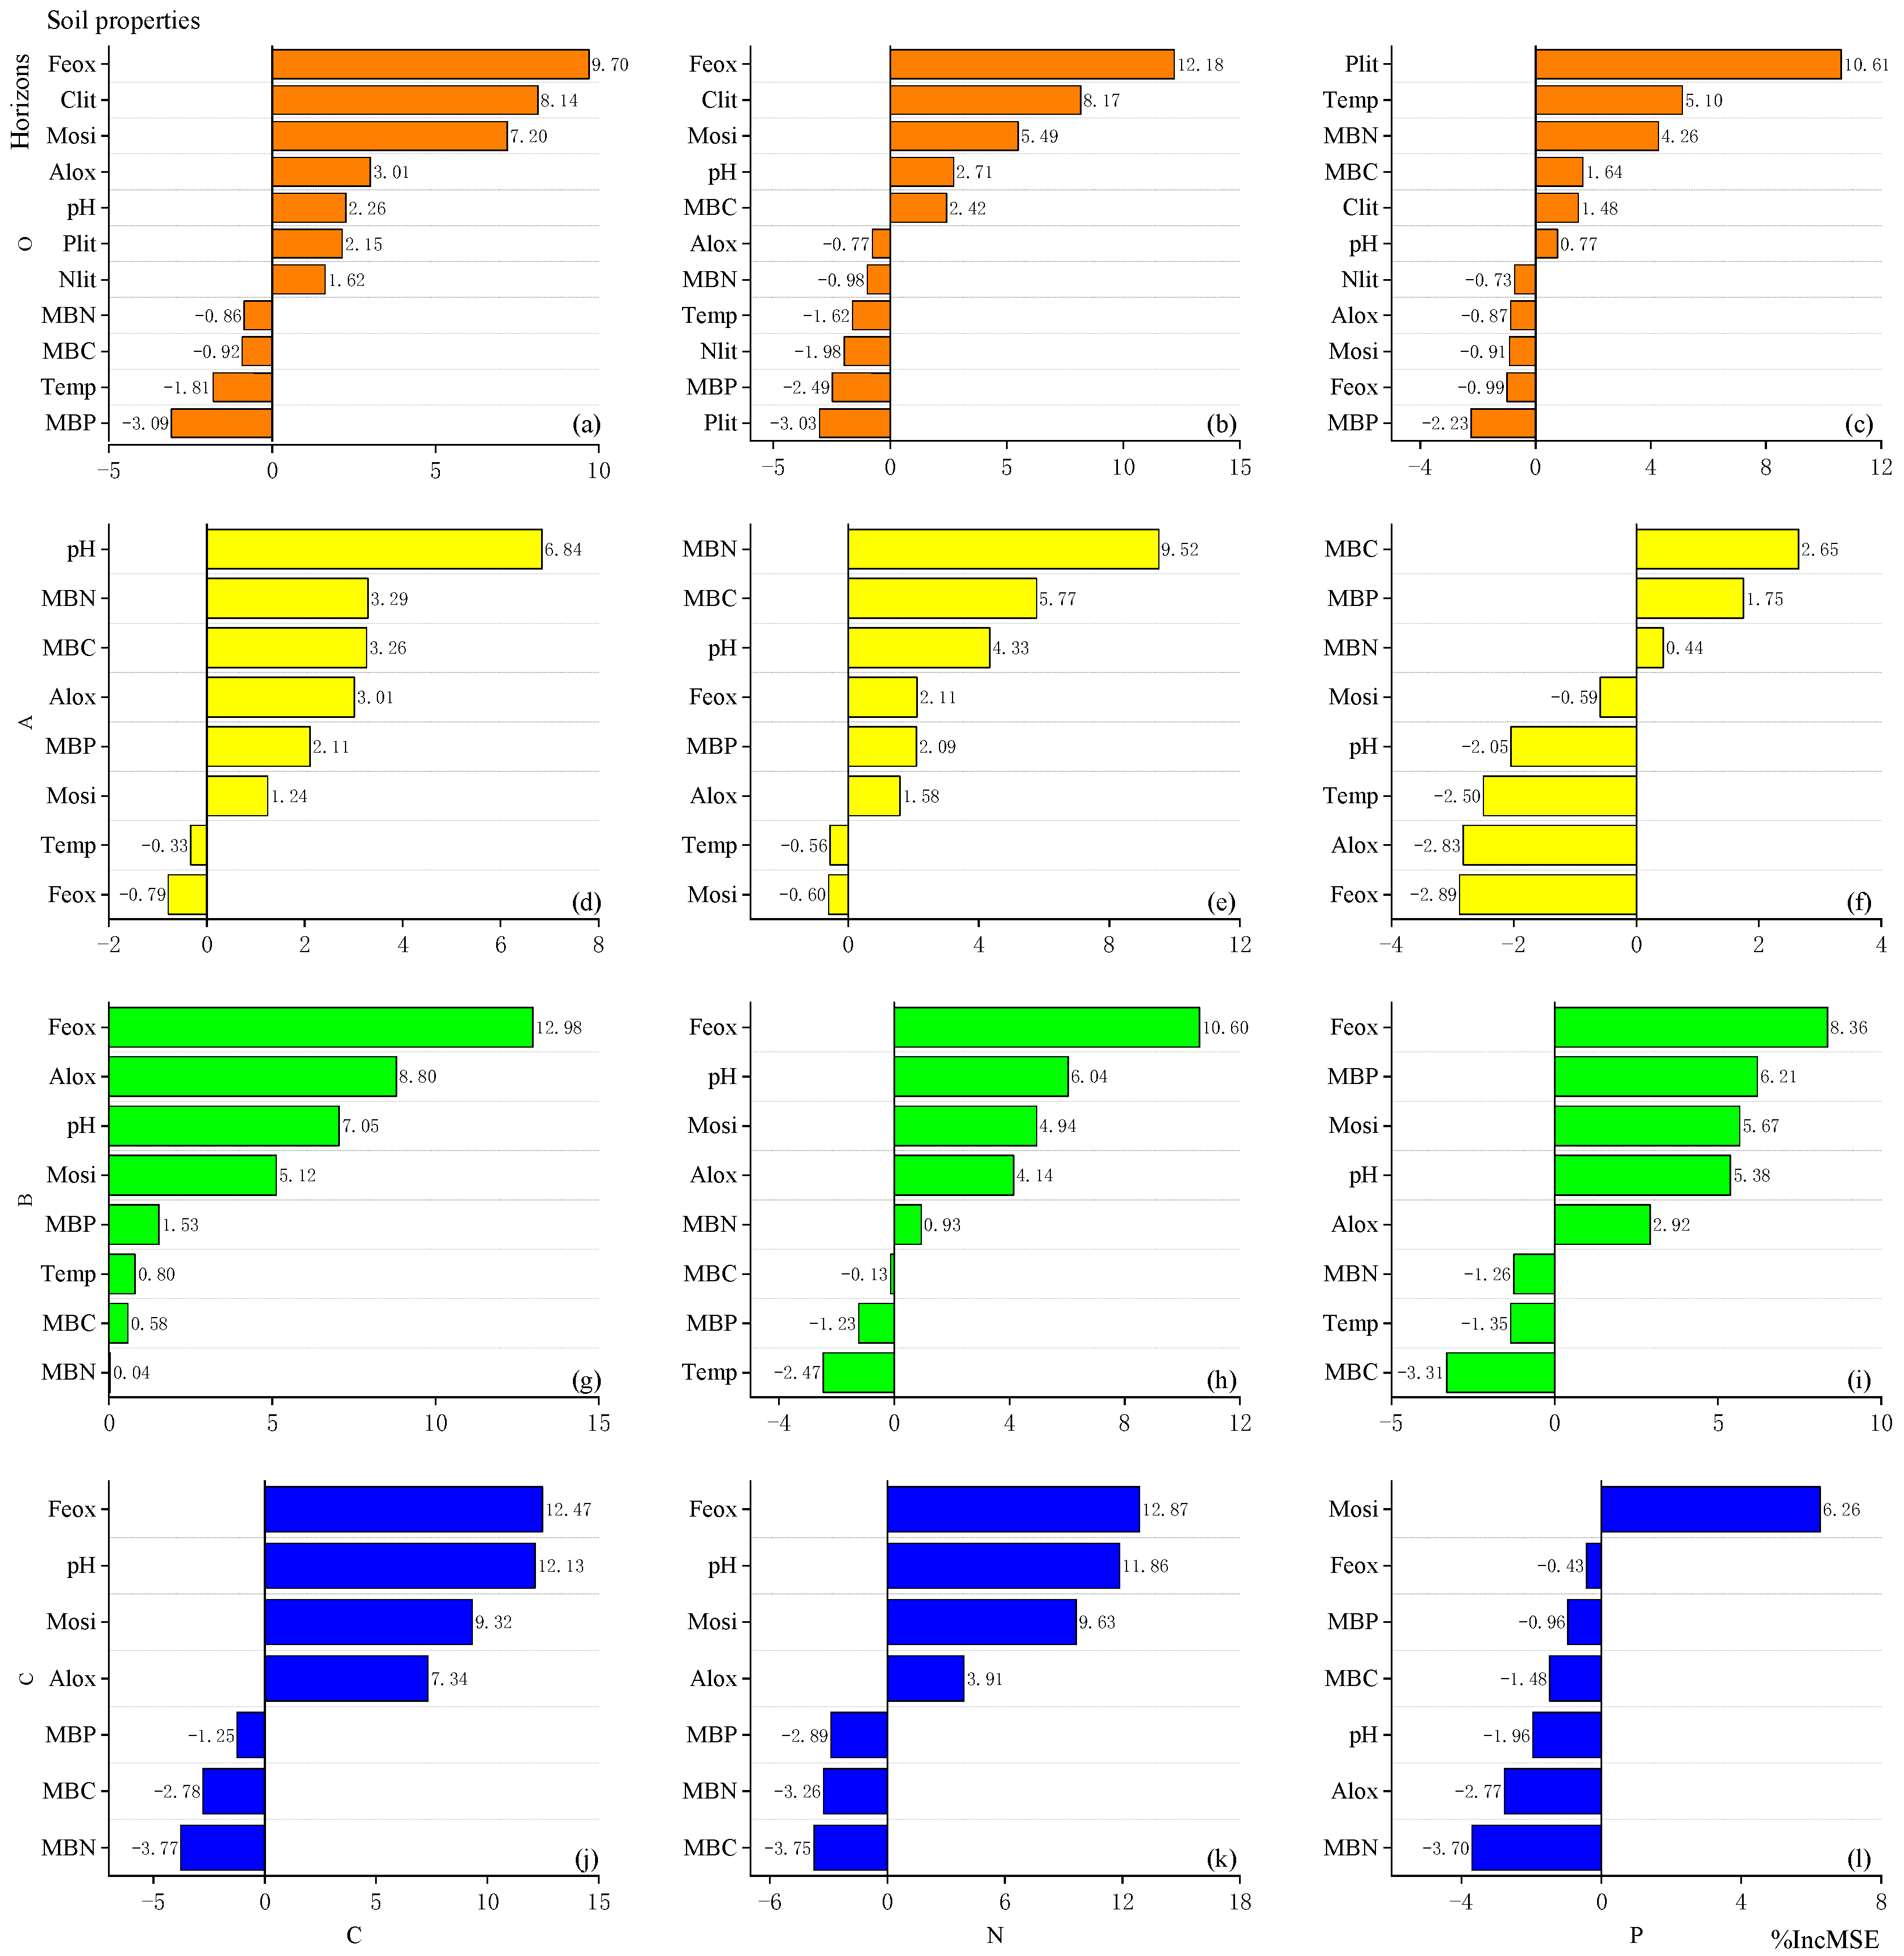
3.3. Impacts of Soil Properties on the C, N, and P Concentrations

The results of the random forest model indicated that C and N concentrations showed similar relationships, which varied with P concentrations across the selected biotic and abiotic factors (Figure 3). In the O horizon, C and N concentrations were most influenced by Feox concentrations, while P concentration was primarily determined by Plit content. In the A horizons, soil C and N concentrations were significantly influenced by microorganisms and pH values, whereas soil P concentration was mainly controlled by microorganisms. In the B and C horizons, soil C and N concentrations were notably impacted by Feox and Alox concentrations, pH values, and Mois. The soil P concentration in the B horizon was primarily controlled by Feox concentration, while in the C horizon, it was mainly influenced by Mois.

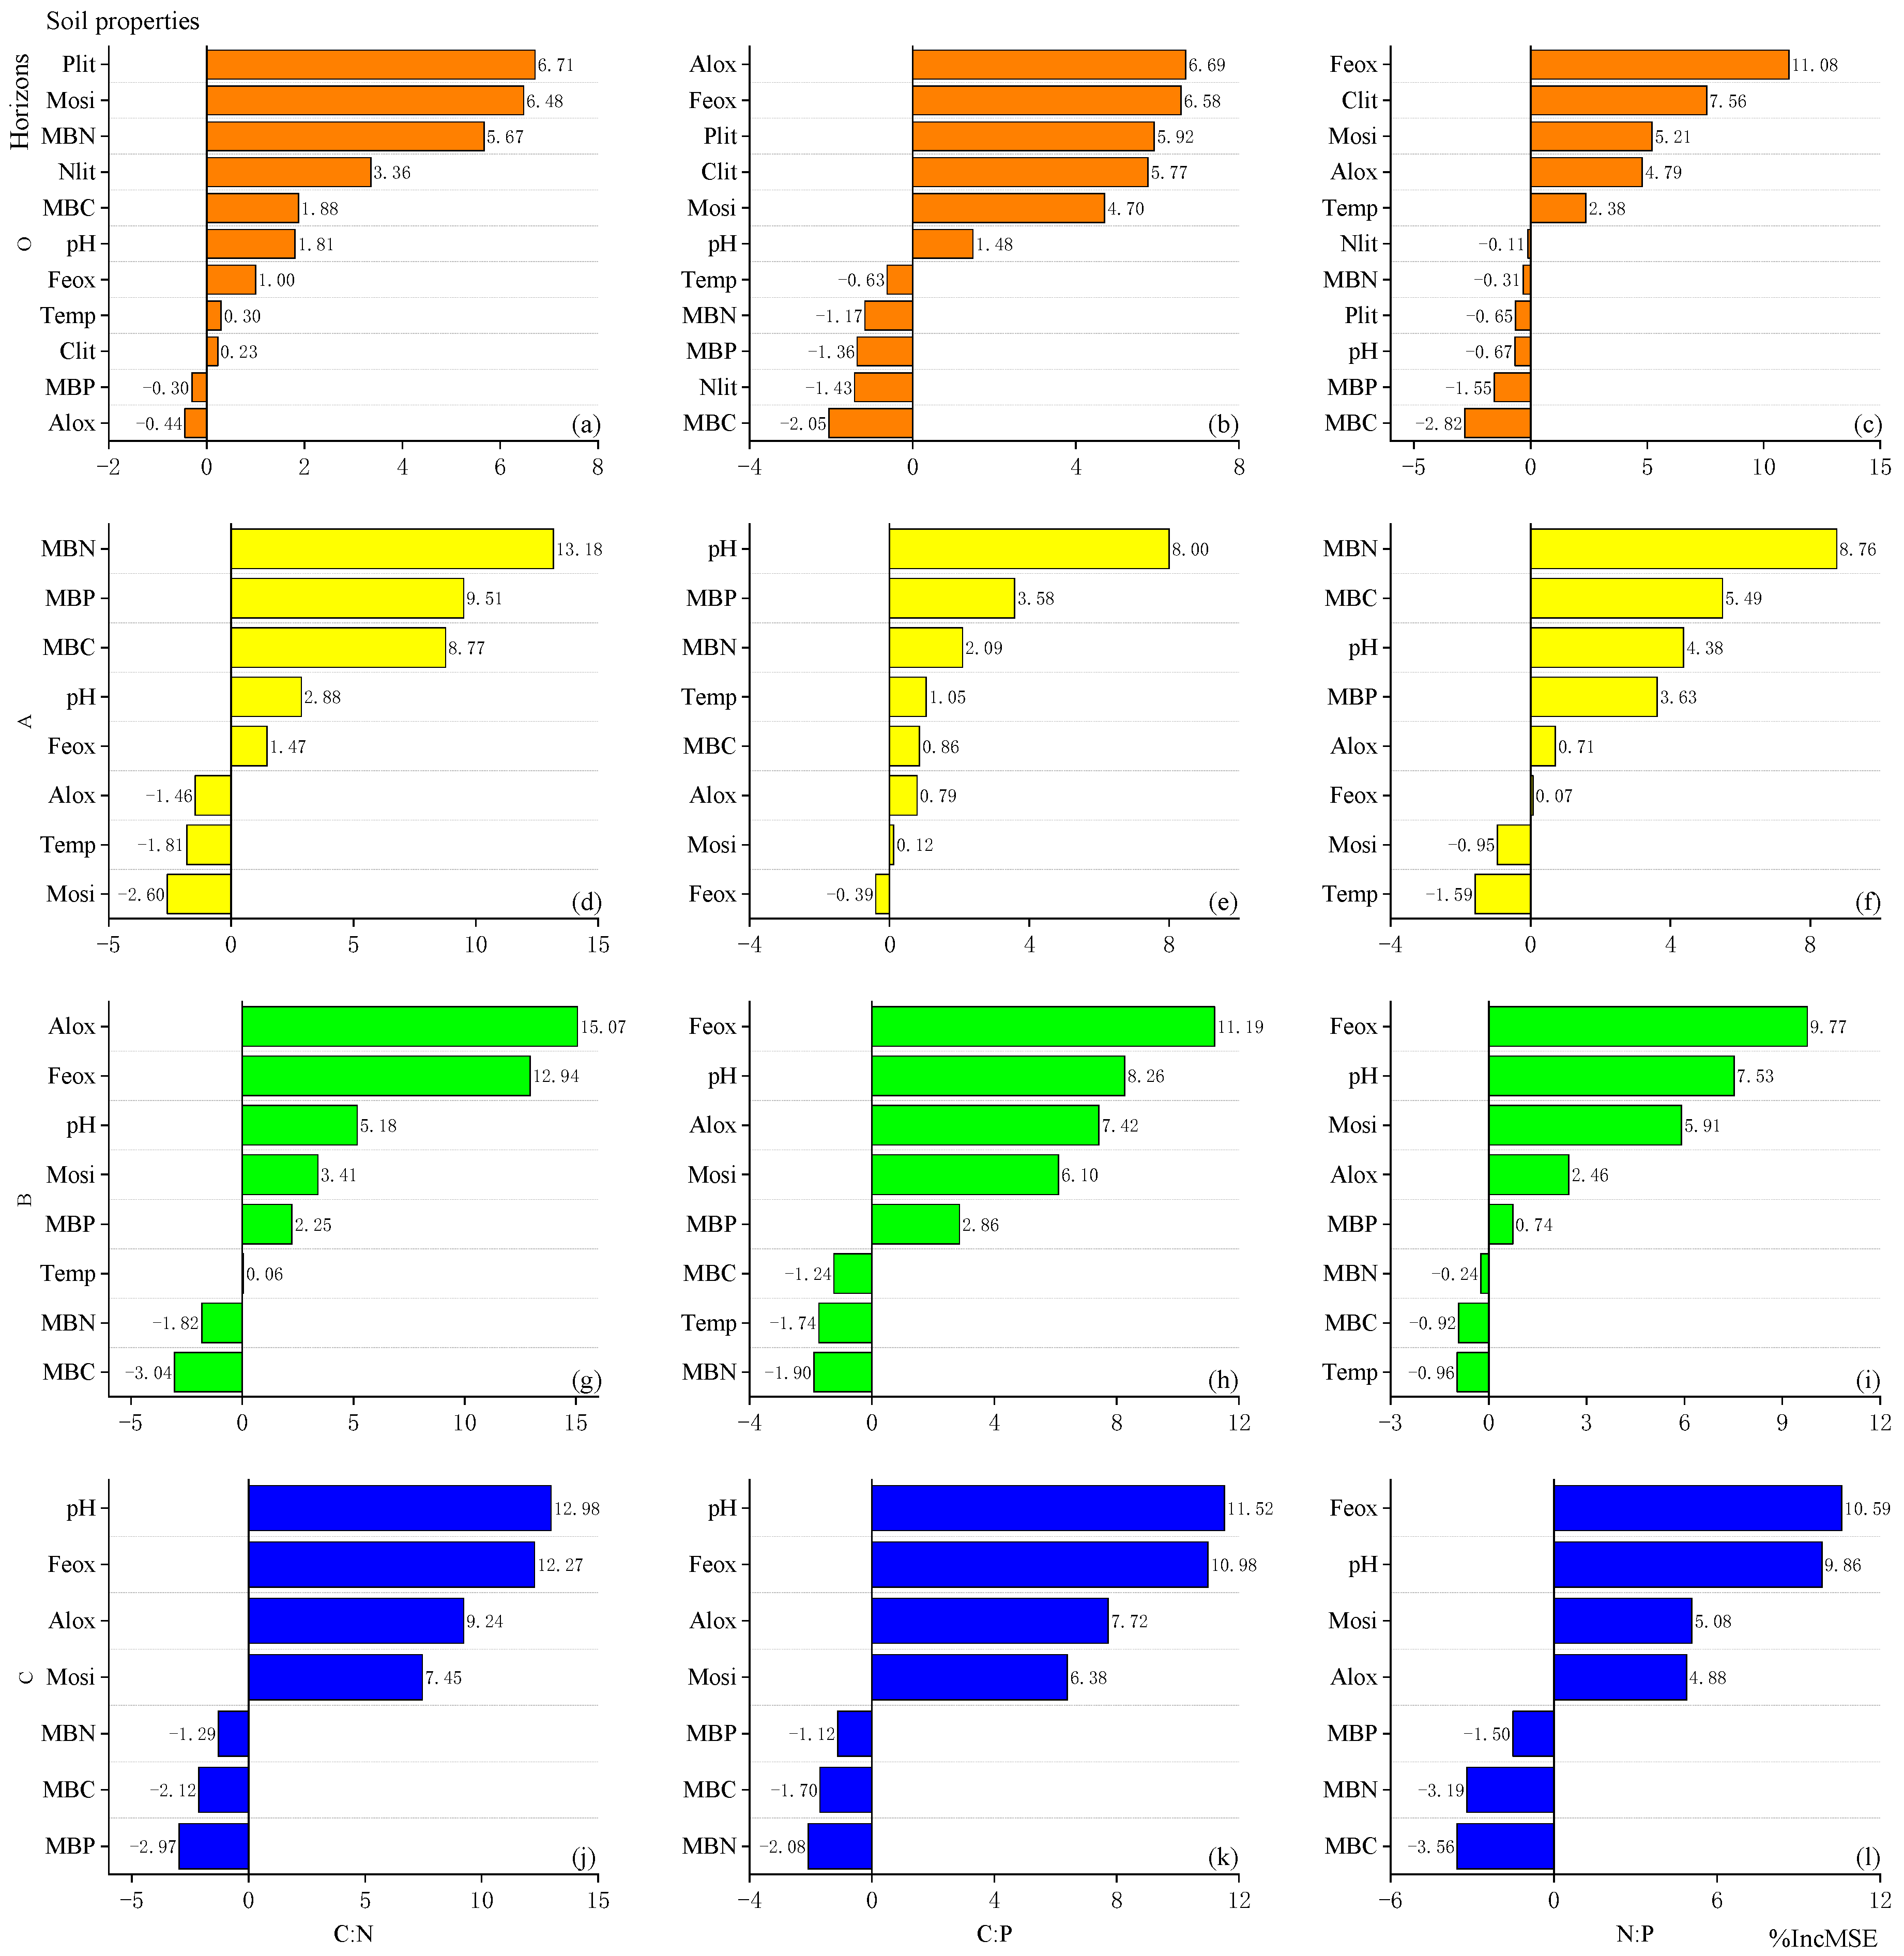
3.4. Impacts of Soil Properties on the C:N:P Stoichiometry

Random forest model results showed that the atomic ratios of C:N, C:P, and N:P were affected similarly by the selected biotic or abiotic factors in each horizon (Figure 4). The C:N, C:P, and N:P ratios in the O, B, and C horizons were primarily influenced by concentrations of Feox or Alox, with the exception of C:N ratios in the O horizon. In the A horizons, the C:N:P stoichiometry was notably influenced by microorganisms and pH values.

4. Discussion

The altitudinal distributions of soil C, N, and P in natural ecosystems are influenced by various factors, including climate, vegetation, microbial activity, and runoff [10,11,12]. Data from the 3000 m meteorological station on Gongga Mountain revealed low concentrations of C, N, and P in rainfall. Specifically, CO32− was undetectable, while HCO32−, N, and P were measured at 6.7 mg∙L−1, 0.1 mg∙L−1, and 0.3 mg∙L−1, respectively. This study focuses on the impacts of litter input and biogeochemical/physical processes on the altitude-dependent distributions of soil C, N, and P.

4.1. Leaching Effects on Concentrations of C, N, and P in Soils

In the subalpine area of Gongga Mountain, a notable decrease in soil temperature was observed with increasing altitude (Table 1), leading to reduced plant biomass and litter production [23,24]. However, the anticipated decline in soil C and N concentrations in the O horizon with altitude was not evident (Table 1, Figure 2). This lack of significant differences in C and N concentrations in the O horizon could be attributed to the presence of similar bedrocks, vegetation types, and minor altitude variations, resulting in consistent Clit and Nlit concentrations along the altitude gradient (Table 1, Figure 2). The findings from the random forest model indicated that C and N concentrations in the O horizons were significantly influenced by Clit (Figure 3a,b).
In contrast to the altitudinal distributions of C and N concentrations in the O horizons, notable variations were found in the mineral horizons (Figure 2). This study also identified significant differences in several soil physical and chemical properties between the mineral and O horizons, as shown in Table 1. Factors beyond litter production likely influence the distributions of C and N contents in mineral horizons at different altitudes. The study area, located on the eastern slope of Gongga Mountain, received the highest precipitation [20]. Prior studies in this region have documented substantial leaching in Cambisols (2628 m) and Luvisols (2781 m and 3044 m) soils, leading to rapid migration of soil solutes [21,22]. Concentrations of C and N in rainfall were notably lower compared to those in soil leachate (CO32− at 35.3 mg∙L−1, HCO32− at 367.5 mg∙L−1, N at 3.9 mg∙L−1) based on data from the 3000 m meteorological station at Gongga Mountain. During sampling, distinctive gray–white leaching horizons and bright brown sedimentation horizons were identified (Figure 1). Additionally, the pH in the A horizon was observed to be the lowest among the four horizons (Table 1), attributed to the intense leaching of alkaline particles [32,33]. The concentrations of Feox and Alox were lowest in the O horizon and highest in the B horizon (p < 0.05; Table 1). These findings collectively suggested that a leaching process was occurring in the Abies fabri (Mast.) Craib forest.
In comparison to previous studies conducted in spruce (Picea crassifolia) forest soil (0–10 cm) in the Qilian Mountains [9] and mixed spruce-fir-broadleaved forest soil (0–20 cm) [34], this research revealed lower concentrations of C and N in A horizons (Table 2). However, higher concentrations of C and N were found in the B and C horizons compared to soil samples taken at depths of 10–50 cm and 50–100 cm in temperate forests in China [35]. The soil in the study area was classified as “young”, characterized by a thin iron plate horizon that had not fully developed to retain all C and N in the B horizon [26,27]. As a result, some of the C and N were transported via the leaching process to the C horizon. The results of the random forest model indicated that C and N concentrations in O, B, and C horizons were primarily influenced by Feox (Figure 3). This indicated that soil C and N, along with Feox, leached from the O horizons and accumulated in the B and C horizons.
Table 2. Comparison of the concentrations and atomic ratios of C, N, and P in soils with other areas.
No.Study AreaConcentrations
(g kg−1)
Atomic RatiosReferences
  CNPC:NC:PN:P 
1Abies fabri (Mast.) Craib forest, Gongga Mountain, ChinaO horizon310 (12)15.6 (0.5)1.16 (0.02)23.19694.9129.90This study a
A horizon47 (3)3.0 (0.3)1.06 (0.02)19.45115.846.41
B horizon28 (4)1.4 (0.1)0.86 (0.04)21.9093.784.03
C horizon12 (2)0.7 (0.1)0.89 (0.04)18.8931.141.66
2Picea crassifolia forest, Qilian Mountains, China0–10 cm87.105.590.6118.40369.8520.53[9]
10–20 cm81.235.500.5817.18365.4621.37
20–30 cm76.934.980.5717.97351.9514.59
3Mixed spruce–fir–broadleaved forest, Jingouling Forest Farm, China 0–20 cm77.544.442.0117.538.62.2[34]
20–40 cm39.730.780.6250.964.11.3
4Forest, China0–20 cm///8.4 (3.4)93 (130.1)13.8 (22.8)[36]
Mean in all soils///10.710010.3
5Temperate forests, China0–10 cm24.601.880.7814.41369.3[35]
10–50 cm14.091.340.7112.3746.1
50–100 cm7.400.740.5911.2464.2
6Forest, Global0–10 cm///14.5211.714.6[37]
7Temperate coniferous forest, Global0–15 cm44.753.010.3819.9318.515.2[38]
a The data in this study are represented by the mean (standard error); / represents data deficient.
Compared to the O horizon, altitudinal distribution variations in soil C and N in the mineral horizons could be attributed to the C and N concentrations at the S2 site (Figure 2). Both C and N concentrations showed a significant decrease with soil depth (p < 0.05), with the most noticeable decline in the A horizons at the S2 site, where they decreased by 87.2% and 86.4%, respectively (Figure 2). This indicated a higher loss of C and N through leaching migration at the S2 site. The stronger leaching effect at the S2 site was supported by several pieces of evidence. Firstly, thicker, bright brown sedimentation horizons were identified at the S2 site during our sampling (Figure 1). Secondly, soil moisture at the S2 site was higher compared to the other sites (Table 1). Thirdly, pH values at the S2 site were the lowest among the three sampling sites (Table 1). Additionally, the concentration ratios of Feox and Alox at the S2 site were notably lower than at the other sites (p < 0.05, Table 3). In summary, the varying leaching strengths at different sampling sites resulted in different migrations of C and N, influencing the altitudinal distributions of C and N in the coniferous forest.
The P concentration in natural rainfall at the 3000 m meteorological station was only 0.3 mg∙L−1, indicating that soil P mainly originated from above-ground and underground biomass return [4,5] and rock weathering [10]. At higher altitudes with lower temperature and humidity, Plit concentrations decreased (Table 1), and rock weathering was weaker, supposing a decrease in soil P concentrations. However, the altitudinal distribution of P concentrations in O horizons increased with altitude (Figure 2c). In view of the above-mentioned interference of leaching on soil C and N and the impacts on the soil organic P discovered previously [21], we hypothesized that leaching also changed the altitude patterns of soil P, leading to significant losses. The speculation was further supported by the following reasons: (1) in comparison to previous studies, this research found lower P concentrations in A horizons [3] but higher contents in B and C horizons [9,34]; (2) the results of the random forest model showed that soil P concentration in the B horizon was significant controlled by Feox concentration (Figure 3i), suggesting that soil P infiltrated with the leaching of Feox; (3) the P content in the B horizon at the S2 site was notably lower compared to other sample sites (Figure 2c, Table 3), which was attributed to a significant amount of leaching loss. Overall, the leaching process significantly impacted the altitudinal distribution of soil P in the coniferous forest.

4.2. Leaching Effects on Soil C:N:P Stoichiometry

The C:N ratios in the O horizon were primarily influenced by Plit concentrations (Figure 4a), indicating that the spatial distribution of soil C:N ratios in the subalpine coniferous forest was primarily influenced by litter return, consistent with previous studies by Chen et al. and Li et al. [8,9]. Except for C:N ratios in the O horizon, the C:N, C:P, and N:P ratios in the O, B, and C horizons were primarily influenced by Feox or Alox concentrations (Figure 4). These findings highlighted the significant impact of leaching processes on the spatial distribution of soil C, N, and P, ultimately resulting in changes in the gradient distribution of soil C:N:P stoichiometry.
In accordance with Section 4.1, the S2 site exhibited heightened leaching, resulting in a notable depletion of C, N, and P. Notably, the C:N ratio in the mineral horizons at the S2 site was noticeably higher compared with other sites (p < 0.05, Figure 2d). This observation indicated that the more intensified leaching process led to a more significant movement of C in comparison to N. The C:P and N:P ratios in the B horizon at the S2 site were significantly higher compared to other sampling sites (p < 0.05, Figure 2e,f). In contrast, the N:P ratio in the A horizon was relatively low (Figure 2f). Additionally, concentrations of C and N in the B horizon at the S2 site were significantly higher than in other sample points, whereas P concentrations were notably lower (p < 0.05, Figure 2a–c), suggesting a greater leaching of C and N into the B horizon. This signified more pronounced downward leaching of C and N compared to P at the S2 site. Consequently, areas with stronger leaching experienced higher leaching of C and N than P, aligning with previous studies conducted by Mattsson et al. in undisturbed, forested catchments in Finland [39] and Jiang et al. in a typical subtropical acidic forest in China [40].
While the results we have shown highlight the importance of leaching on soil C, N, and P distributions in subalpine coniferous forests on Gongga Mountain, we are also aware of the limitations of this study. We acknowledge the absence of direct evidence on the leaching data for soil C, N, and P in our research. This lack of direct evidence presents a challenge in accurately quantifying the extent and rates of nutrient leaching. To address this limitation, we intend to utilize a combination of various analytical methods, including chemical analyses, isotopic tracers, and modeling, in future studies.

5. Conclusions

In order to examine the impact of leaching on nutrient cycling in mountainous regions, this study investigated the distribution of soil C, N, and P concentrations, as well as their stoichiometry, in a subalpine coniferous forest on the eastern slope of Gongga Mountain, spanning an elevation range from 2628 to 3044 m. While C and N concentrations, along with the C:N and N:P ratios, did not vary significantly among the sampling sites in O horizons, P concentrations increased gradually with altitude. In contrast, significant variations in C, N, and P concentrations, as well as stoichiometry, were observed in the mineral horizons, particularly at the 2781 m site, indicating stronger leaching effects. Furthermore, the leaching degree of C, N, and P from the O to B horizon at the 2781 m site followed the sequence C > N > P. These results highlight the greater vulnerability of soil C and N to leaching in mountain ecosystems compared to P, underscoring the need to prioritize monitoring soil C and N in nutrient management strategies.

Author Contributions

Conceptualization, X.H. and Y.W. (Yanhong Wu); Software, X.H. and Y.W. (Yaning Wang); Data curation, Y.W. (Yaning Wang) and J.H.; Writing—original draft, X.H. All authors have read and agreed to the published version of the manuscript.

Funding

This work was supported by the Hubei Provincial Natural Science Foundation of China (No. 2022CFB783).

Data Availability Statement

Data are contained within the article.

Acknowledgments

Thanks to J. Zhou., H. Bing., and H. Zhu. for their help with the field sampling and laboratory analyses.

Conflicts of Interest

The authors declare no conflicts of interest.

References

  1. Wu, X.; Chong, P.; Xu, E.; Zhao, W.; Jing, W.; Jin, M.; Zhao, J.; Wang, S.; Wang, R.; Ma, X. Relationships between Regeneration of Qinghai Spruce Seedlings and Soil Stoichiometry across Elevations in a Forest in North-Western China. Forests 2024, 15, 267. [Google Scholar] [CrossRef]
  2. Chen, Y.; Li, Y.; Wang, L.; Duan, Y.; Cao, W.; Wang, X.; Li, Y. Heterogeneity of Leaf Stoichiometry of Different Life Forms along Environmental Transects in Typical Ecologically Fragile Areas of China. Sci. Total Environ. 2023, 910, 168495. [Google Scholar] [CrossRef]
  3. Xia, G.; Guo, Q.; Lu, Q.; Du, Y.; Kang, Q. Soil Nutrients and Ecological Stoichiometry Characteristics Under Different Land Use Patterns in Loess Hilly Area. Bull. Soil Water Conserv. 2020, 40, 140–147, 153. [Google Scholar]
  4. Wang, Y.; Zhang, Y.; Wang, L.; Jing, X.; Yu, L.; Liu, P. Response of Leaf Biomass, Leaf and Soil C:N:P Stoichiometry Characteristics to Different Site Conditions and Forest Ages: A Case of Pinus Tabuliformis Plantations in the Temperate Mountainous Area of China. Front. Plant Sci. 2022, 13, 1060406. [Google Scholar] [CrossRef] [PubMed]
  5. Ma, R.; Hu, F.; Liu, J.; Wang, C.; Wang, Z.; Liu, G.; Zhao, S. Shifts in Soil Nutrient Concentrations and C:N:P Stoichiometry during Long-Term Natural Vegetation Restoration. PeerJ 2020, 8, 8382. [Google Scholar] [CrossRef] [PubMed]
  6. Lasota, J.; Blonska, E. C:N:P Stoichiometry as an Indicator of Histosol Drainage in Lowland and Mountain Forest Ecosystems. For. Ecosyst. 2021, 8, 513–522. [Google Scholar] [CrossRef]
  7. Wu, H.; Zou, M.; Wang, S.; Wan, H. Eco-stoichiometry Characteristics of Soil within Pine and Oak Mixed Forest and Theirs Responses to Elevation Gradient in Qinling Mountains. Ecol. Environ. Sci. 2019, 28, 2323–2331. [Google Scholar]
  8. Li, X.; Liu, G.; Wu, X.; Gi, G.; Li, L.; Mao, L.; Xu, H.; Wu, X. Elevational Distribution of Soil Organic Carbon, Nitrogen and Phosphorus Contents and Their Ecological Stoichiometry on Maxian Mountain. Chin. J. Ecol. 2020, 39, 758–765. [Google Scholar]
  9. Chen, L.; Long, Y.; Shen, X.; Jin, L.; Du, H. Ecological Stoichiometry of Soil C, N and P in Different Elevations of Picea crassipes Forest in Qilian Mountains. J. Northwest Norm. Univ. (Nat. Sci.) 2023, 59, 111–120. [Google Scholar]
  10. Huang, W.; Liu, C.; Liu, Y.; Huang, B.; Li, D.; Yuan, Z. Soil Ecological Stoichiometry and its Influencing Factors at Different Elevations in Nanling Mountains. Ecol. Environ. Sci. 2023, 32, 80–89. [Google Scholar]
  11. Li, L.; Li, S.; Deng, D.; Tu, W.; Vladimirov, D. Effect of Elevation on Soil Nutrient Content and Stoichiometric Characteristics under Hippophae rhamnoides L. Shrubs in Upper Min River. Southwest China J. Agric. Sci. 2019, 32, 1098–1103. [Google Scholar]
  12. Pepin, N.; Arnone, E.; Gobiet, A.; Haslinger, K.; Kotlarski, S.; Notarnicola, C.; Palazzi, E.; Seibert, P.; Serafin, S.; Schöner, W.; et al. Climate Changes and Their Elevational Patterns in the Mountains of the World. Rev. Geophys. 2022, 60, e2020RG000730. [Google Scholar] [CrossRef]
  13. Hensgens, G.; Laudon, H.; Peichl, M.; Gil, I.; Zhou, Q.; Berggren, M. The Role of the Understory in Litter DOC and Nutrient Leaching in Boreal Forests. Biogeochemistry 2020, 149, 87–103. [Google Scholar] [CrossRef]
  14. Wu, P.; Ding, Y.; Li, S.; Sun, X.; Zhang, Y.; Mao, R. Carbon, Nitrogen and Phosphorus Stoichiometry Controls Interspecific Patterns of Leaf Litter-Derived Dissolved Organic Matter Biodegradation in Subtropical Plantations of China. iForest-Biogeosci. For. 2021, 14, 80–85. [Google Scholar] [CrossRef]
  15. Kopacek, J.; Bace, R.; Choma, M.; Hejzlar, J.; Kaña, J.; Oulehle, F.; Porcal, P.; Svoboda, M.; Tahovská, K. Carbon and Nutrient Pools and Fluxes in Unmanaged Mountain Norway Spruce Forests, and Losses after Natural Tree Dieback. Sci. Total Environ. 2023, 903, 166233. [Google Scholar] [CrossRef] [PubMed]
  16. Pourmasoumi, M.; Khormali, F.; Ayoubi, S.; Kehl, M.; Kiani, F. Development and Magnetic Properties of Loess-Derived Forest Soils along a Precipitation Gradient in Northern Iran. J. Mt. Sci. 2019, 16, 1848–1868. [Google Scholar] [CrossRef]
  17. Liu, X.; Luo, C.; Xiang, Y.; Xiao, Y.; Zhou, S.; Tie, L.; Hu, J.; Han, B.; Huang, S.; Huang, C. Effects of Simulated Precipitation Changes on Soil Enzyme Activities in a Natural, Evergreen, Broad-Leaf Forest in the Rainy Area of Western China. Chin. J. Appl. Environ. Biol. 2020, 26, 635–642. [Google Scholar]
  18. Weil, S.; Martinez-Almoyna, C.; Piton, G.; Renaud, J.; Boulangeat, L.; Foulquier, A.; Saillard, A.; Choler, P.; Poulenard, J.; Münkemüller, T.; et al. Strong Links between Plant Traits and Microbial Activities but Different Abiotic Drivers in Mountain Grasslands. J. Biogeogr. 2021, 48, 2755–2770. [Google Scholar] [CrossRef]
  19. Chen, Q.; Zhou, Z.; Cai, S.; Lv, M.; Yang, Y.; Luo, Y.; Jiang, H.; Liu, R.; Cao, T.; Yao, B.; et al. Spatial-temporal Variation of Soil Organic Matter Decomposition Potential in China. Soil Tillage Res. 2024, 235, 105898. [Google Scholar] [CrossRef]
  20. Yang, Y.; Wang, K.; Hu, Z.; Wang, G. Meteorological Dataset Observed by Alpine Ecosystem Observation and Experiment Station of Gongga Mountain, Chinese Academic of Sciences, during 1998-2018. China Sci. Data 2020, 5, 1–10. [Google Scholar]
  21. He, X.; Zhou, J.; Wu, Y.; Bing, H.; Sun, H.; Wang, J. Leaching Disturbed the Altitudinal Distribution of Soil Organic Phosphorus in Subalpine Coniferous Forests on Mt. Gongga, SW China. Geoderma 2018, 326, 144–155. [Google Scholar] [CrossRef]
  22. Niu, J.; Yu, X.; Zhao, Y.; Zhang, D.; Chen, L.; Zhang, Z. Study of Soil Preferential Flow in the Dark Coniferous Forest of Gongga Mountain, China. Acta Phytoecol. Sin. 2006, 30, 732–742. [Google Scholar]
  23. Luo, J.; Yang, Z.; Yang, Q. A Study of the Biomass and Production of Forest on the Gongga Mountain. Acta Phytoecol. Sin. 2000, 24, 191–196. [Google Scholar]
  24. Luo, J.; Cheng, G.; Chen, B.; Li, W. Characteristic of Forests Litterfall along Vertical Spectrum on the Gongga Mountain. J. Mt. Sci. 2003, 21, 287–292. [Google Scholar]
  25. Shen, Z.; Fang, J.; Liu, Z.; Wu, J. Patterns of Biodiversity along the Vertical Vegetation Spectrum of the East Aspect of Gongga Mountain. Acta Phytoecol. Sin. 2001, 25, 721–732. [Google Scholar]
  26. Yu, D. Vertical Zonal Characteristics of Soil in Gongga Mountain. Chin. J. Soil Sci. 1984, 15, 65–68. [Google Scholar]
  27. IUSS Working Group WRB. World Reference Base for Soil Resources 2014. International Soil Classification System for Naming Soils and Creating Legends for Soil Maps; World Soil Resour. Rep. No. 106; FAO: Rome, Italy, 2014; pp. 143, 156. [Google Scholar]
  28. Maynard, D.; Curran, M. Soil Density Measurement in Forest Soils. In Soil Sampling and Methods of Analysis, 2nd ed.; Cartery, M., Gregorich, E., Eds.; CRC Press—Taylor & Francis Group: Boca Raton, FL, USA, 2006; pp. 863–869. [Google Scholar]
  29. Carter, M.; Gregorich, E. Soil Sampling and Methods of Analysis, 2nd ed.; CRC Press: Boca Raton, FL, USA, 2006; pp. 307–316. [Google Scholar]
  30. Murphy, J.; Riley, J. A Modified Single Solution Method for the Determination of Phosphate in Natural Waters. Anal. Chim. Acta 1962, 27, 31–36. [Google Scholar] [CrossRef]
  31. Wu, J.; He, Z.; Wei, W.; O’Donnell, A.; Syers, J. Quantifying Microbial Biomass Phosphorus in Acid Soils. Biol. Fertil. Soils 2000, 32, 500–507. [Google Scholar] [CrossRef]
  32. Bol, R.; Julich, D.; Brödlin, D.; Siemens, J.; Kaiser, K.; Dippold, M.A.; Spielvogel, S.; Zilla, T.; Mewes, D.; von Blanckenburg, F.; et al. Dissolved and Colloidal Phosphorus Fluxes in Forest Ecosystems-An almost Blind Spot in Ecosystem Research. J. Plant Nutr. Soil Sci. 2016, 179, 425–438. [Google Scholar] [CrossRef]
  33. Lavkulich, L.M.; Arocena, J.M. Luvisolic Soils of Canada: Genesis, Distribution, and Classification. Can. J. Soil Sci. 2011, 91, 781–806. [Google Scholar] [CrossRef]
  34. Zhao, H.; Wang, H.; Hu, X.; Lei, X.; Du, X.; Zou, J.; Cui, X. Influencing Factors of Soil Organic Carbon in Mixed Spruce-fir-broadleaved Forest based on Structural Equation. Chin. J. Ecol. 2024, 43, 264–272. [Google Scholar]
  35. Tian, H.; Chen, G.; Zhang, C.; Melillo, J.; Hall, C. Pattern and Variation of C:N:P Ratios in China’s Soils: A Synthesis of Observational Data. Biogeochemistry 2010, 98, 139–151. [Google Scholar] [CrossRef]
  36. Pan, Y.; Fang, F.; Tang, H. Patterns and Internal Stability of Carbon, Nitrogen, and Phosphorus in Soils and Soil Microbial Biomass in Terrestrial Ecosystems in China: A Data Synthesis. Forests 2021, 12, 1544. [Google Scholar] [CrossRef]
  37. Cleveland, C.; Liptzin, D. C:N:P Stoichiometry in Soil: Is There A “Redfield ratio” for the Microbial Biomass? Biogeochemistry 2007, 85, 235–252. [Google Scholar] [CrossRef]
  38. Xu, X.; Thornton, P.; Post, W. A Global Analysis of Soil Microbial Biomass Carbon, Nitrogen and Phosphorus in Terrestrial Ecosystems. Glob. Ecol. Biogeogr. 2013, 22, 737–749. [Google Scholar] [CrossRef]
  39. Mattsson, T.; Finér, L.; Kortelainen, P.; Sallantaus, T. Brook Water Quality and Background Leaching from Unmanaged Forested Catchments in Finland. Water Air Soil Pollut. 2003, 147, 275–298. [Google Scholar] [CrossRef]
  40. Jiang, J.; Wang, Y.; Yu, M.; Cao, N.; Yan, J. Soil Organic Matter is Important for Acid Buffering and Reducing Aluminum Leaching from Acidic Forest Soils. Chem. Geol. 2018, 501, 86–94. [Google Scholar] [CrossRef]
Figure 1. The study region and the sampling sites in the Abies fabri (Mast.) Craib on the eastern slope of Gongga Mountain.
Forests 15 01326 g001
Figure 2. The concentrations and atomic ratios of C, N, and P in soils. (a) Concentrations of C in O, A, B, and C horizons along the altitudes. (b) Concentrations of N in O, A, B, and C horizons along the altitudes. (c) Concentrations of P in O, A, B, and C horizons along the altitudes. (d) Atomic ratios of C:N in O, A, B, and C horizons along the altitudes. (e) Atomic ratios of C:P in O, A, B, and C horizons along the altitudes. (f) Atomic ratios of N:P in O, A, B, and C horizons along the altitudes. S1, S2, and S3 are sampling sites which established at altitudes of 2628 m, 2781 m, and 3044 m, respectively. Different lowercase letters above the error bars indicate significant differences (p < 0.05) among sites for the same horizon. The error bars represent the standard error.
Forests 15 01326 g002
Figure 3. Random forest model determining the impacts of soil properties on the C, N, and P concentrations. (ac) Random forest model determining the impacts of soil properties on the C, N, and P concentrations in the O horizon, respectively. %IncMSE values are shown in orange bars. (df) Random forest model determining the impacts of soil properties on the C, N, and P concentrations in the A horizon, respectively. %IncMSE values are shown in yellow bars. (gi) Random forest model determining the impacts of soil properties on the C, N, and P concentrations in the B horizon, respectively. %IncMSE values are shown in green bars. (jl) Random forest model determining the impacts of soil properties on the C, N, and P concentrations in the C horizon, respectively. %IncMSE values are shown in blue bars. In the O horizon, 11 soil properties were selected, including Clit, Nlit, Plit, Temp., Mois., pH, Feox, Alox, MBC, MBN, and MBP. For the A and B horizons, 8 soil properties were chosen, similar to those in the O horizon, except for Clit, Nlit, and Plit. The C horizon also had 7 selected soil properties, matching most of those in the O horizon except for Clit, Nlit, Plit, and Temp. Clit, Nlit, and Plit represent the concentrations of C, N, and P in litter in the OL horizon. Temp. stands for soil temperature, Mois. for soil moisture, Feox and Alox for acid ammonium-oxalate extractable iron and aluminum, and MBC, MBN, and MBP for the microbial biomass C, N, and P.
Forests 15 01326 g003
Figure 4. Random forest model determining the impacts of soil properties on the C:N:P stoichiometry. (ac) Random forest model determining the impacts of soil properties on the C, N, and P concentrations in the O horizon, respectively. %IncMSE values are shown in orange bars. (df) Random forest model determining the impacts of soil properties on the C, N, and P concentrations in the A horizon, respectively. %IncMSE values are shown in yellow bars. (gi) Random forest model determining the impacts of soil properties on the C, N, and P concentrations in the B horizon, respectively. %IncMSE values are shown in green bars. (jl) Random forest model determining the impacts of soil properties on the C, N, and P concentrations in the C horizon, respectively. %IncMSE values are shown in blue bars. In the O horizon, 11 soil properties were selected, including Clit, Nlit, Plit, Temp., Mois., pH, Feox, Alox, MBC, MBN, and MBP. For the A and B horizons, 8 soil properties were chosen, similar to those in the O horizon, except for Clit, Nlit, and Plit. The C horizon also had 7 selected soil properties, matching most of those in the O horizon except for Clit, Nlit, Plit, and Temp. Clit, Nlit, and Plit represent the concentrations of C, N, and P in litter in the OL horizon. Temp. stands for soil temperature, Mois. for soil moisture, Feox and Alox for acid ammonium-oxalate extractable iron and aluminum, and MBC, MBN, and MBP for the microbial biomass C, N, and P.
Forests 15 01326 g004
Table 1. Soil properties of the sampling sites in the Abies fabri (Mast.) Craib on the eastern slope of Gongga Mountain 1.
HorizonsSiteTemp. 2
(°C)
Mois. 3
(%)
pHFeox 4
(g kg−1)
Alox 4
(g kg−1)
MBC 5
(mg kg−1)
MBN 5
(mg kg−1)
MBP 5
(mg kg−1)
Clit 6
(g kg−1)
Nlit 6
(g kg−1)
Plit 6
(mg kg−1)
OS19.2 (0.0) a214 (14) b5.1 (0.1) a2.3 (0.4) a0.88 (0.14) a927.9 (92.4) a 199.9 (13.5) a 119.7 (9.1) a428 (9) a14.8 (0.6) a547 (7) b
S27.9 (0.2) b338 (30) a4.2 (0.1) b1.2 (0.1) b0.68 (0.09) a590.7 (76.3) b 148.1 (12.9) b 97.1 (7.8) a452 (5) a14.5 (1.0) a686 (19) a
S37.0 (0.0) c281 (35) ab4.8 (0.1) a1.4 (0.3) b0.66 (0.11) a655.1 (63.9) b 141.7 (3.9) b 108.0 (10.6) a 447 (11) a15.5 (0.3) a427 (11) c
Average8.0 (0.3)277 (19)4.7 (0.1)1.6 (0.2)0.74 (0.07)724.6 (55.4)163.2 (8.7)108.3 (5.5)442 (5)14.9 (0.4)553 (27)
AS18.8 (0.2) a61 (14) a5.0 (0.1) a7.8 (0.8) a3.57 (0.43) a131.7 (26.6) ab35.7 (7.0) a17.7 (2.5) a   
S27.1 (0.2) b63 (6) a4.3 (0.1) b4.0 (0.6) b1.90 (0.29) b74.6 (10.4) b12.1 (1.7) b5.1 (0.9) b   
S36.3 (0.3) b64 (6) a4.5 (0.1) b5.0 (0.4) b1.67 (0.16) b166.8 (21.2) a33.2 (4.5) a21.2 (4.4) a   
Average7.4 (0.4)62 (5)4.6 (0.1)5.6 (0.5)2.38 (0.27)124.4 (14.4)27.0 (3.7)14.7 (2.3)   
BS18.4 (0.2) a45 (6) a5.8 (0.2) a6.2 (0.6) b4.66 (0.68) b27.4 (8.1) a5.6 (1.8) a1.6 (0.7) a   
S26.7 (0.4) b56 (13) a4.9 (0.1) b13.8 (1.2) a7.59 (0.68) a21.4 (12.3) a7.2 (2.7) a0.8 (0.8) a   
S35.6 (0.0) c31 (1) a5.4 (0.1) ab5.1 (0.3) b2.49 (0.16) c13.2 (6.9) a6.4 (1.4) a1.5 (0.7) a   
Average6.9 (0.4)44 (5)5.3 (0.1)8.3 (1.0)4.91 (0.59)20.7 (5.3)6.4 (1.1)1.3 (0.4)   
CS1 18 (2) b6.3 (0.2) a1.4 (0.1) c1.96 (0.32) b13.5 (4.9) a6.6 (2.3) a0.9 (0.9) a   
S2 43 (6) a5.6 (0.2) b6.9 (1.2) a6.34 (1.20) a10.7 (4.7) a4.4 (1.4) a0.9 (0.5) a   
S3 34 (3) a5.8 (0.1) b4.4 (0.4) b1.94 (0.20) b15.5 (4.3) a4.7 (0.7) a0.4 (0.4) a   
Average 32 (3)5.9 (0.1)4.2 (0.7)3.41 (0.64)13.2 (2.6)5.2 (0.9)0.7 (0.3)   
1 The data are represented by the mean (standard error), with n = 6 for each site. Different lowercase letters after the data indicate significant differences (p < 0.05) among sites for the same horizon. 2 Temp. represents soil temperature. n = 3 for each site. 3 Mois. represents soil moisture. 4 Feox and Alox represent the acid ammonium-oxalate extractable iron and aluminum. 5 MBC represents microbial biomass C. MBN represents microbial biomass N. MBP represents microbial biomass P. 6 Clit, Nlit, and Plit represent the concentrations of C, N, and P in litters.
Table 3. Concentrations ratios of soil properties in the A horizon measured against those in the B horizon of the sampling sites 1.
SiteS1S2S3
FeoxA/FeoxB1.31 (0.17) a0.30 (0.05) b1.01 (0.10) a
AloxA/AloxB0.83 (0.12) a0.26 (0.04) b0.67 (0.06) a
CA/CB1.98 (0.16) b1.02 (0.13) c3.29 (0.18) a
NA/NB2.19 (0.13) b1.16 (0.20) c3.93 (0.31) a
PA/PB1.11 (0.02) b1.53 (0.08) a1.17 (0.07) b
1 The data are represented by the mean (standard error), with n = 6 for each site. Different lowercase letters after the data indicate significant differences (p < 0.05) among sites.
Disclaimer/Publisher’s Note: The statements, opinions and data contained in all publications are solely those of the individual author(s) and contributor(s) and not of MDPI and/or the editor(s). MDPI and/or the editor(s) disclaim responsibility for any injury to people or property resulting from any ideas, methods, instructions or products referred to in the content.

