Article

Individual Carbon Modeling in Eucalyptus Stands in the Cerrado Region

by
Fabiana Piontekowski Ribeiro
1,2,*,
Thais Rodrigues de Sousa
1,
Fernanda Rodrigues da Costa Silva
1,
Ana Caroline Pereira da Fonseca
1,*,
Marcela Granato Barbosa dos Santos
1,
Jane Ribeiro dos Santos
1,
Douglas Rodrigues de Jesus
1,
Clara Milena Concha Lozada
1,3,
Marco Bruno Xavier Valadão
4,
Eder Pereira Miguel
1,
Alexsandra Duarte de Oliveira
2,
Arminda Moreira de Carvalho
2 and
Alcides Gatto
1
1
Universidade de Brasília-UnB, Campus Universitário Darcy Ribeiro, Brasília 70904-970, Distrito Federal, Brazil
2
Embrapa Cerrados, BR 020, Km 18, Planaltina 73310-970, Distrito Federal, Brazil
3
Grupo de Investigación en Tecnología y Ambiente, Calle 5 No. 3-85, Popayán 190001, Cauca, Colombia
4
Universidade Federal do Acre, Campus Floresta, Cruzeiro do Sul 69980-000, Acre, Brazil
*
Authors to whom correspondence should be addressed.
Forests 2024, 15(8), 1332; https://doi.org/10.3390/f15081332
Submission received: 3 July 2024 / Revised: 19 July 2024 / Accepted: 24 July 2024 / Published: 1 August 2024
(This article belongs to the Section Forest Inventory, Modeling and Remote Sensing)

Abstract

:
In the context of global climate change, eucalyptus stands in the planted forest sector have become a viable alternative for reducing greenhouse gas (GHG) emissions, in addition to presenting great potential for the carbon (C) stock. Thus, the objective of this study was to quantify C stocks in different eucalyptus compartments, in addition to evaluating three mathematical models at the individual tree level. We evaluated four areas of eucalyptus stands located in the Federal District, Brazil. The data were collected from the forest inventory and rigorous cubing procedures using the following statistical models: Spurr, Schumacher–Hall, and adapted Schumacher–Hall. The highest Pearson’s linear modification coefficient, lowest root means square error percentage (RMSE%), and lowest Akaike information criterion (AIC) were used to select the best model. The C content and stock varied between the compartments and areas studied owing to age and, above all, genetic differences. Clone I224 had the highest carbon concentration per acre at 233.35 Mg ha−1 and carbon difference per compartment. The adapted Schumacher–Hall was the best model. It included data on biometric factors, such as the diameter at breast height, height, and age. The contribution of eucalyptus plantations to carbon sequestration is fundamental to socioenvironmental enhancement.

1. Introduction

On a global scale, the land ecosystem is able to remove more carbon (C) from the atmosphere than it emits, so the biosphere is a C sink that captures nearly 2.3 billion tons of carbon per year [1,2]. Climate change and variability have become a reality owing to increased greenhouse gas (GHG) emissions from anthropogenic activities and increased fossil fuel consumption. Consequently, global warming has intensified, with a temperature increase of more than 1 °C in less than two centuries [3]. Global warming influences natural cycles and agricultural and forest crop dynamics. It has become a global concern for humanity, necessitating the search for alternatives to reduce or control emissions and their effects [4,5,6]. Furthermore, advancing our knowledge of carbon storage is essential, as the implications of climate change can already be understood and demand quick and practical solutions [7].
Forest ecosystems contribute the most to the absorption of the global net CO2 exchange, accounting for 51.75% [2], and play a crucial role in regulating the global C balance and absorbing GHGs [8]. Research indicates a decline in carbon sinks due to the loss of forest ecosystems, and the significant variability in carbon levels is strongly related to the large uncertainties regarding changes in land use [9]. Globally, it is estimated that forests allocate 80% of carbon above ground, while 40% is estimated to be stored in the rhizosphere [10]. Thus, the root fraction plays an important role in forest structure, but is often omitted in C storage estimates due to the difficulties and costs associated with measurement [11]. Similar to natural systems, integrated production systems and eucalyptus stands play an important role in C storage, with great potential for effectively reducing GHG levels in the atmosphere [6,12,13]. The genus Eucalyptus has significant relevance in multi-product production, especially in the global production of energy and pulp, with 95 countries accounting for 22.57 million hectares of the planted area [14]. Even dystrophic soils exhibit a great accumulation of shoot biomass. This is attributed to the increasing age of the stands, which contain a total of 11.8 Mg ha−1 year−1 of C reserves in shoot biomass [15,16].
In pursuit of increased production capacity, tree breeding programs consider the phenotypic values of dendrometric traits [17,18]. They have produced eucalyptus clones with different growth rates, even on sites with similar soil and climate conditions [19]. These clones can have different yields and, consequently, different C stocks owing to their characteristics, such as photosynthetic capacity [20], leaf area, crown structure, light interception [21], C allocation by compartment [20], and wood density [22,23]. Due to genetic improvement, large plantation areas have ended up with little or no variability, a situation that becomes a risk, as clones are often not tested in all possible environmental conditions [17].
In Brazil, eucalyptus is the main commercial species, with an estimated capacity to store 1.79 Bi Mg ha−1 CO2 eq and covering approximately 9.93 million hectares, representing 77.2% of cultivated forest areas [24], with a predominance of clonal hybrids [17]. The C stock in eucalyptus stands is one of the primary environmental contributions of these crops, helping reduce global warming and climate variability through C fixation and stocks [25,26]. Like native forests, eucalyptus cultivation has a negative CO2 flux, regardless of the biome in which it is located [27].
Genetics and crop management influence the increase in eucalyptus biomass [12,28]. In turn, scientific studies enable us to obtain detailed knowledge of the parameters of trees and stands [29,30], and growth and production models help simulate tree growth (height and diameter) at a range of detail levels [31].
Individual modeling is a promising approach for evaluating the C stock in eucalyptus stands, enabling dynamic C accumulation estimates and projections over time, which can be assessed by biometry [32,33]. However, various models should be tested before selecting or ranking the most suitable one for specific conditions, as volume equation coefficients can vary according to factors such as age, density, and site [34,35].
Knowing the dendrometric parameters of a stand is key to good forestry system management [29,30]. Individual modeling provides reliable quantification in eucalyptus stands [36]. Complex, rigorous cubing provides accurate estimates of the volume of the studied trees [12,37,38] in addition to possible biases, which can increase the accuracy [39].
Numerous studies have been conducted with the aim of modeling the detailed growth of eucalyptus stands, using average values of tree characteristics and remote sensing imagery [40,41,42,43]. However, these do not present individual C modeling, nor do they include roots, which, despite being a considerable contribution, is difficult to obtain. Therefore, studies including a precise estimation of the amount of C in different forest compartments are still scarce.
Thus, the following questions were formulated: How do eucalyptus plantations of different ages and clones behave in relation to C storage? What is the best way to apply and adjust models to increase the accuracy of estimates for these stands in the Cerrado region? Based on these questions, the following objectives were formulated: (1) estimate the distribution of C stock in different tree compartments (leaves, branches, wood, bark, and roots) and total eucalyptus stands, considering variations by age and genetic material; and (2) test three models of individual-level C estimates with different input parameters in eucalyptus stands located in the Federal District, Brazil.

2. Materials and Methods

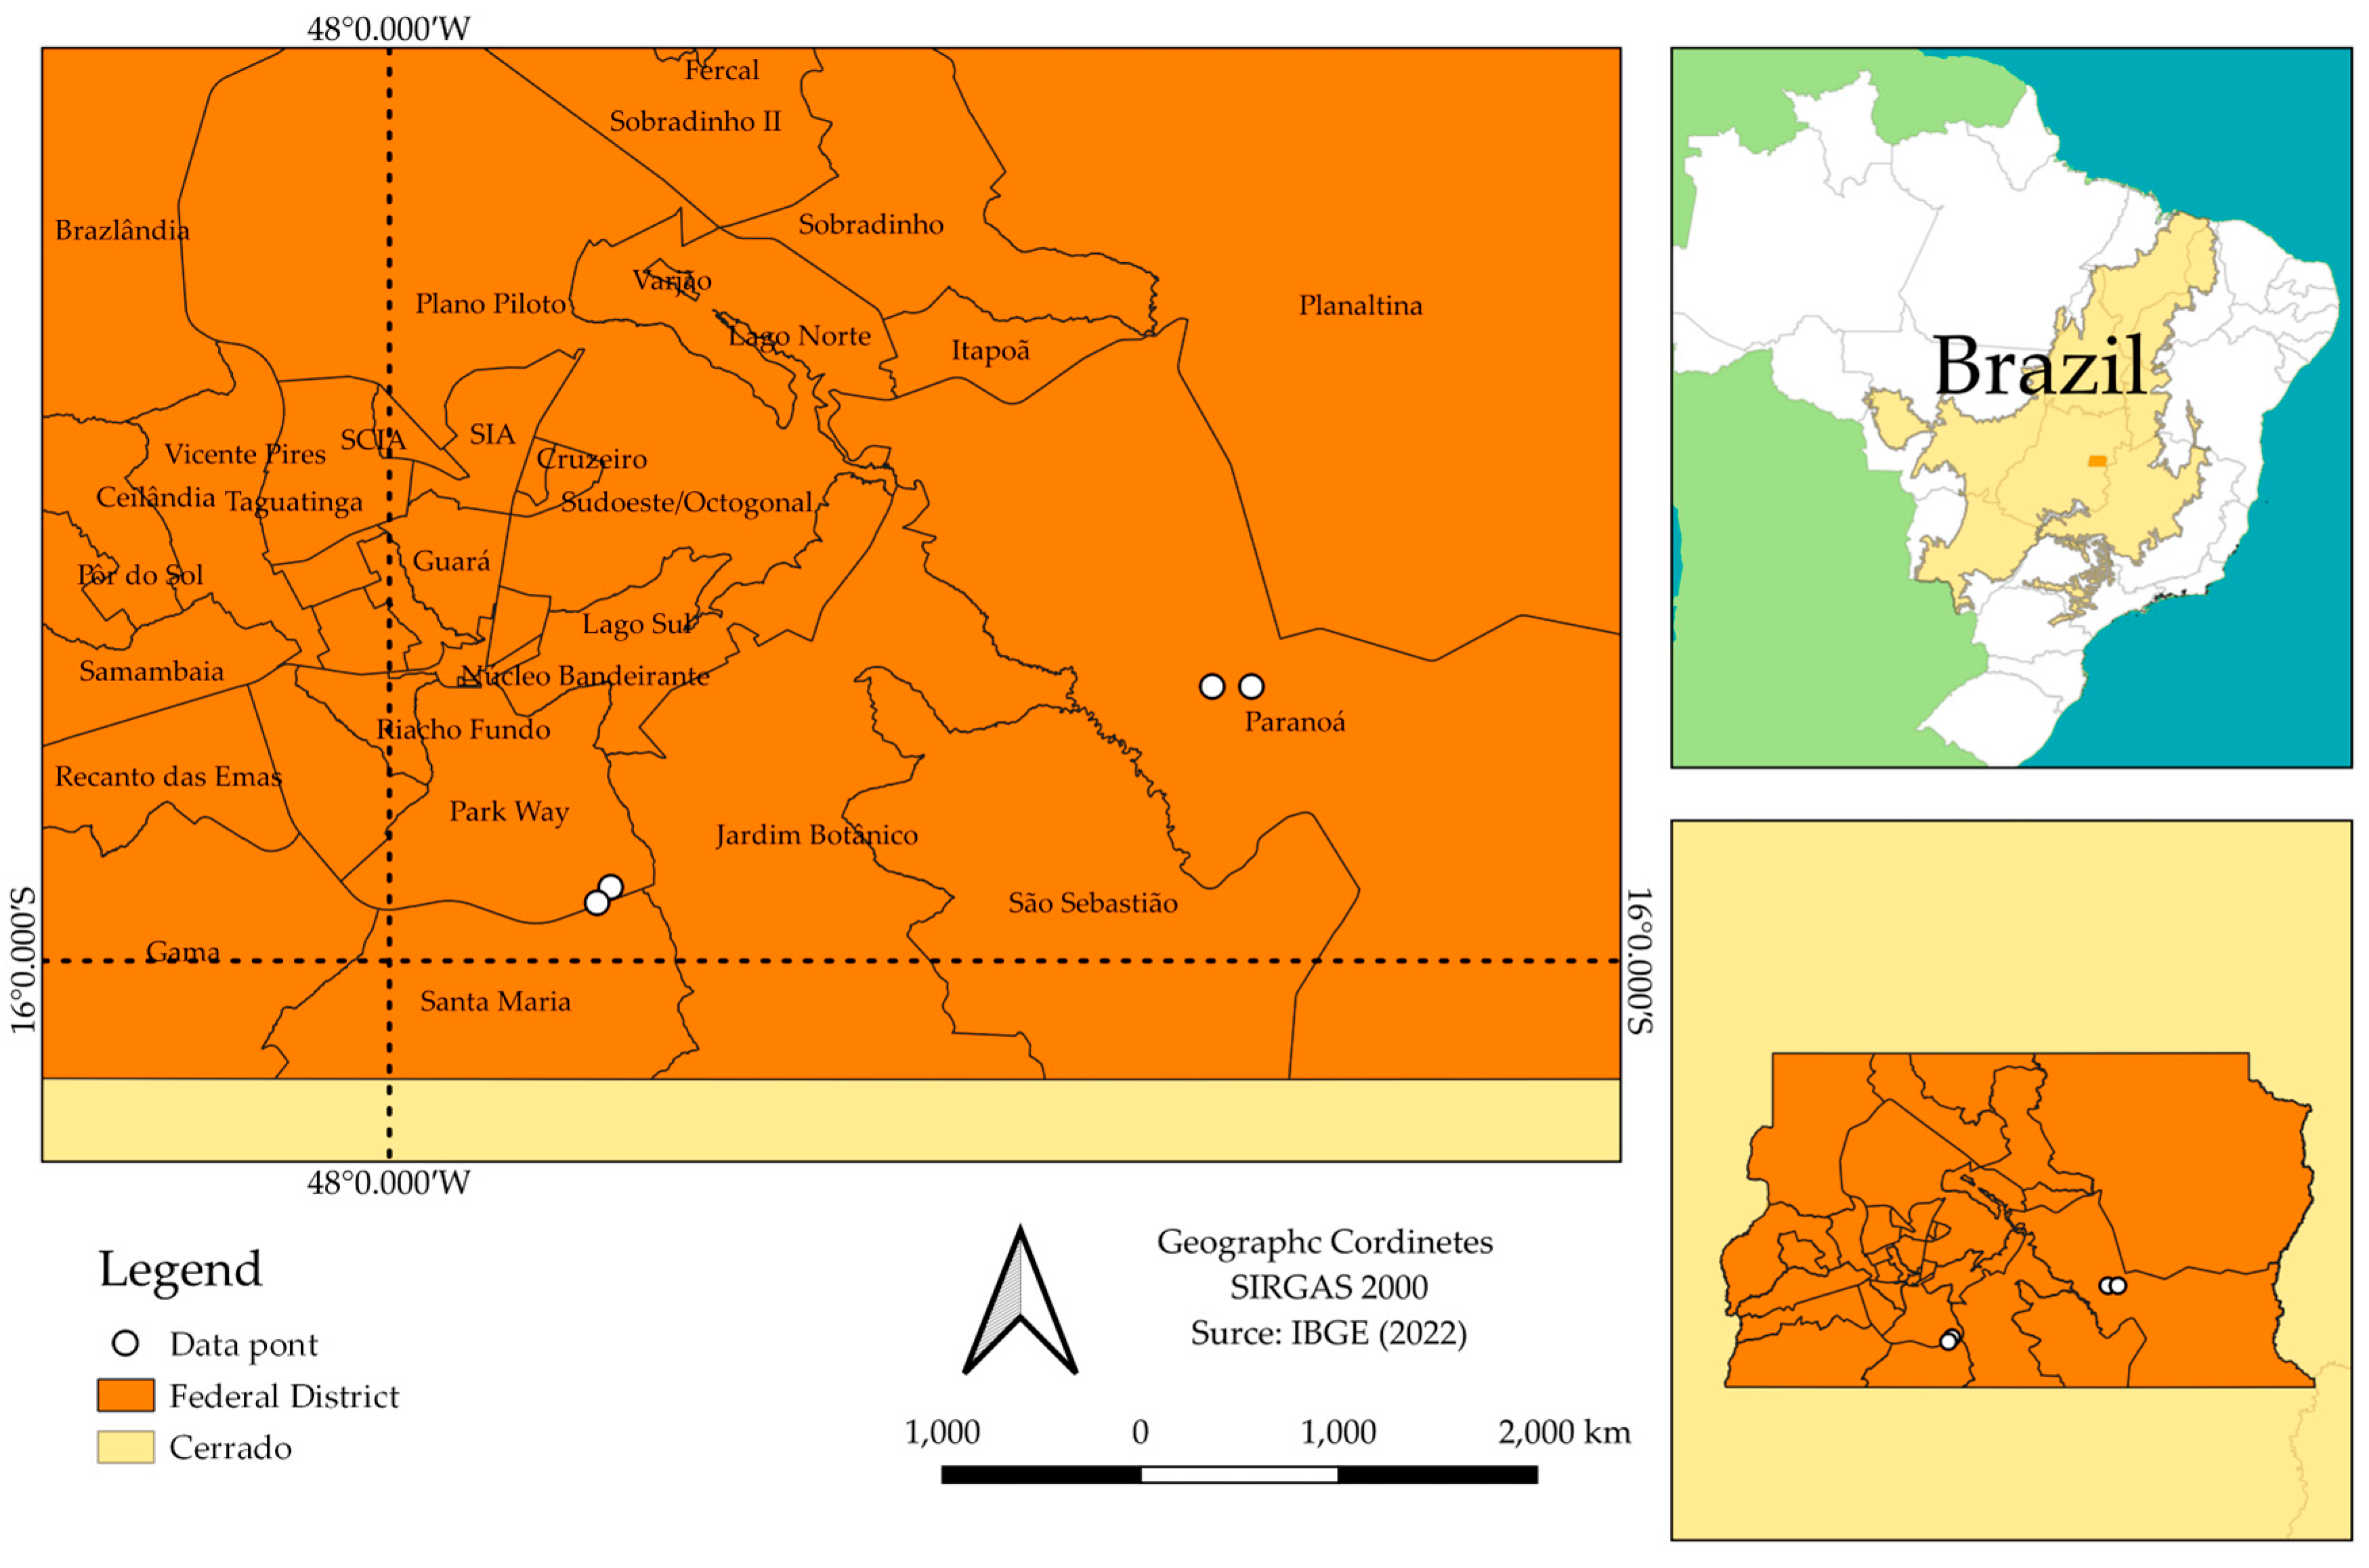
2.1. Localization and Characterization in Experiment

We collected data in four experimental areas in the Federal District in the central-west region of Brazil. Two were located at Fazenda Água Limpa (FAL), which belongs to the University of Brasilia (UnB), Núcleo Rural Vargem Bonita (15°58′ S, 47°54′ W and 15°58′ S, 47°54′ W), and the others were located in Núcleo Rural Quebrada dos Neres, Paranoá (15°53′ S, 47°39′ W and 15°53′ S, 47°38′ W) (Figure 1).
The stands were located in the Cerrado biome, with two well-defined seasons: a rainy season between October and April, and a dry season between May and September. The average annual temperatures and accumulated rainfall values in 2014, 2015, and 2016 were 20.3, 22.3, and 20.9 °C, and 1500, 1052, and 1272 mm, respectively. Table 1 presents a detailed description of the experimental areas.

2.2. Tree Cubing

A total of 49 random plots measuring 10 × 10 and 20 × 30 m were set up within the forest stand. We measured the diameter at breast height (DBH) of all specimens. An electronic clinometer and hypsometer (Haglõf HEC-2) was used to randomly measure the total height (h) of some trees in the plot. Subsequently, to better represent the stands, the trees were classified based on their position in the vertical forest stratum as suppressed, intermediate, and dominant, with well-structured crowns and no gaps in the planting and neighboring rows. The trees were felled at 10 cm from the ground, respecting the proportion of each diameter class.
We determined the total and commercial height of the felled trees, cubing the stem (trunk) with the Smalian method to calculate the volume of wood. After rigorous cubing, the trees were sectioned and their compartments (leaves, branches, wood, and bark) were weighed. The green weight of the compartments was weighted for each tree using an electronic scale with a maximum capacity of 300 kg, accurate to 0.05 kg.
Subsequently, we collected compartment samples to measure the dry biomass using the dry-to-wet mass ratio. Stem and branch samples (disks) were 3 cm thick and were collected every 0.5 m along their total length. A leaf compartment sample of approximately 300 g was collected and dried in an oven. This sample included leaves from the lower, middle, and upper parts of the crown.
The collected samples were packed separately in plastic bags to prevent water loss, then weighed on a 0.01 g precision analytical scale and stored for subsequent determination of the dry weight. Individual tree samples were sent to the laboratory of the Brazilian Agricultural Research Corporation for the Cerrado (Embrapa) and dried in an oven at 103 ± 2 °C, except for the leaves, which were dried at 65 ± 2 °C until a constant mass was obtained. The dried samples were individually weighed to determine the dry weight and were subsequently ground in a knife mill, followed by a ball mill. They were then sieved in granulometric sieves, and 3 g of material retained in a 120-mesh sieve was used to determine the C levels in a CHNS Macro Vario Cube elemental analyzer.

2.3. Root C

Roots were collected from the eucalyptus stands using ten circular monoliths dug into each tree, which had a mean diameter of 23 cm and were placed at a depth of 0–60 cm. The monoliths were distributed in four directions from the stump of the felled tree: two on each side, along the planting line, and three on each side, perpendicular to the planting line (between rows). The first monolith in each direction was marked at a distance of 50 cm from the stump, and the others were marked at a distance of 50 cm from each other, according to the method proposed by Gatto [28].
The roots were manually separated from soil and other plant materials using sieves with a 2 mm mesh, and were then washed to remove excess soil. Root samples were weighed on a precision scale to obtain the wet mass, and were subsequently dried in a forced ventilation oven (65 ± 5 °C) until a constant biomass was obtained. Root samples were individually sent to the Embrapa Cerrado laboratory to determine the C content in the CHNS analyzer. After determining the dry mass, the roots were calculated using the equation of cylinder volume: V = π r2 h.

2.4. Statistical Analysis

The data of C content for the various compartments (wood, branches, bark, leaves, and roots) and quantitative data for shoot, root, and total biomass per tree were tested for normality using the Shapiro–Wilk test, followed by analysis of variance (ANOVA). Mean differences were assessed to detect variations between areas and tree compartments using Tukey’s test (p < 0.05) in the SISVAR software (version 5.6). Subsequently, linear and non-linear models (Table 2) were fitted, selected, and validated to predict the C stock in each tree.

2.5. Model Selection and Validation

Once the results from different models fitted for predicting individual C stocks were obtained, the best model was selected according to the following statistical criteria: highest Pearson’s linear correlation coefficient between the observed and predicted values ( r y ^ y ), lowest root mean square error percentage (RMSE%) [46], and lowest Akaike information criterion (AIC) [47]. A graphical analysis of residuals was conducted to evaluate the distribution of observed and predicted values, and a histogram of relative error frequencies was established.
r y ^ y = x x ¯ y y ¯ x x ¯ 2 y y ¯ 2
RMSE % = 100 Y ¯ i = 1 n ( Y i Y ^ i ) 2 n
A I C = 2 n 2 · l n 1 n i = 1 n e i 2 + 2 K n n K 1
where yi = observed value; y i ^ = value estimated by the model; n = number of observations; K = number of model coefficients; y ¯ = mean of observed values of the dependent variable; L n = maximum likelihood function of the model.
Subsequently, the cross-validation method (k-fold) was employed to validate the data and model, as recommended by Bergmeir [48]. In this method, the total dataset was divided into k mutually exclusive subsets, among which one subset was used for testing and the remaining k-1 subsets were used for estimating the parameters of the selected model, thus calculating and validating the accuracy of the model. This process was repeated k times, with circular rotation of the data subset. In this analysis, the total dataset (49 trees) was divided into five k subsets (10, 10, 10, 10, and 9), generically known as A, B, C, D, and E. The car, caret, ds, and nlme packages of the R software v. 4.3.2 [49] were used for analyses.

3. Results

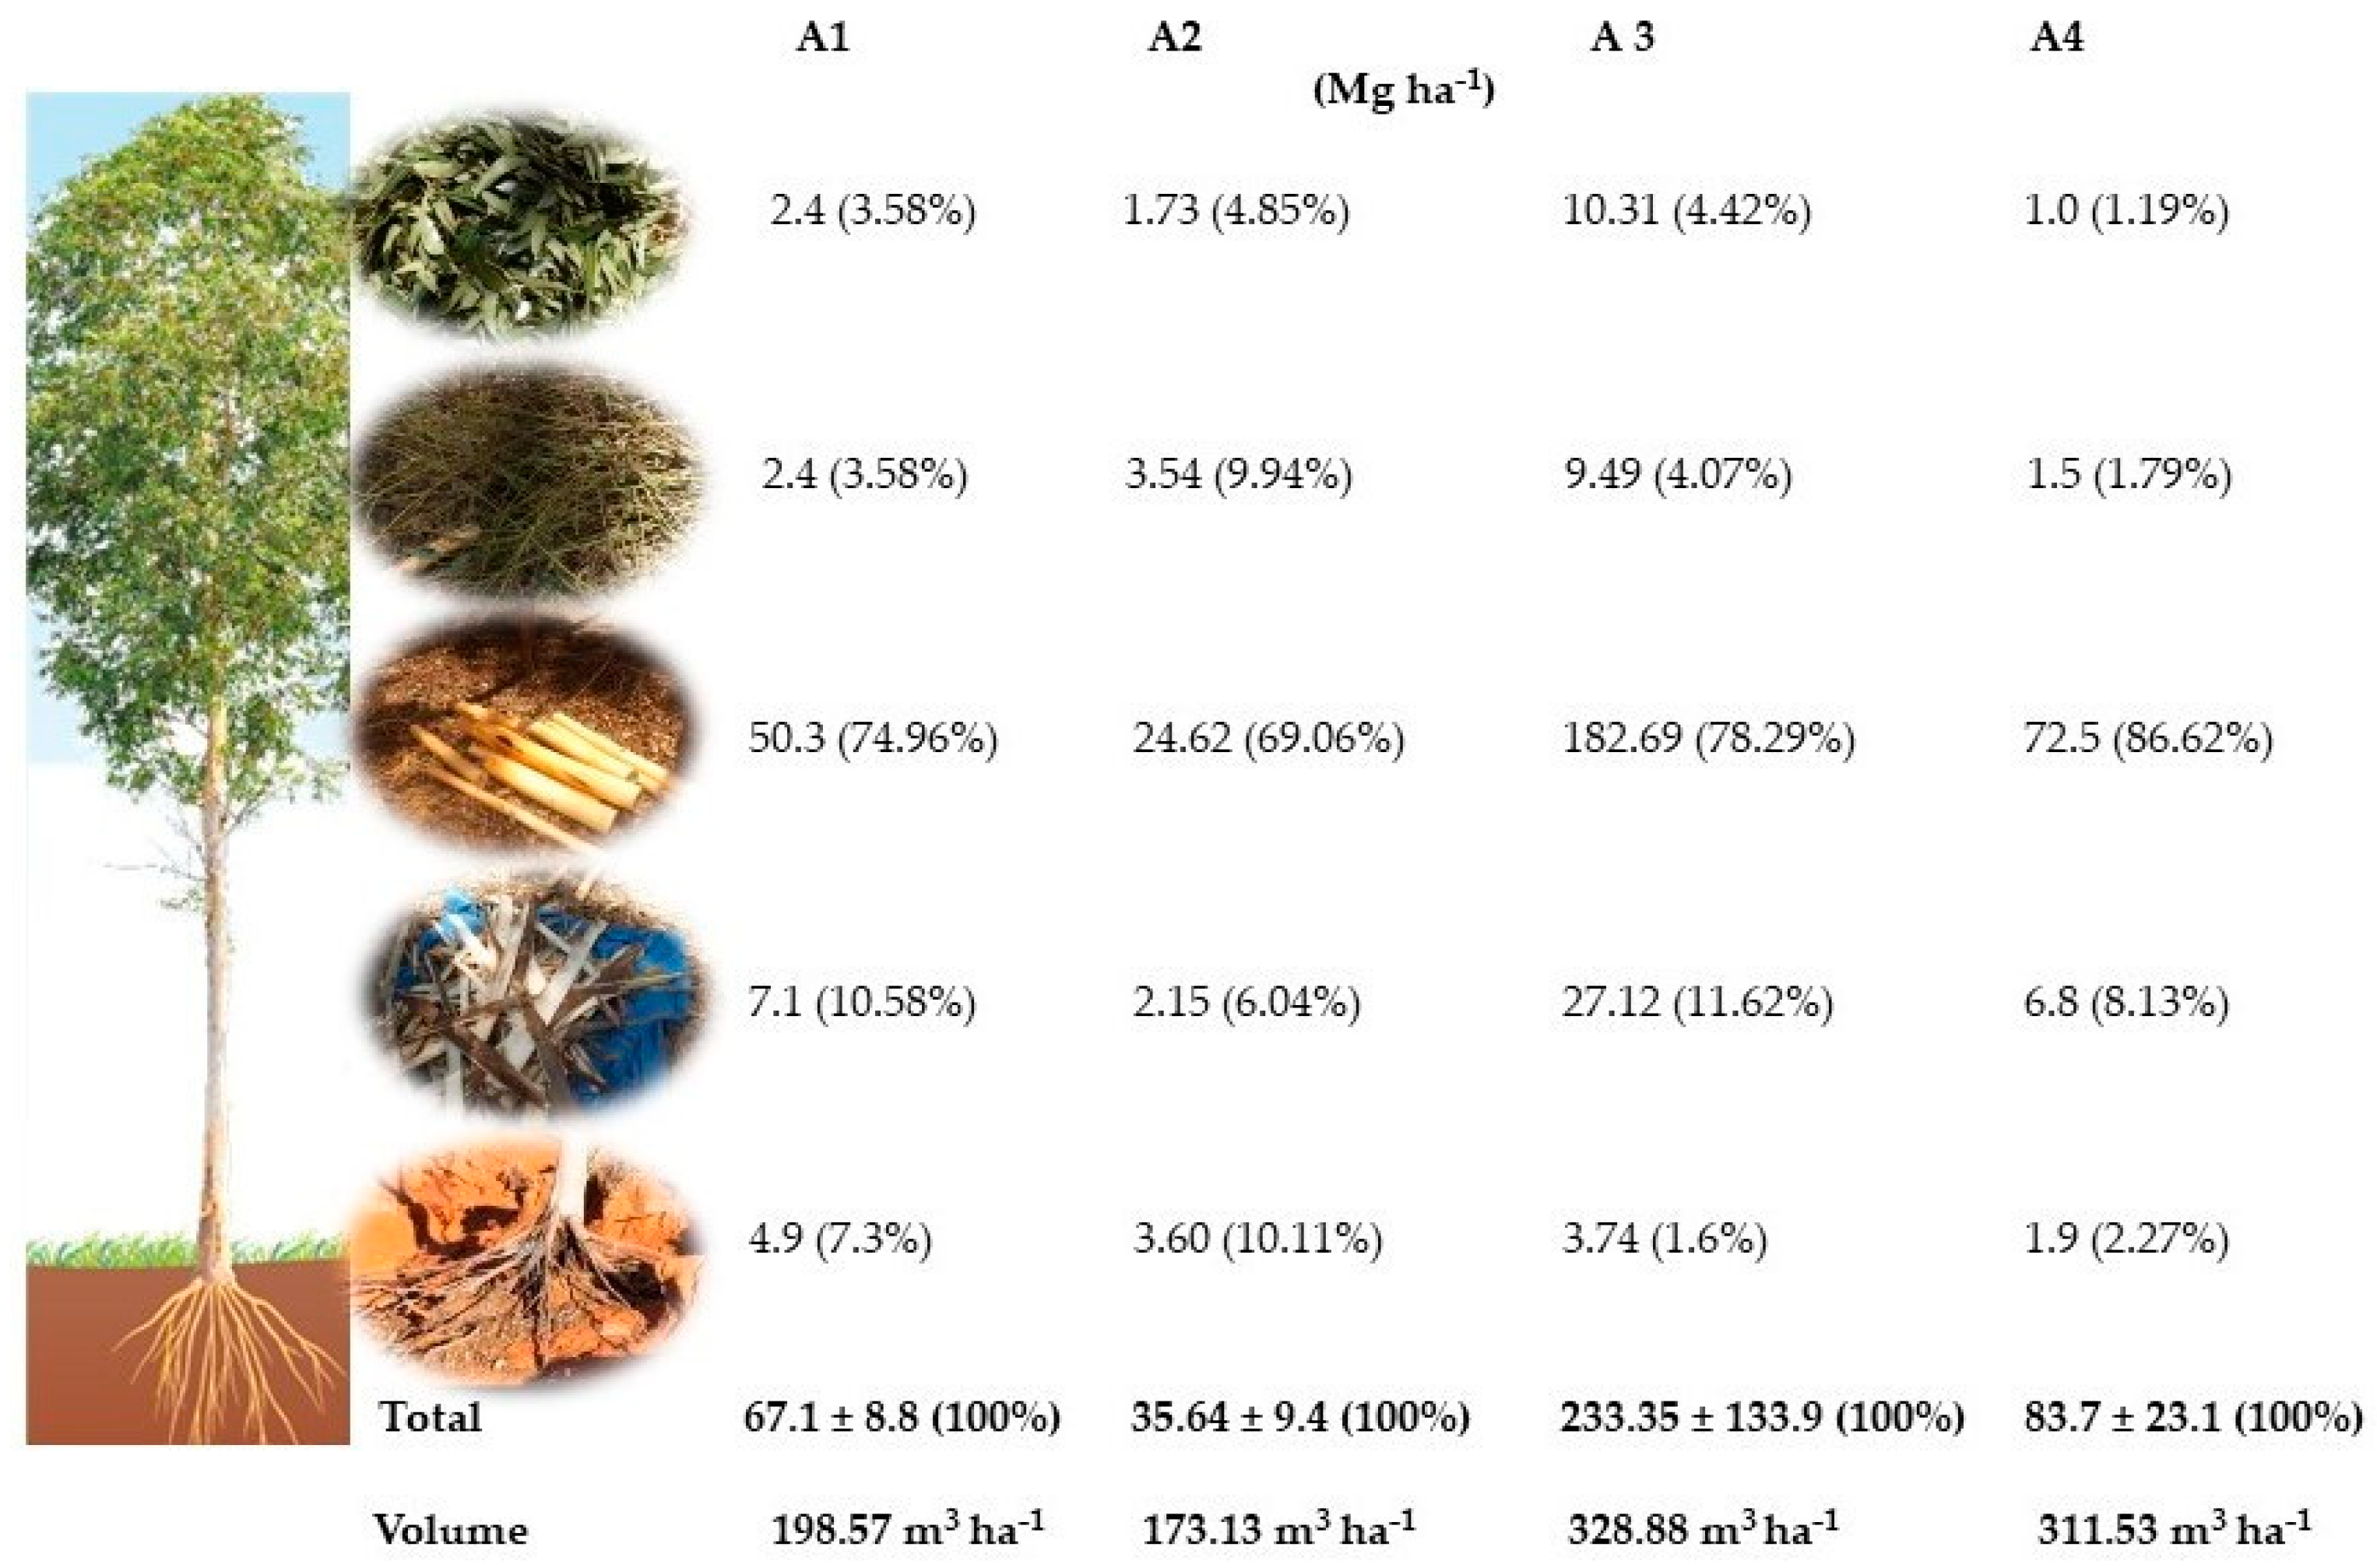
3.1. Carbon Content and Stock in Eucalyptus urophylla × Eucalyptus grandis Trees

The mean C values for different eucalyptus compartments in the four studied areas are presented in Table 3. The C contents showed a statistical difference in area 3 (clone I224), both between compartments and areas. Wood showed a higher C content than the other compartments (p < 0.05). The mean values showed no statistical difference in the other three areas.
The comparison between the stands highlighted that area A2, even at 12 months, had more than half the wood C stock (compartment with the highest C contribution ≥ 69.06% for all areas) compared to area A1. Area A3 had greater representation in all compartments except for roots and stored 64% more C than area A4 with the same age. With the exception of area A2, it was possible to observe an increase in productivity and C storage at different ages of eucalyptus (Figure 2).
The data indicated significant variations in the shoot, root, and total C stocks between eucalyptus trees with different clones and ages (Table 4). Shoot C stocks showed a statistically significant difference between areas (p < 0.05). Area 3 showed the highest total C stock, with a mean of 82.58 kg per tree (p < 0.05). Root C stocks were the same in areas 1 and 4 at 48 and 72 months, respectively. Area 3 showed the highest C stock regardless of the evaluated compartment.

3.2. Individual C Modeling

The model fit and accuracy indices used to estimate individual C levels in eucalyptus trees indicated that our equations could accurately correct the correlation coefficients, with RMSE% and AIC lower than 13% and 280, respectively. Thus, the three models showed satisfactory fit and accuracy. In the constants used for each model, the parameters DBH, h, and age were considered (Table 5). Model 1 incorporated the interaction of these three parameters, presenting the best fit, with a correlation of 0.99 between observed and predicted values, an RMSE% below 10%, and the lowest AIC coefficient. The Akaike coefficient estimates the relative amount of information lost by a given model. Therefore, the less information a model loses, the higher its fit quality and the lower its AIC score.
Figure 3 shows the residual dispersion (%), the ratio of observed to estimated C (kg), and residual classes for the three models in eucalyptus stands. Model 1 showed the lowest residual dispersion and ratio of observed to estimated C, indicating a better fit to the data on the trend line. The estimates of the three logarithmic percentage residual equations showed significant regression coefficients (p < 0.001). Model 1 also showed the best coefficient of determination (r = 0.99), which ranged between −45.92 and −35.75 kg C. The coefficients of determination of models 2 (r = 0.98) and 3 (r = 0.98) ranged between −45.21 and −57.99 kg C, and −46.19 and −55.98 kg C (Figure 3).

3.3. Model Validation

Considering the statistics of fit and accuracy, model 1 most accurately predicted the individual C stock in trees from eucalyptus stands in the Federal District (Table 6). It was then subjected to the cross-validation test, which corroborated the fit and accuracy statistics (Table 5).

4. Discussion

The soil and climatic conditions of the Cerrado in the study areas are quite similar, mainly due to the total area of the Federal District. The climate is described as Aw (Köppen), with two well-defined seasons: dry winters (April to September) and rainy summers (October to March) [50]. The soils of all plantations are described as Latosol and have good porosity and permeability [51,52]. Soil preparation for the establishment of the plantations also followed the same pattern, with the correction of acidity by liming and mineral fertilization. The only condition that differs between the areas is the different clones and ages. The C content and stock tended to increase according to the age and genetics in hybrid Eucalyptus urophylla × Eucalyptus grandis stands. The C content was particularly influenced by genetics, with clone I224 (A3) showing the highest C level per tree and greatest C difference per compartment. Differences in both the concentration and compartmental content were influenced by genetic improvements. Clones with high C production in the shoots tended to have lower C content in the subsoil [20]. This trend can be justified by the higher basic wood density of clone I224, namely 0.677 g cm−3 [51], compared with that of clones EAC1528 (0.531 g cm−3) [53], E. urograndis (0.433 g cm−3) [22], and GG100 (0.595 g cm−3) [54].
In addition to the genetic factors, both the shoot and root C stocks varied significantly with stand age, with increasing C levels over time. Kumar [55] reported a rapid increase in C in eucalyptus stands with an age of up to six years, corroborating the findings of this study. This growth justifies the inversely proportional root percentages of C. Considering the study areas, A3 had the highest shoot stock, and A1 showed the highest root stock percentage. Decreased superficial roots in the older A3 stand may be related to the increased root depth with stand age, reducing the root C proportion [12,56].
Trees and soils are the dominant reservoirs of C at all ages of eucalyptus stands [57]. The areas studied have a C stock per individual ranging from 30 to 80 kg C. In both monoculture and integrated farming systems, the C stock is approximately 34.7 kg of C per tree in the Cerrado region. This amount is due to the production of dry branches in the first system and fresh branches [58].
Eucalyptus plantations play a crucial role as an ecosystem service, especially in terms of C sequestration, which gives them great relevance in mitigating climate change. In the stands in this study, the total C stock ranged from 35.64 to 233.35 Mg ha−1 C. The results obtained in studies by Gatto [59] with ages of 4, 5, and 6 years, the same as the present study, showed that the C stocks were 37.79–87.76, 51.41–99.74, and 66.28–104.42 Mg ha−1, respectively.
The practical implications of our study result in mathematical models that allow C estimates to be made for different regions of the Cerrado through forest inventories. We will now analyze the economic gains through C credits. According to the company CredCarbo, the value of a hectare is BRL 22.00 (https://credcarbo.com/carbono/creditos-de-carbono-valor-por-hectare-em-diversas-culturas/ (accessed on 19 July 2024)). Considering the areas with (A1, A3, and A4) and without (A2) genetic improvement, the values were A1 BRL 264.83 (BRL 1476.00), A2 BRL 140.68 (BRL 784.08), A3 BRL 921.11 (BRL 5133.70), and A4 BRL 330.39 (BRL 1841.40). These values are based on the dollar exchange rate on the day of the research, 19 July 2024. The differences in gains are notable: area A1, even though it is a year older, exceeds A2 by BRL 124.15 (BRL 691.92), due to genetic improvement. Area A3 exceeds A4 by BRL 3292.42 at the same age. These data indicate that the areas subjected to genetic improvement have significantly higher economic gains.
Selecting a unified model to track the progression of C stocks over time is crucial for clonal stands in Brazil. A comprehensive model integrating data across ages and genetic materials helps elucidate C variability in eucalyptus stands and identify regional patterns influencing C stocks [60,61]
The equation with the best fit for individual C stocks indicated an interaction of all three variables (Model 1; Table 4). Mathematical models that consider age and genetics are essential for accurately estimating C stocks in eucalyptus stands considering the regional conditions [29].
Our data suggest no clear C stock estimation trends, with different observed and estimated values, as indicated by the percentage residuals shown in Figure 3. This implies that both the non-linear Schumacher–Hall and the linear Spurr models may be used with good representativeness [62]. The presented metrics provide a quantitative evaluation of model fit to the data, highlighting performance differences in C estimates in the shoots.
The Schumacher–Hall model, well established for estimating the biomass in forest stands [20,37,63], shows promising results with DBH and height as input parameters but becomes more suitable for estimating C stocks when adapted to include the stand age.
Among the compared models, the non-linear Schumacher–Hall model demonstrated superior efficiency in eucalyptus stands, and is effective for estimating C stocks, decreasing GHG, and contributing to climate change adaptation [64]. Identifying a model that can emphasize the significance of C stocks in eucalyptus stands is crucial for enhancing management practices in the forestry sector. This contributes to national and regional policies aimed at climate change mitigation, including the restoration of degraded areas [65].

5. Conclusions

In the soil and climate conditions of Cerrado, Brazil, the age and genetics of eucalyptus stands influence C distribution in different compartments, predominantly in the shoots. Clone I224 had the highest mean C stock per tree (82.58 kg), the highest content between areas (55.40%), and the highest content per wood compartment (56.10%).
The non-linear Schumacher–Hall model, adapted to include age, resulted in the best fit, with r, RMSE%, and AIC values of 0.99, 9.65%, and 258, respectively. The strong performance of the model in the fitting and validation phases underscores its accuracy in estimating total individual C levels, including those in shoots and roots. This study presents relevant strategies in the context of climate change to reduce GHG emissions from planted forests, focusing mainly on genetic material in addition to the quantification of C stock by compartments, which allows us to better understand the capacity to store C, and a better selection of material, such as clone I224 with 233.35 Mg ha−1. Regarding future implications, the development of mathematical models allows the contribution of eucalyptus plantations in C fixation and storage to be quantified. It also allows the socio-environmental valuation of eucalyptus plantations and the estimation of carbon credits and highlights the contribution of eucalyptus plantations in Brazil to the mitigation of the greenhouse effect and global climate change. The technical methodological limitations of accurate cubing are due to the fact that it is a costly and time-consuming procedure, but it is necessary in order to optimize data accuracy.

Author Contributions

Conceptualization, F.P.R., M.B.X.V. and A.G.; methodology, F.P.R., A.G., E.P.M., A.C.P.d.F., T.R.d.S., D.R.d.J., M.G.B.d.S., J.R.d.S., F.R.d.C.S., M.B.X.V., C.M.C.L., A.D.d.O., A.M.d.C. and E.P.M.; software, E.P.M. and F.P.R.; validation, F.P.R., A.G., E.P.M. and M.B.X.V.; formal analysis, F.P.R. and E.P.M.; writing—original draft preparation, F.P.R., A.C.P.d.F., T.R.d.S., D.R.d.J., M.G.B.d.S., J.R.d.S., F.R.d.C.S. and C.M.C.L.; writing—review and editing, F.P.R., A.G., M.B.X.V., A.D.d.O., A.M.d.C. and E.P.M.; supervision, F.P.R., A.G. and E.P.M.; project administration, F.P.R.; funding acquisition, A.C.P.d.F. All authors have read and agreed to the published version of the manuscript.

Funding

The authors acknowledge the financial support from the Foundation for Research Support by the Federal District (Fundação de Apoio a Pesquisa do Distrito Federal—FAPDF (00193-00002122/2023-89).

Data Availability Statement

Data are contained within the article.

Acknowledgments

The authors acknowledge the financial support from the Foundation for Research Support by the Federal District (Fundação de Apoio a Pesquisa do Distrito Federal—FAPDF) and the Brazilian Agricultural Research Company (EMBRAPA—Cerrados, Planaltina, Brazil). The authors also acknowledge the educational support from the Federal University Brasília post-Graduate Support Program; Coordenação de Aperfeiçoamento de Pessoal de Nível Superior—Brasil (CAPES)—Finance; and the National Council for Scientific and Technological Development (CNPq/Brazil). We also thankful the support from Fazenda Água Limpa, especially Sebastião Carlos Abadio, Geraldo Cardoso Oliveira, Augusto Pereira Alves, Mauro Barbosa dos Santos, Luiz Carlos Oliveira, Weiner Raulã Moreira Diniz, and Augusto Álvaro Pereira dos Santos.

Conflicts of Interest

The authors declare no conflicts of interest.

References

  1. Baccini, A.; Goetz, S.J.; Walker, W.S.; Laporte, N.T.; Sun, M.; Sulla-Menashe, D.; Hackler, J.; Beck, P.S.A.; Dubayah, R.; Friedl, M.A.; et al. Estimated Carbon Dioxide Emissions from Tropical Deforestation Improved by Carbon-Density Maps. Nat. Clim. Chang. 2012, 2, 182–185. [Google Scholar] [CrossRef]
  2. Lian, Y.; Li, H.; Renyang, Q.; Liu, L.; Dong, J.; Liu, X.; Qu, Z.; Lee, L.-C.; Chen, L.; Wang, D.; et al. Mapping the Net Ecosystem Exchange of CO2 of Global Terrestrial Systems. Int. J. Appl. Earth Obs. Geoinf. 2023, 116, 103176. [Google Scholar] [CrossRef]
  3. Calvin, K.; Dasgupta, D.; Krinner, G.; Mukherji, A.; Thorne, P.W.; Trisos, C.; Romero, J.; Aldunce, P.; Barrett, K.; Blanco, G.; et al. IPCC, 2023: Climate Change 2023: Synthesis Report. Contribution of Working Groups I, II and III to the Sixth Assessment Report of the Intergovernmental Panel on Climate Change, 1st ed.; Core Writing Team, Lee, H., Romero, J., Eds.; Intergovernmental Panel on Climate Change (IPCC): Geneva, Switzerland, 2023. [Google Scholar]
  4. Leal Filho, W.; Matandirotya, N.R.; Lütz, J.M.; Alemu, E.A.; Brearley, F.Q.; Baidoo, A.A.; Kateka, A.; Ogendi, G.M.; Adane, G.B.; Emiru, N.; et al. Impacts of Climate Change to African Indigenous Communities and Examples of Adaptation Responses. Nat. Commun. 2021, 12, 6224. [Google Scholar] [CrossRef] [PubMed]
  5. Feliciano, D.; Recha, J.; Ambaw, G.; MacSween, K.; Solomon, D.; Wollenberg, E. Assessment of Agricultural Emissions, Climate Change Mitigation and Adaptation Practices in Ethiopia. Clim. Policy 2022, 22, 427–444. [Google Scholar] [CrossRef]
  6. de Carvalho, A.M.; de Jesus, D.R.; de Sousa, T.R.; Ramos, M.L.G.; de Figueiredo, C.C.; de Oliveira, A.D.; Marchão, R.L.; Ribeiro, F.P.; Dantas, R.d.A.; Borges, L.d.A.B. Soil Carbon Stocks and Greenhouse Gas Mitigation of Agriculture in the Brazilian Cerrado—A Review. Plants 2023, 12, 2449. [Google Scholar] [CrossRef] [PubMed]
  7. Amiraslani, F.; Dragovich, D.; Henry, B.; Rumpel, C. The ‘Net Zero’ Carbon Needs ‘Billions of Zeros’ Capital. But What about Cheaper Solutions? Urban Gov. 2022, 2, 282–284. [Google Scholar] [CrossRef]
  8. Alam, S.A.; Kivinen, S.; Kujala, H.; Tanhuanpää, T.; Forsius, M. Integrating Carbon Sequestration and Biodiversity Impacts in Forested Ecosystems: Concepts, Cases, and Policies. Ambio 2023, 52, 1687–1696. [Google Scholar] [CrossRef] [PubMed]
  9. Hari, M.; Tyagi, B. Terrestrial Carbon Cycle: Tipping Edge of Climate Change between the Atmosphere and Biosphere Ecosystems. Environ. Sci. Atmos. 2022, 2, 867–890. [Google Scholar] [CrossRef]
  10. Dixon, R.K.; Solomon, A.M.; Brown, S.; Houghton, R.A.; Trexier, M.C.; Wisniewski, J. Carbon Pools and Flux of Global Forest Ecosystems. Science 1994, 263, 185–190. [Google Scholar] [CrossRef]
  11. Herrero, C.; Juez, L.; Tejedor, C.; Pando, V.; Bravo, F. Importance of Root System in Total Biomass for Eucalyptus Globulus in Northern Spain. Biomass Bioenergy 2014, 67, 212–222. [Google Scholar] [CrossRef]
  12. Ribeiro, F.P.; Gatto, A.; de Oliveira, A.D.; Pulrolnik, K.; Valadão, M.B.X.; Araújo, J.B.C.N.; de Carvalho, A.M.; Ferreira, E.A.B. Carbon Storage in Different Compartments in Eucalyptus Stands and Native Cerrado Vegetation. Plants 2023, 12, 2751. [Google Scholar] [CrossRef] [PubMed]
  13. Wanlong, S.; Yowhan, S.; Baishuo, H.; Xuehua, L. An Individual Tree-Based Model for Estimating Regional and Temporal Carbon Storage of Abies Chensiensis Forest Ecosystem in the Qinling Mountains, China. Ecol. Model. 2023, 479, 110305. [Google Scholar] [CrossRef]
  14. Zhang, Y.; Wang, X. Geographical Spatial Distribution and Productivity Dynamic Change of Eucalyptus Plantations in China. Sci. Rep. 2021, 11, 19764. [Google Scholar] [CrossRef] [PubMed]
  15. Viera, M.; Rodríguez-Soalleiro, R. A Complete Assessment of Carbon Stocks in Above and Belowground Biomass Components of a Hybrid Eucalyptus Plantation in Southern Brazil. Forests 2019, 10, 536. [Google Scholar] [CrossRef]
  16. Du, H.; Zeng, F.; Peng, W.; Wang, K.; Zhang, H.; Liu, L.; Song, T. Carbon Storage in a Eucalyptus Plantation Chronosequence in Southern China. Forests 2015, 6, 1763–1778. [Google Scholar] [CrossRef]
  17. Pavan, B.E.; Amaral, R.G.; Pupin, S.; da Costa, R.M.L.; Dias, D.d.C.; Scarpinati, E.A.; de Paula, R.C. Competitive Ability among Eucalyptus Spp. Commercial Clones in Mato Grosso Do Sul State. For. Ecol. Manag. 2021, 494, 119297. [Google Scholar] [CrossRef]
  18. Teixeira, V.; Carneiro, A.; Leite, H.; Trugilho, P.; Carvalho, A.; Castro, R. Selection of Eucalyptus Genotypes for Charcoal Production Based on Using Multivariate Analysis. J. Anal. Appl. Pyrolysis 2024, 179, 106444. [Google Scholar] [CrossRef]
  19. Rodrigues, G.; Ross, J.; Teixeira, G.; Santiago, O.R.; Franco, C. Eucalipto No Brasil—Expansão Geográfica e Impactos Ambientais; Composer: Uberlândia, Brazil, 2021. [Google Scholar]
  20. Campoe, O.C.; Alvares, C.A.; Carneiro, R.L.; Binkley, D.; Ryan, M.G.; Hubbard, R.M.; Stahl, J.; Moreira, G.; Moraes, L.F.; Stape, J.L. Influência Do Clima e Genótipos No Fluxo e Partição de Carbono Em Plantios de Eucalipto. For. Ecol. Manag. 2020, 475, 118445. [Google Scholar] [CrossRef]
  21. de Mattos, E.M.; Binkley, D.; Campoe, O.C.; Alvares, C.A.; Stape, J.L. Variation in Canopy Structure, Leaf Area, Light Interception and Light Use Efficiency among Eucalyptus Clones. For. Ecol. Manag. 2020, 463, 118038. [Google Scholar] [CrossRef]
  22. da Silva, P.H.M.; Lee, D.J.; Amancio, M.R.; Araujo, M.J. Initiation of Breeding Programs for Three Species of Corymbia: Introduction and Provenances Study. Crop Breed. Appl. Biotechnol. 2022, 22, e40012211. [Google Scholar] [CrossRef]
  23. Rocha, S.M.G.; Vidaurre, G.B.; Pezzopane, J.E.M.; Almeida, M.N.F.; Carneiro, R.L.; Campoe, O.C.; Scolforo, H.F.; Alvares, C.A.; Neves, J.C.L.; Xavier, A.C.; et al. Influence of Climatic Variations on Production, Biomass and Density of Wood in Eucalyptus Clones of Different Species. For. Ecol. Manag. 2020, 473, 118290. [Google Scholar] [CrossRef]
  24. IBÁ—Indústria Brasileira de Árvores. Relatório Annual. Available online: http://www.iba.org/ (accessed on 28 May 2024).
  25. Dey, T.; Islam, M.; Jubair, S.M. Biomass and Carbon Accumulation in Northern Bangladesh Eucalyptus Plantations: Effects of Stand Structure and Age. Asian J. For. 2022, 6, 126–132. [Google Scholar] [CrossRef]
  26. Bispo, G.B.S.; Santos, R.F.; Pompeo, M.L.M.; Ferraz, S.F.B.; Rodrigues, C.B.; Brentan, B.M. The Effects of Natural Forest and Eucalyptus Plantations on Seven Water-Related Ecosystem Services in Cerrado Landscapes. Perspect. Ecol. Conserv. 2023, 21, 41–51. [Google Scholar] [CrossRef]
  27. Teodoro, P.E.; Rossi, F.S.; Teodoro, L.P.R.; Santana, D.C.; Ratke, R.F.; de Oliveira, I.C.; Silva, J.L.D.; de Oliveira, J.L.G.; da Silva, N.P.; Baio, F.H.R.; et al. Soil CO2 Emissions under Different Land-Use Managements in Mato Grosso Do Sul, Brazil. J. Clean. Prod. 2024, 434, 139983. [Google Scholar] [CrossRef]
  28. Rodríguez-Soalleiro, R.; Eimil-Fraga, C.; Gómez-García, E.; García-Villabrille, J.D.; Rojo-Alboreca, A.; Muñoz, F.; Oliveira, N.; Sixto, H.; Pérez-Cruzado, C. Exploring the Factors Affecting Carbon and Nutrient Concentrations in Tree Biomass Components in Natural Forests, Forest Plantations and Short Rotation Forestry. For. Ecosyst. 2018, 5, 35. [Google Scholar] [CrossRef]
  29. Tonini, H.; Magalhães, C.A.d.S.; Faria Neto, A.L. de Technical Thinning Age of Eucalyptus Trees Grown in Crop-Forest Integration Systems. Pesq. Agropec. Bras. 2019, 54, e00648. [Google Scholar] [CrossRef]
  30. Silva, S.; de Oliveira Neto, S.N.; Leite, H.G.; de Alcântara, A.E.M.; de Oliveira Neto, R.R.; de Souza, G.S.A. Productivity Estimate Using Regression and Artificial Neural Networks in Small Familiar Areas with Agrosilvopastoral Systems. Agroforest. Syst. 2020, 94, 2081–2097. [Google Scholar] [CrossRef]
  31. Carrijo, J.V.N.; Ferreira, A.B.d.F.; Ferreira, M.C.; de Aguiar, M.C.; Miguel, E.P.; Matricardi, E.A.T.; Rezende, A.V. The Growth and Production Modeling of Individual Trees of Eucalyptus Urophylla Plantations. J. For. Res. 2020, 31, 1663–1672. [Google Scholar] [CrossRef]
  32. Tavares Júnior, I.d.S.; Torres, C.M.M.E.; Leite, H.G.; de Castro, N.L.M.; Soares, C.P.B.; Castro, R.V.O.; Farias, A.A. Machine Learning: Modeling Increment in Diameter of Individual Trees on Atlantic Forest Fragments. Ecol. Indic. 2020, 117, 106685. [Google Scholar] [CrossRef]
  33. Huang, H.; Liu, C.; Wang, X.; Zhou, X.; Gong, P. Integration of Multi-Resource Remotely Sensed Data and Allometric Models for Forest Aboveground Biomass Estimation in China. Remote Sens. Environ. 2019, 221, 225–234. [Google Scholar] [CrossRef]
  34. Ogana, F.N.; Corral-Rivas, S.; Gorgoso-Varela, J.J. Nonlinear Mixed-Effect Height-Diameter Model For Pinus Pinaster Ait. And Pinus Radiata D. Don. Cerne 2020, 26, 150–161. [Google Scholar] [CrossRef]
  35. Zhang, Y.; Lu, D.; Jiang, X.; Li, Y.; Li, D. Forest Structure Simulation of Eucalyptus Plantation Using Remote-Sensing-Based Forest Age Data and 3-PG Model. Remote Sens. 2023, 15, 183. [Google Scholar] [CrossRef]
  36. Stolle, L.; Corte, A.P.D.; Sanquetta, C.R.; Behling, A.; Hentz, Â.M.K.; Eisfeld, R.d.L. Predicting Stand Volume by Number of Trees Automatically Detected in UAV Images: An Alternative Method for Forest Inventory. Forests 2021, 12, 1508. [Google Scholar] [CrossRef]
  37. Valadão, M.B.X.; Carneiro, K.M.S.; Ribeiro, F.P.; Inkotte, J.; Rodrigues, M.I.; Mendes, T.R.S.; Vieira, D.A.; Matias, R.A.M.; Lima, M.B.O.; Miguel, E.P.; et al. Modeling Biomass and Nutrients in a Eucalyptus Stand in the Cerrado. Forests 2020, 11, 1097. [Google Scholar] [CrossRef]
  38. Gatto, A.; Bussinguer, A.P.; Ribeiro, F.C.; de Azevedo, G.B.; Bueno, M.C.; Monteiro, M.M.; de Souza, P.F. Ciclagem e balanço de nutrientes no sistema solo-planta em um plantio de Eucalyptus sp., no Distrito Federal. Rev. Bras. Ciênc. Solo 2014, 38, 879–887. [Google Scholar] [CrossRef]
  39. Péllico, S.; Behling, A. Rational Volumetric Models: Tested In Forest Stands Of Acacia Mearnsii De Wild In Southern Brazil. Cerne 2020, 25, 491–505. [Google Scholar] [CrossRef]
  40. Attia, A.; Nouvellon, Y.; Cuadra, S.; Cabral, O.; Laclau, J.-P.; Guillemot, J.; Campoe, O.; Stape, J.-L.; Galdos, M.; Lamparelli, R.; et al. Modelagem Do Balanço Hídrico e de Carbono de Plantios de Eucalipto Em Escala Regional: Efeito Do Clima, Solo e Genótipos. For. Ecol. Manag. 2019, 449, 117460. [Google Scholar] [CrossRef]
  41. Salekin, S.; Mason, E.G.; Morgenroth, J.; Bloomberg, M.; Meason, D.F. Hybrid Height Growth and Survival Model for Juvenile Eucalyptus Globoidea (Blakely) and E. Bosistoana (F. Muell) in New Zealand. For. Ecol. Manag. 2021, 490, 119074. [Google Scholar] [CrossRef]
  42. Xu, N.; Cai, D.; Zhao, X. Constructing a Eucalyptus Identification Model Based on NDVI Time-Series Remote Sensing Images. Catena 2024, 238, 107846. [Google Scholar] [CrossRef]
  43. Santos, J.S.; de Mendonça, A.R.; Gonçalves, F.G.; da Silva, G.F.; de Almeida, A.Q.; Carvalho, S.d.P.C.; Silva, J.P.M.; Carvalho, R.C.; da Silva, E.F.; Aguiar, M.O. Predicting Eucalyptus Plantation Growth and Yield Using Landsat Imagery in Minas Gerais, Brazil. Ecol. Inform. 2023, 75, 102120. [Google Scholar] [CrossRef]
  44. Schumacher, F.X.; Hall, F.S. Logarithmic Expression of Timber-Tree Volume. J. Agric. Res. 1933, 47, 719–734. [Google Scholar]
  45. Spurr, S.H. Forest Inventory; Ronald Press Company: New York, NY, USA, 1952. [Google Scholar]
  46. Parresol, B.R. Assessing Tree and Stand Biomass: A Review with Examples and Critical Comparisons. For. Sci. 1999, 45, 573–593. [Google Scholar] [CrossRef]
  47. Akaike, H. On the Likelihood of a Time Series Model. J. R. Stat. Soc. Ser. D 1978, 27, 217–235. [Google Scholar] [CrossRef]
  48. Bergmeir, C.; Hyndman, R.J.; Koo, B. A Note on the Validity of Cross-Validation for Evaluating Autoregressive Time Series Prediction. Comput. Stat. Data Anal. 2018, 120, 70–83. [Google Scholar] [CrossRef]
  49. R: A Language and Environment for Statistical Computing—ScienceOpen. Available online: https://www.scienceopen.com/book?vid=b164ea90-95d2-43bf-9710-99753c479112 (accessed on 19 June 2024).
  50. Alvares, C.A.; Stape, J.L.; Sentelhas, P.C. Köppen’s Climate Classification Map for Brazil. Meteorol. Z 2013, 22, 711–728. [Google Scholar] [CrossRef]
  51. Schaefer, C.E.R. Brazilian Latosols and Their B Horizon Microstructure as Long-Term Biotic Constructs. Soil Res. 2001, 39, 909–926. [Google Scholar] [CrossRef]
  52. Oliveira, D.M.S.; Santos, R.S.; Chizzotti, F.H.M.; Bretas, I.L.; Franco, A.L.C.; Lima, R.P.; Freitas, D.A.F.; Cherubin, M.R.; Cerri, C.E.P. Crop, Livestock, and Forestry Integration to Reconcile Soil Health, Food Production, and Climate Change Mitigation in the Brazilian Cerrado: A Review. Geoderma Reg. 2024, 37, e00796. [Google Scholar] [CrossRef]
  53. Lima, L.; Miranda, I.; Knapic, S.; Quilhó, T.; Pereira, H. Chemical and Anatomical Characterization, and Antioxidant Properties of Barks from 11 Eucalyptus Species. Eur. J. Wood Prod. 2018, 76, 783–792. [Google Scholar] [CrossRef]
  54. Balboni, B.M.; Batista, A.S.; Garcia, J.N. Evaluating the Potential for Timber Production of Young Forests of Eucalyptus Spp. Clones Used for Bioenergy: Wood Density and Mechanical Properties. Aust. For. 2021, 84, 122–132. [Google Scholar] [CrossRef]
  55. Kumar, T.; Bhardwaj, K.K.; Kaushik, P. Effect of Soil Properties and Nutrient Status on Eucalyptus Tereticornis Based Agroforestry System in India. agriRxiv 2020, agriRxiv:20203280761. [Google Scholar] [CrossRef]
  56. Laclau, J.-P.; Silva, E.A.; Rodrigues Lambais, G.; Bernoux, M.; le Maire, G.; Stape, J.L.; Bouillet, J.-P.; Leonardo, M. Gonçalves, J.; Jourdan, C.; Nouvellon, Y. Dynamics of Soil Exploration by Fine Roots down to a Depth of 10 m throughout the Entire Rotation in Eucalyptus Grandis Plantations. Front. Plant Sci. 2013, 4, 243. [Google Scholar] [CrossRef]
  57. Zhou, X.; Wen, Y.; Goodale, U.M.; Zuo, H.; Zhu, H.; Li, X.; You, Y.; Yan, L.; Su, Y.; Huang, X. Optimal Rotation Length for Carbon Sequestration in Eucalyptus Plantations in Subtropical China. New For. 2017, 48, 609–627. [Google Scholar] [CrossRef]
  58. Morales, M.M.; Tonini, H.; Behling, M.; Hoshide, A.K. Eucalyptus Carbon Stock Research in an Integrated Livestock-Forestry System in Brazil. Sustainability 2023, 15, 7750. [Google Scholar] [CrossRef]
  59. Gatto, A.; de Barros, N.F.; de Novais, R.F.; da Silva, I.R.; Leite, H.G.; Villani, E.M.d.L. Estoque de carbono na biomassa de plantações de eucalipto na região centro-leste do estado de Minas Gerais. Rev. Árvore 2011, 35, 895–905. [Google Scholar] [CrossRef]
  60. Babu, K.N.; Mandyam, S.; Jetty, S.; Dar, A.A.; Ayushi, K.; Narayanan, A.; Somaiah, S.; Narayanaswamy, P. Carbon Stocks of Tree Plantations in a Western Ghats Landscape, India: Influencing Factors and Management Implications. Environ. Monit Assess. 2023, 195, 404. [Google Scholar] [CrossRef]
  61. Pires Coelho, A.J.; Ribeiro Matos, F.A.; Villa, P.M.; Heringer, G.; Pontara, V.; de Paula Almado, R.; Alves Meira-Neto, J.A. Multiple Drivers Influence Tree Species Diversity and Above-Ground Carbon Stock in Second-Growth Atlantic Forests: Implications for Passive Restoration. J. Environ. Manag. 2022, 318, 115588. [Google Scholar] [CrossRef]
  62. da Silva, M.L.M.; Binoti, D.H.B.; Gleriani, J.M.; Leite, H.G. Ajuste do modelo de Schumacher e Hall e aplicação de redes neurais artificiais para estimar volume de árvores de eucalipto. Rev. Árvore 2009, 33, 1133–1139. [Google Scholar] [CrossRef]
  63. Hakamada, R.; Binkley, D.; Cegatta, I.; Alvares, C.; Campoe, O.; Stape, J.L. Stocking Response of Eucalyptus Growth Depends on Site Water Deficit across a 2100-Km Gradient in Brazil. For. Ecol. Manag. 2023, 546, 121325. [Google Scholar] [CrossRef]
  64. Romero, F.M.B.; Jacovine, L.A.G.; Torres, C.M.M.E.; Ribeiro, S.C.; da Rocha, S.J.S.S.; Novais, T.d.O.; Gaspar, R.d.O.; da Silva, L.F.; Vidal, E.; Leite, H.G.; et al. Aboveground Biomass Allometric Models for Large Trees in Southwestern Amazonia. Trees For. People 2022, 9, 100317. [Google Scholar] [CrossRef]
  65. Schettini, B.L.S.; Oliveira Neto, S.N.D.; Jacovine, L.A.G.; Torres, C.M.M.E.; Villanova, P.H.; Rocha, S.J.S.S.D. Viabilidade econômica de um sistema silvipastoril na zona da mata de Minas Gerais. Sci. For. 2021, 49, e3463. [Google Scholar] [CrossRef]
Figure 1. Location of the experimental areas in the Federal District, Brazil.
Forests 15 01332 g001
Figure 2. Estimates of total C and compartment (Mg ha−1) in Eucalyptus stands (Eucalyptus urophylla × Eucalyptus grandis) in the Federal District, Brazil.
Forests 15 01332 g002
Figure 3. Percentage residuals (ac), observed to estimated C ratio (df), and residual classes (gi) for models 1, 2, and 3 used for individual trees in Eucalyptus stands (Eucalyptus urophylla × Eucalyptus grandis) in the Federal District, Brazil.
Forests 15 01332 g003
Table 1. Description of the experimental areas in the Federal District, Brazil.
Experimental AreaDescription
Area 1 (A1): Eucalyptus urophylla × Eucalyptus grandis12 ha planted in December 2011. Previous native Cerrado vegetation. The 48-month-old EAC1528 clone was planted at a spacing of 3.5 × 1.7 m. Before planting, the soil was tilled with a disk harrow in 15 cm strips and subsoiled in the planting line to a depth of 90 cm.
Area 2 (A2): Eucalyptus urophylla × Eucalyptus grandis1.2 ha planted in November 2009. The 60-month-old Urograndis clone was planted at a spacing of 3 × 2 m. The soil was subsoiled to a depth of 70 cm and received 500 kg of simple superphosphate/ha, 280 g/plant of NPK 20-5-20, and B and Zn after 15 days and at the beginning of the rainy season.
Area 3 (A3): Eucalyptus urophylla × Eucalyptus grandis3.29 ha area planted in January 2010. The 72-month-old I224 clone was planted at a spacing of 3 × 2 m. The soil was tilled to a depth of 40 cm. Fertilizer was applied along the planting line, with 100 g of simple phosphate + 100 g of NPK (4-30-16).
Area 4 (A4): Eucalyptus urophylla × Eucalyptus grandis19 ha area planted in December 2009. The area was already used for agriculture. The 72-month-old GG100 clone was planted at a spacing of 3.5 × 1.7 m. The soil was tilled with a disk harrow in 15 cm strips and a furrow opener was used along the planting line to a depth of 90 cm.
Table 2. Linear and non-linear regression models to estimate the C levels in the shoot and root of each tree in Eucalyptus stands (Eucalyptus urophylla × Eucalyptus grandis) in the Federal District, Brazil.
ModelClassificationReferences
1C = β0 × DBH β1 × hβ2 × Ageβ3LinearSchumacher–Hall [44] *
2C = β0 × DBHβ1 × h^β2LinearSchumacher–Hall [44]
3C = β0 + β1 × DBH2 × hNon-linearSpurr [45]
C: carbon; DBH: diameter at breast height; βi: parameters to be estimated; h: total height; *: adapted.
Table 3. Mean carbon contents in the compartments of trees from Eucalyptus stands (Eucalyptus urophylla × Eucalyptus grandis) with different clones and ages.
AreasLeafBranchesWoodBarkRootsCVOverall Mean *
---------------------------------- dag kg−1 -------------------------------------
145.15 a44.86 a43.77 a45.46 a45.46 a4.5144.84 B
243.01 a43.84 a42.92 a42.81 a42.81 a6.1343.10 B
356.25 c56.94 b57.93 a56.10 c56.10 c0.4155.40 A
442.50 a44.19 a43.22 a41.60 a41.60 a7.5642.80 B
1: EAC1528, 48 months; 2: Urograndis, 60 months; 3: I224, 72 months; 4: GG100, 72 months. Different lowercase letters in the row indicate different total C contents per tree between compartments, and different uppercase letters in the column indicate different total C contents per tree between areas (Tukey, p < 0.05). * Overall CV: 4.76.
Table 4. Mean C stock of the shoot and root in trees from Eucalyptus stands (Eucalyptus urophylla × Eucalyptus grandis) with different clones and ages in the Federal District, Brazil.
AreasShootRootTotal
--------------------- kg ----------------------
137.61 c4.14 b41.75 c
227.22 d2.78 c30.01 d
376.13 a6.45 a82.58 a
447.09 b4.24 b51.34 b
CV (%)9.308.739.24
1: EAC1528, 48 months; 2: Urograndis, 60 months; 3: I224, 72 months; 4: GG100, 72 months. Different lowercase letters in the column indicate the difference between areas (Tukey, p < 0.05).
Table 5. Statistical parameters to fit the models used to estimate individual C stock in trees from Eucalyptus stands (Eucalyptus urophylla × Eucalyptus grandis) in the Federal District, Brazil.
Modelβ0β1β2β3rRMSE (%)AIC
10.001132.147181.152360.837630.999.65258
20.001742.195391.43419 0.9812.86279
30.002881.16254 0.9812.83278
r: correlation coefficient; RMSE: root mean square error; RMSE%: root mean square error percentage; AIC: Akaike information criterion.
Table 6. Validation statistics for the model selected for estimating the C stock in eucalyptus stands in the Federal District, Brazil.
ModelValidationrRMSE
(%)
AIC
1A, B, C, D0.99210.01258,460
1A, B, C, E0.9969.42264,580
1A, B, D, E0.99411.07267,830
1A, C, D, E0.98512.02262,400
1B, C, D, E0.98012.26259,430
Mean0.98910.96262,540
Disclaimer/Publisher’s Note: The statements, opinions and data contained in all publications are solely those of the individual author(s) and contributor(s) and not of MDPI and/or the editor(s). MDPI and/or the editor(s) disclaim responsibility for any injury to people or property resulting from any ideas, methods, instructions or products referred to in the content.

