Article

Land Use Evolution and Its Driving Factors over the Past 30 Years in Luochuan County

1
College of Humanities and Social Sciences, Xi’an Jiaotong University, Xi’an 710049, China
2
Urat Desert-Grassland Research Station, Northwest Institute of Eco-Environment and Resources, Chinese Academy of Sciences, Lanzhou 730000, China
3
State Key Laboratory of Loess and Quaternary Geology, Institute of Earth Environment, Chinese Academy of Sciences, Xi’an 710061, China
*
Author to whom correspondence should be addressed.
Forests 2024, 15(8), 1346; https://doi.org/10.3390/f15081346
Submission received: 21 June 2024 / Revised: 21 July 2024 / Accepted: 1 August 2024 / Published: 2 August 2024
(This article belongs to the Special Issue Sustainable Management of Forest Stands)

Abstract

:
Understanding the evolution of land use change and its drivers is vital in keeping the fragile balance between human activities and nature. The present study employs remote sensing data from between 1990 and 2020 during the Grain-for-Green Project (GGP) in Luochuan county, Shaanxi Province, which offers 30 years of continuous data on precipitation, temperature, population, and GDP. Here, the combined method of supervised classification with manual visual interpretation was adopted for building a high-precision spatial distribution information database, in order to explore the links existing between the change features of land use, distribution, and spatial pattern, and the interference of local socio-economic development and natural factors before and after the GGP. According to the results, during the past three decades, Luochuan county has undergone large changes in land use types, displaying distinct features and regional disparities. Geographically, the north of Luochuan county is predominantly forest and grassland, while farmland is mostly in the south of Luochuan county. In 1990, farmland dominated this county; however, after 2000, forest and grassland areas expanded. Notably, the implementation of the GGP significantly influenced changes in grassland and forest areas. With the development of modernization, Luochuan county’s land use structure has gradually equilibrated, with increased uniformity in the distribution of various land use types. Obviously, the shift in land use from 1990 to 2020 primarily correlates with mean annual temperature, annual precipitation, total population, and GDP. Furthermore, regression analysis revealed that during the initial decade of the GGP, natural factors primarily drove land use changes. However, after the GGP, the conversion rate from farmland to forest and shrubland/grassland escalated, and population growth was the continual external force driving the expansion of forest and grassland. Despite substantial economic benefits from land development and utilization in Luochuan county during the past 30 years, certain human economic activities have posed significant pressure on regional agricultural development and sustainable land resource use. Overall, this study helps our government to enhance national land management and planning through a targeted method, also providing a reference for analyzing land use change processes within same areas.

1. Introduction

Land is the foundation for human development and survival, and land use change is the result of human activity in our Earth environment. In addition, it reflects the links between ecological processes and human activities [1,2]. With the emergence of problems such as global change and ecological environment imbalance, understanding land use change, as well as its driving factors, is becoming a key direction for addressing climate change [3]. Due to complex human–environment connections, land use and its alterations are mainly identified as being stimulated by both human and natural factors [4,5]. An increasing number of studies, conducted locally or internationally, are concentrating on land use, it being key for global environmental change research [6,7]. Currently, land use research has constructed a comparatively perfect research system and method model, and the research results are mostly focused on the land use change process, driving mechanisms, land use environmental benefits, and land system change trend prediction, etc. [3,8]. Therefore, exploring the evolution of land use and its drivers has become vital for keeping the fragile balance between humans and nature.
Human activities profoundly alter the natural geographical environment, with land use being a primary form of this influence, directly leading to alterations of the land surface [8,9,10]. In the 1970s, as global climate change research deepened, recognition grew that human-induced land use changes are major drivers of ecological and climatic shifts, significantly impacting the sustainable progress of human society [6,7]. Numerous studies have suggested that alterations in land use affect various aspects of the global system, including regional climate, atmospheric composition, biogeochemical cycles, and biodiversity [7,8,9]. Since the 1990s, the focus of global climate and environmental change research has increasingly turned to land use change, which has attracted significant attention in academia [11,12,13]. A multitude of studies have delved into the processes, driving forces, environmental impacts, and interactions associated with land use change. Nevertheless, most previous quantitative analyses employed techniques including principal component analysis and analytic hierarchy process. These above-mentioned methods have many limitations, which do not quantitatively confirm the impacts of these driving factors of land use change [14,15]. Thus, comparative studies at the regional level are necessary to comprehend the mechanisms of land use change.
Since 1999, the rapid economic development in China, along with rapid industrialization and urbanization processes, have triggered notable shifts in land use, particularly in the Loess Plateau, where initiatives including natural forest conservation and Grain-for-Green Projects (GGP) have been implemented [16,17,18]. These endeavors are expected to have profound effects on vegetation patterns, water resource security, and sustainable development [19,20]. Investigating the driving mechanisms behind land use change is a fundamental prerequisite for conducting research on this topic, and giving significant emphasis to analyzing the role of the driving forces in land use change is crucial [21,22,23]. Luochuan county, situated in Yan’an City, lies within the gully region of the northern part of the Loess Plateau. It boasts the largest area with the thickest soil layer on the Loess Plateau and stands as one of the world’s most well-preserved ancient loess landforms [24,25]. It is highly responsive to both climate fluctuations and human interventions. Initiatives such as natural forest conservation and the GGP have been underway since 1999. As of the end of 2020, Yan’an City had afforested 718,300 hectares, constituting 19.4% of its total land area, 2.5% of the national afforestation plan, and 27.0% of the provincial afforestation plan [15]. Early research by Chinese scholars focused on land use, vegetation cover changes, and ecological benefits, and their impacts on humidity, land surface temperature, runoff, and vegetation’s response to climate, utilizing remote sensing or low-resolution data [26,27]. The comprehensive afforestation project in Luochuan county began in 1999, with the growth of forests and grasslands requiring considerable time. Hence, this study uses remote sensing imagery from Luochuan county in 1990, 2000, 2010, and 2020, alongside climate data like precipitation and temperature, as well as socio-economic indicators like urbanization and GDP. We comprehensively examine land use changes and their driving factors within Luochuan county, aiming to offer insights for regional ecological construction and to enhance human well-being in rural areas.

2. Materials and Methods

2.1. Study Area

Luochuan county, situated in the southern region of Yan’an City, Shaanxi Province, boasts a strategic geographical location. Administering 6 towns, 13 townships, and 365 administrative villages, it spans an area of 1804.8 square kilometers. The county features a total arable land area of 34,666.67 hectares and a population of 190,000, with 160,000 individuals engaged in agriculture, rendering it a quintessential agricultural county. Positioned within the gully region in the north of the Loess Plateau, it experiences a warm temperate semi-humid continental monsoon climate. Consequently, this study selected remote sensing data depicting land use types from Luochuan county for the years 1990, 2000, 2010, and 2020, alongside continuous data encompassing precipitation, temperature, population, and GDP spanning 30 years. Employing remote sensing and GIS technologies, mathematical statistics, transfer matrix methods, and other analytical approaches, this study scrutinized alterations in the spatial distribution of pre- and post-afforestation in Luochuan county, considering its response to climatic variations. Furthermore, it delved into the driving forces underlying land use changes during distinct periods within the research area.

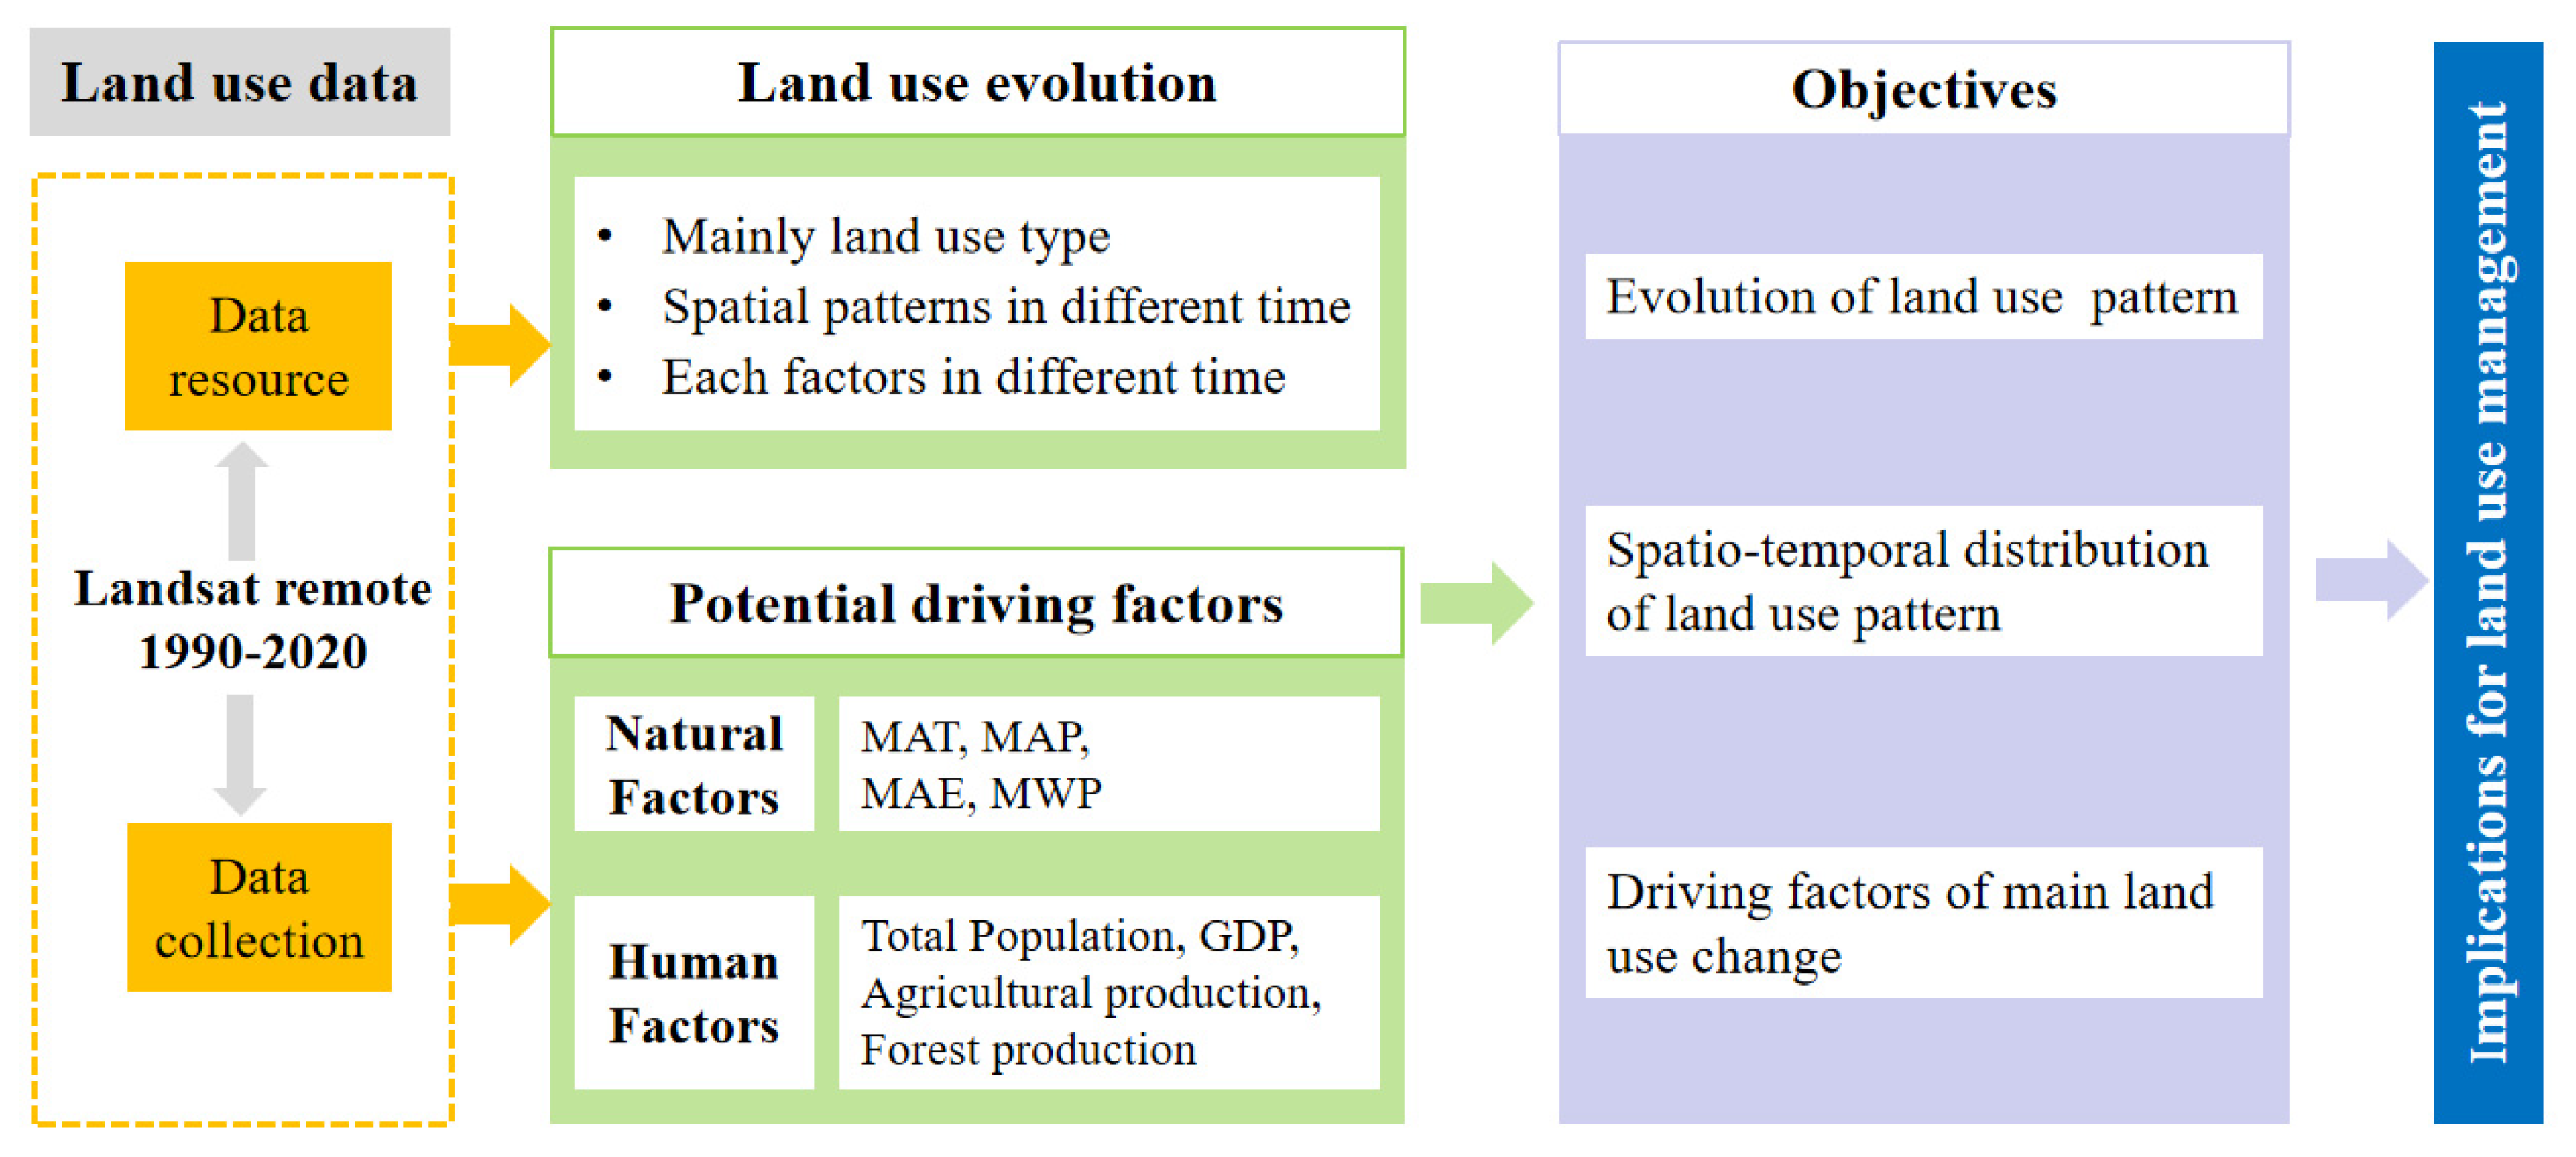
2.2. Data Analysis Process

We made a flowchart in this study, and practically, the flowchart can be classified into three sections (Figure 1). The first section is aimed at gathering datasets for analysis in the present study. The composition structure, evolution trend features of the land use pattern, and the primary land use change categories were investigated in Luochuan county. Finally, the driving factors behind the formation and evolution of the land use patterns were explored.

2.3. Data Source

(1)
Acquisition of Remote Sensing Images
Remote sensing imagery of Luochuan county for the years 1990, 2000, 2010, and 2020 was accessed from the National Earth System Science Data Sharing Service Platform (http://loess.geodata.cn, Loess Plateau Scientific Data Center, accessed on 25 June 2024). All remote sensing images were chosen according to the following processes [28,29]: (1) all surface reflectance data were chosen from the vegetation growth season (September) of each study year. (2) Data which had less than 30% cloud cover were chosen in Landsat images. The cloud-covered images were replaced and added with images prior to and after the study with the purpose of creating the most usable pixel image composite. (3) The normalized difference construction index (NDBI) and normalized difference vegetation index (NDVI) were calculated for each image (Figure 2).
(2)
DEM Data
The initial step involved vectorizing topographic maps to derive contour lines, which were subsequently transformed into DEM (Digital Elevation Model) data. Elevation information was then extracted and delineated according to the boundaries of distinct watersheds, with slope calculations conducted utilizing spatial analysis modules.
(3)
Land Use Data
With the purpose of balancing the quality and efficiency of classification, a combination of computational classification and manual interpretation of satellite images was applied. The land use data for Luochuan county in 1990, 2000, 2010, and 2020 originated from the digitization of Landsat TM imagery at a 1:30,000 scale, resulting in 1:50,000 land use maps. MapGIS software (10.2 version) was utilized for digitization to ensure the establishment of spatial data topology. Subsequently, spatial and attribute data for land use in the study area for the respective years were collected and standardized into a uniform coordinate and projection system. Spatial analysis was conducted employing Mapinfo (17.2 version), Arcview (3.3 version), and ArcGIS software (10.8 version).
Leveraging GIS technology, overlay analysis was executed on Luochuan county’s land use status maps from 1990, 2000, 2010, and 2020. This analysis generated a transition matrix illustrating the shift in land use types over time. By integrating these maps and the transition matrix, the process of land use change in the area was scrutinized. This assessment considered natural, social, and economic factors pertinent to the region, and the final land use classification maps for each of the four phases were acquired in ArcGIS (Table 1).
(4)
Meteorological Data
Meteorological data, encompassing monthly average temperature, monthly precipitation, monthly sunshine duration, total solar radiation, maximum and minimum temperatures, and sunshine percentage, were sourced from the Luochuan county Meteorological Station for the years 1990, 2000, 2010, and 2020.

2.4. Land Use Transfer Matrix

The land spatial transition matrix is adopted for quantifying the relationship between spatial type conversions within a region. This matrix illuminates how human activities influence the direction and structure of land spatial development and conservation, revealing shifts in land spatial patterns over time. The calculation formula can be written as follows [15]:
a i j = a 11 a 1 n a m 1 a m n
where aij indicates the total area of land spatial type i converted to land spatial type j in the initial stage of the study; and n denotes the number of land spatial use types. In this investigation, the spatial analysis module of ArcGIS software was adopted for conducting statistical and overlay analyses on the land use data spanning the years 1990, 2000, 2010, and 2020. This process facilitated the creation of the land use type area transition matrix for Luochuan county following the implementation of the land conversion project. Through matrix analysis, the quantitative conversion relationship between different land classes and the dynamic changes in land use across each period were scrutinized.

2.5. Grey Relation Analysis

Grey relation analysis (GRA) serves as a method for conducting multi-factor statistical analysis. In essence, it aims to determine how one specific aspect within a grey system is influenced by other factors relative to it. The mathematical model of grey system relation holds significance in system analysis, measuring the degree of association between two systems or factors as they evolve over time. This analysis aids in identifying the primary influencing factors in the system’s development through the assessment of relation rankings. A higher relation indicates that the factor significantly impacts the system’s development, while a lower relation suggests a lesser influence or no effect. Relation analysis facilitates the examination of dominant and potential factors, discerning advantages from disadvantages. During the system development process, consistent trends in changes between two factors, indicating a high degree of synchronous change, characterize a high relation; otherwise, they indicate a low relation.
Relation refers to a measure of the degree of correlation. It quantitatively delineates the relative changes between factors from a numerical standpoint, taking into account their magnitude, direction, and rate of change. Initially, the data for analysis must be dimensionless. This process, commonly referred to as normalization, aims to mitigate differences in the absolute numerical values of the data and aligns them within comparable ranges. The specific procedure involves dividing the data series of the study (reference variables) by its initial values. As the magnitude variances within the same factor’s sequence are not substantial, dividing by the initial value can normalize these values and generate a series of data columns [1].
Let us denote the data of the dependent variable as a reference sequence {xi′(k)}, and the data of each independent variable as a comparison sequence {xj′(k)}, represented as follows [30]:
{xi′(k)} = {xi′(1), xi′(2), …, xi′(m)}; {xj′(k)} = {xj′(1), xj′(2), …, xj′(n)}
i = 1, 2, ……, m − 1; m; j = 1, 2, ……, n            
{xi′(k)} = {xi′(1), xi′(2), … xi′(m)}; {xj′(k)} = {xj′(1), xj′(2), … xj′(n)}
i = 1, 2, ……, m − 1, m; j = 1, 2, ……, n             
Next, the variable sequences are made dimensionless.
Typically, the original variable sequences exhibit variations in units or magnitudes. To uphold the credibility of the analysis outcomes, it is imperative to normalize the variable sequences. Each factor is transformed into a sequence {xi(k)} through the initial value method for normalization, whereby the index value of the comparison sequence is divided by the corresponding value of the reference sequence. These sequences are suggested as {xi(k)} = {xi(1), xi(2), …, xi(m)}, in which i = 1, 2, …, m − 1, m.
Following data normalization, the grey relational degree can be computed. The method for calculating the absolute relation degree is outlined as follows [31]:
ε 0 i = 1 + | s 0 | + | s i | 1 + | s 0 | + | s i | + | s 0 s i |
| s 0 | = | k = 2 n 1 x 0 0 ( k ) + 1 2 x 0 0 ( n ) |
| s i | = | k = 2 n 1 x i 0 ( k ) + 1 2 x i 0 ( n ) |
The relative relation is calculated as follows:
ε 0 i = 1 + | s 0 | + | s i | 1 + | s 0 | + | s i | + | s 0 s i |
| s 0 | = | k = 2 n 1 x 0 0 ( k ) + 1 2 x 0 0 ( n ) |
| s i | = | k = 2 n 1 x i 0 ( k ) + 1 2 x i 0 ( n ) |
The comprehensive relation degree is achieved through the combination of the relative relation degree and the absolute relation degree:
θ0i = θε0i + (1 − θ)ε0i, θ∈(0,1)
where xi′(n) represents the zero mapping of the initial value of xi(n).
By sorting the relation degrees of each comparison sequence with the reference sequence, a higher relation degree signifies a more consistent trend between the comparison sequence and the reference sequence. The relative relation degree solely indicates the relation between the starting points of x0 and xi, whereas the comprehensive relation degree encompasses not only the relation between the starting points of x0 and xi, but also the relation between the rate of change of x0 and xi. A higher numerical value denotes a stronger overall relation.

2.6. Regression Model

Regression is designed with the aim of estimating the parameters of a multivariate explanatory model in situations in which the dependent variables are binary and the independent variables are continuous or mixed variables. The methods for calculating are as follows [32,33]:
ln ( p 1 p ) = α + i = 1 n β i x i
P = exp ( α + i = 1 n β i x i ) 1 + exp ( α + i = 1 n β i x i )
where P represents the occurrence probability of the event, x refers to the independent variable, α represents the constant, and β represents the regression coefficient. In addition, the relative operating characteristic (ROC) was adopted for evaluating the goodness-of-fit of the logistic regression model. In addition, the model validation results in an ROC value which is greater than 0.8, indicating good prediction and explanatory power.

2.7. Data Analysis

Before estimating the model with the original data, this study initially adopts extreme absolute value standardization to normalize each indicator. Following this, stepwise regression analysis is employed to develop a multiple linear regression model. Subsequently, t-tests and F-tests are executed to validate the accuracy of the model parameters and regression equation, respectively. Parameter estimation of the model is conducted with SPSS 22.0 software (https://www.spss.com/, accessed on 21 May 2024). Additionally, redundancy analysis is performed on the factors influencing land use change utilizing CANOCO 5.0 software (http://www.canoco.com/, accessed on 10 May 2024).

3. Results

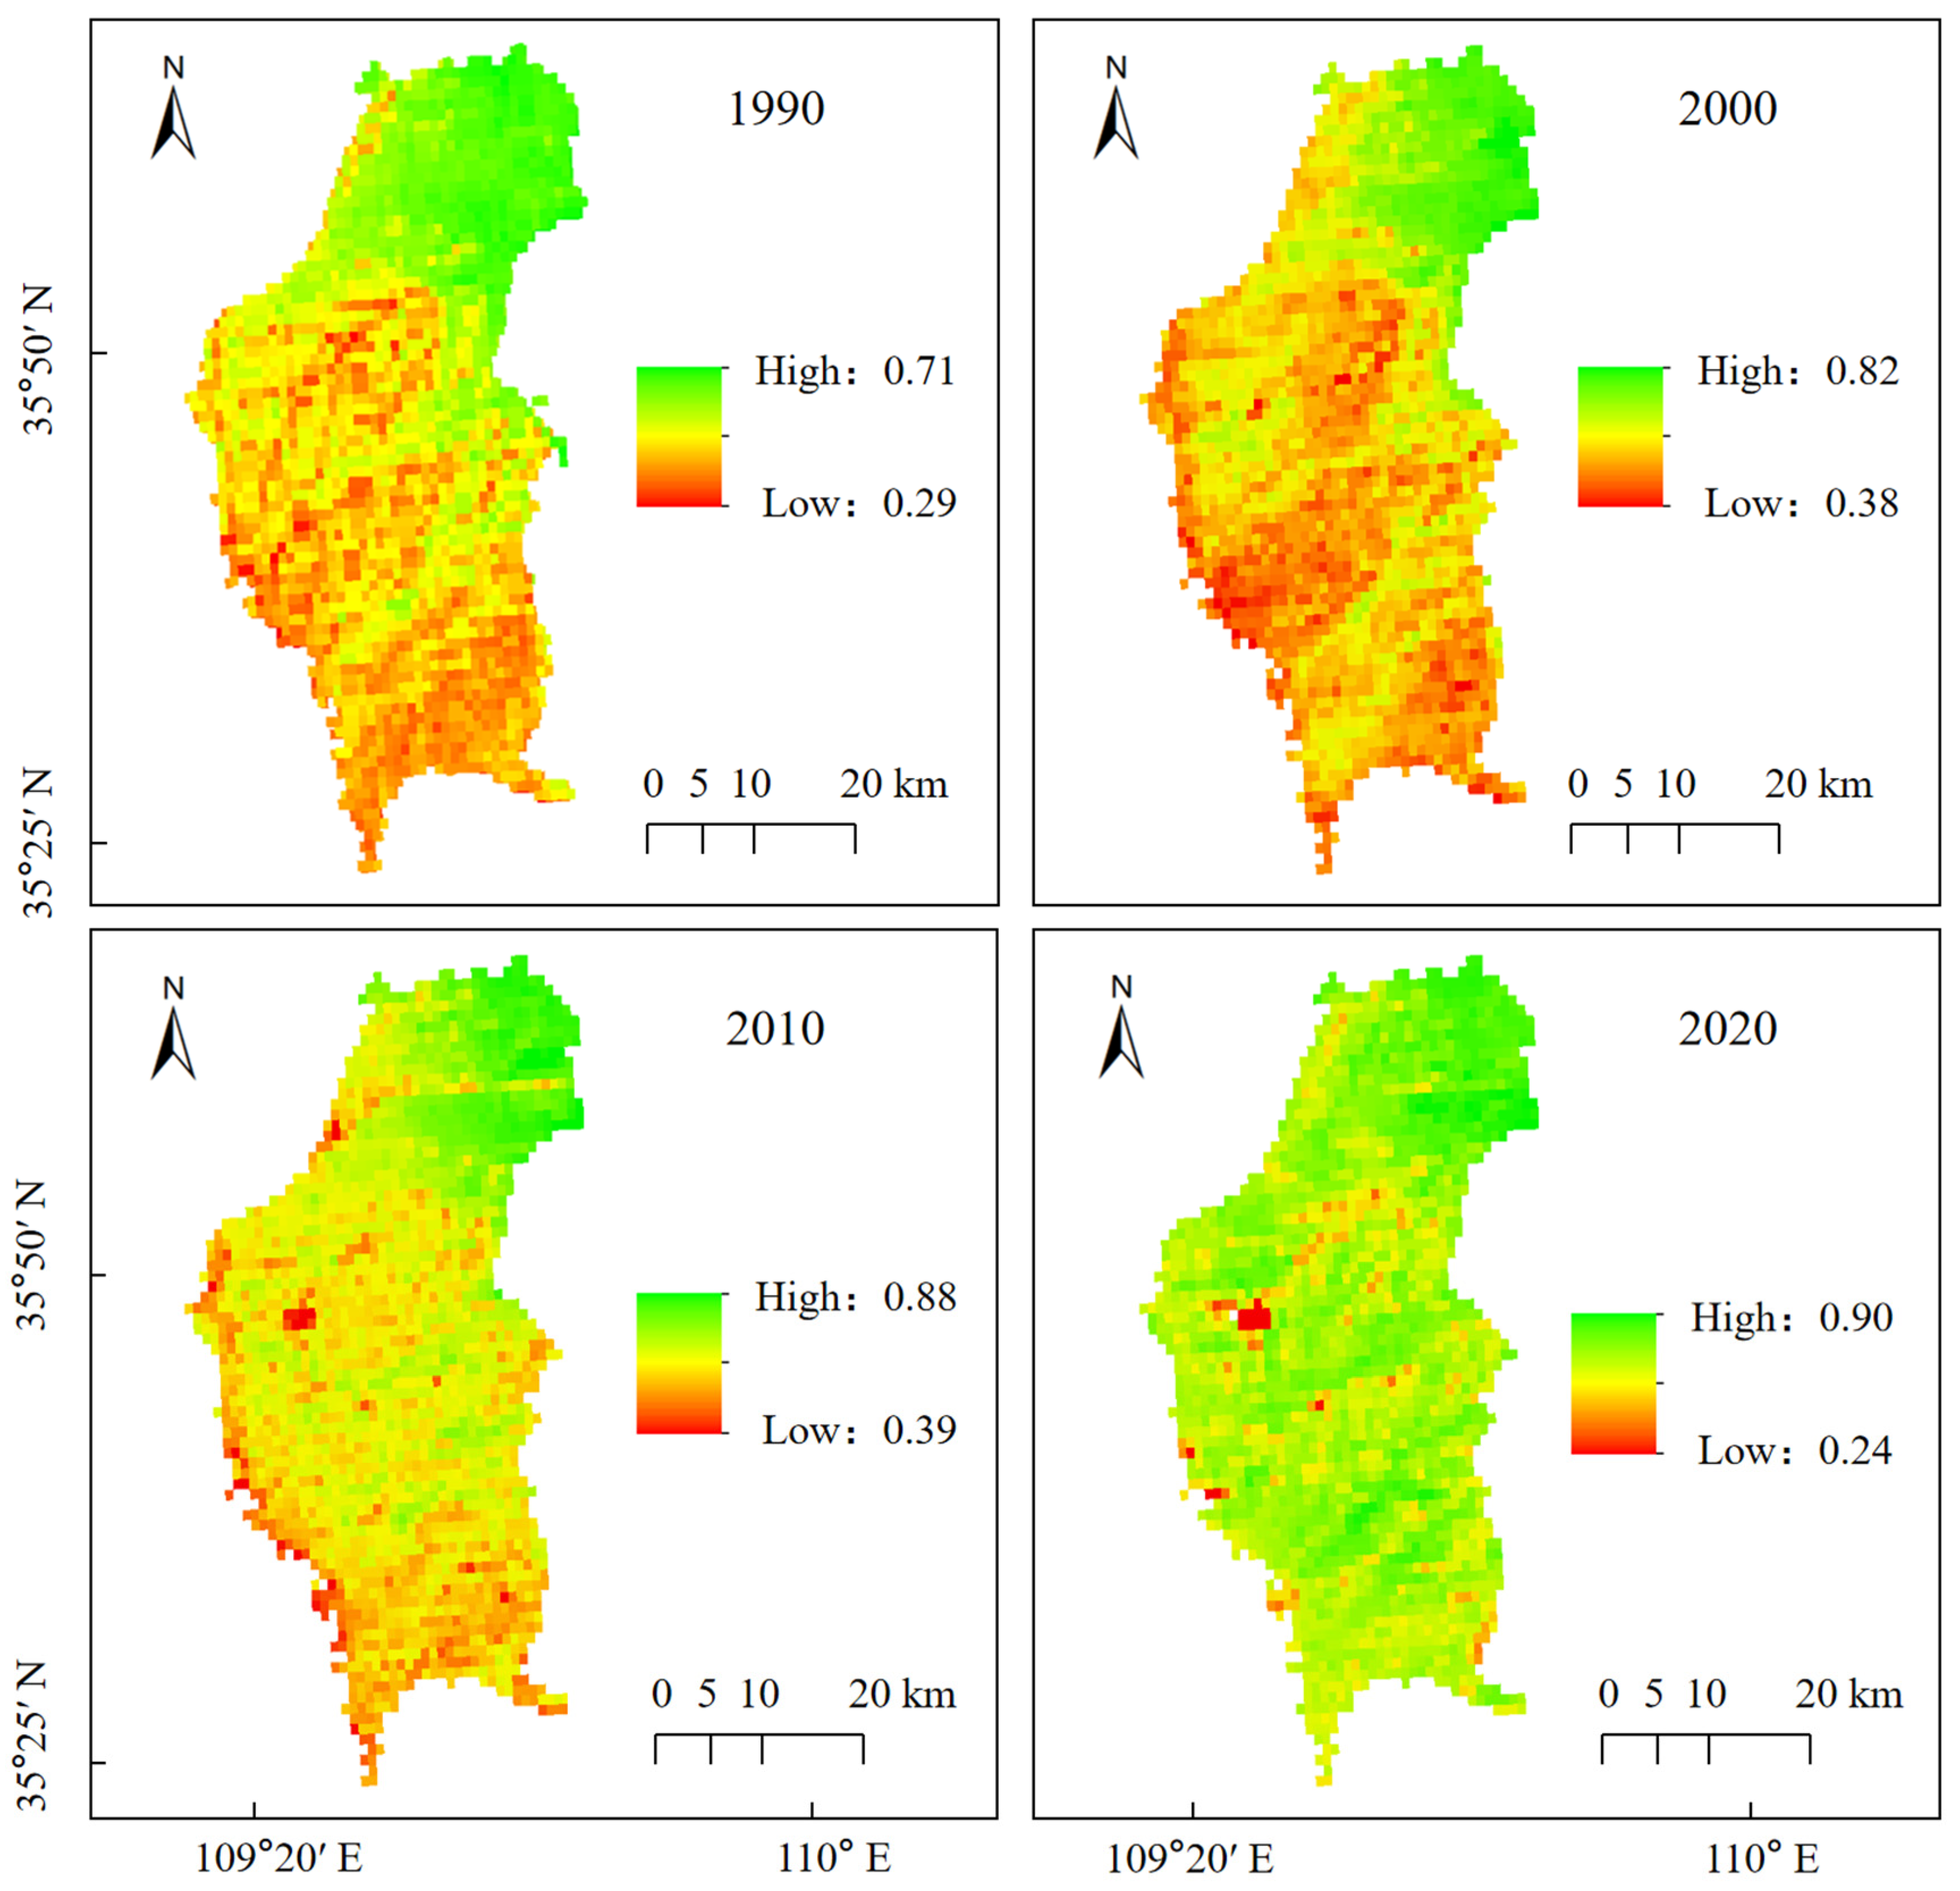
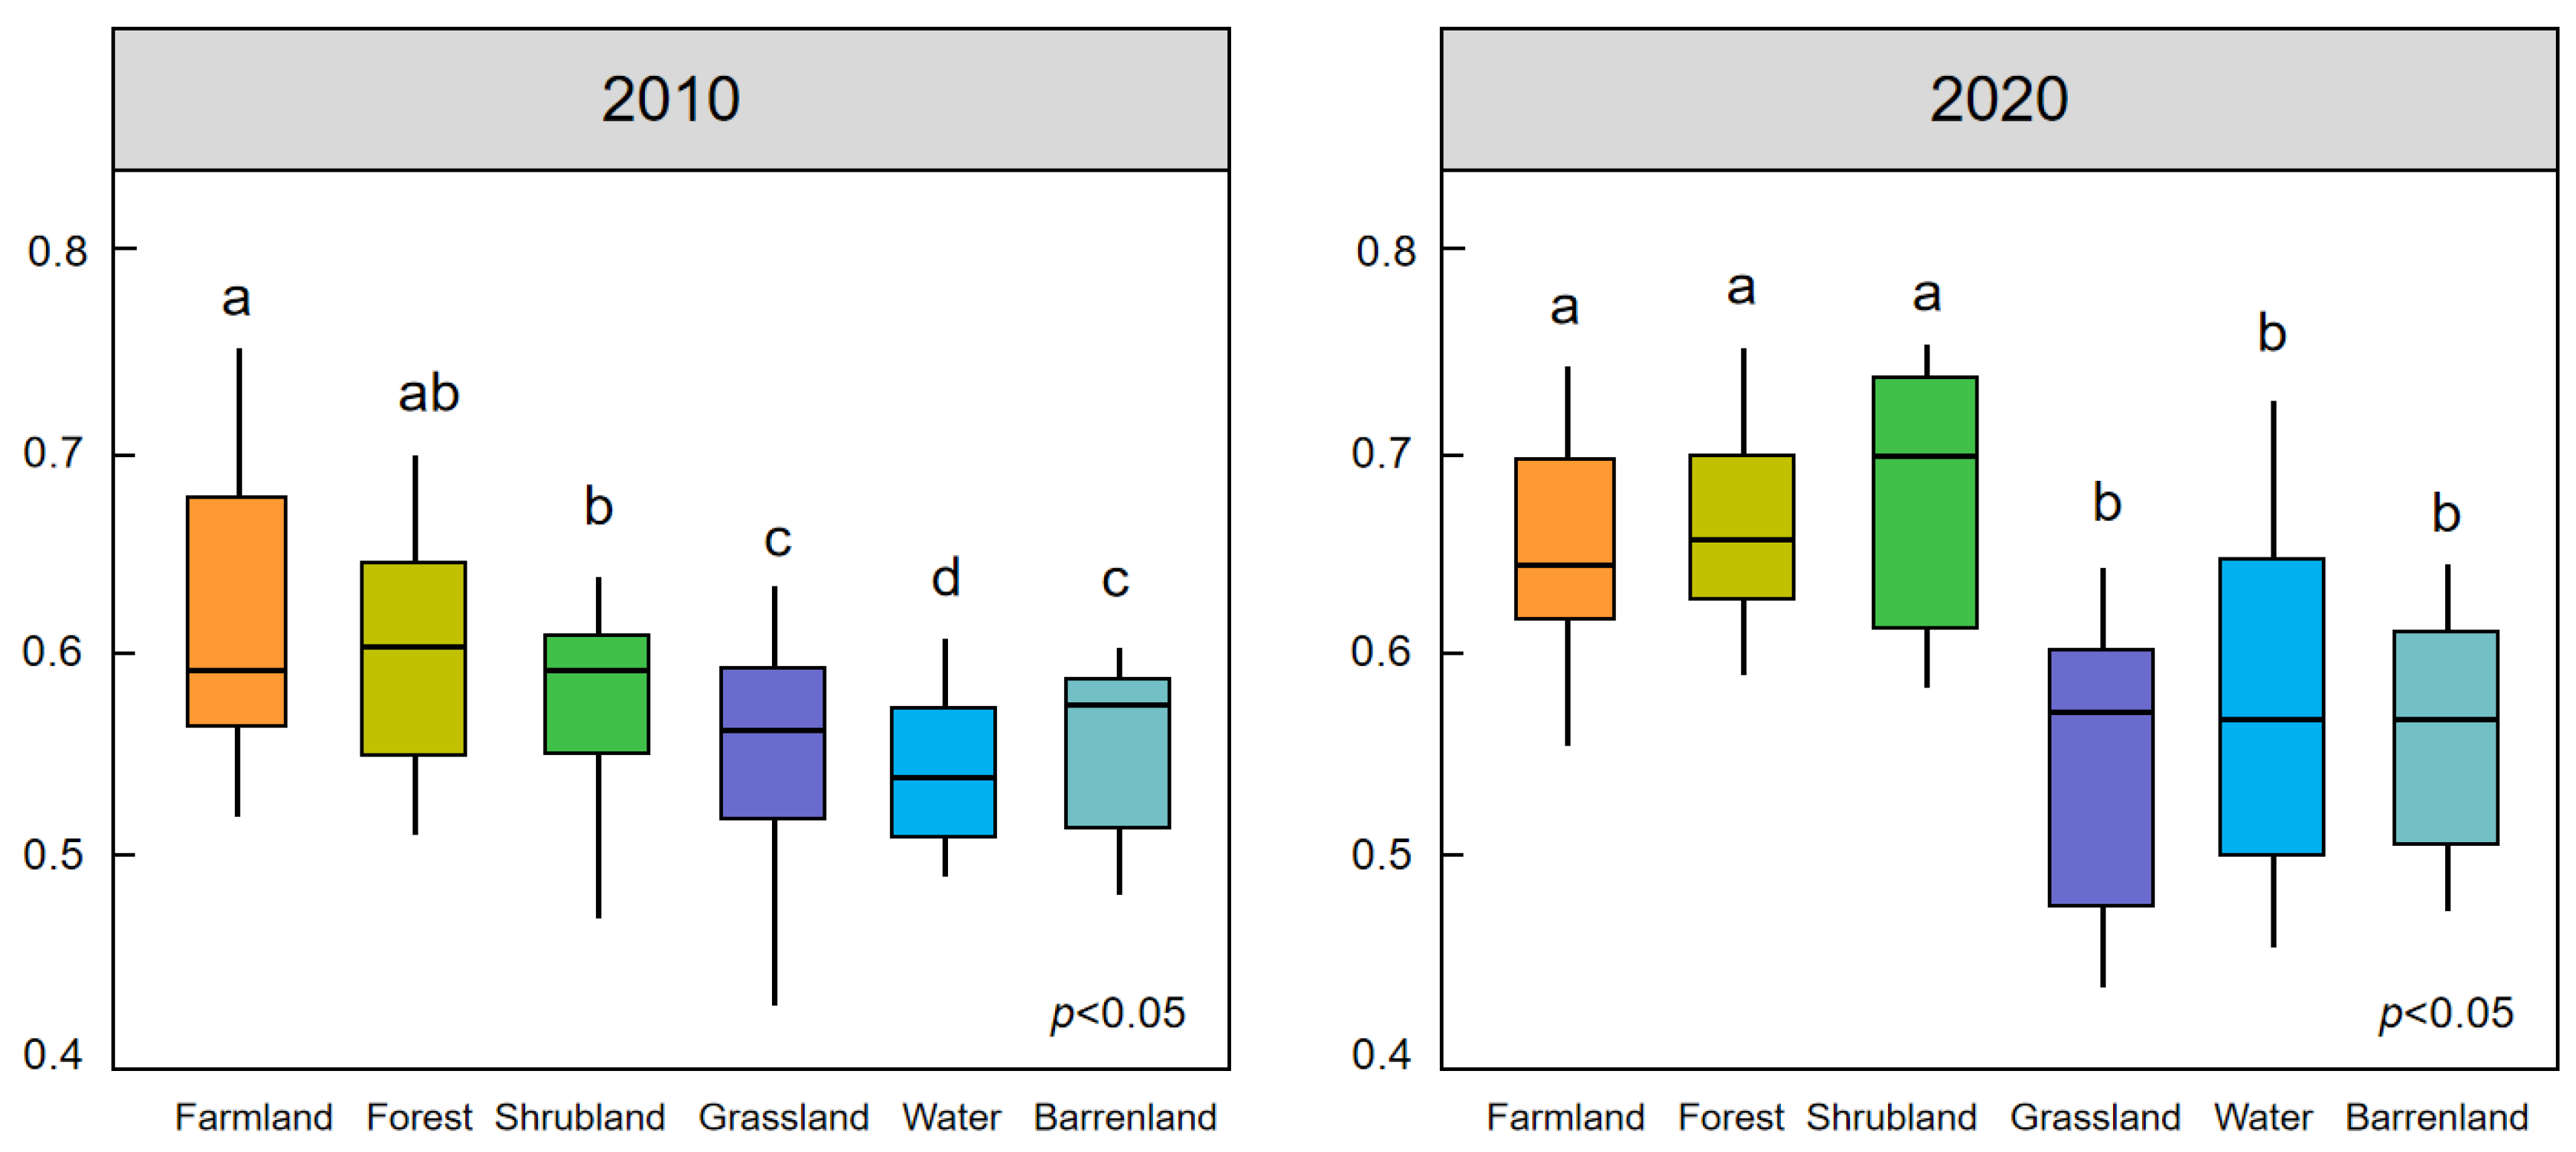
3.1. Land Use and NDVI in Luochuan County over the Past 30 Years

Since the implementation of the GGP, the alteration in land use type has had a direct influence on vegetation distribution, and the conversion of cultivated land to forest land has elevated constantly. Based on Figure 3 and Table 2, farmland dominated Luochuan county’s landscape in 1990, constituting 39.91% of the total area. Nevertheless, there existed a slight decrease in farmland area after 2000, with its proportion dropping to 38.10% by 2020. Forest land covered 27.17% of the total area in 1990 and experienced an increase post-2000, reaching 35.40% by 2020. Grassland accounted for 32.35% of Luochuan county’s total area in 1990, declining thereafter to 25.51% by 2020. In the period from 1990 to 2020, the area of water bodies in Luochuan county gradually diminished, while wasteland expanded. The northern part of Luochuan county was primarily dominated by forest and grassland, whereas farmland prevailed in the southern part.

3.2. Spatial Transfer Changes in Land Use in Luochuan County over the Past 30 Years

As shown in Figure 4, from 1990 to 2000, Luochuan county witnessed an increase of 25.02 km2 in agricultural land area, while the grassland area decreased by 41.92 km2. Between 2000 and 2010, there was a decline in agricultural land area of 67.19 km2, alongside a notable expansion in forested areas, which increased by 93.77 km2. Subsequently, from 2010 to 2020, there existed a slight increase in agricultural land area by 9.64 km2, accompanied by a significant rise in forest cover by 42.56 km2. Additionally, there was a modest expansion in wasteland area by 6.05 km2, contrasted with a decrease in grassland area by 56.52 km2. Over the past 30 years, Luochuan county saw a decrease of 32.53 km2 in farmland area, while the forest area increased by 148.61 km2. The shrub area decreased by 3.19 km2, the grassland area decreased by 123.46 km2, and the wasteland area elevated by 11.40 km2. The water area remained relatively stable.

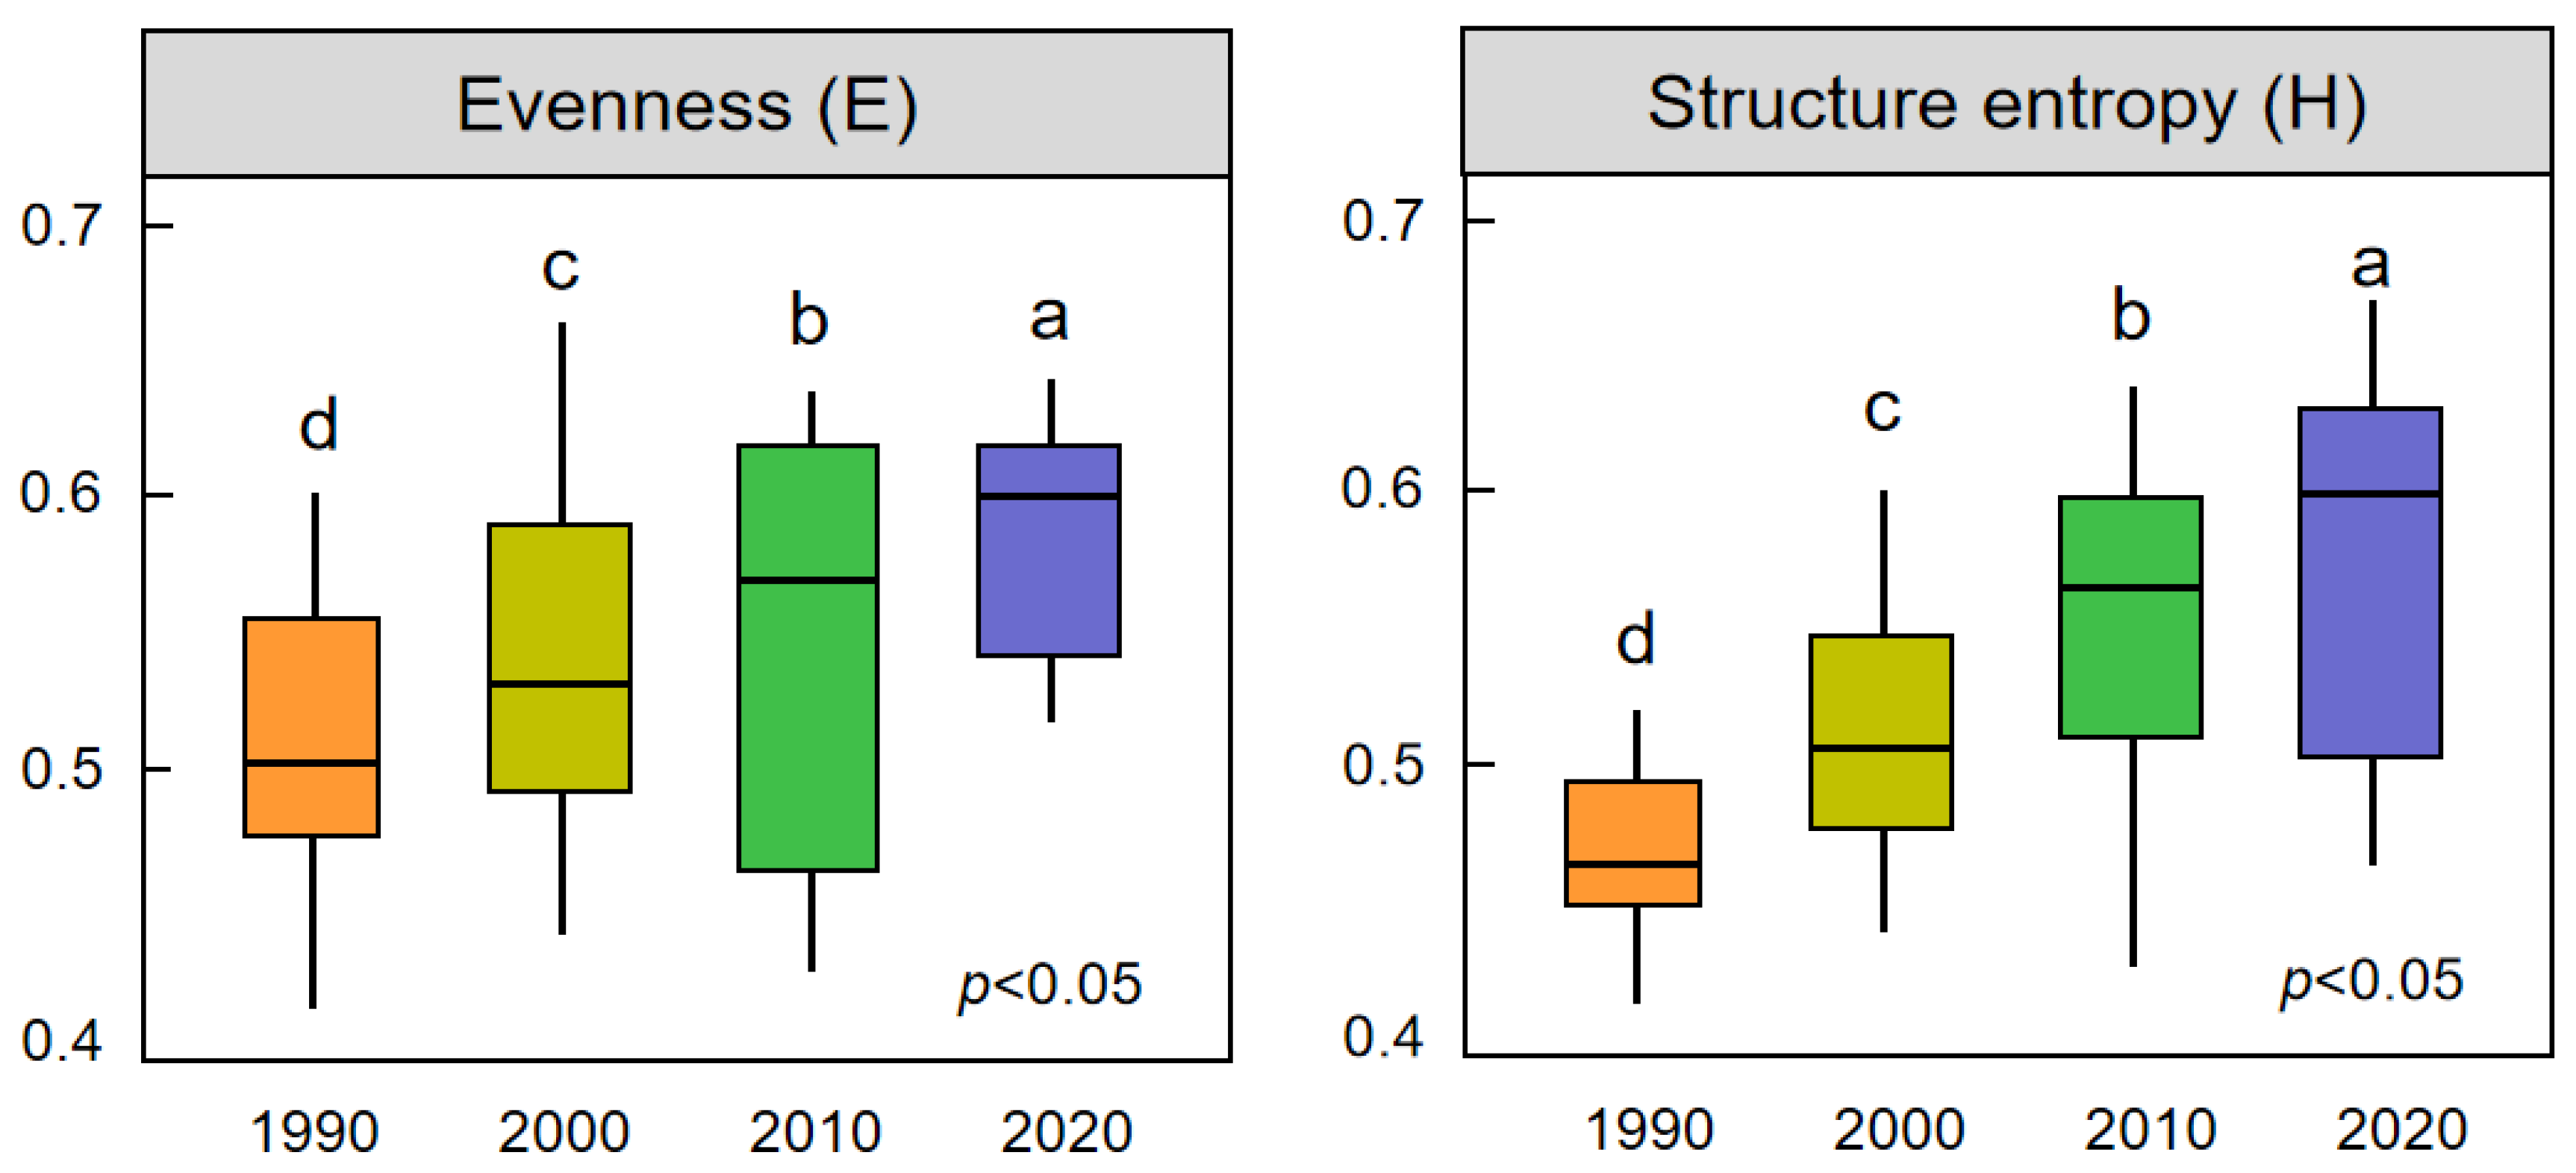
3.3. Evolution of Land Use Information Entropy in Luochuan County over the Past 30 Years

Utilizing the land use data of Luochuan county from 1990, 2000, 2010, and 2020, calculations were performed to determine the land use information entropy and evenness, and trends were plotted accordingly. As depicted in Figure 5, the land use information entropy has consistently risen from 1990 to 2020, indicating an increasing disorderliness within the land use system over this period. Moreover, the average annual change and magnitude of land use information entropy in the period from 1990 to 2000 surpassed those observed during the subsequent periods from 2000 to 2010 and 2010 to 2020. Alterations in the number of land use types, particularly in grassland and woodland areas impacted by implementing the Grain for Green Project, have significantly impacted this process. Additionally, the trend of change in land use structural entropy aligns with that of evenness, demonstrating an increase from 0.47 in 1990 to 0.59 in 2020. This suggested that the structural equilibrium of land use in Luochuan county has gradually strengthened over the past three decades, accompanied by an enhanced degree of uniformity in the distribution of land use types.

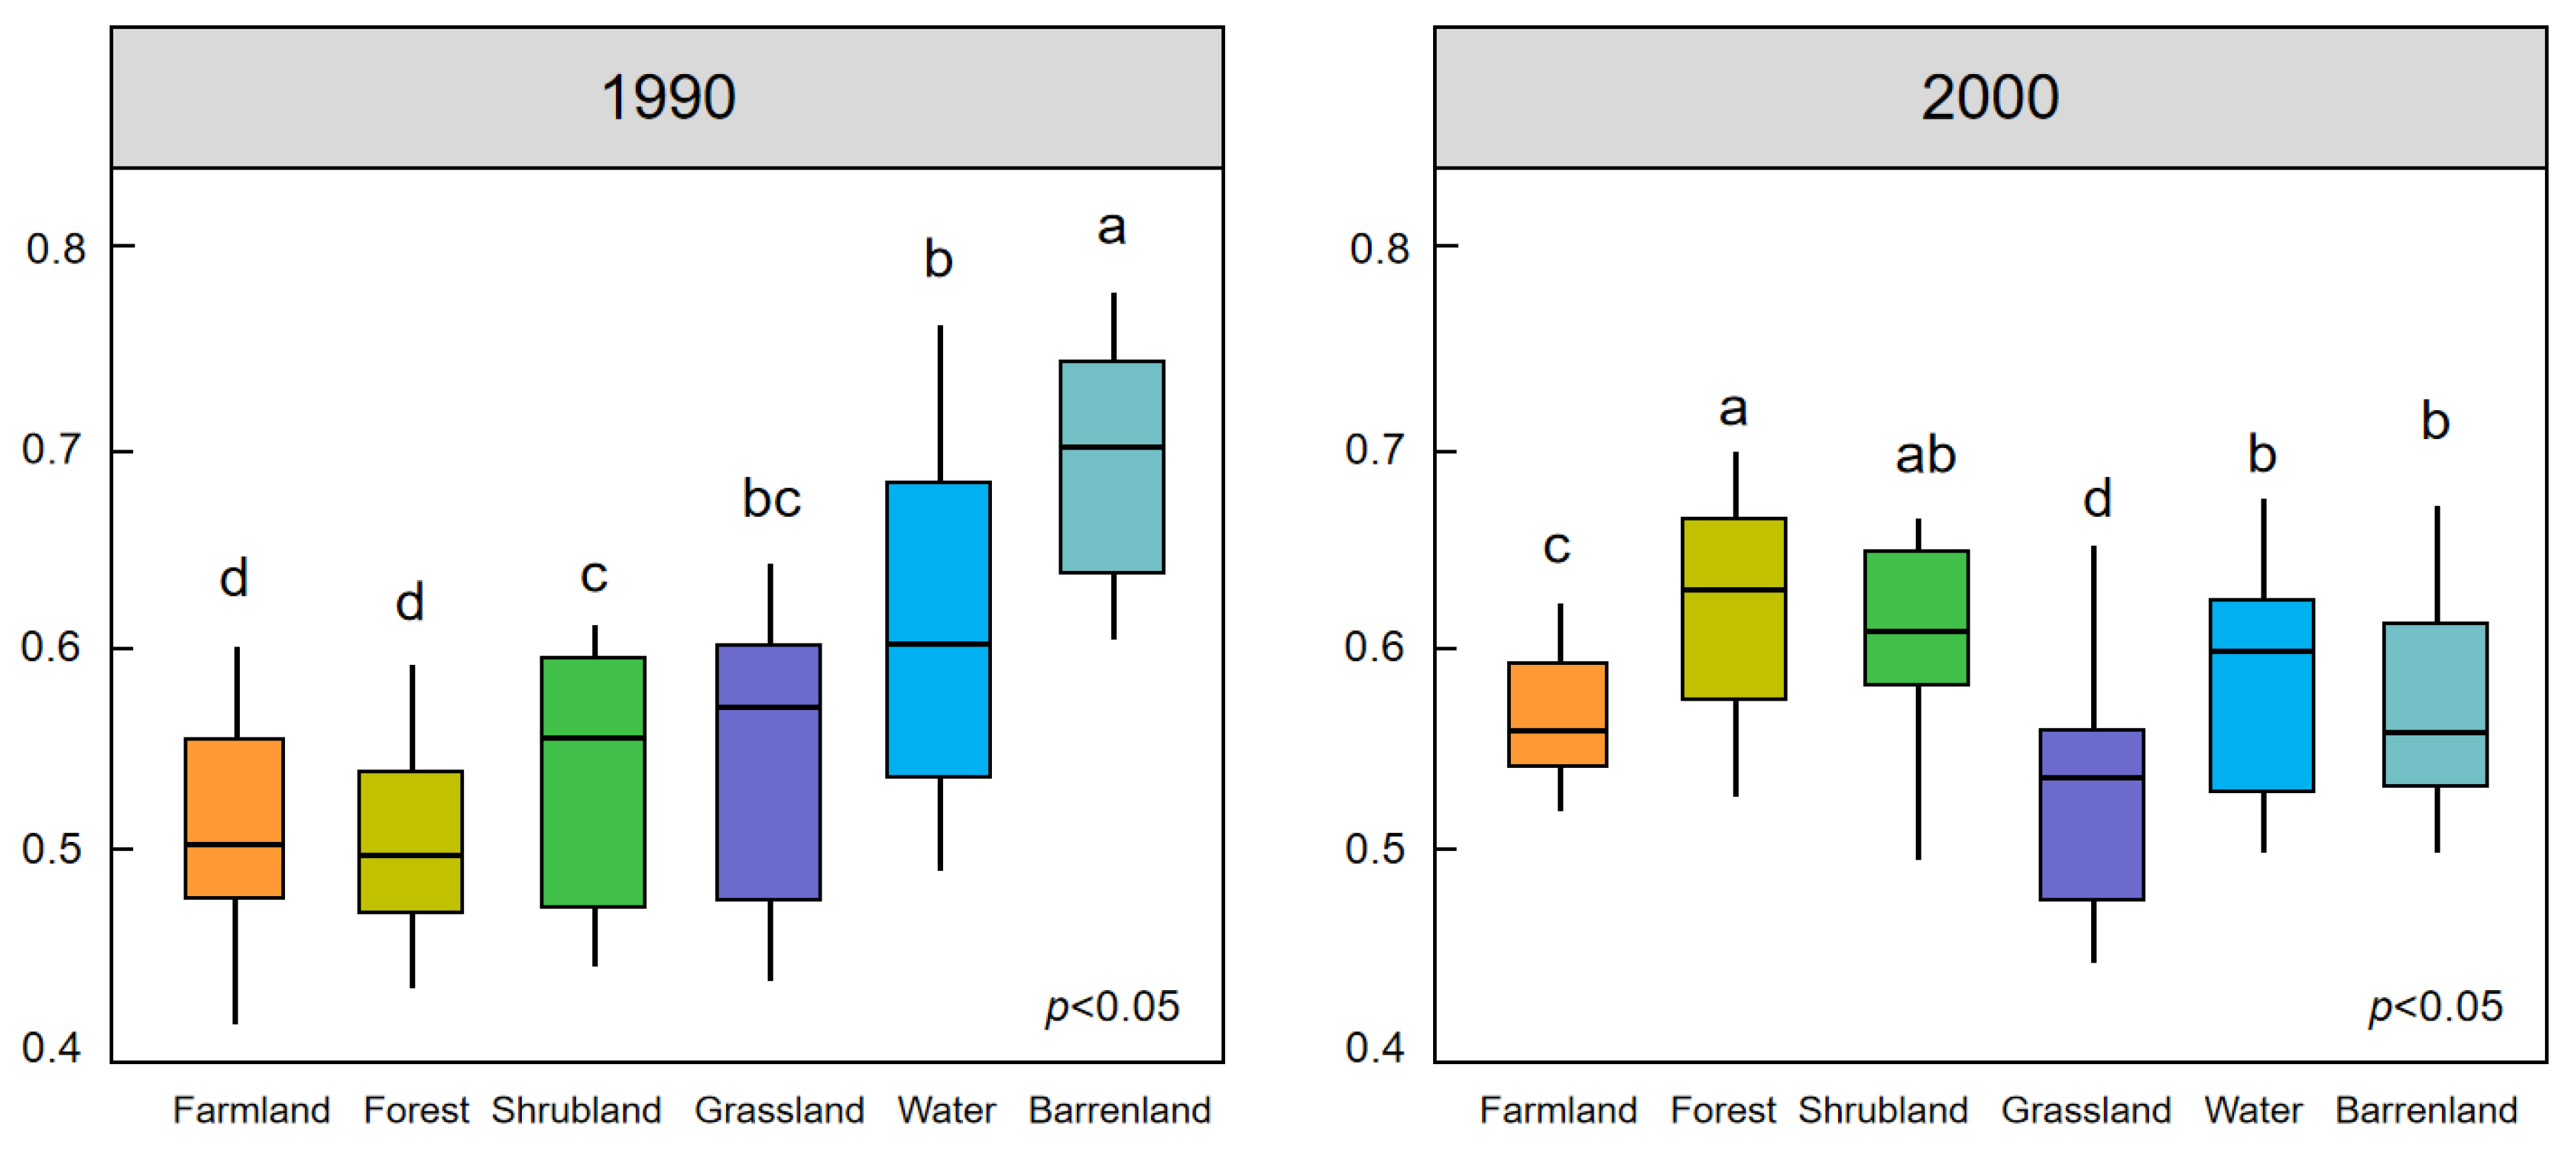
3.4. Evolution of Dominance Index of Land Use in Luochuan County over the Past 30 Years

As presented in Figure 6, the dominance index values of different land use kinds in Luochuan county have revealed a gradual increase from 1990 to 2020. Throughout the entire study period, there has been minimal fluctuation in the dominance index of each land use type. Notably, the dominance indices of farmland, grassland, and woodland have steadily ascended from 1990 to 2020, indicating the prevailing influence of grassland and woodland in shaping Luochuan county’s landscape over the past three decades.

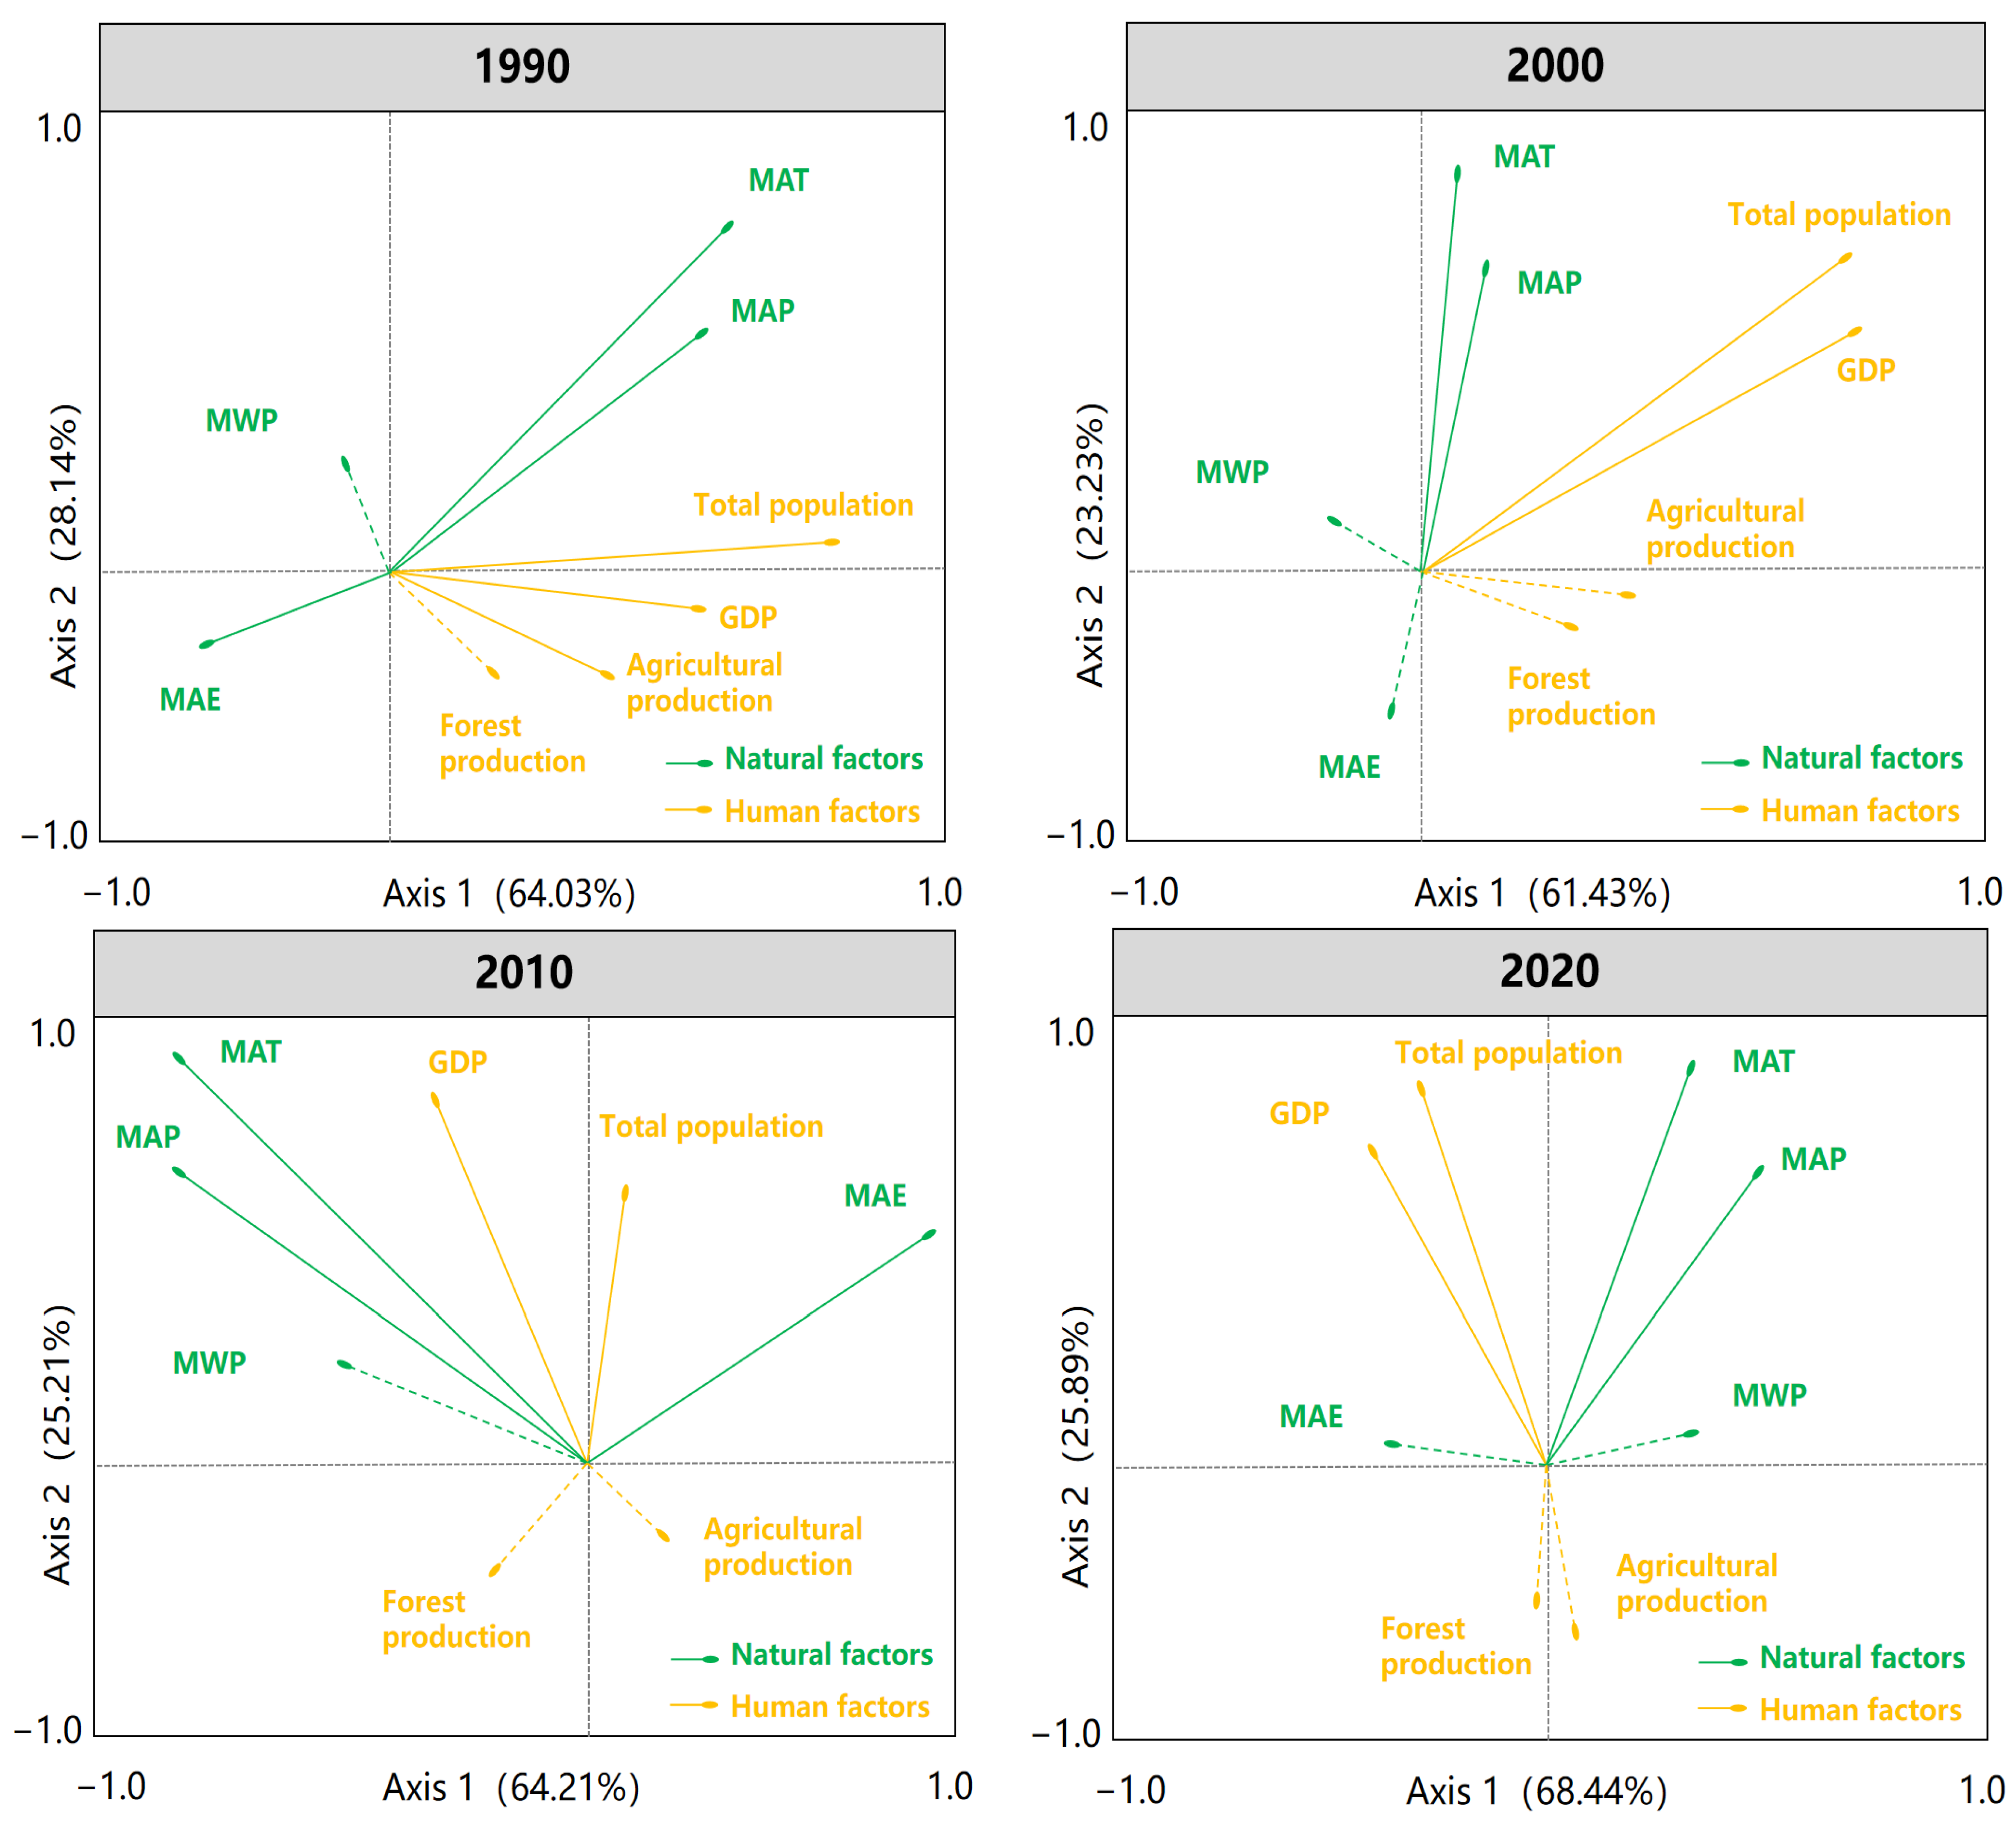
3.5. Driving Factors of Land Use Change in Luochuan County

Land use change is the result of the combined influence of natural and human activities. However, over time scales spanning several decades or even centuries, the impacts of natural factors primarily manifest as cumulative and background effects. The factors affecting the spatiotemporal processes of land use serve as the primary drivers of land use changes and are relatively active and discernible. Consequently, this study selects both natural and human factors influencing land use (Table 3). Natural factors encompass climate variables, primarily including annual average temperature, annual average precipitation, annual average evaporation, and average water vapor pressure. Human factors consist mainly of economic indicators, such as total population, per capita GDP, total agricultural output, and total forestry output.
The results of grey relational analysis for different land change quantities (Table 4) indicate that for farmland change, the highest comprehensive relevance degrees are associated with total population and per capita GDP, both at 0.92 and 0.91, respectively. This highlights the significant contributions of total population and per capita GDP to farmland change. Similarly, for forest change, the highest comprehensive relevance degrees are observed in total population and per capita GDP, both at 0.95 and 0.92, respectively, underscoring their substantial impact on forest change. In the case of grassland change, the highest comprehensive relevance degrees are attributed to total population and per capita GDP, both at 0.91 and 0.87, respectively, emphasizing their noteworthy influence on grassland change. Additionally, for shrubland and water change, the highest contribution rates originate from MAP and MAT.
The redundancy analysis (RDA) performed on the natural and anthropogenic factors against the land use change quantities for different years (Figure 7) indicates that both natural and anthropogenic factors effectively account for the variations in land use change. The explanatory capability of axes 1 and 2 highlights the significant contributions of both natural and anthropogenic factors in explaining land use change quantities. Specifically, land use change quantities from 1990 to 2020 are primarily influenced by factors such as annual average temperature, annual average precipitation, total population, and per capita GDP.
Regression models were formulated using land use type conversion quantities for distinct periods as the dependent variable Y, with natural and anthropogenic factors serving as the independent variable X to investigate the drivers of land use type conversion across different time spans. The derived driving force models for land conversion during various periods underwent accuracy assessments of model parameters and regression equations (Table 5). The findings unveil the following: During 1990–2000, the shift from farmland to forest, shrubland, and grassland demonstrates a positive correlation with both annual average temperature and precipitation. Natural factors predominantly shaped land use in the initial decade of the GGP. From 2000 to 2010, farmland conversion to forest, shrubland, and grassland positively correlates with total population. During the ten-year GGP, Luochuan county experienced rapid population growth, leading to increased urban expansion, residential construction land, and transportation land. Consequently, the ratio of farmland converted to forest and shrubland/grassland gradually rose, underscoring the significant role of population as a continuous external pressure driving the expansion of forests and grasslands. From 2010 to 2020, farmland conversion to forest, shrubland, and grassland positively correlates with both total population and agricultural total output value. Throughout this period, Luochuan county’s population continued to grow, remaining significantly influenced by agricultural and economic development levels in the research area.

4. Discussion

4.1. Land Use Evolution over the Past 30 Years in Luochuan County

Through the GGP, our national government exerts a significant guiding force on land use change. Nevertheless, a large majority of previous studies concentrated on the effect of these policies in a specific period without quantitative findings [22,23,24]. This study showed that land use in Luochuan county has altered significantly during the past 30 years; this is primarily reflected by the decrease in cultivated land, and the substantial increase in forest and shrubland because of the GGP [17,18]. The increasing area of forest has caused an obvious decrease in farmland, supporting the previous studies [19,20]. Between 1990 and 2020, the area of water in Luochuan county gradually diminished, while the area of barrenland increased (Table 2). Forests and grasslands primarily covered the northern part of Luochuan county, while farmland dominated the southern part. During the past three decades, there has been a gradual enhancement of the equilibrium of land use in Luochuan county, suggesting an increased evenness in land use distribution among the various types.
It has been extensively recognized that land use change results from the combined effects of natural and human activities [34,35,36]. This study demonstrated that between 1990 and 2020, land use changes were primarily influenced by MAT, MAP, total population, and GDP (Figure 7). Luochuan county has been undergoing a huge alteration in its social, economic, and ecological development. According to the Shaanxi province Statistical Yearbook, it can be observed that Luochuan county showed a stable elevation in its total population during the 30-year study period, exhibiting a constant upward trend [20]. Before the implementation of the GGP in 2000, agricultural production accounted for a large proportion of the regional GDP in this region. Then, it took effort and time to implement the reforestation program to assist farmers in abandoning farming activities [23,24]. Thus, agricultural production decreased while forest production increased during GGP. In 1990, the local economy relied heavily on agriculture and animal husbandry, characterized by extensive economic growth largely driven by investment in human capital. Population growth during this period contributed to economic expansion but also resulted in significant irrational use of land resources, including increased land clearing and grazing activities, resulting in an imperfect land use structure [37,38]. From 2000 to 2010, Luochuan county experienced rapid socio-economic development, marked by increases in agricultural and forestry output values and urbanization levels. This period saw rapid economic growth and urban expansion as the main drivers of land conversion, contributing to a notable reduction in farmland area and necessitating adjustments to agricultural production structures [39,40,41]. By implementing the GGP, ecological restoration progressed favorably, and the population growth rate in Luochuan county slowed down, resulting in more rational land use, and land use conversion remained relatively stable during this phase. From 2010 to 2020, agriculture and animal husbandry no longer dominated the economy, with secondary and tertiary industries becoming the primary sources of income. This shift alleviated pressure on the natural ecological environment and facilitated rapid vegetation recovery, leading to more pronounced land use conversion during this period.

4.2. The Driving Factors of Land Use Change during the Past 30 Years in Luochuan County

Most studies have shown that human activities resulting from national policy exert a great effect on land use change [2,3,42], which is consistent with this study (Figure 7). Studies on the driving mechanism of land use change at the global scale indicated that 60% of land use change can be caused by human economic and social development activities, and 40% of land use change was associated with climate change [43,44]. Nevertheless, the present study demonstrated that the land use change process during the past 30 years has primarily been influenced by economic and social development factors, with climate change exerting a lesser effect. Mostly important, the impacts of human activities were higher than those of climate factors, conforming to the existing studies [7,9]. Therefore, it is very important to identify the relative contribution of human activities and climate factors to land use changes during vegetation restoration and ecological protection.
Regression model analysis suggested that during the initial decade of the GGP, natural factors primarily drove land use changes (Table 5). However, in the subsequent ten-year period, the conversion of farmland to forest, shrubland, and grassland exhibited a positive association with the total population. Over this period, Luochuan county witnessed rapid population growth, resulting in urban expansion and increased demand for residential, commercial, and transportation land. Consequently, the proportion of farmland converted to forest, shrubland, and grassland gradually escalated, emphasizing the significant role of the total population as a persistent external force propelling the expansion of forest and grassland [45]. Within the period from 2010 to 2020, the conversion of farmland to forest, shrubland, and grassland correlated positively with both the total population and agricultural production. Throughout this time, Luochuan county’s population continued to rise, still influenced by agricultural production and economic development levels.
The transition of land use mirrors shifts in agricultural production structures to some extent. Driven by the principle of comparative advantage, individuals tend to prioritize industries offering greater economic benefits, with the aim of improving agricultural economic efficiency [46,47]. Indeed, land use changes are not solely driven by isolated factors affecting each land use type independently to alter their respective areas [48,49]. Instead, these factors collaborate, either directly or indirectly, influencing overall land use change across the entire research area [3,50]. For instance, in Luochuan county, conversions from farmland to forest, from forest to farmland, and mutual conversions between farmland and grassland coexist. This indicates that national policies such as the GGP have played vital roles in maintaining the quantity of forests and grasslands, fostering ecological balance, and dynamically adjusting the total area of farmland in later periods. Thus, land management policies are also critical factors influencing regional land use changes.
Actually, land use change results from both human activities and environmental factors [43,44]. On the one hand, human activities can degrade natural resources and harm the ecological balance. On the other hand, restoring vegetation necessitates human intervention through altering land use patterns. Strategies like the GGP, which promote the shift from farmland to grassland and forest, can significantly benefit the environment [8,51]. Hence, analyzing land use conversion demands consideration of both human actions and natural elements like climate. Continuous monitoring of the effect of human activities and climate on vegetation restoration is crucial for understanding the intricate relationship and trends between economic progress and climate in Luochuan county. Finally, as a relatively underdeveloped region, Luochuan county has been undergoing an influential urban–rural transition development since 1990. Meanwhile, with the progress of industrialization and urbanization, Luochuan county is also confronting an accelerated process of land use transitions, which will cause foreseeable threats for regional economic sustainable development and eco-environment protection [52]. As a result, with the purpose of formulating scientific, reasonable, and sustainable land use policies, it becomes vital to investigate land use transition at the micro-scale.

4.3. Limitations

The ideas and methods of the present study provide a reasonable suggestion for sustainable economic progress and natural resource management in Luochuan county. Nevertheless, this study still has the following limitations. First, with urbanization and rapid economic development, the space for human activities shows a tendency to increase, which can be directly shown during the process of expanding construction land. Therefore, it is necessary for the government management department to make corresponding policies to restrain it. Second, in terms of the land use driving factors, data availability and accessibility were primarily taken into consideration. Therefore, it was impossible to comprehensively determine all the factors driving land use change. Third, it was of note that the RDA-multiple linear stepwise regression method exhibited specific shortcomings. Even though it can confirm the links between the driving factors and land use types on a large scale, it neglects the effects from human activities and climate factors. Moreover, we should consider the unquantifiable drivers (such as some policy items) when building the RDA model, which is a large challenge. Thus, artificial intelligence modeling methods on the basis of fine spatial scales (provincial- and county-level administrative regions, grids, or pixels) should be the focus, which can drive mechanism analysis.

5. Conclusions

To conclude, the present study deciphered the dynamics of land use changes in response to natural environmental and human activities. According to the regression mode, the driving factors analysis was performed. The obtained findings indicated that Luochuan county was directed by cultivated land and construction land. Although the disturbance of human activities and the change in natural factors jointly influence the land use type and its spatial distribution, their contributions are different. The shift in land use from 1990 to 2020 primarily correlates with average annual temperature, annual precipitation, total population, and GDP. Further regression analysis indicated that during the initial decade of the GGP, natural factors primarily drove land use changes. However, after GGP, the conversion rate from farmland to forest and shrubland/grassland escalated, with population growth serving as a continual external force driving the expansion of forest and grassland. In general, the current work contributes to identifying the characteristics of historical land use changes and near-future critical locations in the face of the continuous pressure on environment. Moreover, it can also help decision-makers in performing effective protection strategies as well as sustainable land use management.

Author Contributions

Y.X. and Y.Y. conceived and designed this study. Y.Y. performed the field trip. Y.X. drafted the original manuscript. L.L. and W.M. provided data analysis and revision of the manuscript. Y.Y. and L.L. provided very constructive suggestions. All authors have read and agreed to the published version of the manuscript.

Funding

The National Natural Sciences Foundation of China (42377241), the Youth Innovation Promotion Association of the Chinese Academy of Sciences (2023430), the Natural Science Foundation of Gansu Province (22JR5RA075).

Data Availability Statement

Data will be made available on request.

Conflicts of Interest

We claim that we have no known competing financial interests or personal relationships that could have seemed to affect the work reported in the current study.

References

  1. Zhou, Y.; Li, X.; Liu, Y. Land use change and driving factors in rural China during the period 1995–2015. Land Use Policy 2020, 99, 105048. [Google Scholar] [CrossRef]
  2. Wang, X.; Wu, J.; Liu, Y.; Hai, X.; Shanguan, Z.; Deng, L. Driving factors of ecosystem services and their spatiotemporal change assessment based on land use types in the Loess Plateau. J. Environ. Manag. 2022, 311, 114835. [Google Scholar] [CrossRef]
  3. Xie, L.; Wang, H.; Liu, S. The ecosystem service values simulation and driving force analysis based on land use/land cover: A case study in inland rivers in arid areas of the Aksu River Basin, China. Ecol. Indic. 2022, 138, 108828. [Google Scholar] [CrossRef]
  4. Niu, X.; Hu, Y.; Lei, Z.; Wang, H.; Zhang, Y.; Yan, H. Spatial and temporal evolution characteristics of land use/cover and its driving factor in Cambodia during 2000–2020. Land 2022, 11, 1556. [Google Scholar] [CrossRef]
  5. Dong, Z.; Rong, A.; Zhang, J.; Tong, Z.; Han, A.; Zhi, F. Study on the Evolutionary Features and Driving Factors of Land-Use System in Xilingol, China. Land 2022, 11, 526. [Google Scholar] [CrossRef]
  6. Zhou, X.; Wu, D.; Li, J.; Liang, J.; Zhang, D.; Chen, W. Cultivated land use efficiency and its driving factors in the Yellow River Basin, China. Ecol. Indic. 2022, 144, 109411. [Google Scholar] [CrossRef]
  7. Wu, J.; Luo, J.; Zhang, H.; Qin, S.; Yu, M. Projections of land use change and habitat quality assessment by coupling climate change and development patterns. Sci. Total Environ. 2022, 847, 157491. [Google Scholar] [CrossRef]
  8. Zhang, S.; Yang, P.; Xia, J.; Wang, W.; Cai, W.; Chen, N.; Zhan, C. Land use/land cover prediction and analysis of the middle reaches of the Yangtze River under different scenarios. Sci. Total Environ. 2022, 833, 155238. [Google Scholar] [CrossRef] [PubMed]
  9. Long, X.; Lin, H.; An, X.; Chen, S.; Qi, S.; Zhang, M. Evaluation and analysis of ecosystem service value based on land use/cover change in Dongting Lake wetland. Ecol. Indic. 2022, 136, 108619. [Google Scholar] [CrossRef]
  10. Li, X.; Fu, J.; Jiang, D.; Lin, G.; Cao, C. Land use optimization in Ningbo City with a coupled GA and PLUS model. J. Clean. Prod. 2022, 375, 134004. [Google Scholar] [CrossRef]
  11. Allan, A.; Soltani, A.; Abdi, M.H.; Zarei, M. Driving forces behind land use and land cover change: A systematic and bibliometric review. Land 2022, 11, 1222. [Google Scholar] [CrossRef]
  12. Hao, J.; Lin, Q.; Wu, T.; Chen, J.; Li, W.; Wu, X.; Hu, G.; La, Y. Spatial–temporal and driving factors of land use/cover change in Mongolia from 1990 to 2021. Remote Sens. 2023, 15, 1813. [Google Scholar] [CrossRef]
  13. Zhou, Y.; Zhong, Z.; Cheng, G. Cultivated land loss and construction land expansion in China: Evidence from national land surveys in 1996, 2009 and 2019. Land Use Policy 2023, 125, 106496. [Google Scholar] [CrossRef]
  14. Hishe, H.; Giday, K.; Van Orshoven, J.; Muys, B.; Taheri, F.; Azadi, H.; Feng, L.; Zamani, O.; Mirzaei, M.; Witlox, F. Analysis of land use land cover dynamics and driving factors in Desa’a forest in Northern Ethiopia. Land Use Policy 2021, 101, 105039. [Google Scholar] [CrossRef]
  15. Wang, Q.; Wang, H.; Chang, R.; Zeng, H.; Bai, X. Dynamic simulation patterns and spatiotemporal analysis of land use/land-cover changes in the Wuhan metropolitan area, China. Ecol. Model. 2022, 464, 109850. [Google Scholar] [CrossRef]
  16. Zhou, J.; Gao, P.; Wu, C.; Mu, X. Analysis of land use change characteristics and its driving forces in the loess plateau: A case study in the yan River Basin. Land 2023, 12, 1653. [Google Scholar] [CrossRef]
  17. Jiang, W.; Fu, B.; Lü, Y. Assessing impacts of land use/land cover conversion on changes in ecosystem services value on the Loess Plateau, China. Sustainability 2020, 12, 7128. [Google Scholar] [CrossRef]
  18. Ren, Y.; Lü, Y.; Fu, B.; Comber, A.; Li, T.; Hu, J. Driving factors of land change in China’s loess plateau: Quantification using geographically weighted regression and management implications. Remote Sens. 2020, 12, 453. [Google Scholar] [CrossRef]
  19. Sun, W.; Ding, X.; Su, J.; Mu, X.; Zhang, Y.; Gao, P.; Zhao, G. Land use and cover changes on the Loess Plateau: A comparison of six global or national land use and cover datasets. Land Use Policy 2022, 119, 106165. [Google Scholar] [CrossRef]
  20. Huang, H.; Zhou, Y.; Qian, M.; Zeng, Z. Land use transition and driving forces in Chinese Loess Plateau: A case study from Pu County, Shanxi Province. Land 2021, 10, 67. [Google Scholar] [CrossRef]
  21. Zhu, Z.; Liu, L.; Chen, Z.; Zhang, J.; Verburg, P.H. Land-use change simulation and assessment of driving factors in the loess hilly region—A case study as Pengyang County. Environ. Monit. Assess. 2010, 164, 133–142. [Google Scholar] [CrossRef] [PubMed]
  22. Du, X.; Zhao, X.; Liang, S.; Zhao, J.; Xu, P.; Wu, D. Quantitatively assessing and attributing land use and land cover changes on China’s Loess Plateau. Remote Sens. 2020, 12, 353. [Google Scholar] [CrossRef]
  23. Nie, T.; Dong, G.; Jiang, X.; Lei, Y. Spatio-temporal changes and driving forces of vegetation coverage on the loess plateau of Northern Shaanxi. Remote Sens. 2021, 13, 613. [Google Scholar] [CrossRef]
  24. Zhou, X.; Zhou, Y. Spatio-temporal variation and driving forces of land-use change from 1980 to 2020 in loess plateau of northern Shaanxi, China. Land 2021, 10, 982. [Google Scholar] [CrossRef]
  25. Hu, Y.; Dao, R.; Hu, Y. Vegetation change and driving factors: Contribution analysis in the loess plateau of China during 2000–2015. Sustainability 2019, 11, 1320. [Google Scholar] [CrossRef]
  26. Tian, Y.; Yin, K.; Lu, D.; Hua, L.; Zhao, Q.; Wen, M. Examining land use and land cover spatiotemporal change and driving forces in Beijing from 1978 to 2010. Remote Sens. 2014, 6, 10593–10611. [Google Scholar] [CrossRef]
  27. Teixeira, Z.; Teixeira, H.; Marques, J.C. Systematic processes of land use/land cover change to identify relevant driving forces: Implications on water quality. Sci. Total Environ. 2014, 470, 1320–1335. [Google Scholar] [CrossRef] [PubMed]
  28. Li, J.; Chunyu, X.; Huang, F. Land use pattern changes and the driving forces in the Shiyang River Basin from 2000 to 2018. Sustainability 2022, 15, 154. [Google Scholar] [CrossRef]
  29. Gong, Y.; You, G.; Chen, T.; Wang, L.; Hu, Y. Rural landscape change: The driving forces of land use transformation from 1980 to 2020 in Southern Henan, China. Sustainability 2023, 15, 2565. [Google Scholar] [CrossRef]
  30. Quan, L.A.; Jin, S.; Chen, J.; Li, T. Evolution and driving forces of ecological service value in Anhui based on landsat land use and land cover change. Remote Sens. 2024, 16, 269. [Google Scholar] [CrossRef]
  31. Lin, Z.; Peng, S. Comparison of multimodel simulations of land use and land cover change considering integrated constraints-A case study of the Fuxian Lake basin. Ecol. Indic. 2022, 142, 109254. [Google Scholar] [CrossRef]
  32. Ma, G.; Li, Q.; Yang, S.; Zhang, R.; Zhang, L.; Xiao, J.; Sun, G. Analysis of landscape pattern evolution and driving forces based on land-use changes: A case study of Yilong Lake watershed on Yunnan-Guizhou Plateau. Land 2022, 11, 1276. [Google Scholar] [CrossRef]
  33. Wang, F.; Yuan, X.; Xie, X. Dynamic change of land use/land cover patterns and driving factors of Nansihu Lake Basin in Shandong Province, China. Environ. Earth Sci. 2021, 80, 180. [Google Scholar] [CrossRef]
  34. Zhang, P.; Liu, L.; Yang, L.; Zhao, J.; Li, Y.; Qi, Y.; Cao, L. Exploring the response of ecosystem service value to land use changes under multiple scenarios coupling a mixed-cell cellular automata model and system dynamics model in Xi’an, China. Ecol. Indic. 2023, 147, 110009. [Google Scholar] [CrossRef]
  35. Kleemann, J.; Baysal, G.; Bulley, H.N.; Fürst, C. Assessing driving forces of land use and land cover change by a mixed-method approach in north-eastern Ghana, West Africa. J. Environ. Manag. 2017, 196, 411–442. [Google Scholar] [CrossRef]
  36. Wang, J.; Zhang, J.; Xiong, N.; Liang, B.; Wang, Z.; Cressey, E.L. Spatial and temporal variation, simulation and prediction of land use in ecological conservation area of Western Beijing. Remote Sens. 2022, 14, 1452. [Google Scholar] [CrossRef]
  37. Viedma, O.; Moreno, J.M.; Güngöroglu, C.; Cosgun, U.; Kavgacı, A. Recent land use and land-cover changes and its driving factors in a fire-prone area of southwestern Turkey. J. Environ. Manag. 2017, 197, 719–731. [Google Scholar] [CrossRef]
  38. Yang, R.; Ren, F.; Xu, W.; Ma, X.; Zhang, H.; He, W. China’s ecosystem service value in 1992–2018: Pattern and anthropogenic driving factors detection using Bayesian spatiotemporal hierarchy model. J. Environ. Manag. 2022, 302, 114089. [Google Scholar] [CrossRef]
  39. Chen, Y.; Wang, J.; Xiong, N.; Sun, L.; Xu, J. Impacts of land use changes on net primary productivity in urban agglomerations under multi-scenarios simulation. Remote Sens. 2022, 14, 1755. [Google Scholar] [CrossRef]
  40. Liu, C.; Li, W.; Zhu, G.; Zhou, H.; Yan, H.; Xue, P. Land use/land cover changes and their driving factors in the Northeastern Tibetan Plateau based on Geographical Detectors and Google Earth Engine: A case study in Gannan Prefecture. Remote Sens. 2020, 12, 3139. [Google Scholar] [CrossRef]
  41. Ning, C.; Subedi, R.; Hao, L. Land use/cover change, fragmentation, and driving factors in Nepal in the last 25 years. Sustainability 2023, 15, 6957. [Google Scholar] [CrossRef]
  42. Daba, M.H.; You, S. Quantitatively assessing the future land-use/land-cover changes and their driving factors in the upper stream of the Awash River based on the CA–markov model and their implications for water resources management. Sustainability 2022, 14, 1538. [Google Scholar] [CrossRef]
  43. Shafizadeh-Moghadam, H.; Minaei, M.; Feng, Y.; Pontius, R.G., Jr. GlobeLand30 maps show four times larger gross than net land change from 2000 to 2010 in Asia. Int. J. Appl. Earth Obs. 2019, 78, 240–248. [Google Scholar] [CrossRef]
  44. Minaei, M.; Shafizadeh-Moghadam, H.; Tayyebi, A. Spatiotemporal nexus between the pattern of land degradation and land cover dynamics in Iran. Land Degrad. Dev. 2018, 29, 2854–2863. [Google Scholar] [CrossRef]
  45. Song, Y.; Yeung, G.; Zhu, D.; Xu, Y.; Zhang, L. Efficiency of urban land use in China’s resource-based cities, 2000–2018. Land Use Policy 2022, 115, 106009. [Google Scholar] [CrossRef]
  46. Fang, Z.; Ding, T.; Chen, J.; Xue, S.; Zhou, Q.; Wang, Y.; Yang, S. Impacts of land use/land cover changes on ecosystem services in ecologically fragile regions. Sci. Total Environ. 2022, 831, 154967. [Google Scholar] [CrossRef]
  47. Yin, R.S.; Xiang, Q.; Xu, J.T.; Deng, X.Z. Modeling the driving forces of the land use and land cover changes along the Upper Yangtze River of China. Environ. Manag. 2010, 45, 454–465. [Google Scholar] [CrossRef] [PubMed]
  48. Duan, X.; Chen, Y.; Wang, L.; Zheng, G.; Liang, T. The impact of land use and land cover changes on the landscape pattern and ecosystem service value in Sanjiangyuan region of the Qinghai-Tibet Plateau. J. Environ. Manag. 2023, 325, 116539. [Google Scholar] [CrossRef]
  49. Gebrelibanos, T.; Assen, M. Land use/land cover dynamics and their driving forces in the Hirmi watershed and its adjacent agro-ecosystem, highlands of Northern Ethiopia. J. Land Use Sci. 2015, 10, 81–94. [Google Scholar] [CrossRef]
  50. Wang, Z.; Li, X.; Mao, Y.; Li, L.; Wang, X.; Lin, Q. Dynamic simulation of land use change and assessment of carbon storage based on climate change scenarios at the city level: A case study of Bortala, China. Ecol. Indic. 2022, 134, 108499. [Google Scholar] [CrossRef]
  51. Tian, L.; Tao, Y.; Fu, W.; Li, T.; Ren, F.; Li, M. Dynamic simulation of land use/cover change and assessment of forest ecosystem carbon storage under climate change scenarios in Guangdong Province, China. Remote Sens. 2022, 14, 2330. [Google Scholar] [CrossRef]
  52. Yang, Q.; Liu, G.; Casazza, M.; Dumontet, S.; Yang, Z. Ecosystem restoration programs challenges under climate and land use change. Sci. Total Environ. 2022, 807, 150527. [Google Scholar] [CrossRef] [PubMed]
Figure 1. Flowchart of the methodology of this study.
Forests 15 01346 g001
Figure 2. Normalized difference vegetation index (DNVI) of Luochuan county from 1990 to 2020.
Forests 15 01346 g002
Figure 3. Land use change maps of Luochuan county from 1990 to 2020.
Forests 15 01346 g003
Figure 4. Land use area transfer changes in Luochuan county from 1990 to 2020.
Forests 15 01346 g004
Figure 5. Evolution of land use information entropy in Luochuan county from 1990 to 2020. Note: Different lowercase letters indicate a significant difference (p < 0.05) by Fisher’s test following the analysis of variance (ANOVA).
Forests 15 01346 g005
Figure 6. Evolution of land use dominance in Luochuan county from 1990 to 2020. Note: Different lowercase letters indicate a significant difference (p < 0.05) by Fisher’s test following the analysis of variance (ANOVA).
Forests 15 01346 g006aForests 15 01346 g006b
Figure 7. RDA analysis of driving factors of land use change in Luochuan county from 1990 to 2020. MAT: mean annual temperature; MAP: mean annual precipitation; MAE: mean annual evaporation; MWP: mean water vapor pressure.
Forests 15 01346 g007
Table 1. Land use classification system in Luochuan county.
CodeTypeDescriptions
1FarmlandThe land adopted for cultivation, such as mature cultivated land, recreational agricultural land, rotation land, grass field rotation crop land, fruit forest, and economic forest, as well as beach and seashore cultivated for over three years.
2ForestForest land for growing trees.
3ShrublandForest land for growing shrubs.
4GrasslandAll types of grassland under the dominance of growing herbs and coverage above 5%, including grassland and sparse forest grassland in pastoral areas with canopy density below 10%.
5WaterNatural land waters, including water conservancy facilities.
6BarrenlandThe categories of land that are challenging to use or have not been developed in rural areas.
Table 2. Land use area and proportion of Luochuan county from 1990 to 2020.
Item1990200020102020
FarmlandArea (km2)719.93744.95677.76687.40
Proportion (%)39.9141.2937.5738.10
ForestArea (km2)490.09502.37596.14638.70
Proportion (%)27.1727.8533.0535.40
ShrublandArea (km2)5.117.963.521.91
Proportion (%)0.280.440.200.11
GrasslandArea (km2)583.58541.66516.64460.12
Proportion (%)32.3530.0328.6425.51
WaterArea (km2)2.802.132.091.97
Proportion (%)0.160.120.120.11
BarrenlandArea (km2)2.504.937.8413.90
Proportion (%)0.140.270.430.77
Table 3. Driving factor system of land use change in Luochuan county.
ItemDriving Factors
Natural factorsMAT
MAP
MAE
MWP
Human factorsTotal Population
GDP
Agricultural production
Forest production
MAT: mean annual temperature; MAP: mean annual precipitation; MAE: mean annual evaporation; MWP: mean water vapor pressure.
Table 4. Grey relation analysis of driving factors of land use change.
ItemNatural FactorsHuman Factors
MATMAPMAEMWPTotal PopulationGDPAgricultural ProductionForest
Production
Farmland changeAbsolute relevance0.740.630.710.640.830.730.770.76
Relative relevance0.750.670.680.630.780.790.670.64
Total relevance0.860.780.830.730.920.910.830.83
Forest changeAbsolute relevance0.720.640.720.630.820.890.700.72
Relative relevance0.760.760.740.640.860.850.680.68
Total relevance0.860.860.850.740.950.920.820.76
Shrubland changeAbsolute relevance0.750.720.730.690.840.680.720.75
Relative relevance0.760.750.790.7650.850.760.740.71
Total relevance0.860.880.840.720.760.710.830.83
Grassland changeAbsolute relevance0.710.690.710.610.820.820.760.74
Relative relevance0.700.660.840.640.790.760.800.80
Total relevance0.830.850.880.710.910.870.850.89
Water changeAbsolute relevance0.710.710.730.630.780.790.730.71
Relative relevance0.720.720.750.650.870.820.750.76
Total relevance0.890.870.830.710.810.820.860.86
Barrenland changeAbsolute relevance0.700.660.710.620.830.840.750.72
Relative relevance0.680.670.790.650.770.760.820.76
Total relevance0.760.840.840.750.940.930.830.82
MAT: mean annual temperature; MAP: mean annual precipitation; MAE: mean annual evaporation; MWP: mean water vapor pressure.
Table 5. Parameter estimates of regression model in Luochuan county from 1990 to 2020.
ItemDependent Variable YInterceptIndependent Variable XR2Fp Value
Natural Factor X1Human Factor X2
1990–2000Y (farmland → forest)0.150.12 (B) **-0.6416.50.003
Y (farmland → shrubland)0.421.32 (A) *-0.639.40.04
Y (farmland → grassland)0.080.76 (B) **-0.7311.20.005
2000–2010Y (farmland → forest)0.450.43 (B)0.74 (E) **0.7623.20.002
Y (farmland→shrub)1.45-0.75 (E) **0.7819.80.005
Y (farmland → grassland)0.78-0.86 (E) **0.7516.50.004
2010–2020Y (farmland → forest)1.21-0.42 (G) **0.6521.40.008
Y (farmland→shrub)0.96-0.78 (G) **0.7615.60.007
Y (farmland → grassland)1.140.34 (B) *0.81 (E) **0.689.30.005
Note: “*” indicates p < 0.05; “**” indicates p < 0.01. A-MAT; B-MAP; C-MAE; D-MWP; E-total population; F-GDP; G-agricultural production; H-forest production.
Disclaimer/Publisher’s Note: The statements, opinions and data contained in all publications are solely those of the individual author(s) and contributor(s) and not of MDPI and/or the editor(s). MDPI and/or the editor(s) disclaim responsibility for any injury to people or property resulting from any ideas, methods, instructions or products referred to in the content.

