Article

Applying Specific Habitat Indicators to Study Asteraceae Species Diversity Patterns in Mountainous Area of Beijing, China

1
School of Soil and Water Conservation, Beijing Forestry University, Beijing 100083, China
2
General Forestry Station of Beijing Municipality, Beijing 100029, China
*
Author to whom correspondence should be addressed.
Forests 2024, 15(8), 1348; https://doi.org/10.3390/f15081348
Submission received: 24 June 2024 / Revised: 30 July 2024 / Accepted: 31 July 2024 / Published: 2 August 2024
(This article belongs to the Section Forest Biodiversity)

Abstract

:
The distribution pattern and influencing factors of specific species diversity play a crucial role in decision-making for biodiversity conservation. Identifying suitable regional habitat indicators to assess specific species diversity patterns is a global focus topic. A total of 112 sample plots were surveyed to investigate the relationship between Asteraceae species diversity and topography, soil nutrients, and stand factors, using a Structural Equation Model (SEM). Additionally, the Maxent model was utilized to predict the distribution pattern of Asteraceae species diversity in response to specific habitat factors. The findings revealed that soil nutrients, topography, and canopy closure had different impacts on Asteraceae species diversity, with soil nutrients showing the highest relative coefficient, followed by topography and canopy closure. The elevation and slope gradient were identified as direct and indirect influences on Asteraceae species diversity. The contribution rate of potential environmental variables on the Asteraceae species diversity was ranked as follows: STN (29.7%) > SOM (28.5%) > slope (8.5%) > Ele (8.1%). Asteraceae species diversity was found to be abundant in the locations with SOM (>27 g/kg), STN (>1.8 g/kg), Ele (165–333 m), and slopes (5–12 degrees). Soil nutrient content serves as a key indicator for assessing the abundance of Asteraceae species diversity and should be considered in biodiversity conservation.

1. Introduction

The Asteraceae family, holding great economic and medicinal importance, is the predominant family of angiosperms [1]. These plants are known for their resilience and ability to thrive in harsh conditions, playing a vital role in maintaining ecosystem stability [2]. With the intensification of global climate change and the impact of human activities, Asteraceae community ecosystems have been sharply reduced and their protection is facing unprecedented difficulties [3]. Therefore, analyzing the effects of site and stand factors on Asteraceae plant diversity can provide an important theoretical basis for guiding biodiversity conservation [4,5].
The presence and distribution of Asteraceae species are primarily influenced by various factors such as climate, soil nutrients, topography, stand density, and canopy closure [6,7]. Temperature and precipitation play a fundamental role in determining the growth and distribution of understory species on a large scale [8,9,10,11]. From the aspect of stand scale, the site condition has a decisive bearing on the growth and distribution of plant diversity [12,13,14]. Factors like altitude and slope gradient affect the water and nutrient requirements of these plants [15,16]. Soil nutrients, particularly nitrogen, organic matter, and phosphorus, also significantly affect the growth of plants [17,18]. In the current research on understory species diversity, which mainly concerns the effects of environmental factors and stand structure on species composition and diversity [19,20,21], the studies have seldom considered Asteraceae plant diversity; however, existing studies have indicated that Asteraceae plants are strong indicators of site conditions [22].
The majority of the research utilized statistical analysis techniques to examine the correlation between understory plant diversity and environmental factors; however, these methods hardly determine the suitable distribution range of plant diversity accurately, despite a higher abundance diversity index [23,24,25]. Therefore, there is a crucial need for finding a suitable approach to quantify the range of plant diversity. Maximum entropy models offer significant advantages in forecasting species distribution and have become widely utilized in species prediction [26,27,28].
The main goals of our research are to (1) analyze the primary habitat factors that influence Asteraceae species diversity, (2) determine the direct and indirect effects of habitat factors on Asteraceae species diversity, and (3) predict the distribution range of abundant Asteraceae species diversity.

2. Materials and Methods
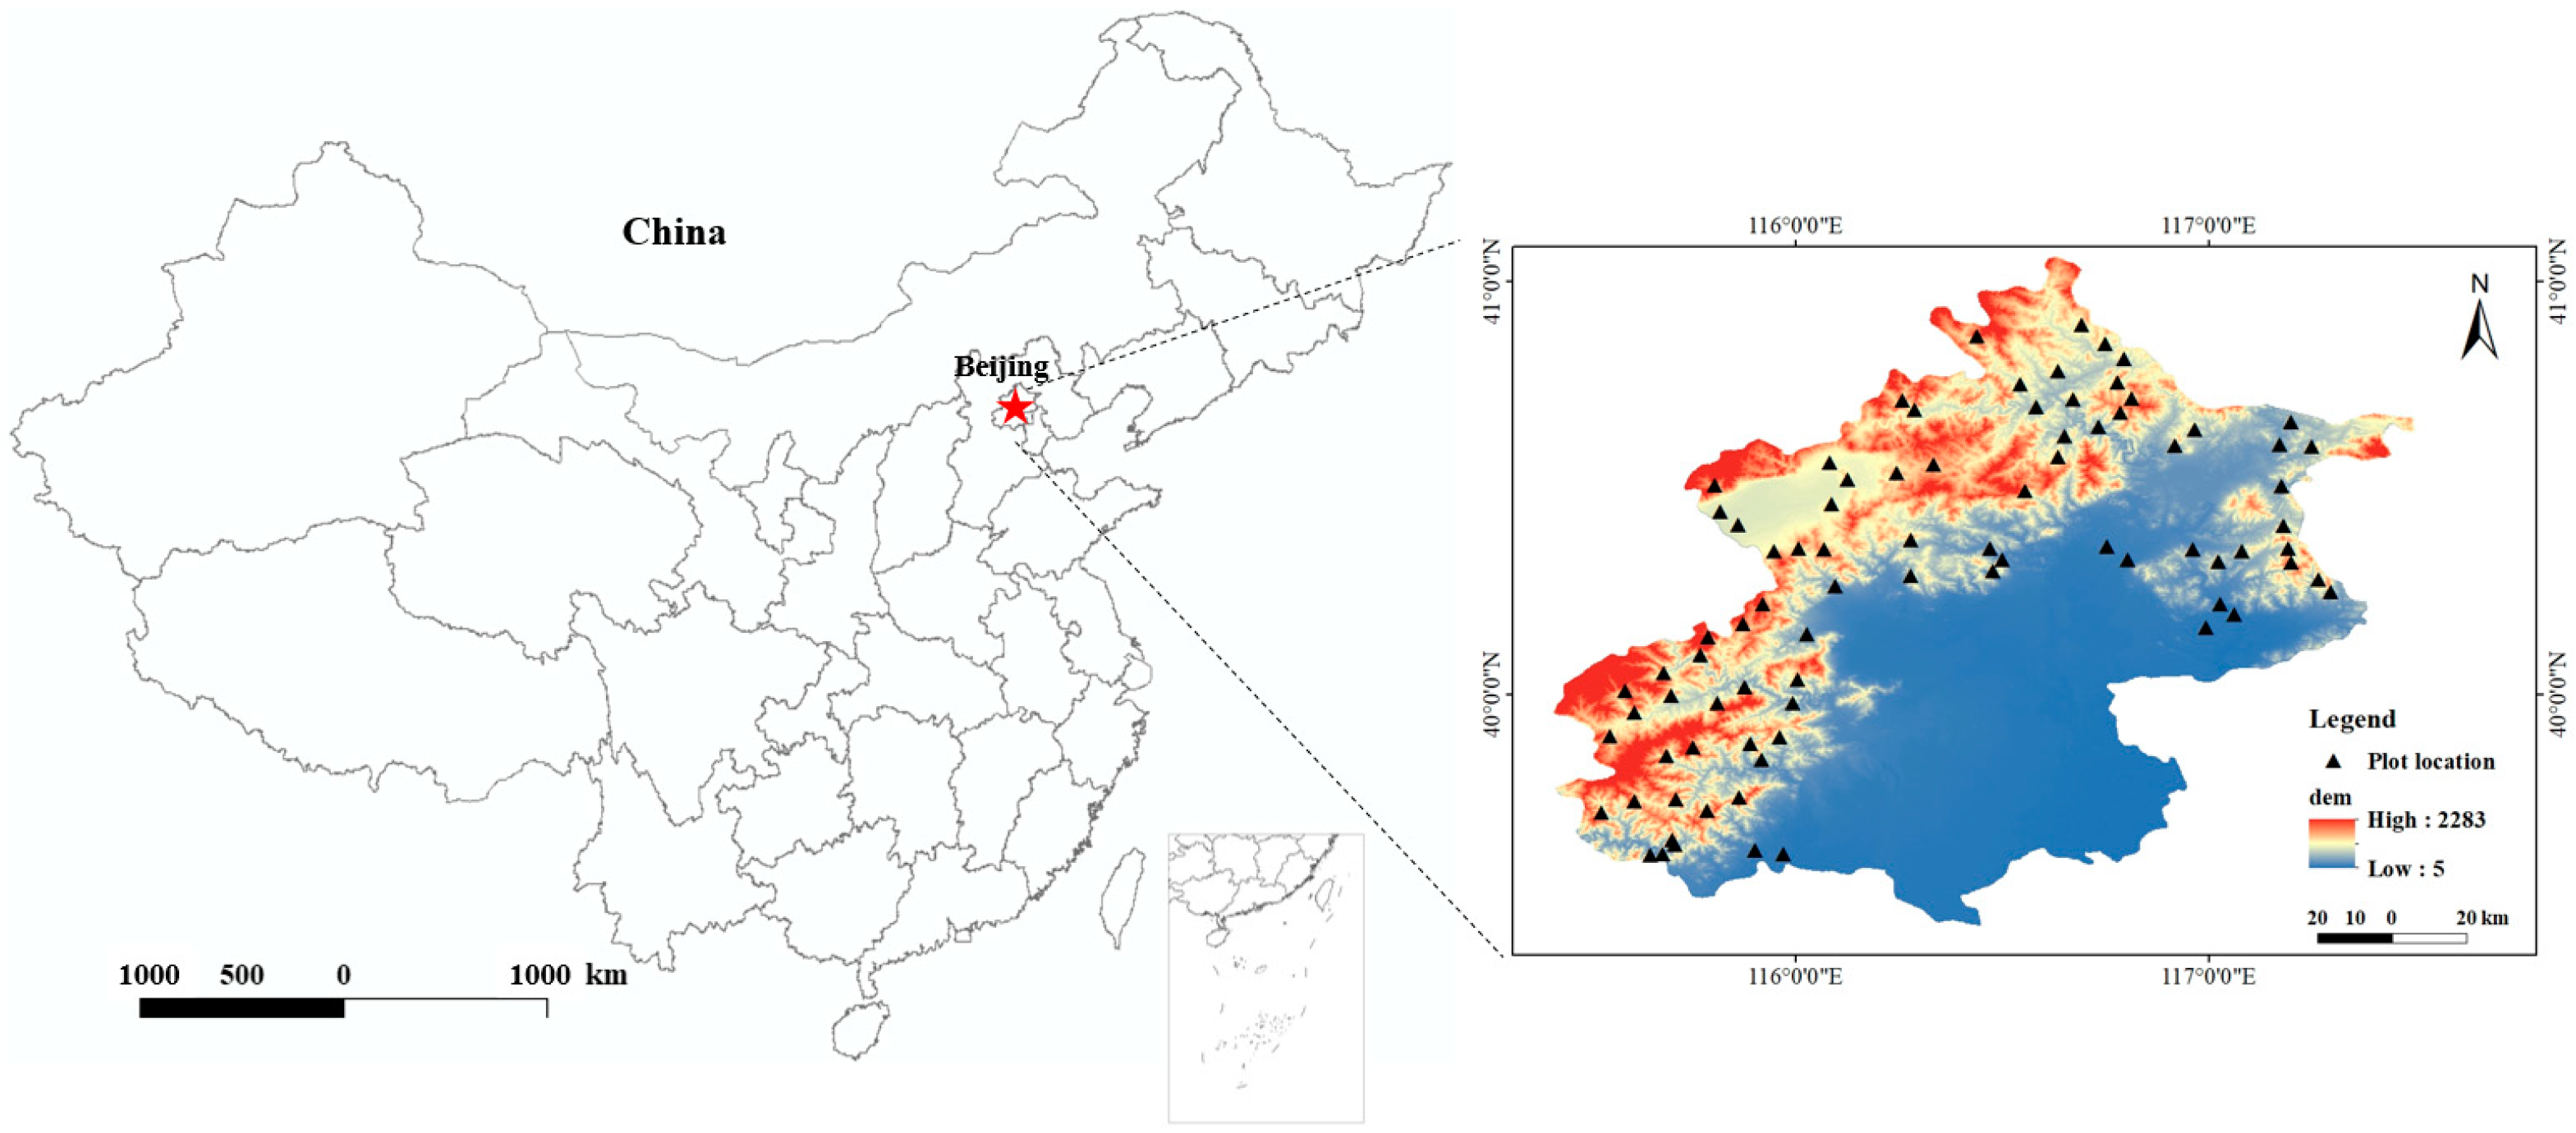
2.1. Study Sites

The Beijing–Tianjin Sandstorm Source Phase II Forestry Project in Beijing is mainly distributed in its mountainous areas (39°12′–41°05′ N, 115°25′–117°30′ E) and covers about 10,400 km2. The areas belong to a warm temperate semi-humid monsoon climate, with an average annual precipitation from 470 to 660 mm and an average yearly temperature from 11 to 13 °C. Land use types consist of woodland and grassland. Zonal soils are mainly composed of meadow soil, mountainous brown forest soil, and mountainous cinnamon soil.

2.2. Field Investigation and Soil Sampling

Based on the Asteraceae species distribution data provided by existing studies [1], a total of 112 representative Platycladus orientalis plantations’ sample sites (20 m × 20 m) were selected for investigation (as shown in Figure 1). The following variables were measured at the sample plots: stand density, canopy closure, elevation, aspect, slope, and geographic coordinates [15]. Ten soil samples were randomly collected from the 0–10 cm soil layer using a standard soil sampler with a 100 cm3 capacity, with the aim of measuring the basic physical and chemical properties of the soil [29].
We randomly laid out ten 1 m × 1 m samples in each standard sample plot [22], and the names of the plants and the number of plants of each species in each sample were recorded for calculating the understory diversity; the environmental and stand factors are shown in Table 1.

2.3. Data Analysis and Modeling

2.3.1. Asteraceae Diversity Index Calculation

In this study, we calculated a total of four Asteraceae species diversity indices. The formula for calculating diversity is as follows:
Shannon–Wiener index  H = i = 1 s ln P i × P i
Simpson   index   S D = 1 i = 1 s p i 2
Margalef   index   H = ( S 1 ) / ln N
Gleason   index   D = S ln A
where S is the total number of understory herbaceous species; pi is the ratio of the number of individuals of the ith species to the total number of individuals of all species; N is the total number of herbaceous individuals in the understory.

2.3.2. Maxent Model

The maximum entropy model is a spatial distribution model of the species at the geographical scale [30]. It is based on the maximum entropy theory, and is applied to measure the maximum likelihood of a sample [31]. The objective of the model is to infer the location information through incomplete information and to identify the conditions under which the probability reaches its maximum [32]. The accuracy of the model was verified by using the receiver operating characteristic curve (ROC), and the accuracy was judged by calculating the area (AUC) enclosed by the curve and the abscissa [33,34]. Two sets of data are required for the operation of the maximum entropy model: one is the geographical distribution data of Asteraceae species, which are expressed by the latitude and longitude of each species; the second is the raster data of environmental factors in the study area. The elevation of Beijing is derived from the 30 m × 30 m digital elevation model (DEM), the aspect and slope gradient are extracted from the DEM (http://westdc.westgis.ac.cn, accessed on 12 March 2024), and the soil nutrients data of the study sites are modified by the measured soil nutrients data by means of Kriging interpolation.

3. Results

3.1. The Relationship between the Asteraceae Species Diversity Indices

The correlation of these diversity indices is shown in Figure 2. The results demonstrate that the Shannon–Wiener index had the highest correlation with the other three indices, with an R2 of 0.87, 0.74, and 0.70. After a comprehensive comparison of the correlations of these indices, we chose the Shannon–Wiener index to measure the overall level of Asteraceae species diversity.

3.2. Effects of Environmental Factors on Asteraceae Species Diversity

The direct and indirect effects of elevation, slope, and soil nutrient factors on Asteraceae diversity are shown in Figure 3. The soil nutrients had a significant effect on the Asteraceae species diversity (p < 0.01), and the elevation and slope significantly affected the Asteraceae species diversity (p < 0.05). The standardized effects of these factors on the Asteraceae species diversity are shown in Table 2. The direct impact coefficients were soil nutrients (0.54), slope (−0.21), and elevation (−0.17); the indirect impact coefficients were the elevation (−0.06) and slope (−0.02). Overall, soil nutrients were the dominant factors affecting Asteraceae species diversity, with the direct effects being the primary mechanism that dictated diversity. The elevation and slope also had important impacts on Asteraceae species diversity.

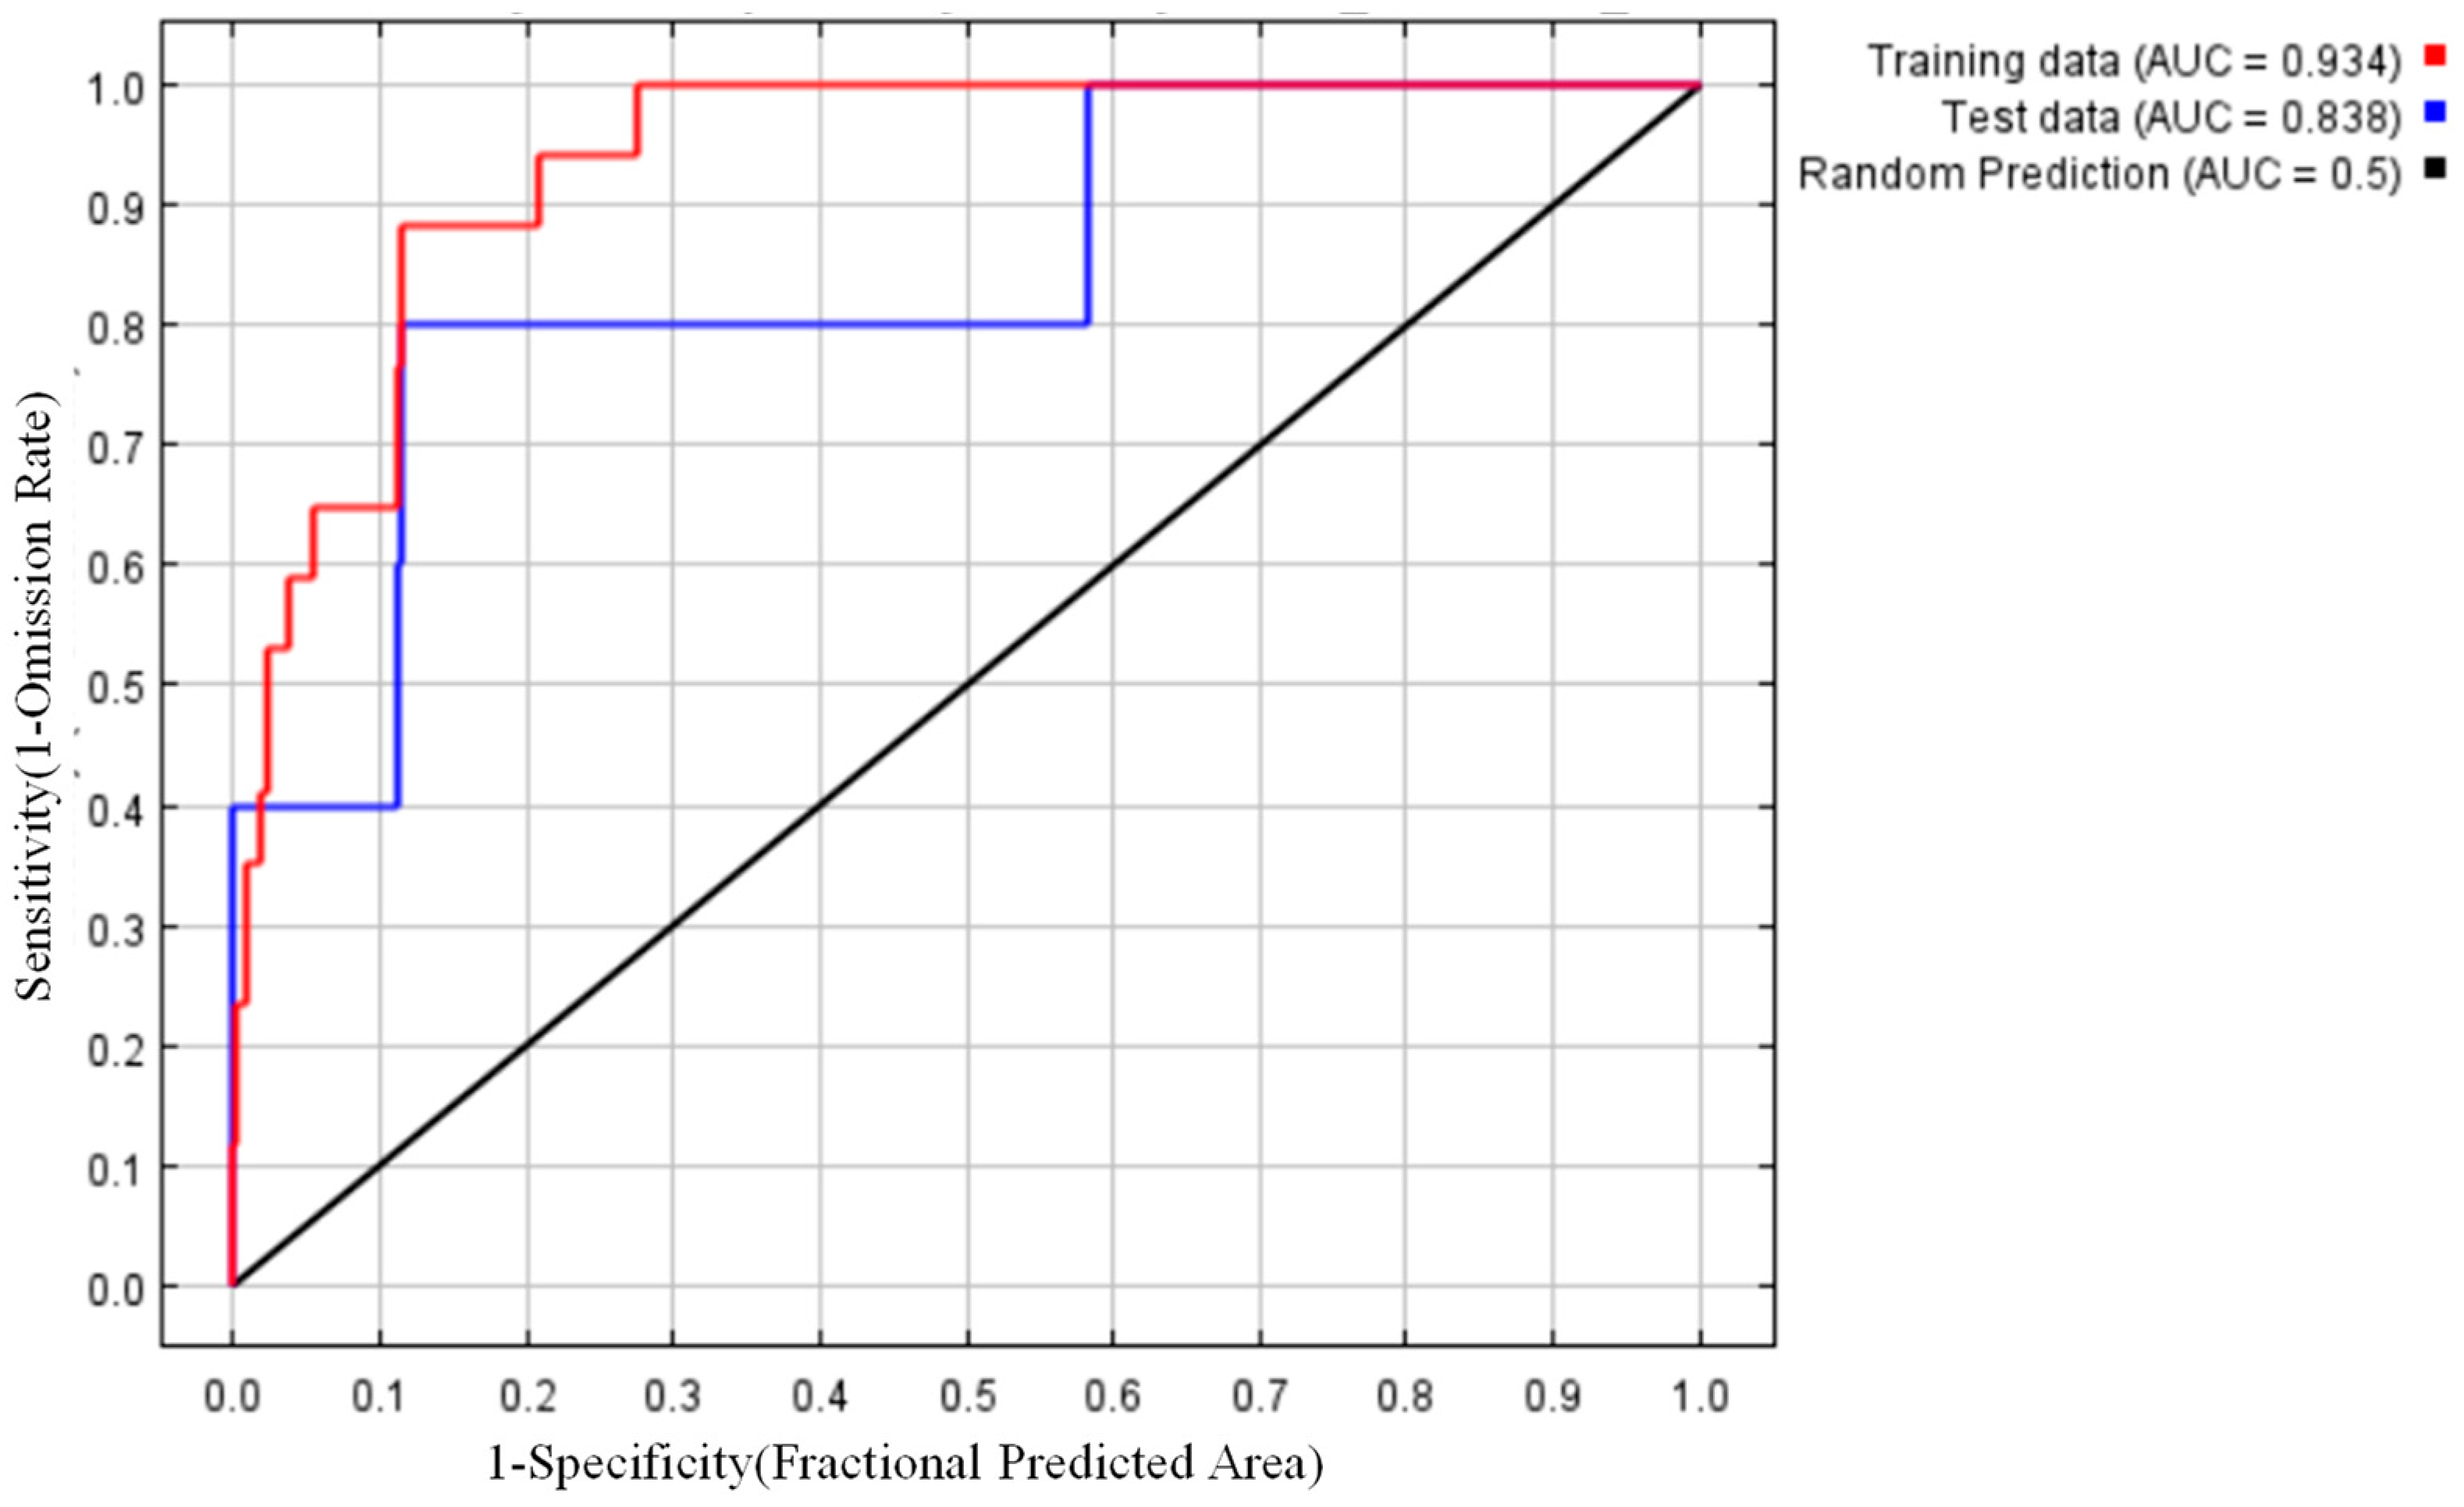
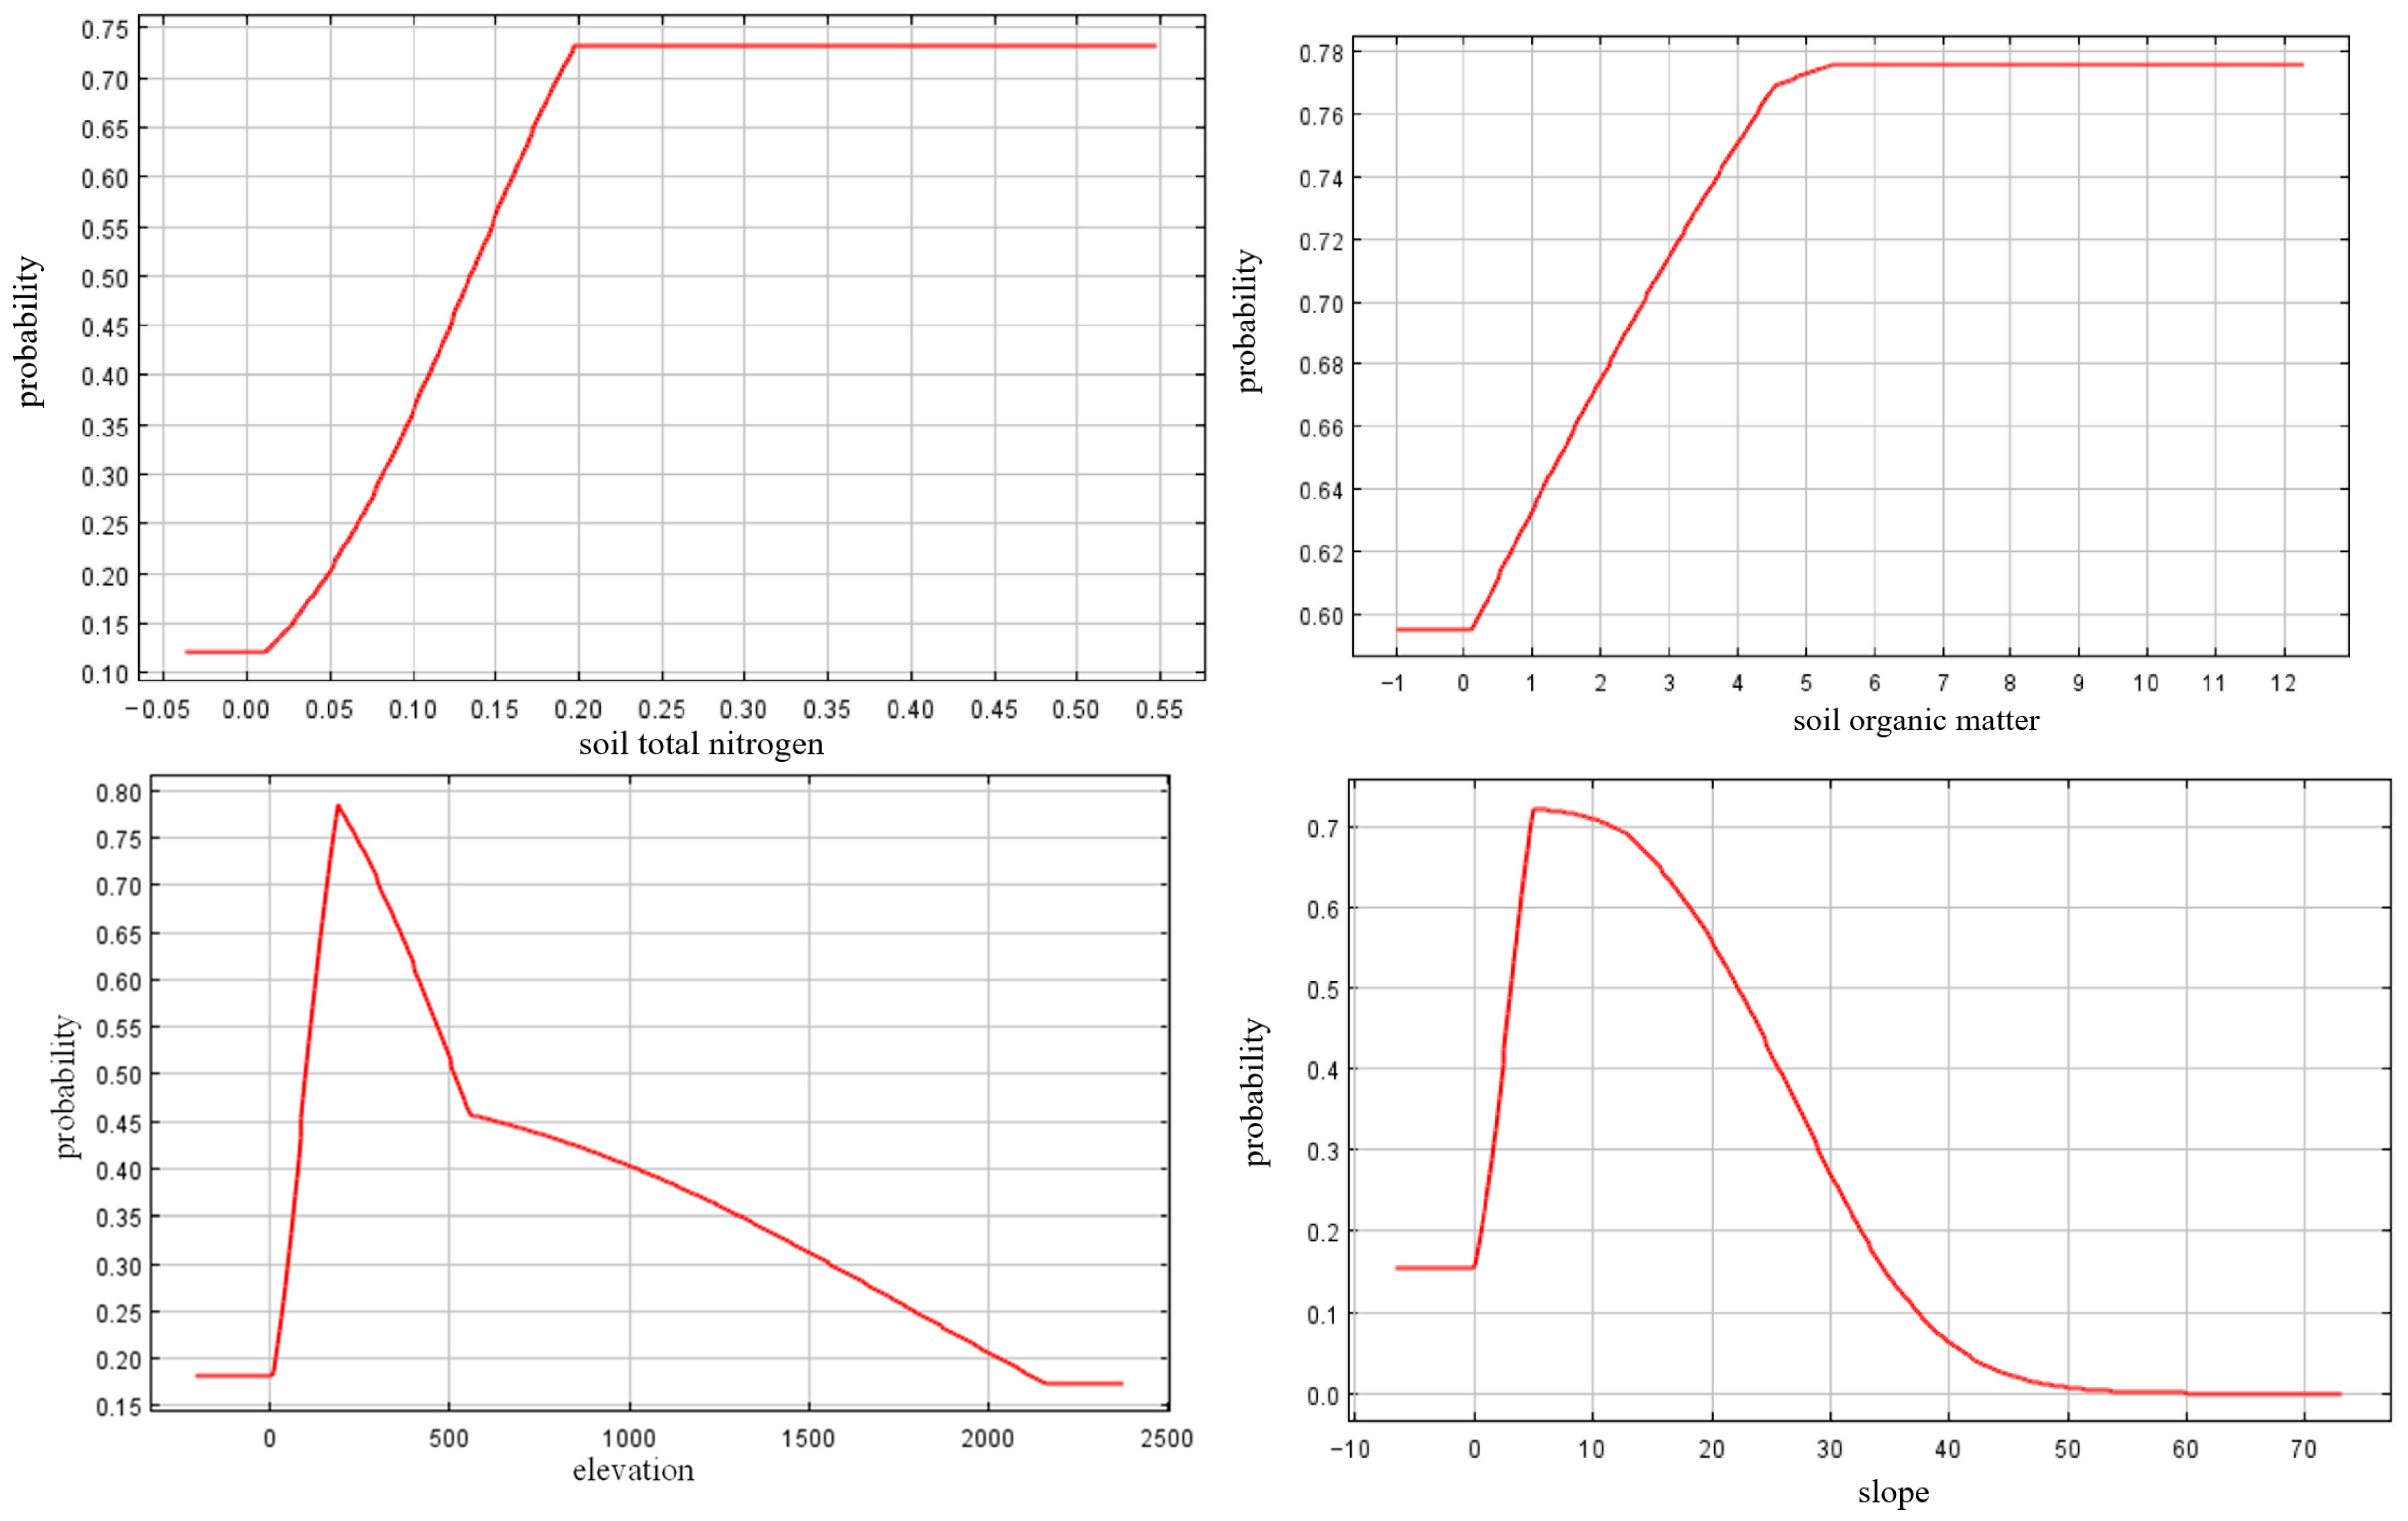
3.3. Maximum Entropy Model Results

In this study, the Shannon–Wiener diversity index ranged from 0.27 to 2.01, the average value was 1.01, a screening value equal to the average Asteraceae species diversity at the sample sites was determined, and those values beyond this screening value were considered in the sample plots with abundant Asteraceae species diversity. The ROC curves as shown in Figure 4.
The contribution rate of potential environmental variables on the Asteraceae species diversity was ranked as follows: soil total nitrogen (29.7%) > soil organic matter (28.5%) > slope (8.5%) > elevation (8.1%), and the cumulative contribution rate was 74.8% (Table 3). The contribution rate of other environmental variables was between 3.5% and 4.9%, which had little impact on Asteraceae species diversity. The above analysis shows that the main environmental variables affecting the Asteraceae species diversity were soil nutrient factors (soil organic matter and soil total nitrogen), of which the cumulative contribution rate was 58.2%. Taking the probability of existence greater than 0.7 as the threshold value, the contribution rate of STN was the highest among the soil factors, reaching 29.7%; when the STN was greater than 1.8 g/kg, the probability of existence was greater than 0.7. The contribution rate of SOM in the soil variables ranked second, which was 28.5%. It can be seen from Figure 5 that when the SOM was greater than 27 g/kg, the probability of existence was greater than 0.7. Obviously, this was suitable for the distribution of the abundant Asteraceae species diversity level when the total nitrogen content of soil was more than 1.8 g/kg. Moreover, the probability distribution remains the largest when it reaches 2 g/kg. When the elevation ranges from 165 to 333 m, the probability of existence was greater than 0.7 (Figure 5). The probability of existence reaches the peak at about 230 m, indicating that low mountain areas were the most suitable for the Asteraceae species growth; when the elevation was less than 100 m or more than 500 m, the probability of existence decreases, indicating that these two elevations were not conducive to their distribution. The contribution rate of the slope degree to Asteraceae diversity was 8.1%; when the slope range was 5 to 12°, the probability of existence was greater than 0.7 (Figure 5). The probability of existence reached the peak value when the slope degree was about 8 degrees, indicating that the gentle slope area was most suitable for their distribution; when the slope degree was less than 2 degrees or more than 22 degrees, there was a rapid decline in the probability, indicating that the two slopes were not conducive to their distribution.

4. Discussion

This study found that the soil organic matter and soil total nitrogen content were the dominant soil factors affecting the Asteraceae species diversity, with a cumulative contribution rate of 58.4%. The main reason was that soil organic matter contains various nutrients required for plant growth, which are some of the main sources of vegetation nutrition and can promote the growth and development of plants [35,36]. A large amount of nitrogen is necessary for plant growth; its abundance, shortage, and supply directly affect the growth level of plants [37,38]. When the soil organic matter content was less than 27 g/kg and the total nitrogen content was less than 1.8 g/kg, the probability of the existence of abundant Asteraceae species diversity decreased rapidly. An increase in soil nutrients such as soil organic matter and nitrogen will increase the competition to occupy ecological niches, which promotes the growth of Asteraceae plants [39,40,41]. Therefore, for the land with a soil organic matter content less than 27 g/kg and a soil total nitrogen content less than 1.8 g/kg in the Beijing Mountain area, a reasonable application of organic fertilizer and nitrogen fertilizer is conducive to increasing the Asteraceae species diversity.
Topographic factors such as the altitude and slope have a vital influence on species distribution, mainly because they are the fundamental factors affecting energy and material variation at the site scale [42,43]. The present study reveals that topographic factors, specifically elevation and slope, exert an impact on the diversity of Asteraceae species, accounting for a cumulative contribution rate of 16.6%. Soil nutrient conditions are better at medium altitudes and on gentle slopes, which provide favorable conditions for the growth and reproduction of Asteraceae plants [44,45]. Within the forest, canopy closure determines the effective light intensity, being able to redistribute light, heat, water, fertilizer, and other resources, thus directly affecting understory herbaceous diversity [46]. However, the canopy close variable has no significant effect on the Asteraceae species diversity in this study.

5. Conclusions

Asteraceae plants have a rich species diversity and strong environmental adaptability; they play a key role in maintaining ecological balance in the mountainous areas of Beijing. However, the response of Asteraceae species diversity to specific habitat factors has been rarely explored. In this study, we utilized a structural equation model and a maximum entropy model to assess the effects of habitat factors on Asteraceae diversity. The results show that soil organic matter and total nitrogen dominated the Asteraceae species diversity, while slope and elevation factors had a significant effect on Asteraceae plants diversity. The effects of canopy closure and stand density on the diversity of Asteraceae were not significant. Asteraceae species diversity was abundant at the location with SOM (>27 g/kg), STN (>1.8 g/kg), Ele (165–333 m), and slopes (5–12 degrees). Soil organic matter and total nitrogen content serve as key indicators for assessing the abundance of Asteraceae species diversity. Our study demonstrated that it is advisable to apply organic fertilizer and nitrogen fertilizer to improve the Asteraceae species diversity in the sites where soil organic matter content and total nitrogen content are less than 27 g/kg and 1.5 g/kg respectively.

Author Contributions

Conceptualization, L.Z. and S.Q.; methodology, L.Z. and. T.Z.; software, L.Z.; validation, L.Z., S.Q. and P.L.; formal analysis, L.Z., P.L. and X.W.; investigation, L.Z., P.L., T.Z. and X.W.; resources, S.Q. and X.W.; data curation, L.Z. and P.L.; writing—original draft preparation, L.Z.; writing—review and editing, S.Q. and T.Z.; visualization, S.Q.; supervision, S.Q.; project administration, X.W.; funding acquisition, S.Q. and X.W. All authors have read and agreed to the published version of the manuscript.

Funding

This research was funded by the sandification combating program for areas in the vicinity of Beijing and Tianjin, [grant number: 2020−SYZ−01−17JC05].

Data Availability Statement

Data are contained within the article.

Acknowledgments

The authors are thankful to the Beijing Municipal Forestry and Parks Bureau for providing forestry engineering design data.

Conflicts of Interest

The authors declare no conflicts of interest.

References

  1. Luo, C.J. Studies on Plant Diversity in Mountain Areas in Beijing. Master’s Thesis, Beijing Forestry University, Beijing, China, June 2005. [Google Scholar]
  2. Pan, Y.Z.; Chen, L.; Chen, J.Y.; Zhao, D.; Ye, D.L.; Wang, Z.H.; Wang, H.Y. Effects of Nitrogen and Phosphorus Addition on Medicinal Plant Community Characteristics in the Hulunbuir Meadow Steppe. Chin. J. Grassl. 2024, 6, 117–125. (In Chinese) [Google Scholar]
  3. Ali, F.; Khan, N.; Rahmonov, O. Ecosystem Services and Linkages of Naturally Managed Monotheca buxifolia (Falc.) A. DC. Forests with Local Communities across Contiguous Mountainous Ranges in Pakistan. Biology 2022, 11, 1469. [Google Scholar] [CrossRef] [PubMed]
  4. Bilal, A.; Wang, Y.; Jia, H.; Liu, Y.; Eve, B.; Zhang, K. Optimizing stand structure for trade-offs between overstory timber production and understory plant diversity: A case-study of a larch plantation in northwest China. Land Degrad. Dev. 2018, 29, 2998–3008. [Google Scholar]
  5. Makse, H.A.; Lucini, F.A.; Morone, F.; Tomassone, M.S. Diversity increases the stability of ecosystems. PLoS ONE 2020, 15, e0228692. [Google Scholar]
  6. Du, Z.Z.; Yan, P.; Huang, G.; Ren, S.S. Biodiversity of Asteraceae from Oasis and Desert of Shihezi. J. Northwest Bot. 2013, 33, 1034–1040. (In Chinese) [Google Scholar]
  7. Wu, B.C.; Zhou, L.J.; Qi, S.; Jin, M.L.; Hu, J.; Lu, J.S. Effect of habitat factors on the understory plant diversity of Platycladus orientalis plantations in Beijing mountainous areas based on maxent model. Ecol. Indic. 2021, 129, 107917. [Google Scholar] [CrossRef]
  8. Wu, D.H.; Zhao, X.; Liang, S.L.; Zhou, T.; Huang, K.C.; Tang, B.J.; Zhao, W.Q. Time-lag effects of global vegetation responses to climate change. Glob. Chang. Biol. 2015, 21, 3520–3531. [Google Scholar] [CrossRef] [PubMed]
  9. Li, T.F.; Kamran, M.; Chang, S.H.; Peng, Z.H.; Wang, Z.F.; Ran, L.J.; Hou, F.J. Climate-soil interactions improve the stability of grassland ecosystem by driving alpine plant diversity. Ecol. Indic. 2022, 141, 109002. [Google Scholar] [CrossRef]
  10. Mi, J.; Ou, J.; Liu, H.; Shi, J.; Chen, D.M.; Bai, Y.F. The loss of plant species diversity dominated by temperature promotes local productivity in the steppe of eastern Inner Mongolia. Ecol. Indic. 2022, 139, 108953. [Google Scholar] [CrossRef]
  11. Sabatini, F.; Jiménez-Alfaro, B.; Burrascano, S.; Blasi, C. Drivers of herb-layer species diversity in two unmanaged temperate forests in northern Spain. Community Ecol. 2014, 15, 147–157. [Google Scholar] [CrossRef]
  12. Yang, Y.F.; Xu, B.; Yu, Q.Q.; Fan, L.K.; Guo, T.T.; Fu, D.S.; Chen, H.; Yan, H.; Shao, F.; Li, X.P. Distribution Pattern and Factors Influencing Spontaneous Plant Diversity in Different Wetland Habitats. Forests 2022, 13, 1678. [Google Scholar] [CrossRef]
  13. Zilliox, C.; Gosselin, F. Tree species diversity and abundance as indicators of understory diversity in French mountain forests: Variations of the relationship in geographical and ecological space. For. Ecol. Manag. 2014, 321, 105–116. [Google Scholar] [CrossRef]
  14. Zhang, Q.P.; Fang, R.Y.; Deng, C.Y.; Zhao, H.J.; Shen, M.H.; Wang, Q. Slope aspect effects on plant community characteristics and soil properties of alpine meadows on Eastern Qinghai-Tibetan plateau. Ecol. Indic. 2022, 143, 109400. [Google Scholar] [CrossRef]
  15. Zhang, L.; Qi, S.; Zhou, P.; Wu, B.C.; Zhang, D.; Cui, R.R.; Huang, X.; Ma, N. Influencing factors on herb diversity of Platycladus platycladus understory in Beijing Mountain area. J. Grassl. Sci. 2022, 30, 1794–1801. (In Chinese) [Google Scholar]
  16. Zhang, L.; Qi, S.; Li, P.; Zhou, P. Influence of stand and environmental factors on forest productivity of Platycladus orientalis plantations in Beijing’s mountainous areas. Ecol. Indic. 2024, 158, 111385. [Google Scholar] [CrossRef]
  17. He, K.J.; Huang, Y.M.; Qi, Y.; Sheng, Z.L.; Chen, H.Y. Effects of nitrogen addition on vegetation and soil and its linkages to plant diversity and productivity in a semi-arid steppe. Sci. Total Environ. 2021, 778, 146299. [Google Scholar] [CrossRef]
  18. Dong, D.; Ashfaq, A.; Huang, X.; Teng, M.J.; Wu, C.G.; Zhou, Z.X.; Liu, Y. Soil Available Phosphorus Loss Caused by Periodical Understory Management Reduce Understory Plant Diversity in a Northern Subtropical Pinus massoniana Plantation Chronosequence. Forests 2020, 11, 231. [Google Scholar] [CrossRef]
  19. Cui, R.R.; Qi, S.; Wu, B.C.; Zhang, D.; Zhang, L.; Zhou, P.; Ma, N.; Huang, X. The Influence of Stand Structure on Understory Herbaceous Plants Species Diversity of Platycladus orientalis Plantations in Beijing, China. Forests 2022, 13, 1921. [Google Scholar] [CrossRef]
  20. Wei, L.; Archaux, F.; Hu, F.L.; Bilger, I.; Gosselin, F. Stand attributes or soil micro-environment exert greater influence than management type on understory plant diversity in even-aged oak high forests. For. Ecol. Manag. 2020, 460, 117897. [Google Scholar] [CrossRef]
  21. Reza, E.; Moslem, Y.; Mosleh, A.A. Effect of different shrub species on their sub-canopy soil and vegetation properties in semiarid regions. Land Degrad. Dev. 2021, 32, 3236–3247. [Google Scholar]
  22. Zhang, L.; Ning, C.D.; Qi, S.; Hu, Y.S.; Li, P.; Wei, X.Y.; Wang, X.Y. Understory specific species appearances indicate the soil improvement of low-function Platycladus orientalis forest in Beijing’s mountainous areas. Ecol. Indic. 2024, 162, 111996. [Google Scholar] [CrossRef]
  23. Vanhellemont, M.; Baeten, L.; Verheyen, K. Relating changes in understory diversity to environmental drivers in an ancient forest in northern Belgium. Plant Ecol. Evol. 2014, 147, 22–32. [Google Scholar] [CrossRef]
  24. Chen, H.; Du, S.; Huang, H.; Tian, L.Y.; Zhou, H.; Wu, J.Q.; Yu, X.B. Plant diversity in the understory of Eucalyptus plantations on Hainan Island and its response to environmental factors. Front. Ecol. Evol. 2024, 12, 1366094. [Google Scholar] [CrossRef]
  25. Cheng, Y.L.; Peng, J.; Gu, Y.J.; Guo, H.Y.; Jiang, T.Y.; Yang, H.B. The Early Effect of Plant Density on Soil Physicochemical Attributes and Bacterial and Understory Plant Diversity in Phoebe zhennan Plantations. Forests 2023, 14, 1612. [Google Scholar] [CrossRef]
  26. Zhao, X.N.; Zheng, Y.T.; Wei, W. Habitat Suitability Evaluation of Different Forest Species in Lvliang Mountain by Combining Prior Knowledge and maxent Model. Forests 2023, 14, 438. [Google Scholar] [CrossRef]
  27. Shi, X.D.; Wang, J.W.; Zhang, L.; Chen, S.X.; Zhao, A.L.; Ning, X.D.; Fan, G.R.; Wu, N.S.; Zhang, L.; Wang., Z.D. Prediction of the potentially suitable areas of Litsea cubeba in China based on future climate change using the optimized Maxent model. Ecol. Indic. 2023, 148, 110093. [Google Scholar] [CrossRef]
  28. Liu, J.M.; Xu, Y.Y.; Sun, C.W.; Wang, X.; Zheng, Y.L.; Shi, S.L.; Jia, L.M. Distinct ecological habits and habitat responses to future climate change in three east and southeast Asian Sapindus species. For. Ecol. Manag. 2022, 507, 119982. [Google Scholar] [CrossRef]
  29. LY/T 2250-2014; China National Forestry and Grassland Administration. Technical Regulations for Forest Soil Survey; Standards Press of China: Beijing, China, 2014.
  30. Hebbar, K.B.; Abhin, P.S.; Sanjo, J.V.; Neethu, P.; Santhosh, A.; Shil, S.; Prasad, P.V.V. Predicting the potential suitable climate for coconut (Cocos nucifera L.) cultivation in India under climate change scenarios using the maxent model. Plants 2022, 11, 731. [Google Scholar] [CrossRef] [PubMed]
  31. Zhao, G.H.; Cui, X.Y.; Sun, J.T.; Li, T.T.; Wang, Q.; Ye, X.Z.; Fan, B.G. Analysis of the distribution pattern of Chinese ziziphus jujuba under climate change based on optimized biomed and maxent models. Ecol. Indic. 2021, 132, 108256. [Google Scholar] [CrossRef]
  32. Zhou, H.T.; Na, X.D.; Li, L.; Ning, X.L.; Bai, Y.R.; Wu, X.D.; Zang, S.Y. Suitability evaluation of the rural settlements in a farming-pastoral ecotone area based on machine learning maximum entropy. Ecol. Indic. 2023, 154, 110794. [Google Scholar] [CrossRef]
  33. Zhang, Y.F.; Chen, S.T.; Gao, Y.; Yang, L.; Yu, H. Prediction of global potential suitable habitats of nicotiana alata link et otto based on Maxent model. Sci. Rep. 2023, 13, 4851. [Google Scholar] [CrossRef] [PubMed]
  34. Yang, S.L.; Wang, H.M.; Tong, J.P.; Bai, Y.; Alatalo, J.M.; Liu, G.; Fang, Z.; Zhang, F. Impacts of environment and human activity on grid-scale land cropping suitability and optimization of planting structure, measured based on the Maxent model. Sci. Total Environ. 2022, 836, 155356. [Google Scholar] [CrossRef]
  35. Homeier, J.; Leuschner, C. Factors controlling the productivity of tropical and an forests: Climate and soil are more important than tree diversity. Biogeosciences 2021, 18, 1525–1541. [Google Scholar] [CrossRef]
  36. Lin, S.; Li, Y.; Li, Y.H.; Chen, Q.; Wang, Q.L.; He, K.N. Influence of tree size, local forest structure, topography, and soil Resource availability on plantation growth in Qinghai Province, China. Ecol. Indic. 2021, 120, 106957. [Google Scholar] [CrossRef]
  37. Zhang, X.; Li, X.; Ji, X.D.; Zhang, Z.Q.; Zhang, H.S.; Zha, T.G.; Li, J. Elevation and total nitrogen are the critical factors that control the spatial distribution of soil organic carbon content in the shrubland on the Bashang Plateau, China. Catena 2021, 204, 105415. [Google Scholar] [CrossRef]
  38. Wang, Y.T.; Zhang, Y.M.; Wang, L.J.; Jing, X.; Yu, L.; Liu, P. Response of leaf biomass, leaf and soil C: N:P stoichiometry characteristics to different site conditions and forest ages: A case of Pinus Tabuliformis Plantations in the temperate mountainous area of China. Front. Plant Sci. 2022, 13, 1060406. [Google Scholar] [CrossRef] [PubMed]
  39. Xu, H.G.; Qiang, S. Inventory Invasive Alien Species in China; China Environmental Science Press: Beijing, China, 2004. (In Chinese) [Google Scholar]
  40. Tang, S.C.; Wei, C.Q.; Pan, Y.M.; Pu, G.Z. Reproductive adaptability of the invasive weed Parthenium hysterophorus L. under different nitrogen and phosphorus levels. J. Wuhan Bot. Res. 2010, 28, 213–217. (In Chinese) [Google Scholar]
  41. Jia, Y.Y.; Zhang, X.Y.; Yan, J.; Yin, J.L.; Zhang, F.J. Effects of three Asteraceae invasive plants on soil fertility of invaded domain. J. Hebei Univ. 2015, 35, 494–502. (In Chinese) [Google Scholar]
  42. Souza, C.R.; Mariano, R.F.; Pompeu, P.V.; Santos, R.M.; Fontes, M.A. Carbon stock and uptake in the high-elevation tropical montane forests of the threatened Atlantic Forest hotspot: Ecosystem function and effects of elevation variation. Sci. Total Environ. 2023, 882, 163503. [Google Scholar] [CrossRef]
  43. Zu, K.L.; Zhang, C.C.; Chen, F.S.; Shahid, A.; Ghulam, N. Latitudinal gradients of angiosperm plant diversity and phylogenetic structure in China’s nature reserves. Glob. Ecol. Conserv. 2023, 42, e02403. [Google Scholar] [CrossRef]
  44. Chen, S.; Ma, M.H.; Wu, S.J.; Tang, Q.Q.; Wen, Z.F. Topography intensifies variations in the effect of human activities on forest NPP across altitude and slope gradients. Environ. Dev. 2023, 45, 100826. [Google Scholar] [CrossRef]
  45. Zhang, Y.; Wang, J.Z.; Wang, L. The resource distribution and growth status for Playcladus orientalis Plantations in lower mountains of Beijing. For. Resour. Manag. 2011, 6, 73–78. (In Chinese) [Google Scholar]
  46. Wagner, S.; Fischer, H.; Huth, F. Canopy effects on vegetation caused by harvesting and regeneration treatments. Eur. J. For. Res. 2011, 130, 17–40. [Google Scholar] [CrossRef]
Figure 1. Location map of the study area.
Forests 15 01348 g001
Figure 2. Correlation of the four Asteraceae diversity indices.
Forests 15 01348 g002aForests 15 01348 g002b
Figure 3. Effects of elevation, slope closure, and soil nutrient factors on Asteraceae species diversity (CMIN/DF = 1.1, CFI = 0.99, RSMEA = 0.03). Notes: * p < 0.05, ** p < 0.01.
Forests 15 01348 g003
Figure 4. ROC curves.
Forests 15 01348 g004
Figure 5. Response curve of the existence probability of abundant Asteraceae species diversity areas in relation to environmental factors.
Forests 15 01348 g005
Table 1. Environmental and stand factors data of standard plots.
Environmental and Stand FactorsRangesMeanStandard
Deviation
Elevation (m)114–770359.69116.12
Slope (°)3–3918.8110.02
Soil organic matte content (g/kg)13.84–116.5844.6821.35
Soil total nitrogen content (g/kg)0.98–6.582.971.25
Soil total phosphorus content (g/kg)0.24–1.120.570.15
Soil total potassium content (g/kg)9.25–40.7220.256.06
Soil available nitrogen content (mg/kg)91.57–415.24135.3980.62
Soil available phosphorus content (mg/kg)0.09–4.0056.911.59
Soil available potassium content (mg/kg)37.533–444.821.010.34
Stand density (plant·hm−2)500–19751035.18286.71
Canopy closure0.5–0.950.760.11
Table 2. Standardized effects of these factors on the understory Asteraceae diversity.
Impact FactorsDirect EffectIndirect EffectTotal Effect
Elevation−0.17 *−0.06−0.24 *
Slope−0.21 *−0.02−0.23 *
Soil nutrients0.54 ** 0.54 **
Notes: * p < 0.05, ** p < 0.01.
Table 3. Contribution and cumulative contributions of environmental factors to the Asteraceae diversity.
Variable FactorsContribution Rate (%)Cumulative Contribution Rate (%)
Soil total nitrogen29.729.7
Soil organic matter28.558.2
Slope8.566.7
Elevation8.174.8
Soil available nitrogen4.979.7
Aspect4.784.4
Disclaimer/Publisher’s Note: The statements, opinions and data contained in all publications are solely those of the individual author(s) and contributor(s) and not of MDPI and/or the editor(s). MDPI and/or the editor(s) disclaim responsibility for any injury to people or property resulting from any ideas, methods, instructions or products referred to in the content.

