Article

Change Characteristics of Soil Erodibility during Natural Restoration in an Earthquake Landslide of Southwestern China

1
National Forestry and Grassland Administration Key Laboratory of Forest Resources Conservation and Ecological Safety on the Upper Reaches of the Yangtze River, Sichuan Province Key Laboratory of Ecological Forestry Engineering on the Upper Reaches of the Yangtze River, College of Forestry, Sichuan Agricultural University, Chengdu 611130, China
2
Department of Geography, Handan University, Handan 056005, China
*
Author to whom correspondence should be addressed.
These authors contributed equally to this work.
Forests 2024, 15(8), 1352; https://doi.org/10.3390/f15081352
Submission received: 4 July 2024 / Revised: 27 July 2024 / Accepted: 1 August 2024 / Published: 2 August 2024

Abstract

:
Landslides caused by earthquakes bring about dramatic changes in soil erodibility. In order to understand the change characteristics of soil erodibility during a vegetation restoration period after the 5.12 Wenchuan earthquake, a non-landslide area, landslide area, and transition area in Leigu Town, Beichuan County were selected as research areas. Field soil sampling, geostatistics, and spatial interpolation were used to explore the spatiotemporal changes in soil physicochemical properties and soil erodibility during a natural restoration in 2013 (5 years after the earthquake) and in 2022 (14 years after the earthquake). The results showed that the comprehensive soil erodibility index (CSEI) was mainly composed of five soil factors, which were soil pH, soil total nitrogen (TN), mean weight diameter of soil aggregates (MWD), fractal dimension of soil water stable aggregates (D), and soil erodibility (Kepic). The CSEI of the landslide area was slightly lower than that of the non-landslide area. The CSEI was gradually increasing during the process of natural restoration after earthquake. From 2013 to 2022, the increase rates of the CSEI were 6.9%, 10.0%, and 41.5% for the landslide area, non-landslide area, and transition area, respectively. Along attitude segments, the spatial distribution of soil erodibility in 2022 is more uniform than that in 2013. The higher value of CSEI was located in the upper part of research areas. The spatial distribution of the CSEI in 2013 and 2022 appeared as a moderate autocorrelation. The variable ranges of CSEI in 2013 and 2022 were about 20 m. In the early stage of vegetation restoration, soil and water conservation engineering was recommended in the landslide area.

1. Introduction

The Wenchuan earthquake in 12 May 2008, which had a magnitude of 8.0, caused about 20,000 landslides [1]. The landslides damaged and destroyed a large area of vegetation, seriously damaged biodiversity, led to a sharp decline in vegetation coverage, and also caused significant changes in the vegetation succession process [2]. Simultaneously, the landslides caused the soil structure to be damaged, bedrock exposed, and soil fertility reduced, as well as surface soil loss, and an extremely reduced soil water retention capacity and corrosion resistance [3,4,5]. The earthquakes caused a large number of forest land damage, a large number of loose gravel covered the surface, aggravated soil erosion after initializing precipitation; soil erosion was serious, and it was difficult to restore vegetation in landslide sites [6]. Therefore, the premise of post-earthquake vegetation restoration is to study the change in physical and chemical soil properties post-landslide and to use it as a special tracer to monitor the natural succession process of vegetation over a long period, which will help us to fully understand the relationship between soil and vegetation in the process of vegetation restoration [7].
Vegetation has always been a positive factor in the prevention and control of soil erosion and an important factor affecting soil erodibility [8]. For one thing, it can intercept rainfall, reduce raindrop splash, slow down surface runoff, and at the same time prevent soil erosion [9,10]. For another, vegetation also improves soil nutrient content through decomposition of litter and root turnover [11,12]. Vegetation also contributes to the formation and accumulation of soil aggregates, effectively preventing soil erosion. On steeper slopes, soil erosion occurs even without surface runoff [13]. Post-earthquake landslides not only cause changes in soil structure, but also change soil erodibility [14]. Therefore, quantitative research on soil erosion can effectively prevent soil erosion especially in geological hazard-prone areas such as landslides.
Soil erodibility is the sensitivity to soil erosion, and it is a comprehensive index that can reflect soil performance [15,16,17]. At present, there are few studies on the correlation between soil erodibility and vegetation restoration in landslide areas [18,19]. Due to continuous change in soil erosion process and soil properties with time and space, the existing concept of soil erodibility has certain uncertainties [20,21,22]. Olson and Wischmeier defined soil erodibility as the amount of soil erosion that occurs under the rainfall kinetic energy per unit area [23]. This definition not only allows different climate zones to compare erodibility, but also contributes to the establishment of soil erosion predictions. However, the standard plot in different regions is not uniform, which makes it impossible to compare soil erodibility in different regions [24,25].
It has been found that soil erodibility cannot be expressed by any single physical and chemical soil properties but needs to be evaluated by combining a series of soil indicators [26]. The ratio of silicon, aluminum, and iron was used to judge the degree of soil erodibility [27]. Some scholars believed the heat of soil leaching, the ratio of soil silt content to clay content, soil permeability, and soil particles suspension rate as evaluation indicators for erodibility [28,29,30,31]. Other scholars believe that soil aggregates are an important factor in the study of soil erodibility [32,33]. After a large number of analyses, a simple nomograph was established to evaluate soil erodibility with five soil parameters, which included percent silt, percent sand, organic matter content, soil structure, and soil permeability [34].
Due to the difference in the vegetation condition and soil structure between the landslide area and non-landslide area, to study the influence of natural vegetation restoration on soil erodibility in the landslide sites, it is helpful to understand the changing characteristics of soil erodibility in the landslide areas. Landslide sites in Fenghuang Mountain in Leigu Town, Beichuan county were used as research areas. Soil erodibility was investigated and compared in different stages of vegetation restoration. Furthermore, spatial variation of soil erodibility was geostatistically analyzed. It can provide an effective basis for the prevention of soil erosion in landslide areas in the future, biological measures, and engineering measures. Meanwhile, soil erodibility evaluation standards suitable for landslide sites can be established.

2. Materials and Methods
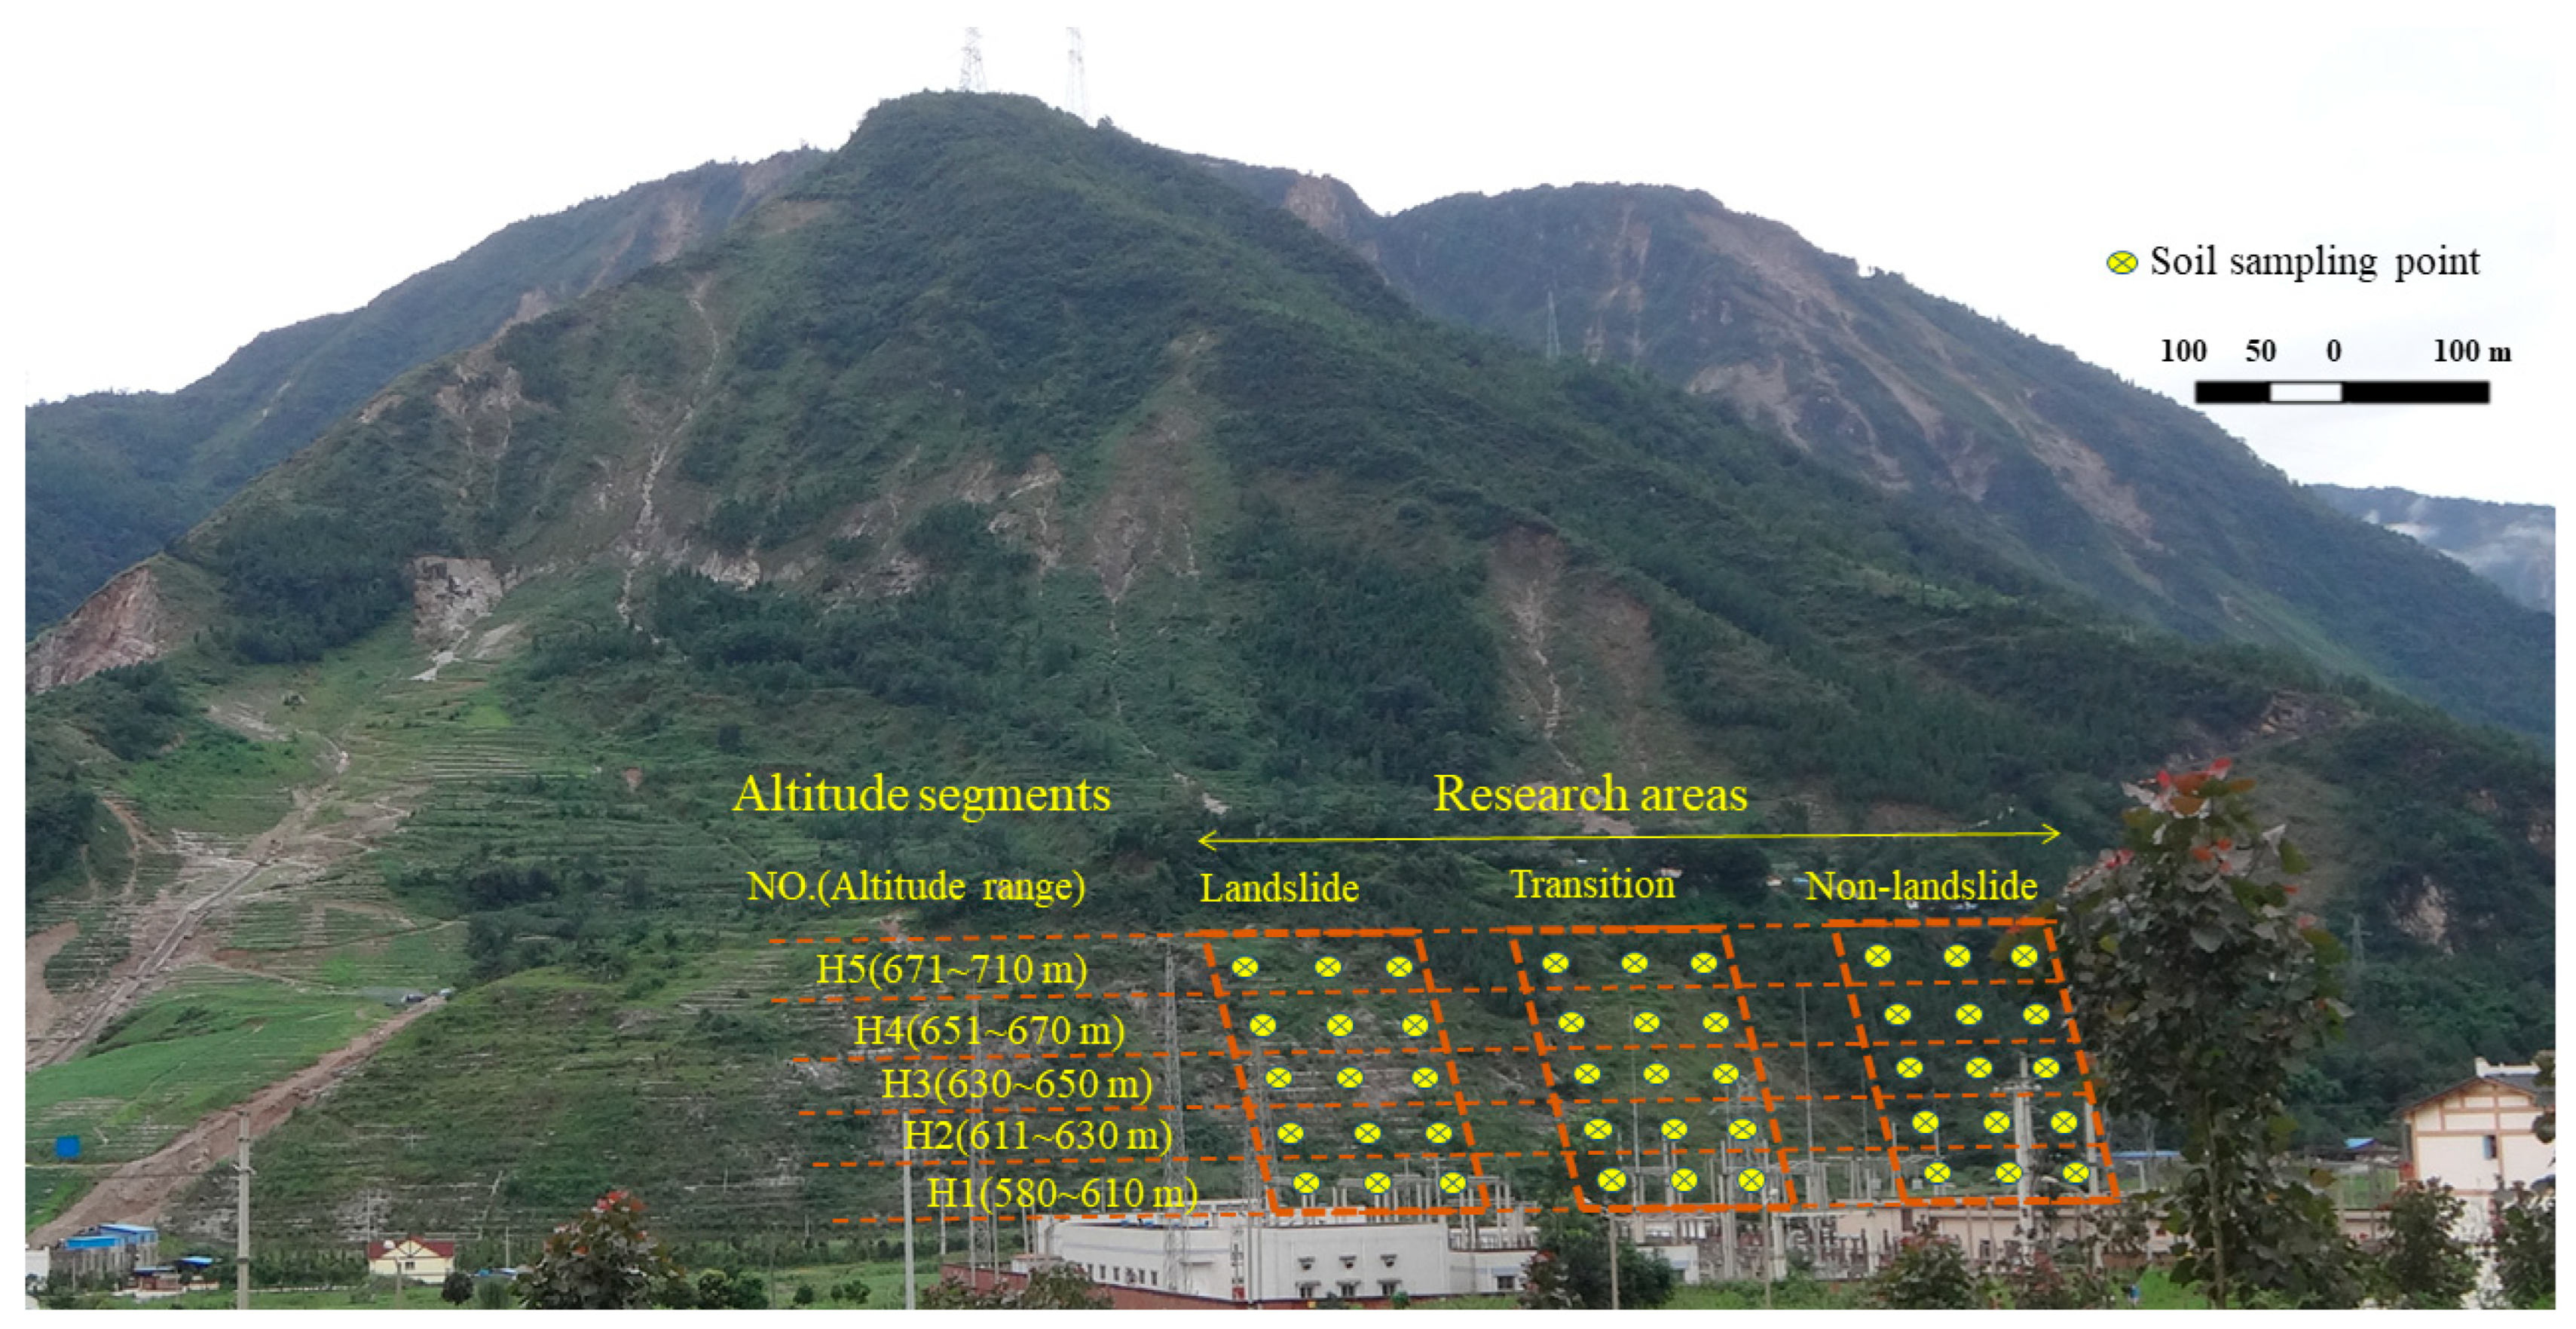
2.1. Study Area

The research area is located in Leigu Town, Beichuan Qiang Autonomous County, Mianyang City, Sichuan Province (103°44′–104°44′ E, 31°41′–32°14′ N). It has a subtropical humid monsoon climate with 16.6 °C of average annual temperature and 1399 mm of average annual rainfall. And rainfall is concentrated in June–September, which account for above 70% of annual rainfall. The Subao river runs across the research area; its length is 33 km, and its catchment area is 147 km2. Rock type and soil texture are mainly limestone and gravel soil, respectively. And soil types include yellow loam, yellow-brown soil, dark-brown soil, and subalpine meadow soil [35]. The vegetation coverage is 76%, and the vegetation is distributed in bands, mainly including evergreen broad-leaved forests, evergreen deciduous mixed forests, and coniferous-broad-leaved mixed forests. The landslide area is located in Fenghuang mountain along the Beichuan–Yingxiu fault zone. After the Wenchuan earthquake, Fenghuang mountains slipped and deformed forward. Landslide bulges were formed, resulting in a steep slope (30–38°). Due to the relatively steep slope and loose rock formations, the vegetation and surface soil of the landslide area are almost completely lost, and surface rock layers were exposed (Figure 1).

2.2. The Research Areas Setup and Vegetation Survey

Three research areas were set up in 2013, namely landslide area, transition area, and non-landslide area. The landslide area was set within the range of the landslide body after the earthquake, and the landslide surface was mostly covered by gravel and scattered by shrubs and herbals whose vegetation coverages were below 20%. The non-landslide area was not affected by the landslide and remained a secondary cypress forest. The transition area was set at the junction of the landslide area and the non-landslide area, with a number of gullies (Figure 1). The three sample plots were all secondary cypress forests with similar vegetation coverages before the occurrence of the landslides. In 2022, the vegetation coverages of the three sample plots were similar, exceeding 70%. Three arbor quadrats (20 m × 20 m) were arranged in each research area along altitude. And the species names, tree numbers, plant heights, and crown widths of individual trees, with diameter more than 3 cm at breast height of the tree, were recorded. At the same time, 6 shrub quadrats (5 m × 5 m) and 12 herb quadrats (1 m × 1 m) were set in each arbor quadrat, and the species names, plant numbers, plant heights, and plant coverage were recorded. Species diversity indicators, including Shannon–Wiener diversity index (H), Simpson dominance index (H’), Pielou evenness index (Jsw), and Richness index (S) were calculated based on survey records and general methods [36,37,38,39].
During the process of vegetation restoration, the number of species in the landslide area increased from 40 in 2013 to 119 in 2022. The species richness of the shrub layer in the three sample plots of the landslide area increased with the increase in vegetation restoration years. The Shannon–Wiener index of the tree layer in the non-landslide area showed a downward trend. Compared with those in 2013, the Shannon–Wiener diversity index, Simpson dominance index, and Pielou evenness index of the herbaceous layer all increased in 2022 (Table 1).

2.3. Soil Sample Collection

The research areas are divided into 5 altitude segments, of which 3 sample points were selected in each altitude segment. A total of 45 sample points were laid (Figure 1). The undisturbed soil samples were collected by the grid method in 2013 and 2022. The sampling spots were evenly distributed over the whole field and taken representatively. Around every sample point, after removing the litter, rock fragment cover, and surface crusts, when present, five soil samples were randomly collected from the surface layer (0–10 cm). The soil samples were collected with a depth not exceeding 10 cm and cumulative weight of approximately 2 kg. These samples were then packed into rigid plastic boxes to keep them undisturbed and brought back to the laboratory. Furthermore, soil structure destruction was avoided as much as possible during the collection and transport process. All soil samples were left to dry in the laboratory. A detailed description of the sample collection can be found in Lan (2021) and Wu et al. (2023) [11,32].

2.4. Construction and Determination of Comprehensive Soil Erodibility Index

There are many kinds of indicators to evaluate soil erodibility, such as soil silicon–aluminum–iron rate, soil particle composition and aggregate characteristics, soil infiltration performance, etc. According to the previous classification of soil erodibility-influencing factors, five soil indicators related to soil erodibility were screened out using the principal component analysis and empirical discrimination methods. Soil indicators included soil pH, soil total nitrogen (TN), soil mean weight diameter of soil dry aggregates (MWD), fractal dimension of soil water stable aggregates (D), and soil erodibility (Kepic). Soil particle composition was determined via a Malvern Master size 3000 laser particle size analyzer. The TN was determined using a flame spectrophotometer method [40]. The soil pH was measured in a soil–water suspension (1:2.5 v/v) using a digital pH meter [41]. The MWD, D, and Kepic were calculated by Le Bissonnais (1996) [42], Xia (2017) [43], and Parysow et al. (2003) [44], respectively.
The “S” curve function represents that each factor is positively correlated with soil erodibility. The Kepic and D are described by the “S” curve function. While the inverse “S” curve function represents that each factor is negatively correlated with soil erodibility. The MWD, TN, and pH are described by the inverse “S” curve function. When D increases, the soil particle structure becomes less stable and may be more susceptible to erosion. Therefore, the higher the D, the lower the stability of soil aggregate structure. The soil erodibility index selected in the “S” curve function is positively correlated with Kepic. However, as the soil parent material, when more limestone was exposed on the land surface, the soil pH value increased, which resulted in lower soil erodibility. An increase in TN often leads to higher plant growth, which increases the content of MWD. The MWD was negatively correlated with the soil erodible fraction. The comprehensive soil erodibility index (CSEI) was obtained by using the weighted sum method [45]:
CSEI = i n K i × C i
K ( x ) = 1   x b x a b a a < x < b 0 x a
K ( x ) = 0   x b x b a b a < x < b 1     x a
where CSEI is the comprehensive soil erodibility index, with a numerical range between 0 and 1. Ki is the membership value of the i-th evaluation index; i is the number of soil erodibility indicators; Ci is the weight of the i-th evaluation index, reflecting the contribution of this index to soil erodibility; n is the number of evaluation indicators. K(x) in formula 2 and in formula 3 are the membership values of the “S” curve function and inverse “S” curve function, respectively. a and b refer to the upper and the lower critical values of soil index, respectively (Table 2).

2.5. Spatial Heterogeneity Analysis

The spatial distribution map of the CSEI was drawn through an inverse distance weighting method using ArcMap 10.6 [24,44]. Based on the analysis of the semi-variance function of GS+Version 9.0, the spatial heterogeneity of the CSEI is affected by structural factors and random factors. Spatial structural characteristic parameters, including nugget (C0), silt (C), and variable range (A), are the basis for spatial analysis. C0 represents random variation caused by measurement error and spatial variation; C represents the constant in which the variation function gradually increases from the initial nugget to the relatively stable direction; A represents the spatial autocorrelation range of variables, and there is no relationship beyond this range. C0/(C + C0) represents the degree of spatial variation, which is the ratio of the spatial variability of random factors to the total variation. A higher ratio indicates that the variation is caused by random factors. When C0/(C + C0) is lower than 25%, the variable has a strong spatial correlation. When C0/(C + C0) is in the range of 25% to 75%, the variable has a medium spatial correlation. And when C0/(C + C0) is higher than 75%, the spatial correlation of the variable is very weak. At the same time, the smaller the residual (RSS) of the semi-variogram function, and the larger the determination coefficient (R2), the better the fitting degree of the function [46].

2.6. Statistical Analysis

One-way analysis of variance (ANOVA) and Student–Newman–Keuls (S–N–K) test were conducted to examine the effect of altitude segments and research areas on the CSEI and related indices, and significance was established at p < 0.05. A principal component analysis was performed to extract the representative soil indicators for CSEI. All of the statistical analyses were performed using SPSS 18.0 software (SPSS Incorporation, Chicago, IL, USA), and the graphics were plotted using OriginPro 2021.

3. Results

3.1. Change Characteristics of Main Soil Indicators Related to CSEI

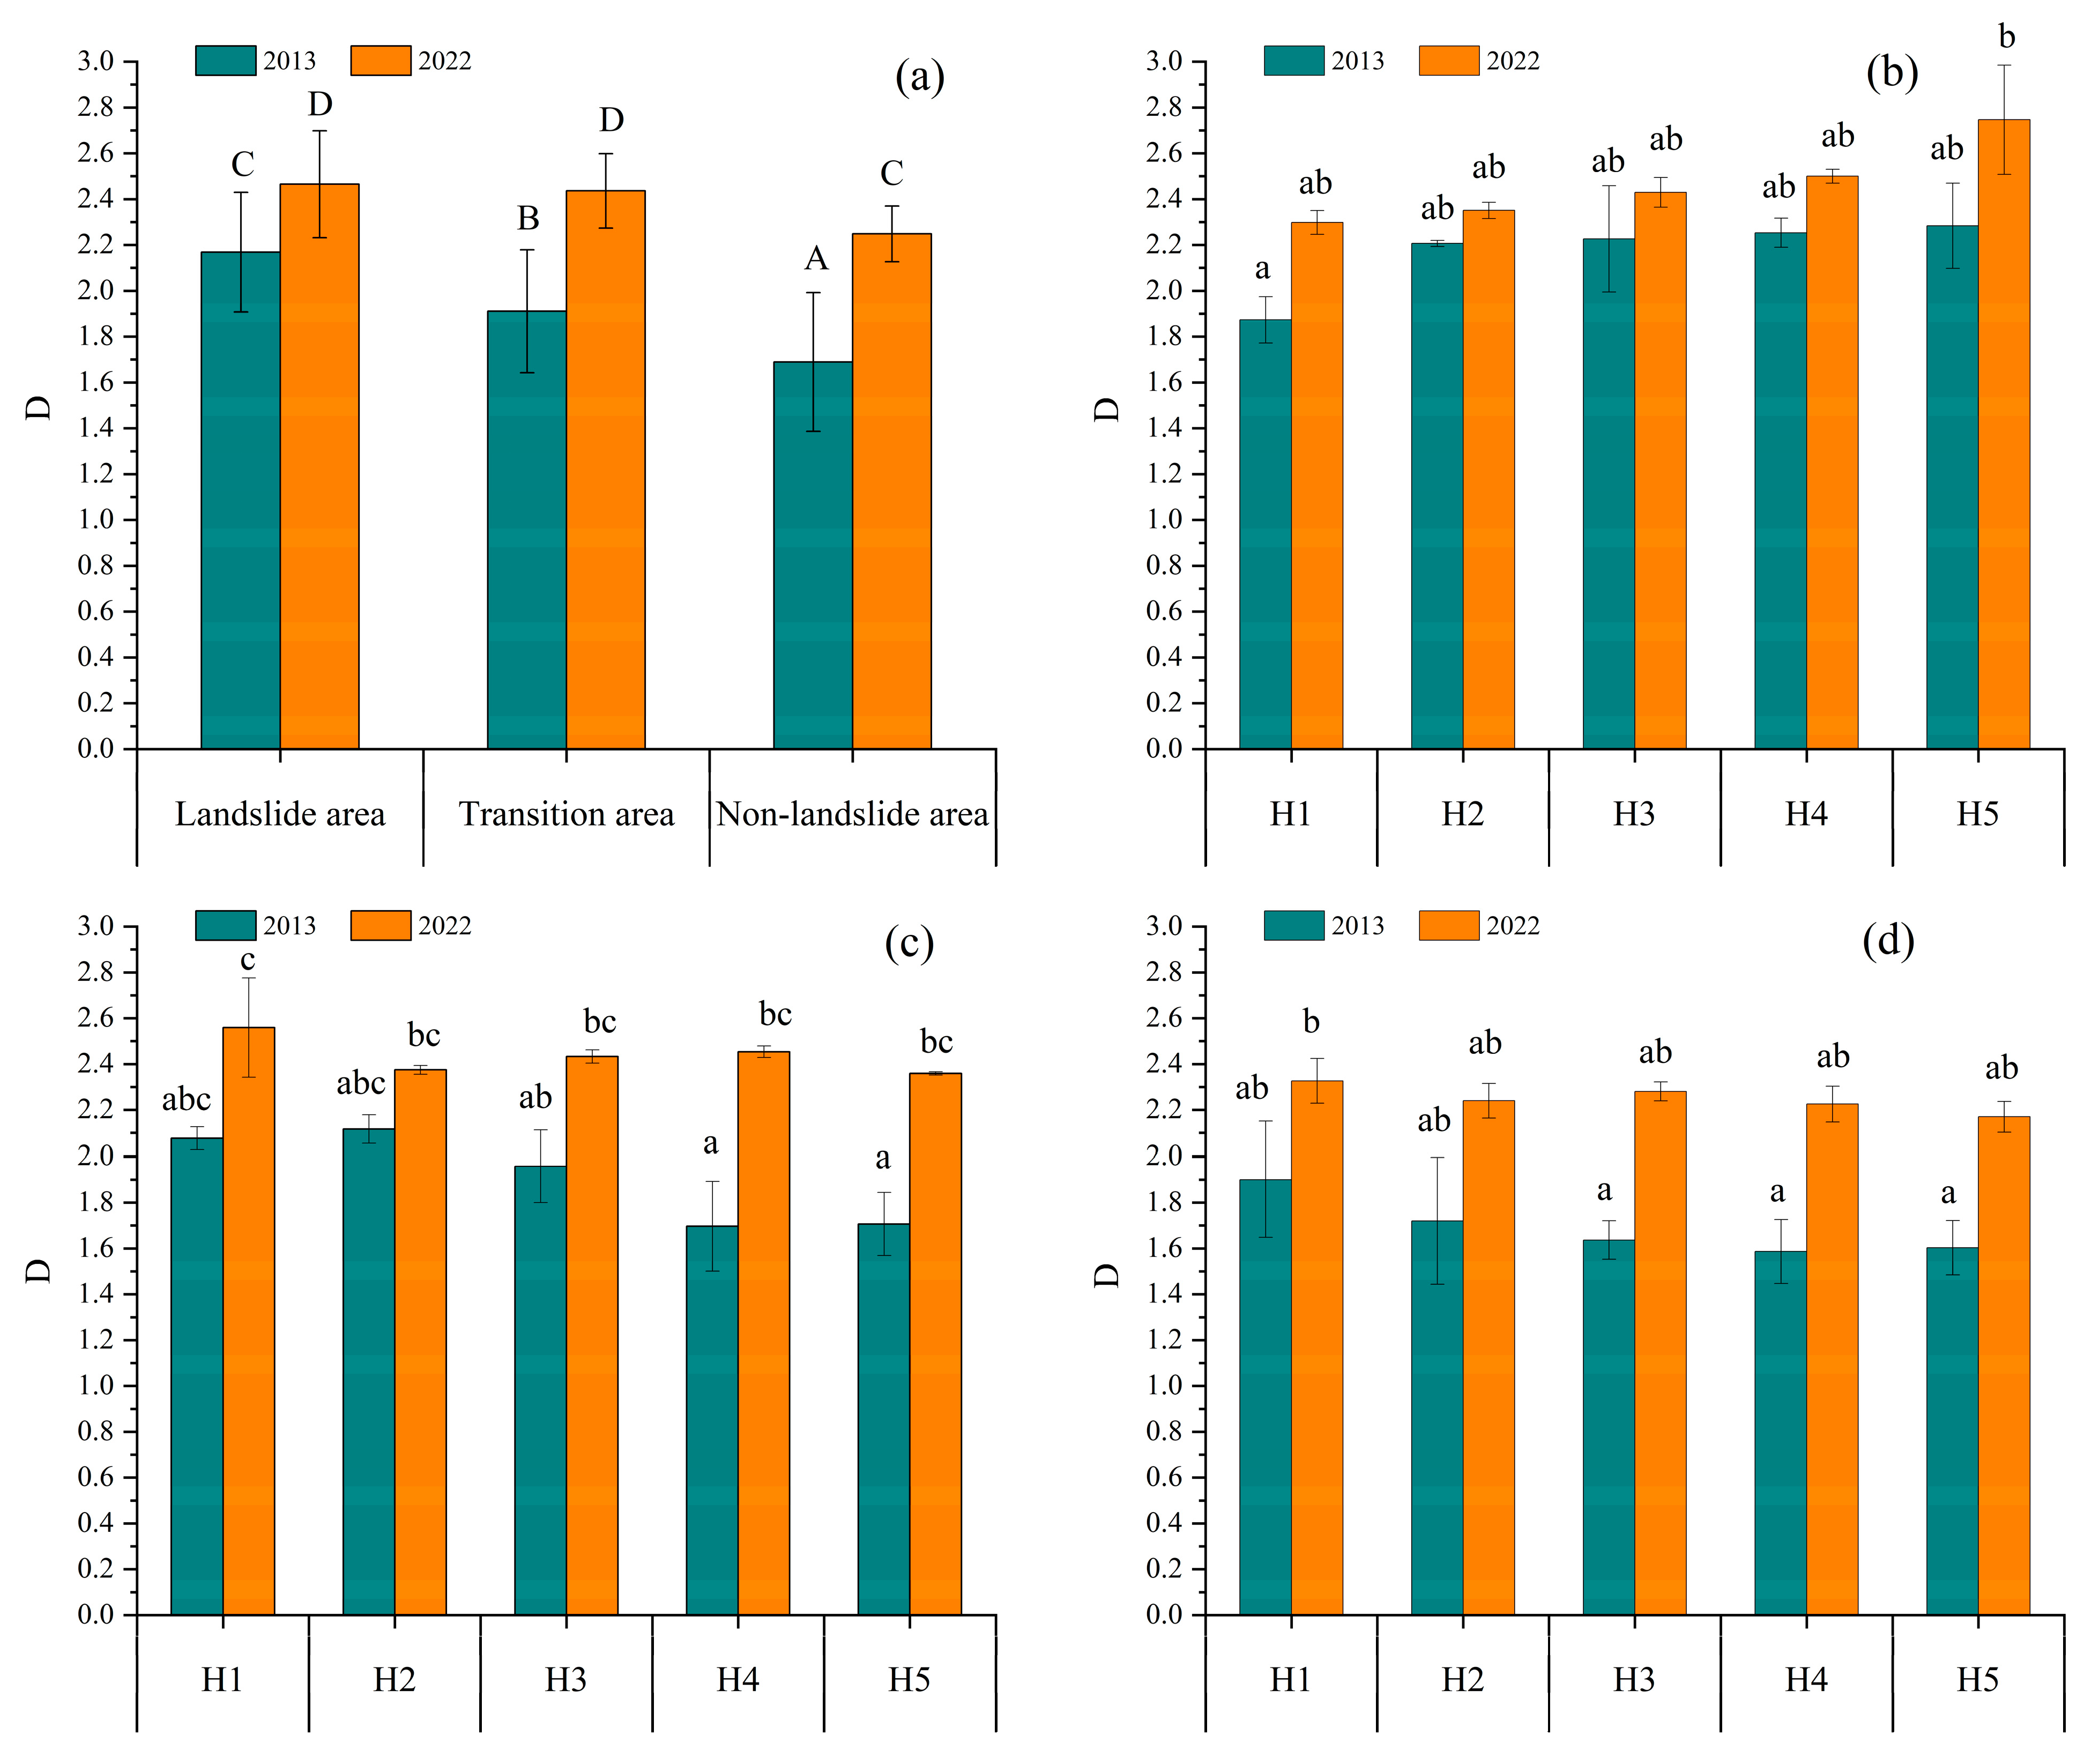
3.1.1. Change Characteristics of D

Compared with the D value in the research areas in 2013, the D value in 2022 was significantly higher (p < 0.05). With the increase in altitude, the D value increased gradually in landslide areas; whereas, the D value decreased gradually in the transition area and non-landslide area. For the D value of the three research areas in 2013 and 2022, there were not significantly different among different altitude segments (Figure 2).

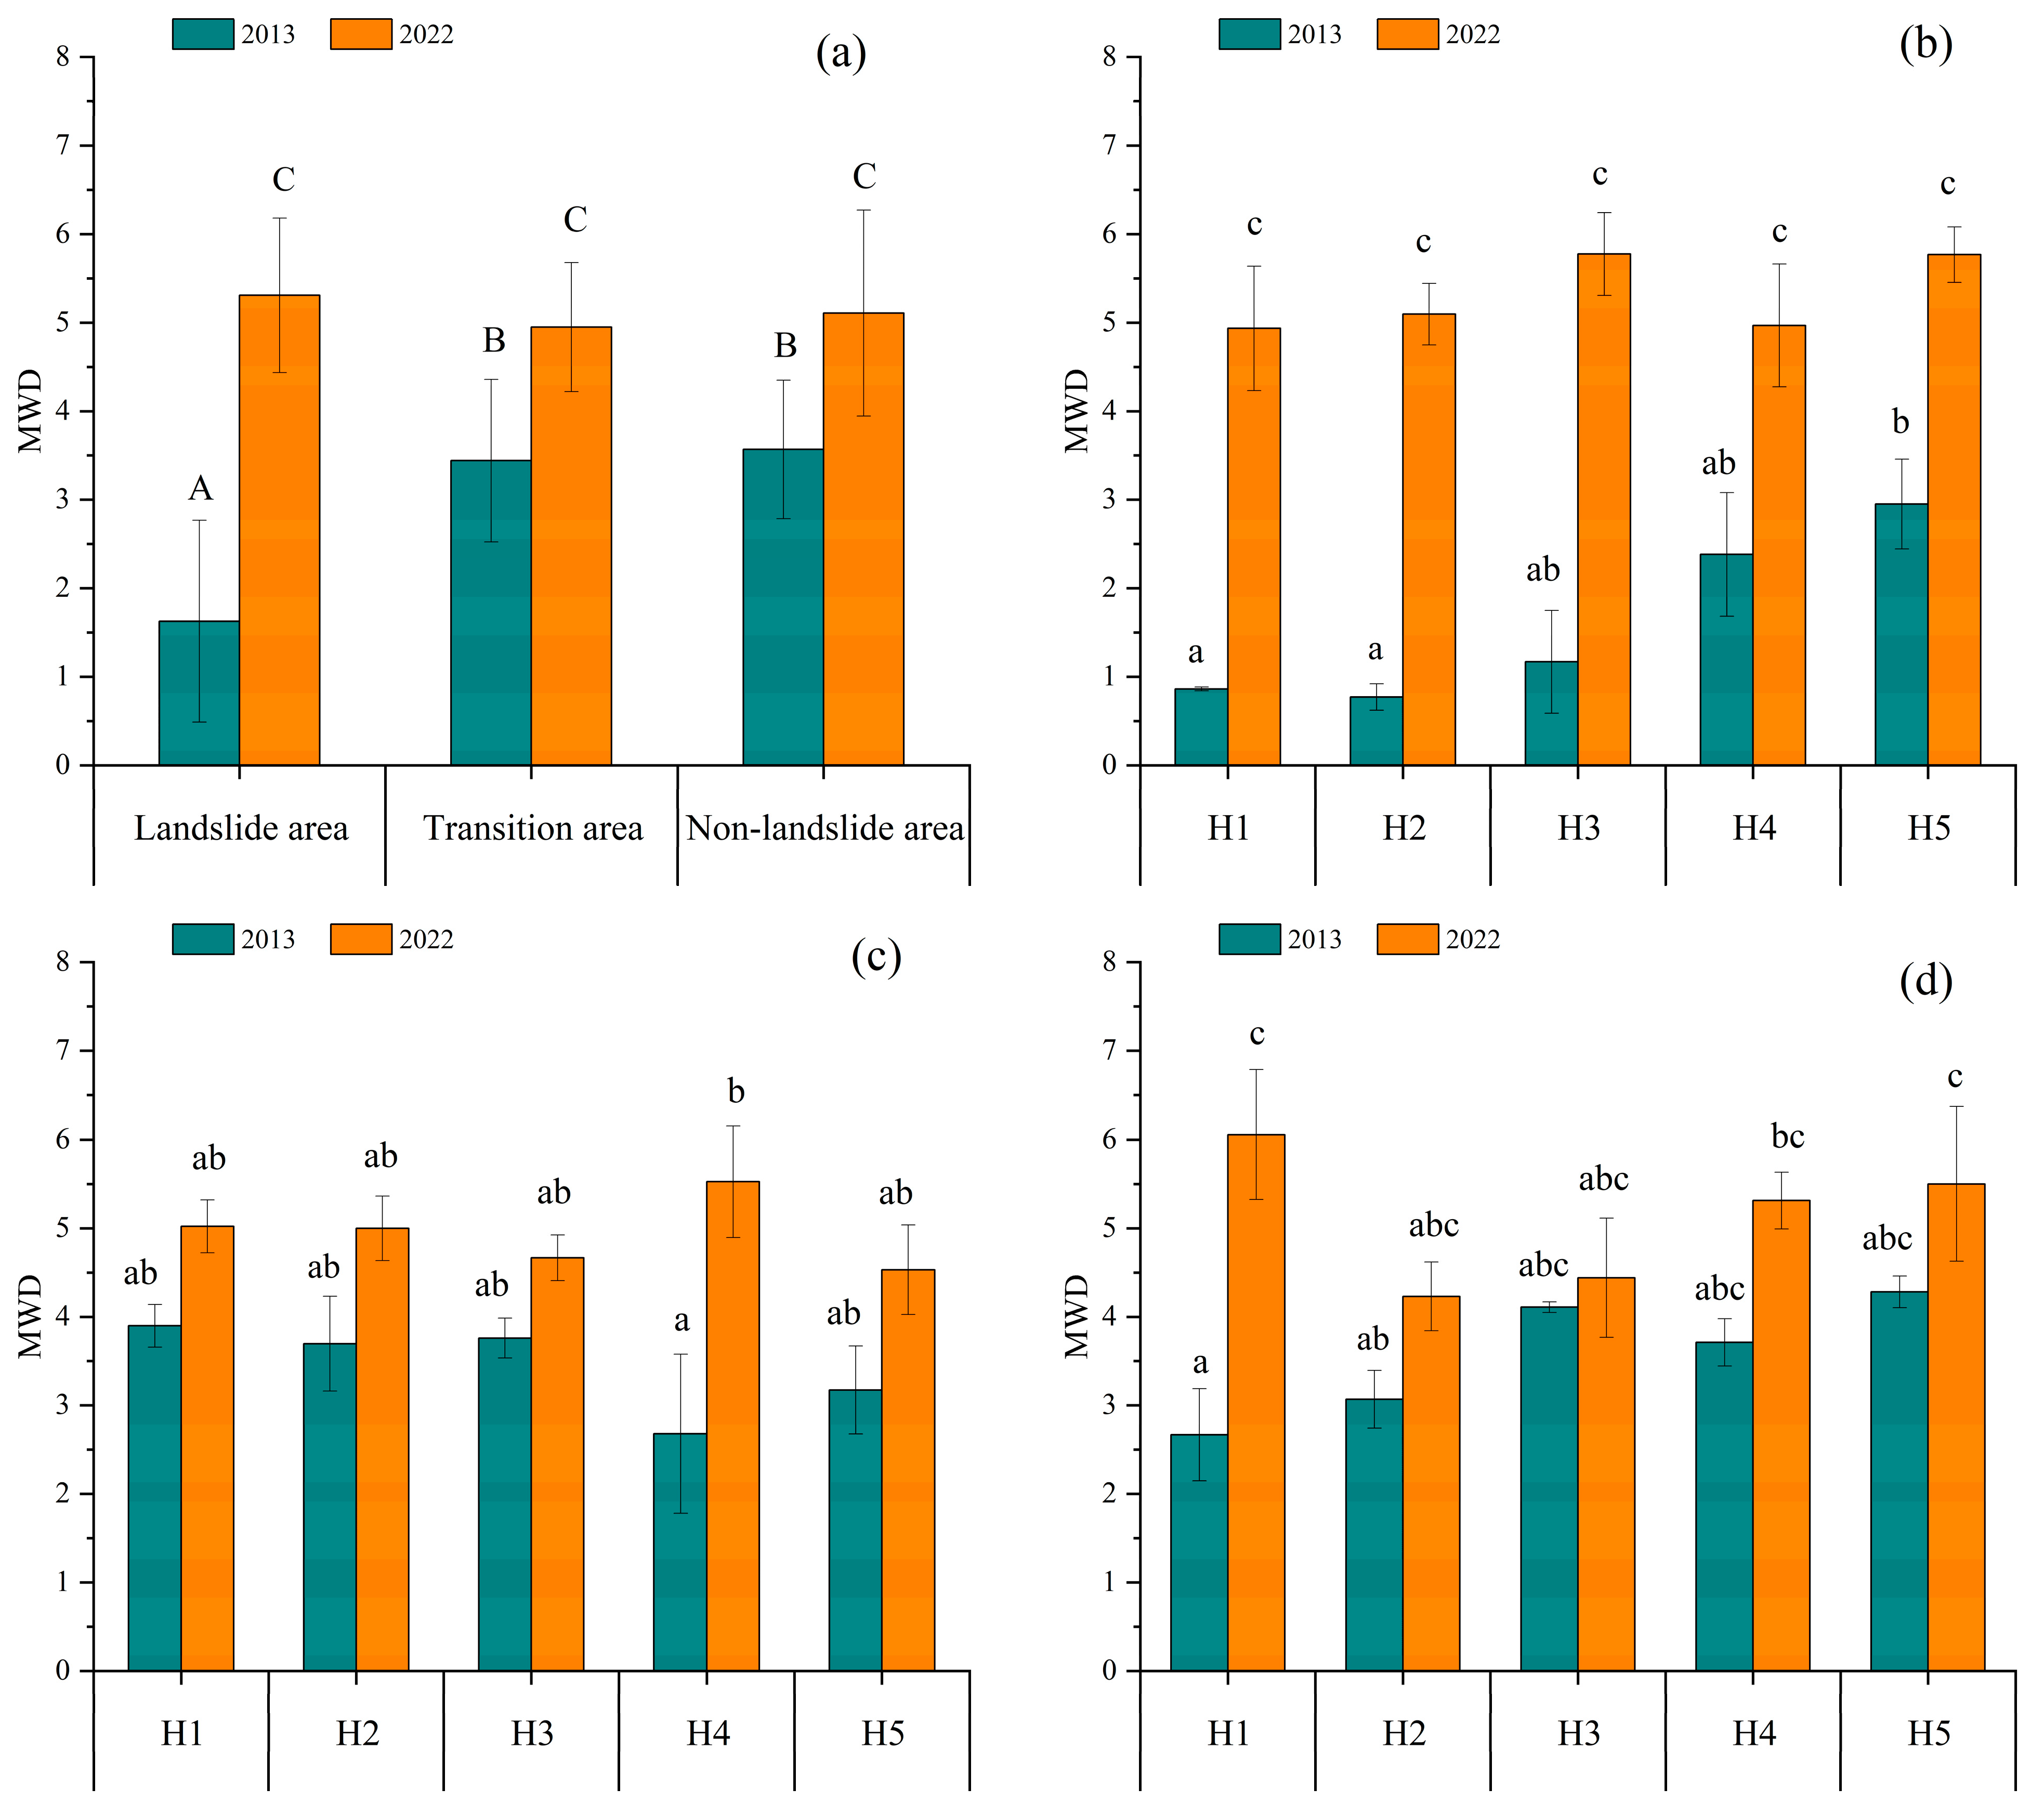
3.1.2. Change Characteristics of MWD

The MWD in 2022 was significantly higher than that in 2013, while the MWD values in the transitional areas showed significant differences in different years. Comparing the MWD values of different altitude segments, there was a significant difference in the MWD of the H1 and H2 altitude ranges in the landslide area compared to the H5 altitude segments. There was no significant difference in the MWD values of different altitude segments in the transition area, while there was a significant difference in the MWD values of the H1 and H2 altitude segments compared to the H3, H4, and H5 altitude segments in the non-landslide area. There was a significant difference in the MWD values between the H3 and H4 in the landslide area. There was a significant difference in the MWD values between the H1 altitude segments and other altitude segments in the transition area. There was a significant difference in the MWD values between the H4 altitude gradient and the H1, H3, and H5 altitude segments in the non-landslide area. In 2022, there was no significant difference in the altitude segments among the three areas. Comparing different years, it was found that in the landslide area, except for the H4 altitude gradient, the MWD values of other altitude segments in 2022 showed significant differences compared to the same altitude gradient in 2013. The MWD values of H1, H3, and H4 altitude segments in the transitional zone in 2022, as well as the H1 altitude gradient in the non-landslide zone, were significantly different from those in 2013 (Figure 3).

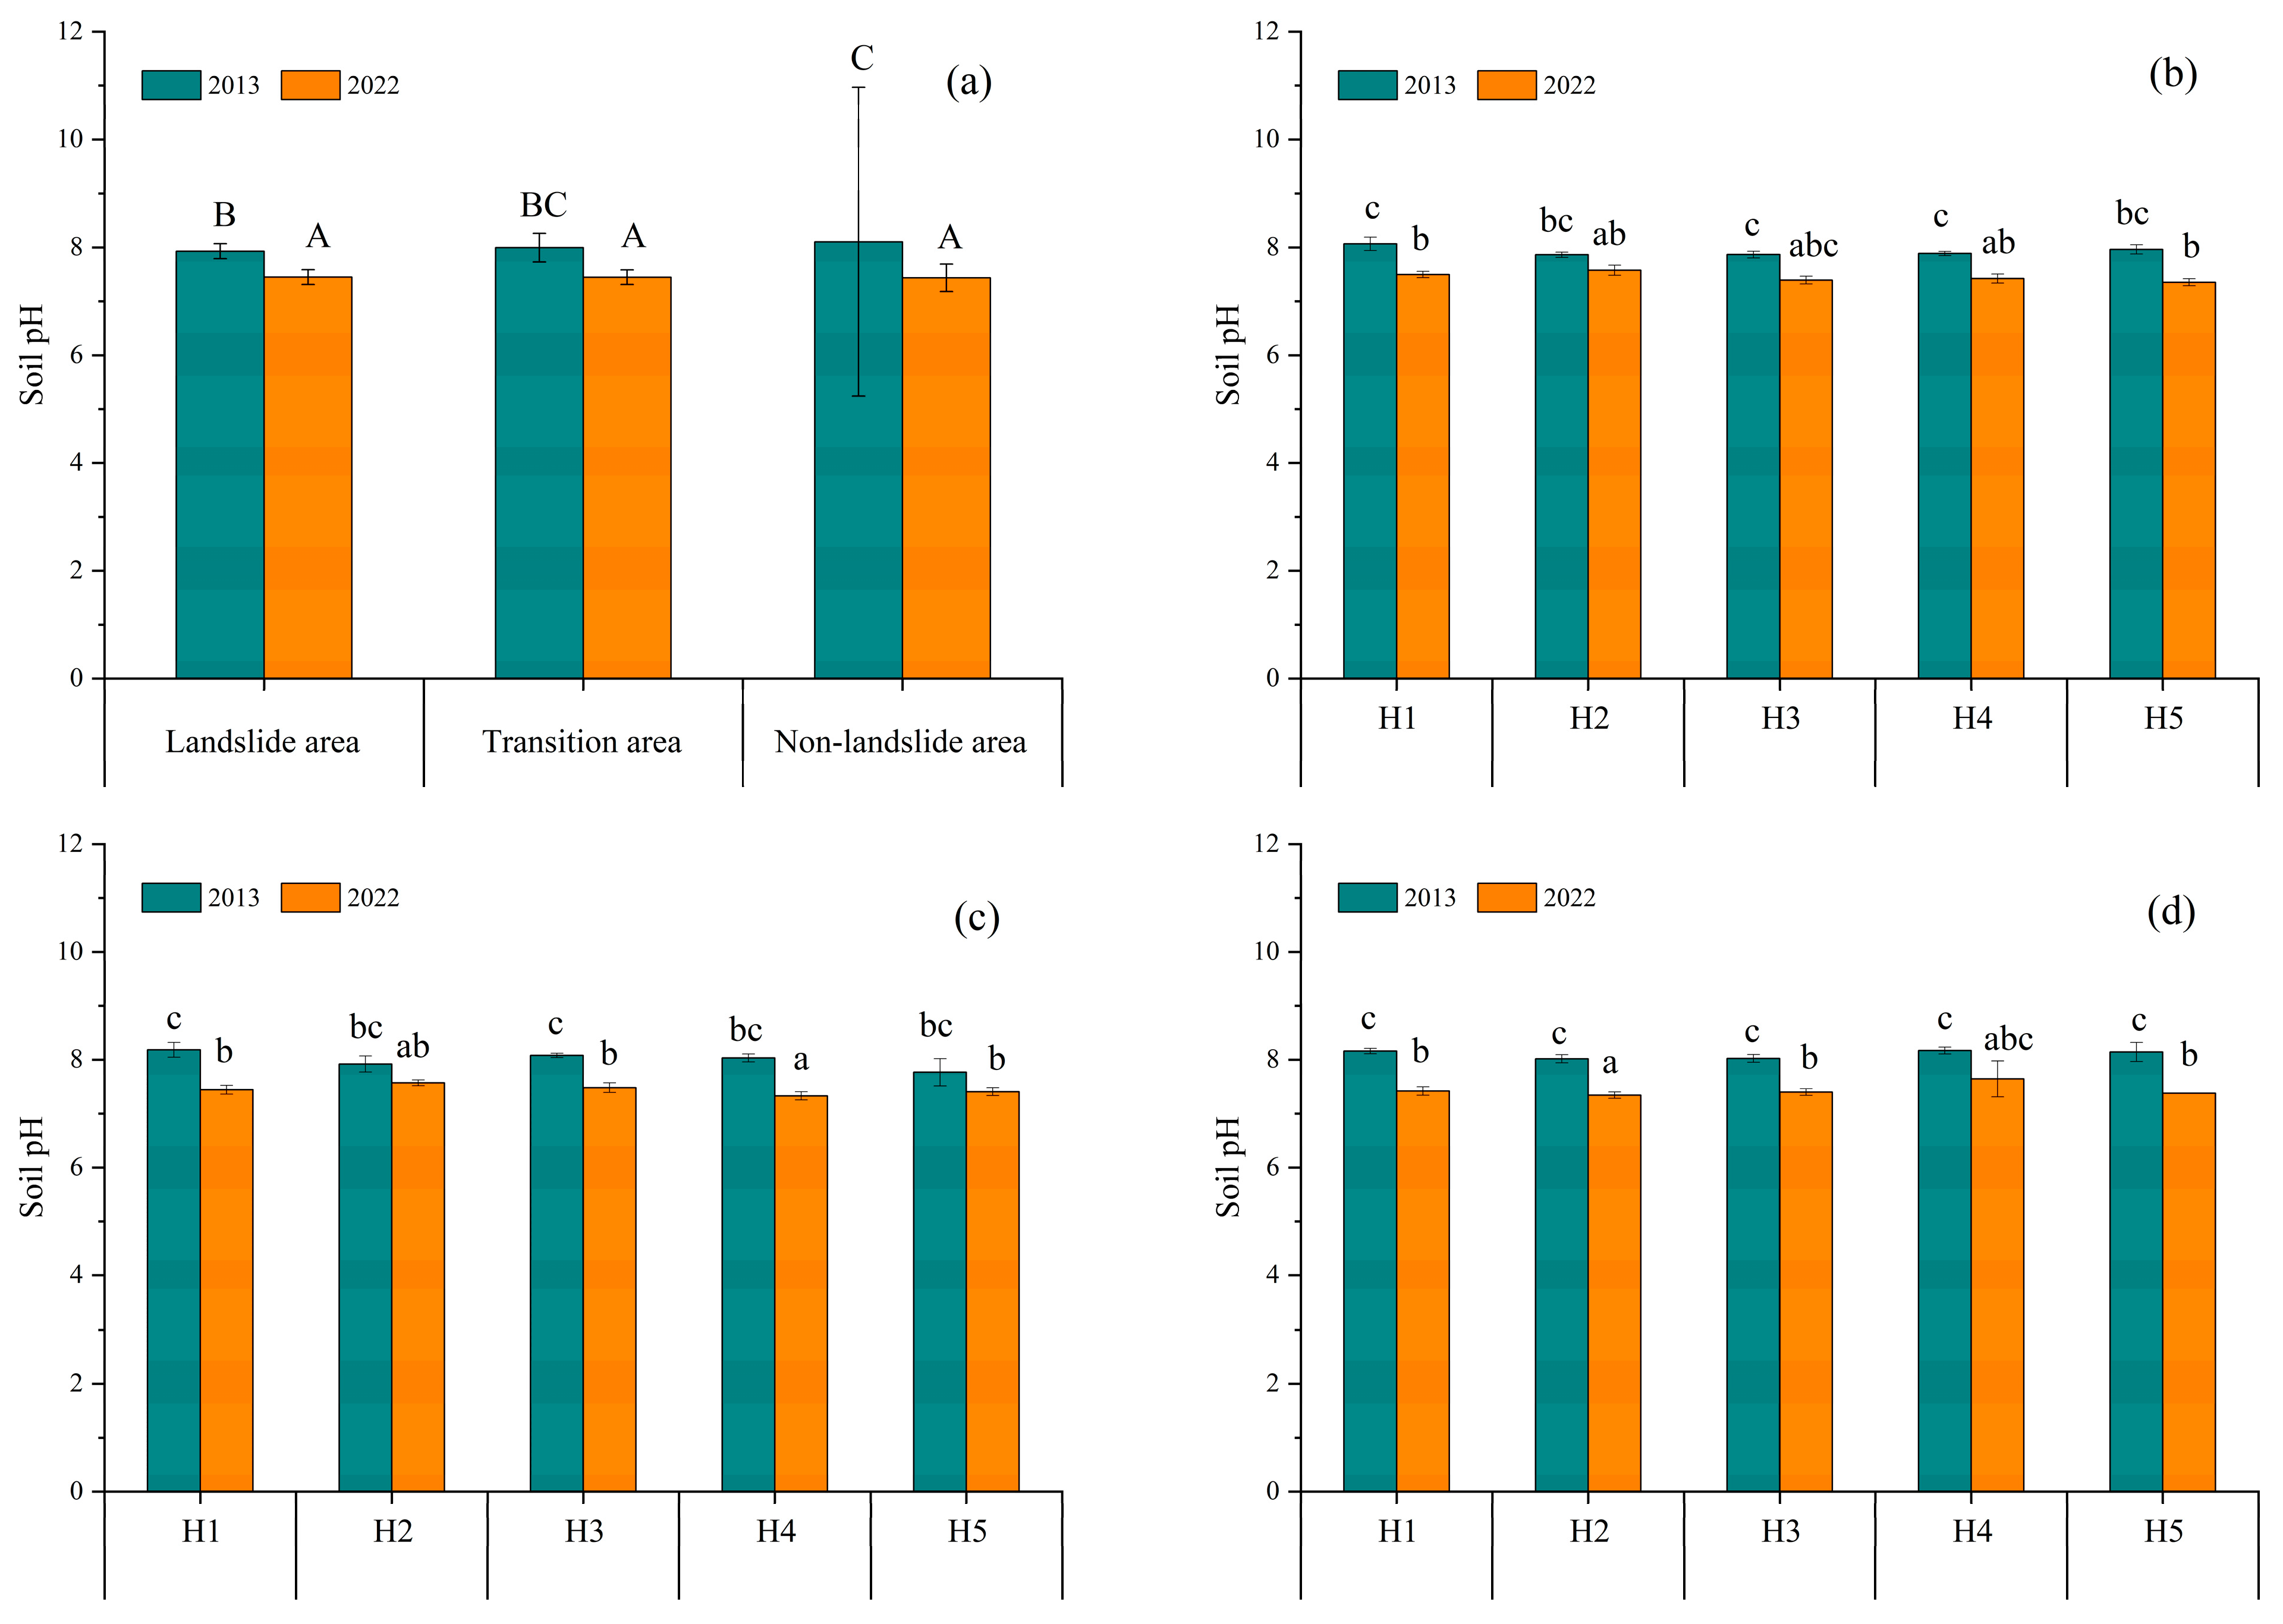
3.1.3. Change Characteristics of Soil pH

The soil pH values of the three plots showed a decreasing trend and tended to be neutral with the increase in the restoration years. The soil pH values of the three plots in 2013 were significantly higher than those in 2022. The average decline rate from 2013 to 2022 was 7.1%, with a maximum decline rate of 8.2% in the non-landslide area. There are no significant differences in pH values among the three research areas in the same year. Compared to the soil pH values in 2013, the soil pH values in 2022 of most altitude segments have significantly decreased in the non-landslide area. The decline rates of the soil pH value in H5 were 7.7% and 9.4% in the landslide area and non-landslide area, respectively, which is the highest value, followed by 7.1% and 9.1% in H1 (Figure 4).

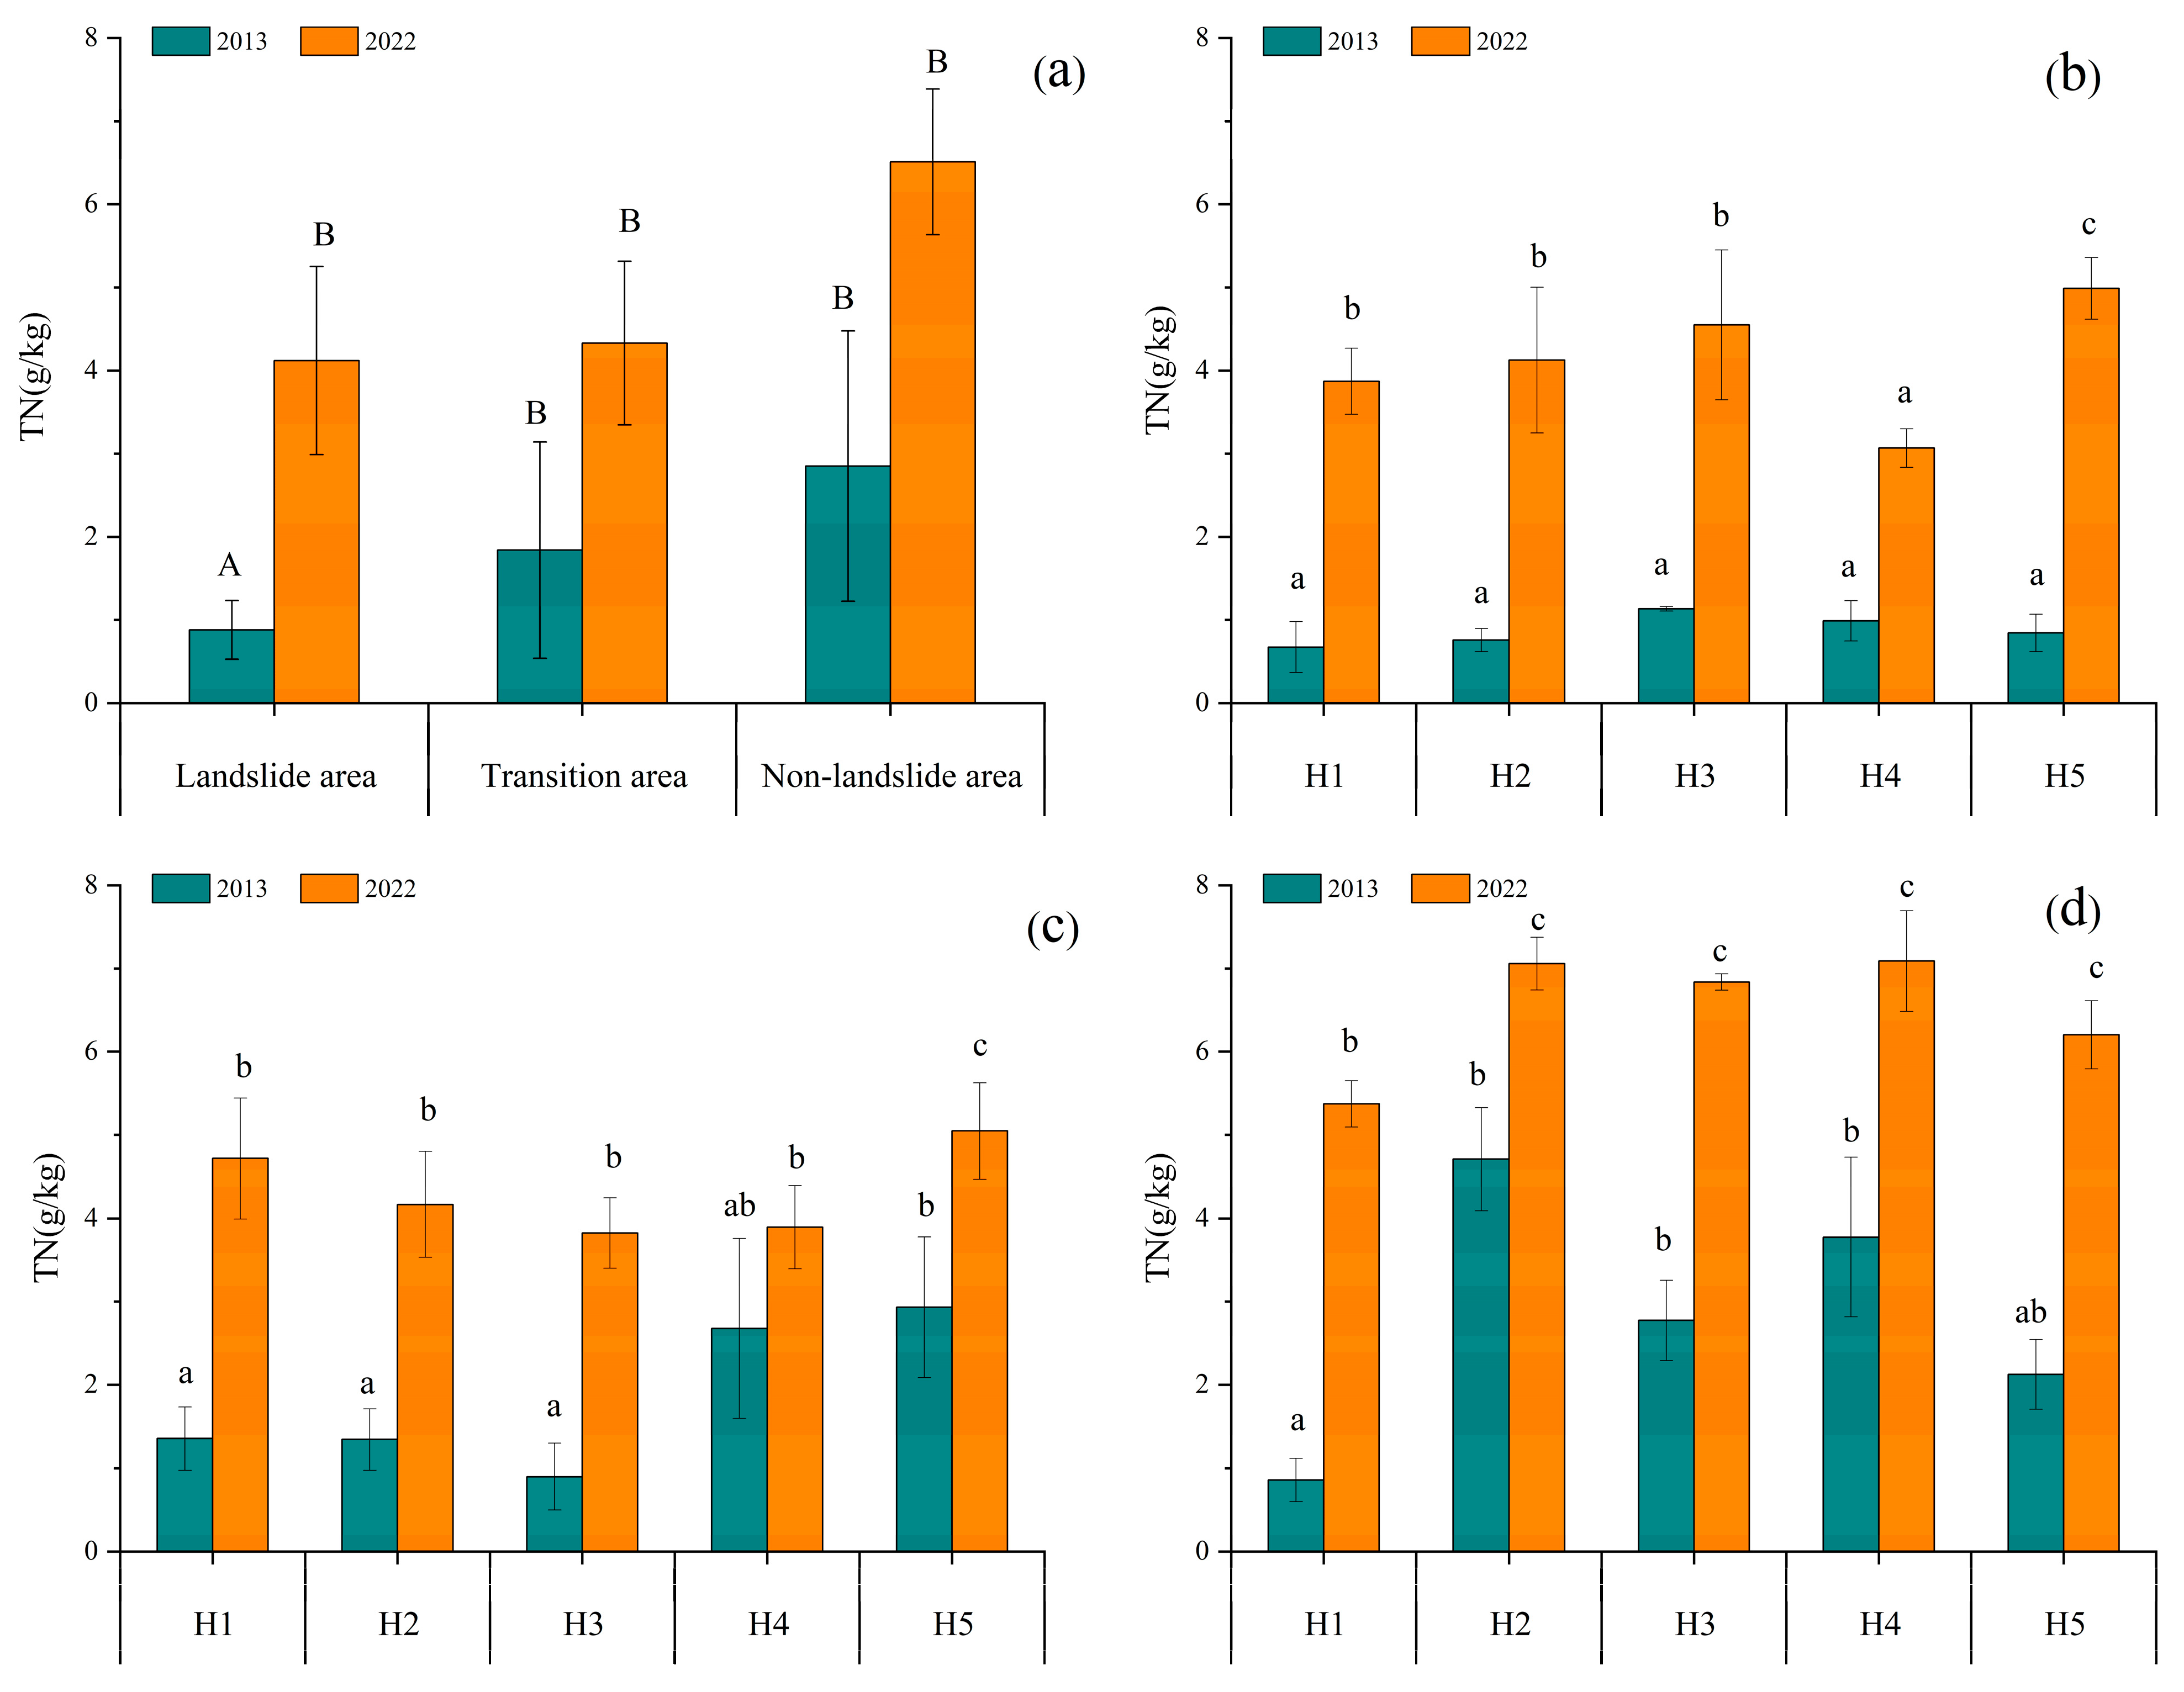
3.1.4. Change Characteristics of TN

The TN in the three research areas shows an overall increasing trend with vegetation restoration time. There is a significant difference in the TN in the landslide areas in different vegetation restoration years. Compared with the mean value of the TN of the non-landslide area in 2013 and 2022, the TN of the landslide area decreased 69.1% and 36.7%, respectively (Figure 5).
The TN of the landslide area and non-landslide area first showed an increasing trend and then a decreasing trend from H1 to H5 along the altitude gradient; whereas, in the transition zone, the TN first decreased and then increased in 2013 and 2022. There were significant differences in the TN between H1 or H5 and other altitude segments in same year (Figure 5).

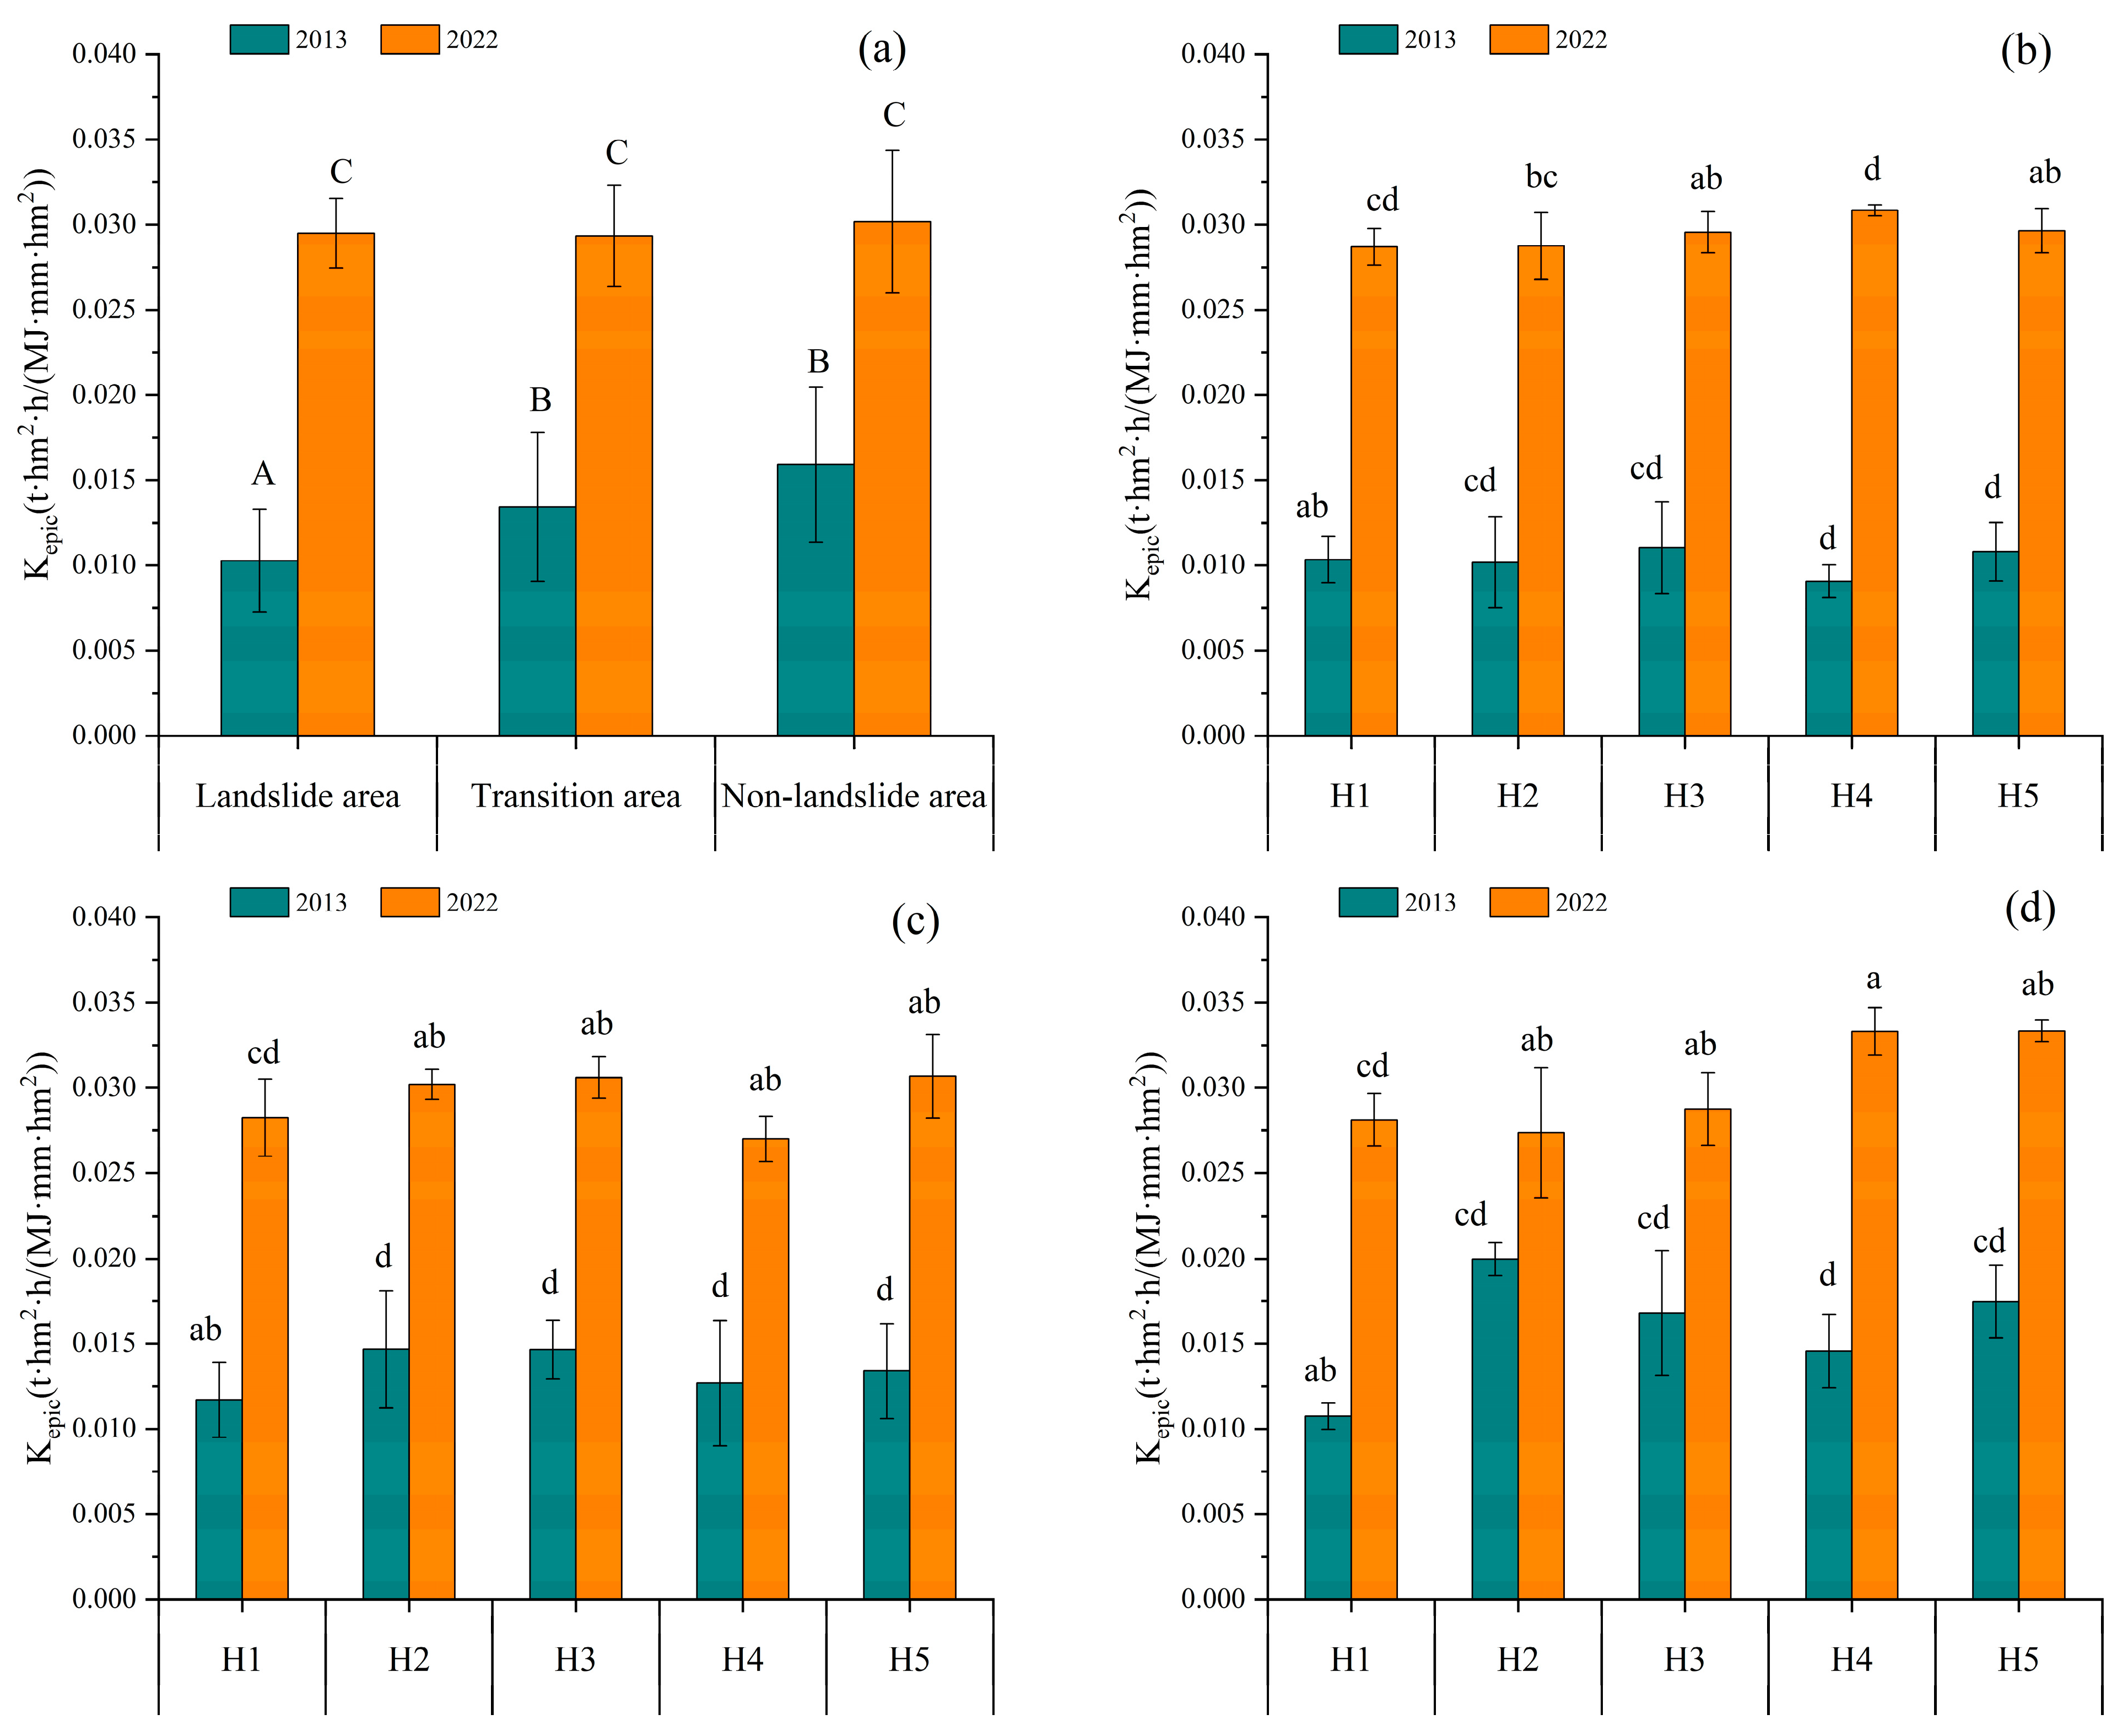
3.1.5. Change Characteristics of Kepic

As shown in Figure 6, the Kepic in the landslide area varies from 0.0059 t·hm2·h/(MJ·mm·hm2) in 2013 to 0.0291 t·hm2·h/(MJ·mm·hm2) in 2022. The Kepic in the landslide area increases with the increase in altitude. While in the transition area, the Kepic shows a trend of first increasing and then decreasing. There is significant difference in 2013 and no significant difference in 2022 between the landslide area and non-landslide area, respectively.
For the Kepic at different altitudes, it was found that there was a significant difference between the H1 and H2 in the research areas in 2013 and 2022. Meanwhile, there was no significant difference among other altitude segments. It was found that except for the H2 and H4 in the landslide area, Kepic in 2022 was significantly higher than Kepic in 2013. The Kepic at various altitude segments in the transition area showed a trend of first increasing and then decreasing. The Kepic at various altitude segments in the landslide area and non-landslide area showed no obvious monotonic change trend (Figure 6).

3.2. Change Characteristics of Comprehensive Soil Erodibility Index

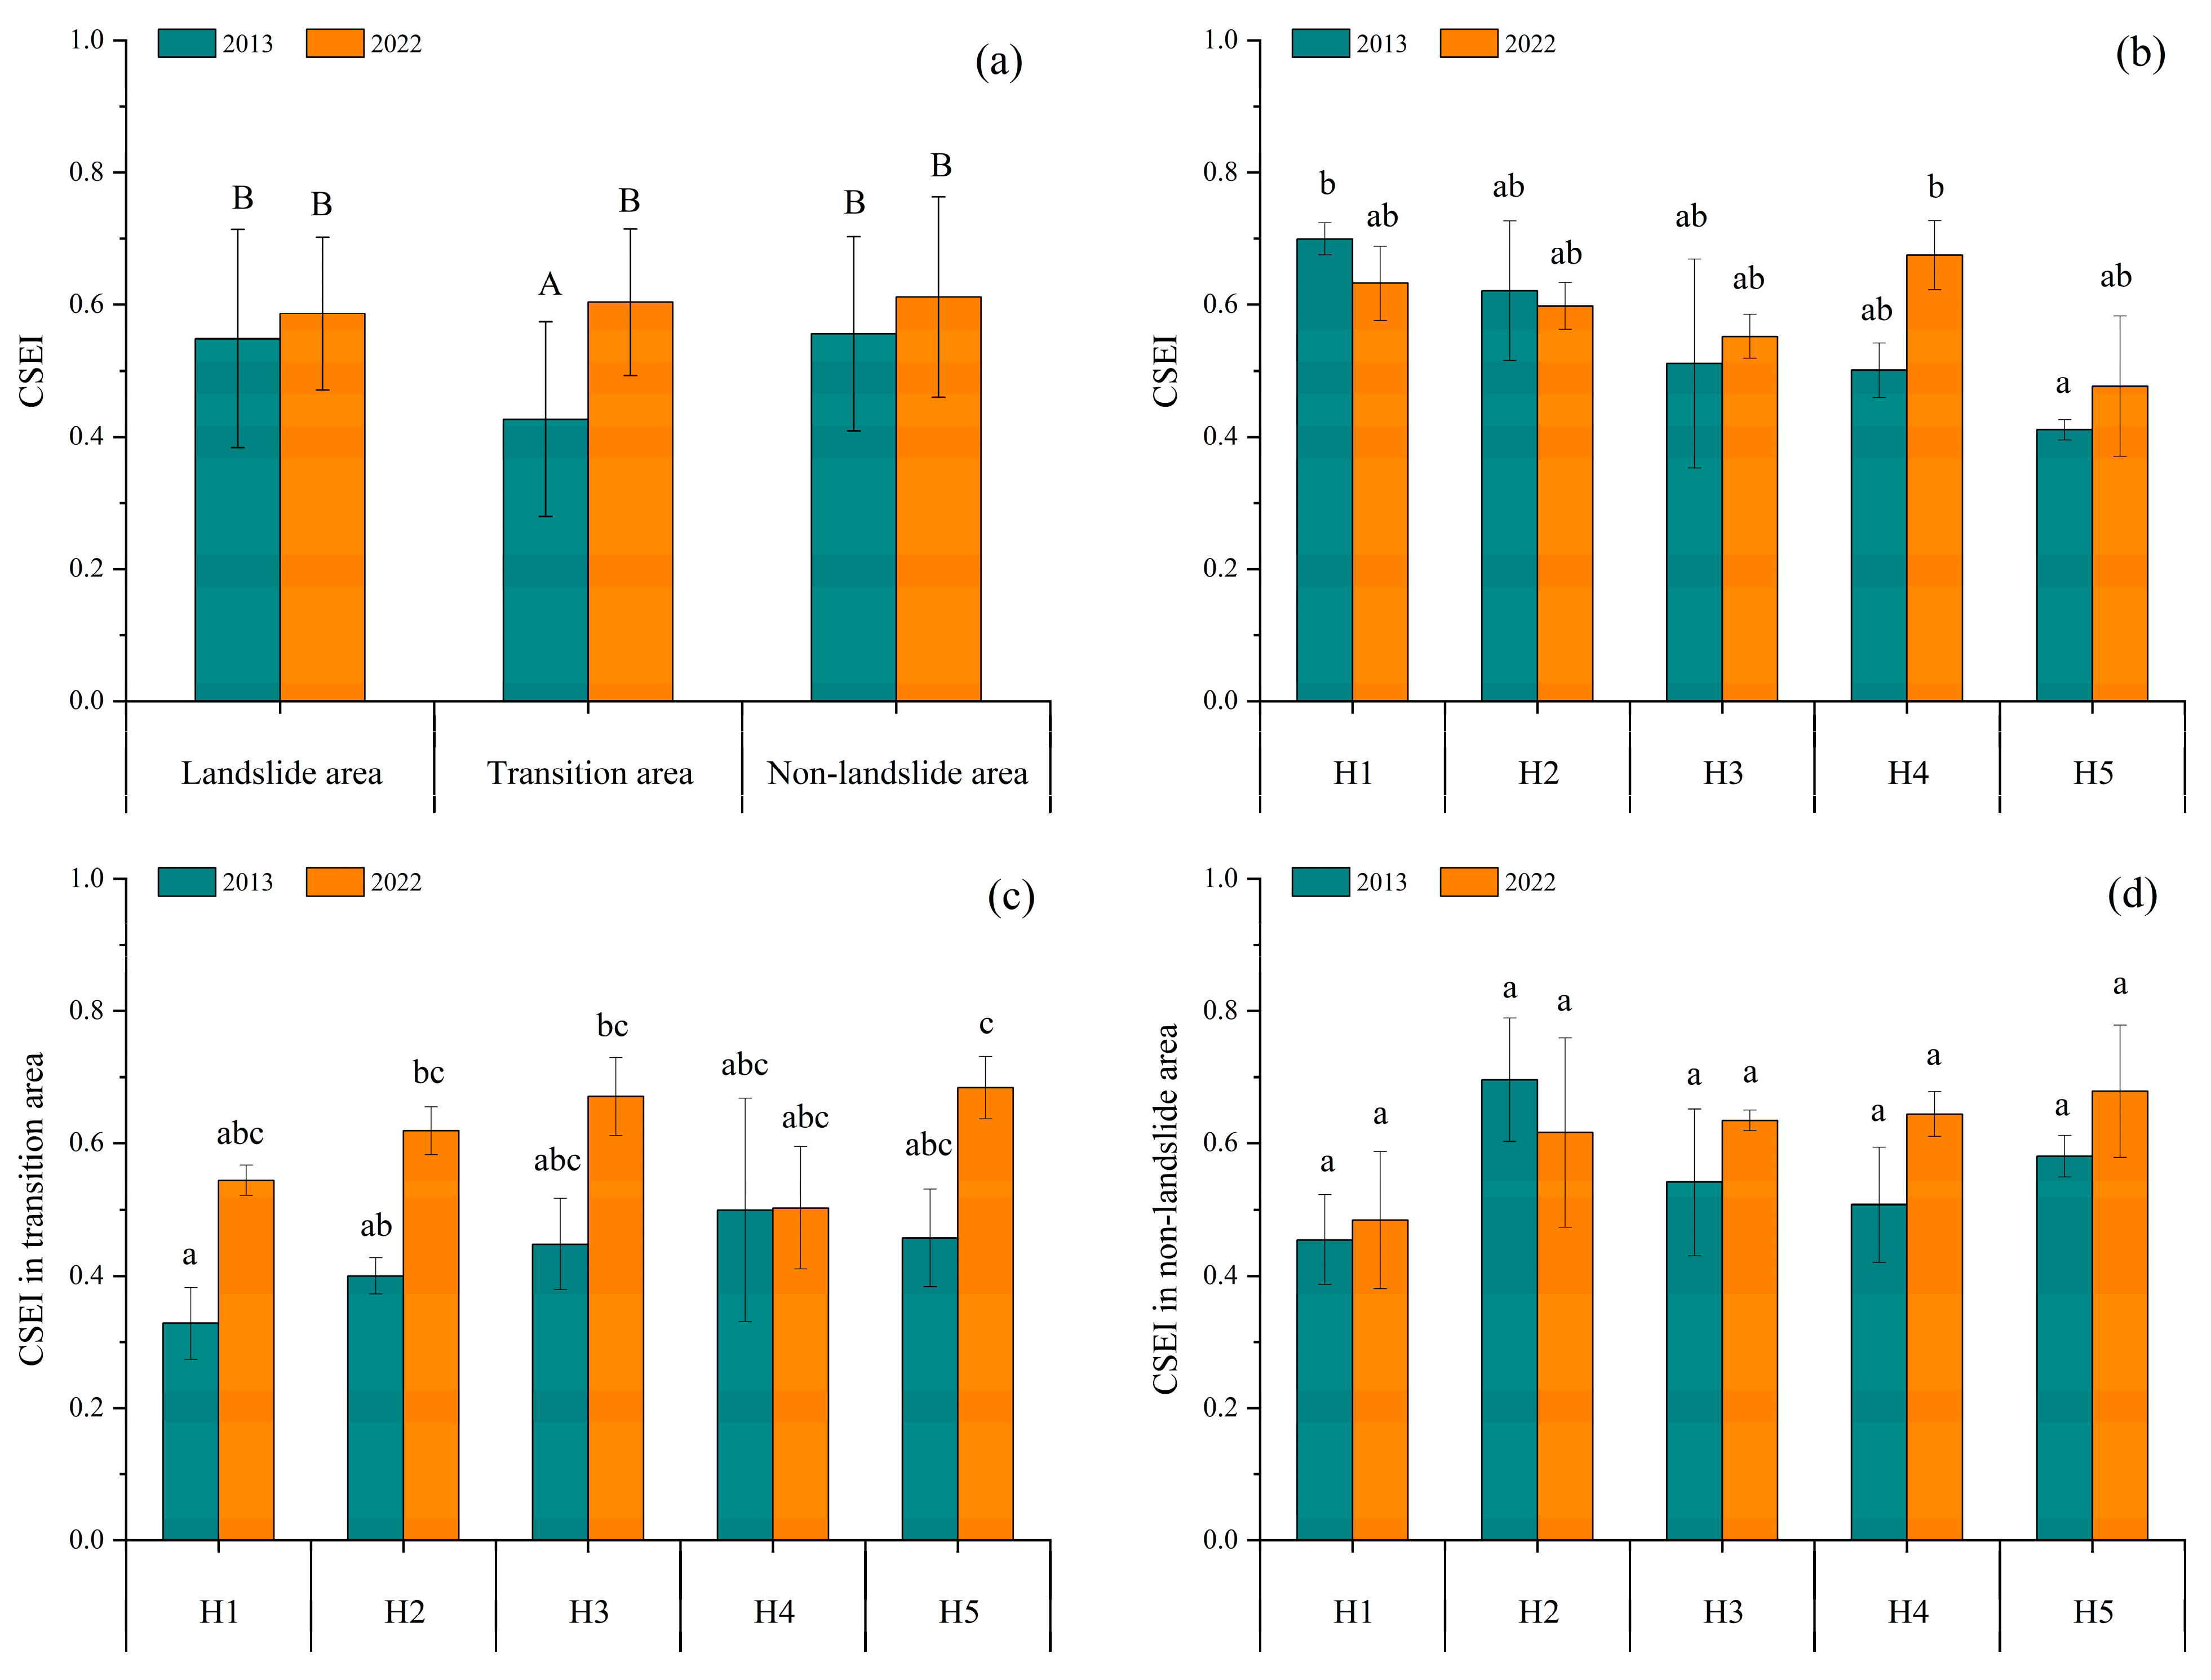
3.2.1. Temporal Variation Characteristics of CSEI

As shown in Figure 7a, the mean value of the CSEI in the landslide area and non-landslide area in 2022 increased 6.9% and 10.0% higher than that in 2013, respectively. Meanwhile, the mean value of the CSEI of transition area in 2022 was significantly higher than that in 2013.
In the landslide area, the mean value of the CSEI showed a downward trend from H1 to H5 along the altitude. At H1 and H2, the CSEI in 2013 was higher than that in 2022. However, the CSEI in 2013 was lower than that in 2022 at H3, H4, and H5 (Figure 7b). In the transition area and non-landslide area, the mean value of the CSEI showed an uptrend from H1 to H5 along the altitude. At all altitude segments, the CSEI in 2022 was higher than that in 2013, which reached to no significant differences.
Comparing the CSEI of different altitude segments in the same year, it was found that there is no significant difference in the transition area and non-landslide area (Figure 7c,d). Nevertheless, in the landslide area, the CSEI at H1 was significantly higher than that at H5 in 2013, and no significant difference was observed in 2022 (Figure 7b).

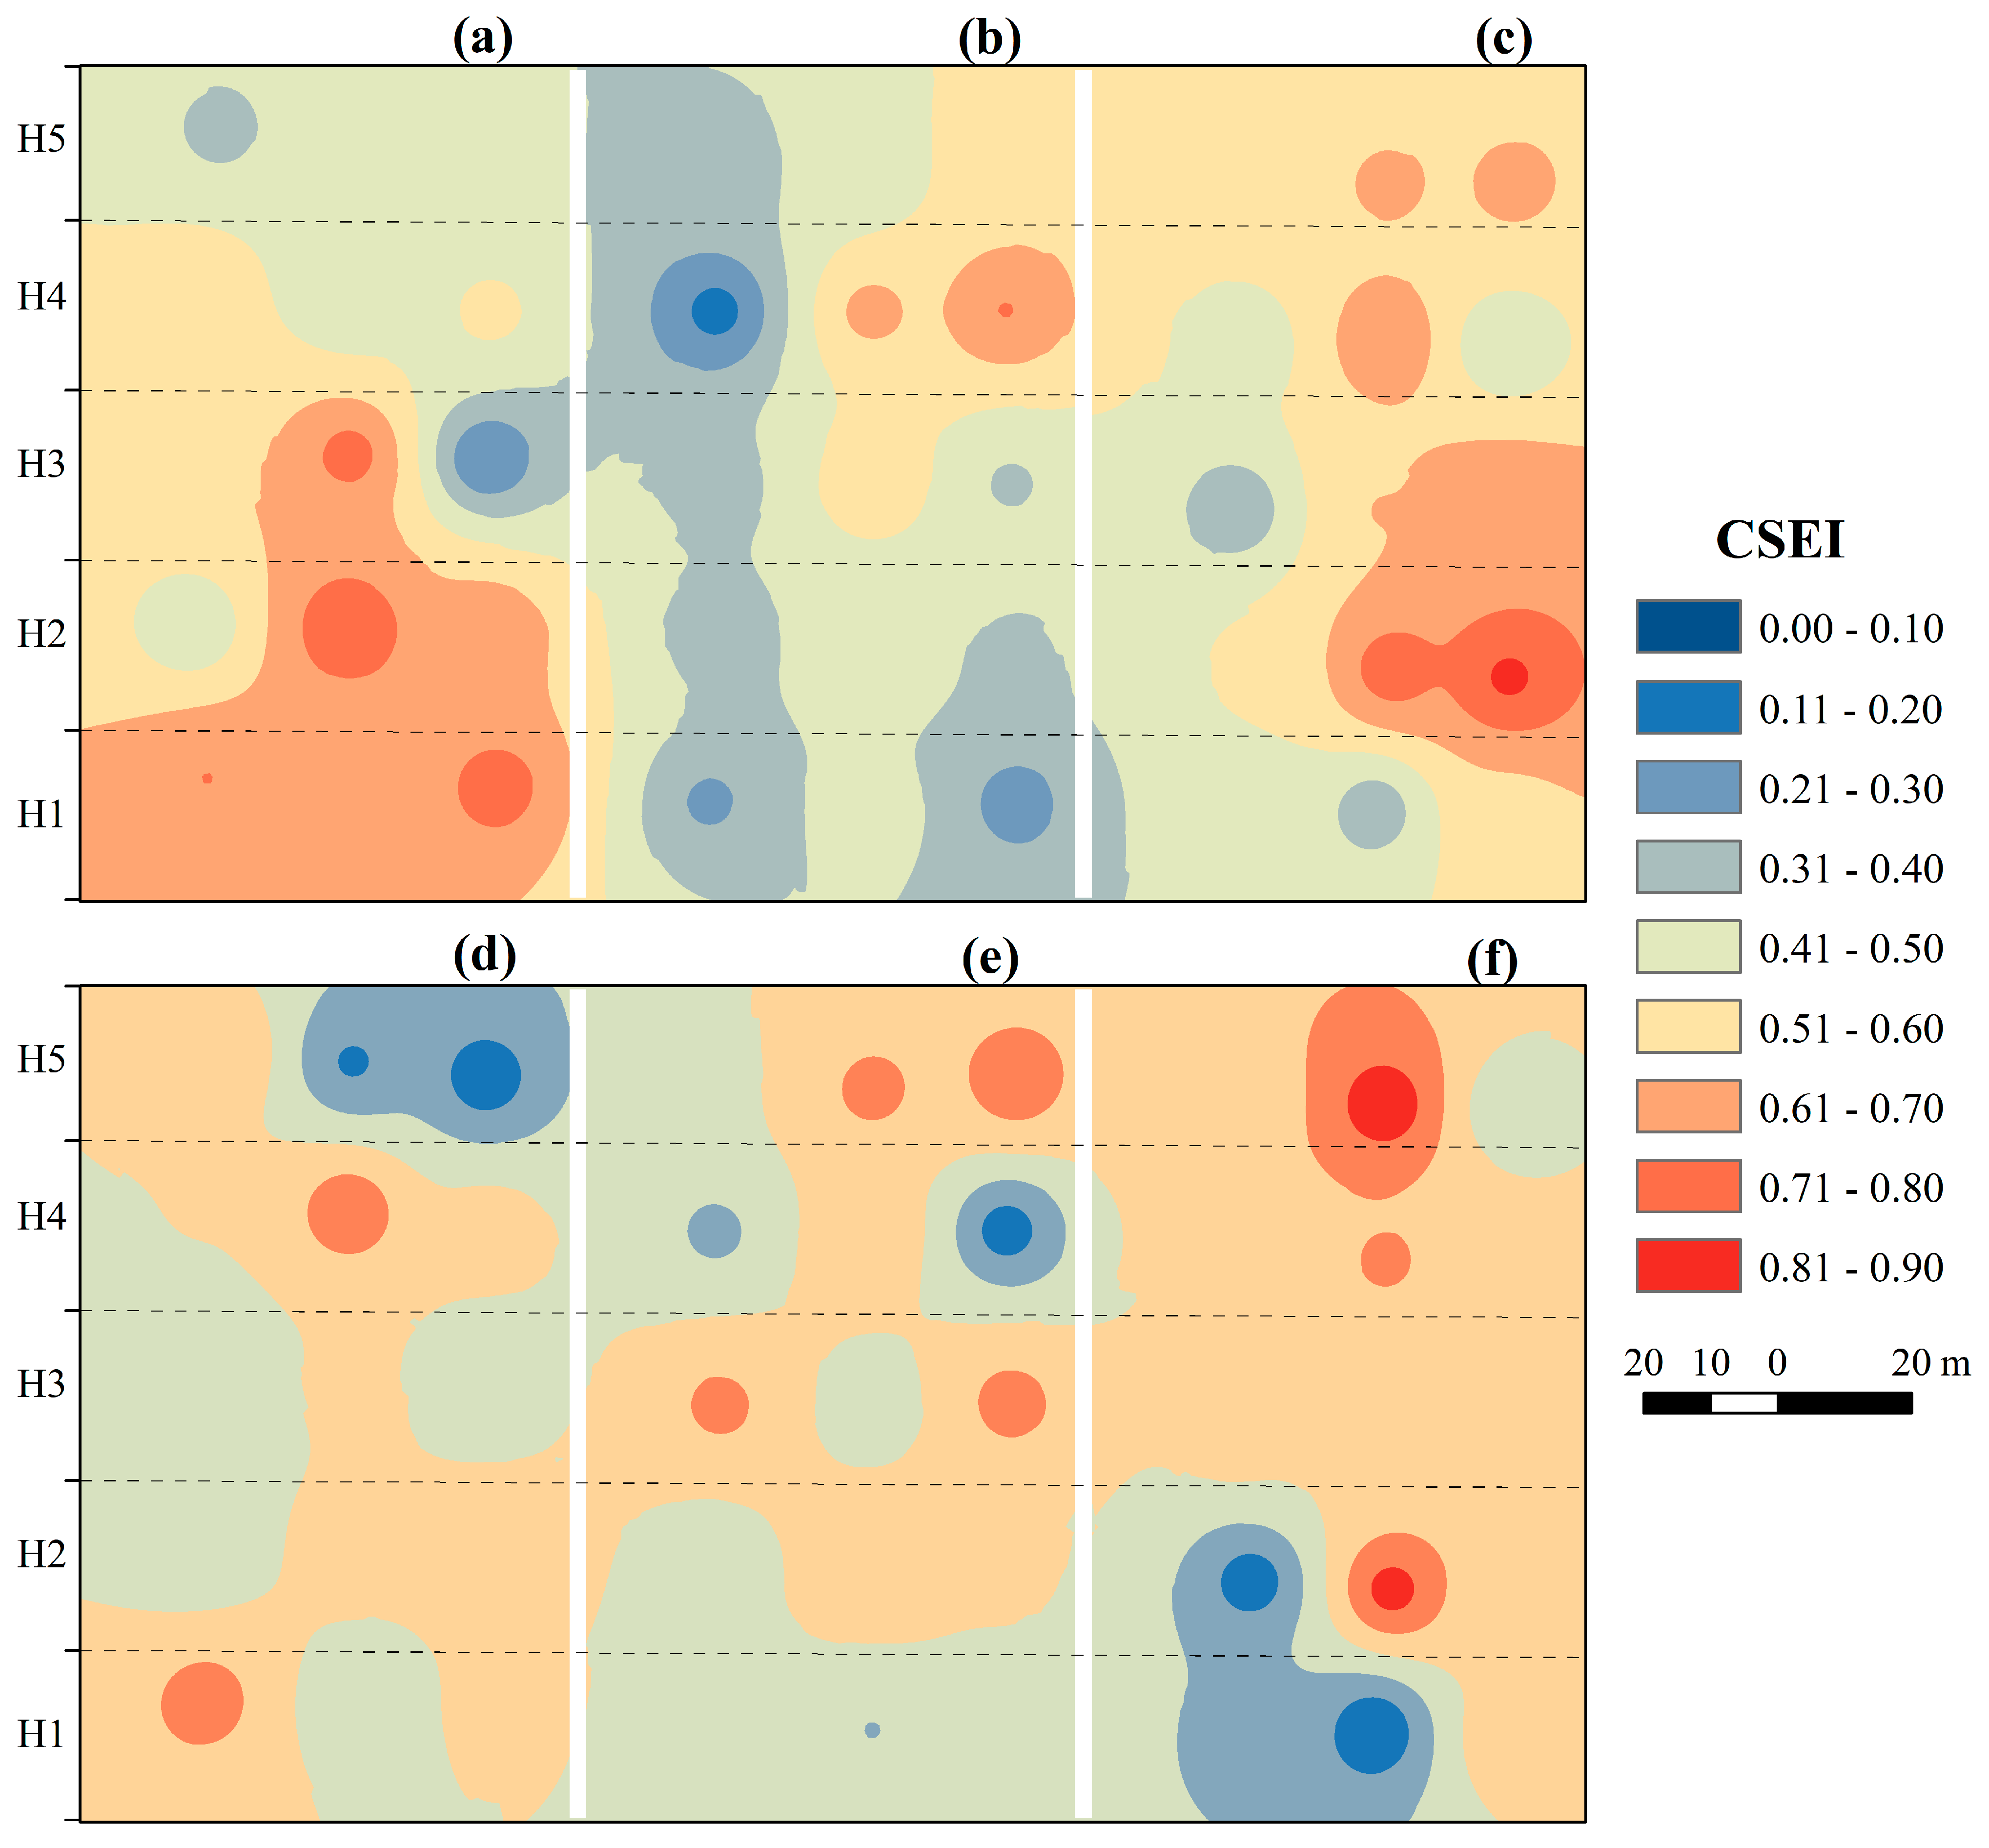
3.2.2. Spatial Variation Characteristics of CSEI

The CSEI in different years showed a patchy distribution pattern. In 2013, the CSEI generally was higher in the landslide areas and non-landslide areas, and relatively lower in the transition areas. The high CSEI value appeared in lower parts of the landslide area, the right and upper parts of the transition area, and the right and lower parts of the non-landslide area. Compared to 2013, the CSEI in 2022 distributed more uniformly. The high CSEI value appeared in the upper part of the transition area and non-landslide area. And the low CSEI value appeared in the upper part of the landslide area and the lower part of the non-landslide area (Figure 8).

3.2.3. Geostatistical Characteristics of CSEI

The semi-variance function model and related parameters of the CSEI in different years are shown in Table 3. The optimal fit models in 2013 and 2022 were Gaussian function and exponential function, respectively. However, the R2 values in 2013 and 2022 were very small, indicating that the fitting degrees were not good. The nugget values in different years are small, indicating that the random variation caused by the experimental sampling error was small. The variable ranges of CSEI were 19 m in 2013 and 23 m in 2022, respectively, indicating that spatial continuity in 2022 is better than that in 2013. The C0/(C+C0) in 2013 and 2022 was between 25% and 75% indicating moderate spatial autocorrelation.

4. Discussion

The soil pH of the research areas decreased towards acidity. The landslide area and transition area may be due to the accumulation of litter generated by plant growth and development on the soil surface, which is decomposed by microorganisms to form humus. Humus was rich in humic acid and fulvic acid, causing the soil to turn from alkaline to acidic [47,48]. The non-landslide area may be due to the high demand for soil nutrients during the natural vegetation restoration process, continuous consumption of nutrients, and intensified leaching caused by concentrated rainfall during the rainy season, leading to the loss in alkaline base salts such as calcium and magnesium, resulting in a decrease in the soil pH value with the increase in the vegetation restoration years. Research has shown that natural vegetation restoration after returning farmland leads to a continuous increase in soil organic carbon and total nitrogen [49]. There is a negative correlation (p < 0.05) between the soil pH value and soil organic carbon content. It indicated that afforestation has a significant neutralizing effect on soil pH, making alkaline soil closer to neutral [50].
With the restoration of vegetation, exposed rocks undergo disintegration and fragmentation into gravel, causing the gravel to undergo chemical weathering, resulting in the overall development of soil particles into fine particles, and the soil texture changing from coarse to fine [51]. In this study, the aggregate characteristics of the three sample plots in the landslide site were improved, and the soil erodibility of the landslide area was enhanced. The average weight and diameter of water-stable aggregates in this study increased with the vegetation restoration. The possible reason for this result may be that the increase in soil clay content and organic carbon content improved the soil nutrient conditions and soil properties [5]. In addition, the increase in tall vegetation in the landslide site can improve the site conditions of the forest [2].
At the same time, the TN in the landslide area also showed increase trend, indicating that the number of arbor forests in the landslide area increased with vegetation restoration, forming mixed forests, and the TN was significantly higher than that in 2013. And vegetation restoration may improve the TN to some extent; mixed forests have a higher TN than pure forests, which is more conducive to stand stability [7,52]. The stability of the soil’s water-stable aggregates affects soil erodibility and is also an important indicator reflecting soil erodibility [53]. In this study, Kepic in the landslide area was significantly higher in 2022 than in 2013. The reason may be that the quality of surface soil in the landslide area after the earthquake is relatively poor, and the exposed area of bedrock results in little clay particles [54,55]. With vegetation restoration, the increase in the understory vegetation and litter and the increase in topsoil from the upper part of the landslide area led to the significant increase in Kepic.
Soil aggregate stability is also affected by soil moisture and soil temperature [56,57]. Therefore, soil erodibility also has obvious seasonal changes and zonal differences [11,32,58]. Since the physicochemical soil properties also have obvious spatial differences, even under the same soil conditions, the soil properties and vegetation cover are both factors that affect soil erodibility [59]. And uncertainty in either factor can lead to changes in soil erodibility. In 2022, the CSEI gradually increased from the landslide areas to non-landslide areas. This may be due to the fact that in the early stage of the landslide after the earthquake, the unstable topsoil in the upper part of the landslide area accumulated in the lower part of landslide area. Due to water erosion, the original fine particles of covered topsoil were lost, resulting in coarse soil particles exposure, resulting in a decrease in soil erodibility. With the restoration of vegetation, the improvement effect of vegetation roots on soil and chemical weathering, the proportion of fine soil particles or fine soil aggregates increased [60] resulted in the increase in CSEI.
Due to the many factors affecting soil erodibility, this study only collected the surface soil samples for experiments and used five soil indicators to analyze soil erodibility. However, unmeasured soil indicators such as soil bulk density, porosity, saturated hydraulic conductivity, and vegetation root distribution characteristics all affect soil erodibility. Furthermore, local soil loss driven by rainstorm resulted to uneven spatial distribution of soil erodibility. Therefore, more factors need to be considered to study the role of vegetation restoration in soil properties and soil erodibility changes.

5. Conclusions

During the process of vegetation restoration (5 years and 14 years after Wenchuan earthquake), the D, MWD, TN, and Kepic turned to higher significantly, whereas soil pH changed from alkaline to neutral. Compared with the non-landslide area, the MWD, TN, Kepic, and soil pH of the landslide area were significantly lower in 2013. However, there was no significant difference between the non-landslide area and landslide area in 2022. The gaps in the soil indicators related to soil erodibility between the landslide and non-landslide areas decreased with an increase in the vegetation restoration time. The values of the CSEI in 2022 were higher than those in 2013. The CSEI of the landslide area was lower than that of the non-landslide area. And the gaps in the CSEI between the landslide area and non-landslide area increased slightly from 2013 to 2022. Spatial autocorrelation was moderate, and the spatial distribution of soil erodibility in 2022 is more uniform than that in 2013. The higher value of CSEI was transferred from the middle and lower parts in 2013 to the upper part of research areas in 2022, and the variable range was between 19 m and 23 m. In the early stage of vegetation restoration after earthquake/landslide, such as 5–14 years, soil erodibility became even higher in similar areas. Accordingly, the issue of soil erosion during this period should be given more attention. And structural measures, such as stone barriers, retaining walls, and ditches, are recommended to reduce soil loss.

Author Contributions

Conceptualization, J.Z., and Y.W.; methodology, J.Y. and G.H.; writing—original draft preparation, J.Y., Q.C., W.H. and P.Z.; writing—review and editing, J.Z. and Y.W.; supervision, Y.W. All authors have read and agreed to the published version of the manuscript.

Funding

This research was funded by National Natural Science Foundation of China (No. 41601028), and Science and Technology Planning Project of Sichuan Province (No. 24KJPX0226).

Institutional Review Board Statement

Not applicable.

Informed Consent Statement

Not applicable.

Data Availability Statement

The data used to support the findings of this study are included within the article.

Conflicts of Interest

The authors declare that there are no conflicts of interest regarding the publication of this paper.

References

  1. Chigira, M.; Wu, X.; Inokuchi, T.; Wang, G. Landslides Induced by the 2008 Wenchuan Earthquake, Sichuan, China. Geomorphology 2010, 118, 225–238. [Google Scholar] [CrossRef]
  2. Wang, X.; Fan, X.; Fang, C.; Dai, L.; Zhang, W.; Zheng, H.; Xu, Q. Long-term Landslide Evolution and Restoration after the Wenchuan Earthquake Revealed by Time-series Remote Sensing Images. Geophys. Res. Lett. 2024, 51, e2023GL106422. [Google Scholar] [CrossRef]
  3. Zhang, L.; Xiao, T.; He, J.; Chen, C. Erosion-Based Analysis of Breaching of Baige Landslide Dams on the Jinsha River, China, in 2018. Landslides 2019, 16, 1965–1979. [Google Scholar] [CrossRef]
  4. Li, P.; Wang, J.; Hu, K.; Shen, F. Effects of Bed Longitudinal Inflexion and Sediment Porosity on Basal Entrainment Mechanism: Insights from Laboratory Debris Flows. Landslides 2021, 18, 3041–3062. [Google Scholar] [CrossRef]
  5. Wang, J.; Sun, G.; Shi, F.; Lu, T.; Wang., Q.; Wu, Y.; Wu, N.; Oli, K.P. Runoff and soil loss in a typical subtropical evergreen forest stricken by the wenchuan earthquake: Their relationships with rainfall, slope inclination, and vegetation cover. J. Soil Water Conserv. 2014, 69, 65–74. [Google Scholar] [CrossRef]
  6. Chen, H.S.; Wang, X.K.; Lei, S.; Wang, X.X.; Yan, X.F. Soil Erosion Characteristics in an Earthquake-Impacted Mountainous Basin Based on RUSLE Model: Implications for Geohazards. J. Soils Sediments 2023, 23, 3857–3878. [Google Scholar] [CrossRef]
  7. Lyu, D.; Yang, Y.; Zhao, W.; Xu, X.; He, L.; Guo, J.; Lei, S.; Liu, B.; Zhang, X. Effects of Different Vegetation Restoration Types on Soil Hydro-Physical Properties in the Hilly Region of the Loess Plateau, China. Soil Res. 2022, 61, 94–105. [Google Scholar] [CrossRef]
  8. Yan, Y.; Dai, Q.; Yang, Y.; Lan, X. Effects of Vegetation Restoration Types on Soil Erosion Reduction of a Shallow Karst Fissure Soil System in the Degraded Karst Areas of Southwestern China. Land Degrad. Dev. 2023, 34, 2241–2255. [Google Scholar] [CrossRef]
  9. Sun, H.; Luo, L.; Guo, W.; Hu, X.; Xu, Y.; Wang, W. Exploring Rational Vegetation Configuration to Relative Increase Runoff, Reduce Erosion and Soil Organic Carbon Loss in Gully-Slopes on the Chinese Loess Plateau. J. Hydrol. 2024, 640, 131678. [Google Scholar] [CrossRef]
  10. Rajbanshi, J.; Das, S.; Paul, R. Quantification of the Effects of Conservation Practices on Surface Runoff and Soil Erosion in Croplands and Their Trade-off: A Meta-Analysis. Sci. Total Environ. 2023, 864, 161015. [Google Scholar] [CrossRef]
  11. Wu, Y.; Yu, X.; Jia, G. Seasonal Variation of Soil Erodibility Under Vegetation Restoration in the Agro-Pastoral Ecotone of Northern China. J. Soil Sci. Plant Nutr. 2023, 23, 2331–2343. [Google Scholar] [CrossRef]
  12. Wu, Y.; Jia, G.; Yu, X.; Rao, H.; Peng, X.; Wang, Y.; Wang, Y.; Wang, X. Response of Soil Nutrients and Erodibility to Slope Aspect in the Northern Agro-Pastoral Ecotone, China. SOIL 2024, 10, 61–75. [Google Scholar] [CrossRef]
  13. Zhang, B.; Zhang, G.; Yang, H.; Wang, H. Soil Resistance to Flowing Water Erosion of Seven Typical Plant Communities on Steep Gully Slopes on the Loess Plateau of China. Catena 2019, 173, 375–383. [Google Scholar] [CrossRef]
  14. Zeng, R.; Zhang, G.; Su, X.; Wang, C. Soil Erosion Resistance of Gully System under Different Plant Communities on the Loess Plateau of China. Earth Surf. Pro. Landf. 2024, 49, 1748–1761. [Google Scholar] [CrossRef]
  15. Batista, P.V.G.; Evans, D.L.; Cândido, B.M.; Fiener, P. Does Soil Thinning Change Soil Erodibility? An Exploration of Long-Term Erosion Feedback Systems. SOIL 2023, 9, 71–88. [Google Scholar] [CrossRef]
  16. Fomicheva, D.V.; Zhidkin, A.P.; Komissarov, M.A. Multiscale Estimates of Soil Erodibility Variation under Conditions of High Soil Cover Heterogeneity in the Northern Forest-Steppe of the Central Russian Upland. Eurasian Soil Sci. 2024, 57, 325–336. [Google Scholar] [CrossRef]
  17. Kašanin-Grubin, M.; Hukić, E.; Bellan, M.; Bialek, K.; Bosela, M.; Coll, L.; Czacharowski, M.; Gajica, G.; Giammarchi, F.; Gömöryová, E.; et al. Soil Erodibility in European Mountain Beech Forests. Can. J. For. Res. 2021, 51, 1846–1855. [Google Scholar] [CrossRef]
  18. Wang, H.; Zhang, G.; Li, N.; Zhang, B.; Yang, H. Soil Erodibility as Impacted by Vegetation Restoration Strategies on the Loess Plateau of China. Earth Surf. Proc. Landf. 2019, 44, 796–807. [Google Scholar] [CrossRef]
  19. Li, Y.; Lu, B.; Zhou, H.; Zhang, Y.; Zhao, Z.; Chen, W.; Wu, Y.; Guo, Z.; Jiang, J.; Xue, S. Effects of Degradation Level and Vegetation Recovery Age on Soil Erodibility of Alpine Grasslands on the Qinghai−Tibetan Plateau. J. Soils Sediments 2024, 24, 294–306. [Google Scholar] [CrossRef]
  20. Liu, J.; Chen, L.; Wang, B.; Peng, X. Effects of Physical Crust on Soil Detachment by Overland Flow in the Loess Plateau Region of China. Int. Soil Water Conse. Res. 2024, 12, 107–120. [Google Scholar] [CrossRef]
  21. Zhang, P.; Yao, W.; Liu, G.; Xiao, P. Experimental Study on Soil Erosion Prediction Model of Loess Slope Based on Rill Morphology. Catena 2019, 173, 424–432. [Google Scholar] [CrossRef]
  22. Sun, L.; Wu, S.; Hill, R.L.; Guo, H.; Feng, H. The Effects of Three Micro-Catchment Practices on Erosion and Runoff Dynamics for a Typical Soil Slope on the Loess Plateau of China. Can. J. Soil. Sci. 2019, 99, 46–59. [Google Scholar] [CrossRef]
  23. Olson, T.C.; Wischmeier, W. Soil-Erodability Evaluations for Soils on the Runoff and Erosion Stations. Soil Sci. Soc. Am. J. 1963, 27, 590–592. [Google Scholar] [CrossRef]
  24. Liu, X.; Zhang, Y.; Li, P. Spatial Variation Characteristics of Soil Erodibility in the Yingwugou Watershed of the Middle Dan River, China. Int. J. Environ. Res. Public Health 2020, 17, 3568. [Google Scholar] [CrossRef] [PubMed]
  25. Lin, H.; Cheng, X.; Bruijnzeel, L.A.; Duan, X.; Zhang, J.; Chen, L.; Zheng, H.; Lu, S.; Dong, Y.; Huang, J.; et al. Land Degradation and Climate Change Lessened Soil Erodibility across a Wide Area of the Southern Tibetan Plateau over the Past 35–40 Years. Land Degrad. Dev. 2023, 34, 2636–2651. [Google Scholar] [CrossRef]
  26. Al-Omran, A.; Ibrahim, A.; Alharbi, A. Effects of Biochar and Compost on Soil Physical Quality Indices. Commun. Soil Sci. Plan. 2021, 52, 2482–2499. [Google Scholar] [CrossRef]
  27. Bennett, H. Some Comparisons of the Properties of Humid-Tropical and Humid-Temperate American Soils, with Special Reference to Indicated Relations between Chemical Composition and Physical Properties. Soil Sci. 1926, 21, 349–376. [Google Scholar] [CrossRef]
  28. Middleton, H.E. Properties of Soils Which Influence Soil Erosion; US Department of Agriculture: Washington, DC, USA, 1930.
  29. Bouyoucos, G.J. The Clay Ratio as a Criterion of Susceptibility of Soils to Erosion 1. Agron. J. 1935, 27, 738–741. [Google Scholar] [CrossRef]
  30. Vahabi, J.; Nikkami, D. Assessing dominant factors affecting soil erosion using a portable rainfall simulator. Int. J. Sediment Res. 2008, 23, 376–386. [Google Scholar] [CrossRef]
  31. Peele, T. The Relation of Certain Physical Characteristics to the Erodibility of Soils. Soil Sci. Soc. Am. J. 1938, 2, 97–100. [Google Scholar] [CrossRef]
  32. Lan, J. Changes of Soil Aggregate Stability and Erodibility After Cropland Conversion in Degraded Karst Region. J. Soil Sci. Plant Nutr. 2021, 21, 3333–3345. [Google Scholar] [CrossRef]
  33. Obour, P.B.; Oppong Danso, E.; Dorvlo, S.Y.; Arthur, E. Soil Aggregate Stability Quantified by Different Methods Is Unaffected by Rice Straw Biochar in the Long Term. Soil Sci. Soc. Am. J. 2023, 87, 1018–1028. [Google Scholar] [CrossRef]
  34. Wischmeier, W.H. A Soil Erodibility Nomograph for Farmland and Construction Sites. J. Soil Water Conserv. 1971, 26, 189–193. [Google Scholar]
  35. Huang, R.; Xu, Q.; Huo, J. Mechanism and Geo-Mechanics Models of Landslides Triggered by 5.12 Wenchuan Earthquake. J. Mt. Sci. 2011, 8, 200–210. [Google Scholar] [CrossRef]
  36. Shannon, C.E.; Wiener, W. The Mathematical Theory of Communities; University of Illinois Press: Champaign, IL, USA, 1963. [Google Scholar]
  37. Simpson, E.H. The measurement of diversity. Nature 1949, 163, 63–88. [Google Scholar] [CrossRef]
  38. Pielou, E.C. Shannon’s Formula as a Measure of Specific Diversity: Its Use and Misuse. Am. Nat. 1966, 100, 463–465. [Google Scholar] [CrossRef]
  39. Strong, W.L. Biased Richness and Evenness Relationships within Shannon–Wiener Index Values. Ecol. Indic. 2016, 67, 703–713. [Google Scholar] [CrossRef]
  40. Shi, Y.; Zhang, Q.; Liu, X.; Jing, X.; Shi, C.; Zheng, L. Organic Manure Input and Straw Cover Improved the Community Structure of Nitrogen Cycle Function Microorganism Driven by Water Erosion. Int. Soil Water Conse. Res. 2022, 10, 129–142. [Google Scholar] [CrossRef]
  41. Liu, Q.; Li, J.; Guo, Z.; Chang, C.; Wang, H. The Relationships between Root Traits and the Soil Erodibility of Farmland Shelterbelts in the Bashang Region of China. Forests 2023, 14, 1827. [Google Scholar] [CrossRef]
  42. Le Bissonnais, Y. Aggregate Stability and Assessment of Soil Crustability and Erodibility: I. Theory and Methodology. Eur. J. Soil Sci. 1996, 47, 425–437. [Google Scholar] [CrossRef]
  43. Xia, J.; Zhao, Z.; Fang, Y. Soil Hydro-Physical Characteristics and Water Retention Function of Typical Shrubbery Stands in the Yellow River Delta of China. Catena 2017, 156, 315–324. [Google Scholar] [CrossRef]
  44. Parysow, P.; Wang, G.; Gertner, G.; Anderson, A.B. Spatial Uncertainty Analysis for Mapping Soil Erodibility Based on Joint Sequential Simulation. Catena 2003, 53, 65–78. [Google Scholar] [CrossRef]
  45. Li, Y.; He, X.; Lin, D.; Wei, P.; Zhou, L.; Zeng, L.; Qian, S.; Zhao, L.; Yang, Y.; Zhu, G. Effects of Fractal Dimension and Soil Erodibility on Soil Quality in an Erodible Region: A Case Study from Karst Mountainous Areas. Forests 2023, 14, 1609. [Google Scholar] [CrossRef]
  46. Bajracharya, R.; Lal, R.; Kimble, J. Soil Organic Carbon Distribution in Aggregates and Primary Particle Fractions as Influenced by Erosion Phases and Landscape Position. Soil Processes and the Carbon Cycle; CRC Press: Boca Raton, FL, USA, 2018; pp. 353–367. [Google Scholar]
  47. Chang, W.; Song, Q.; Zheng, X.; Li, C.; Wang, L.; Li, H.; Zhang, L.; You, C.; Xu, H.; Xu, L.; et al. Leaf Trait Variations and Correlations across Four Forests with Similar Mean Annual Precipitation in Northern China. Ecol. Indic. 2024, 165, 112199. [Google Scholar] [CrossRef]
  48. Jonczak, J.; Oktaba, L.; Pawłowicz, E.; Chojnacka, A.; Regulska, E.; Słowińska, S.; Olejniczak, I.; Oktaba, J.; Kruczkowska, B.; Kondras, M. Soil Organic Matter Transformation Influenced by Silver Birch (Betula pendula Roth) Succession on Abandoned from Agricultural Production Sandy Soil. Eur. J. Forest Res. 2023, 142, 367–379. [Google Scholar] [CrossRef]
  49. Feng, N.; Liu, D.; She, D. Effects of Vegetation Restoration on Carbonate-derived Laterite Erodibility in Karst Mountain Areas. Land Degrad. Dev. 2022, 33, 1347–1365. [Google Scholar] [CrossRef]
  50. Hong, S.; Piao, S.; Chen, A.; Liu, Y.; Liu, L.; Peng, S.; Sardans, J.; Sun, Y.; Peñuelas, J.; Zeng, H. Afforestation Neutralizes Soil pH. Nat. Commun. 2018, 9, 520. [Google Scholar] [CrossRef]
  51. Maffre, P.; Godderis, Y.; Pohl, A.; Donnadieu, Y.; Carretier, S.; Le Hir, G. The Complex Response of Continental Silicate Rock Weathering to the Colonization of the Continents by Vascular Plants in the Devonian. Am. J. Sci. 2022, 322, 461–492. [Google Scholar] [CrossRef] [PubMed]
  52. Hu, P.; Zhao, Y.; Xiao, D.; Xu, Z.; Zhang, W.; Xiao, J.; Wang, K. Dynamics of Soil Nitrogen Availability Following Vegetation Restoration along a Climatic Gradient of a Subtropical Karst Region in China. J. Soils Sediments 2021, 21, 2167–2178. [Google Scholar] [CrossRef]
  53. Liang, P.; Wang, X.; Xu, Q.; Zhang, J.; Fang, R.; Fu, Z.; Chen, H. Lithology-mediated Soil Erodibility Characteristics after Vegetation Restoration in the Karst Region of Southwest China. Land Degrad. Dev. 2024, 35, 1074–1086. [Google Scholar] [CrossRef]
  54. Chang, D.S.; Zhang, L.M.; Xu, Y.; Huang, R.Q. Field Testing of Erodibility of Two Landslide Dams Triggered by the 12 May Wenchuan Earthquake. Landslides 2011, 8, 321–332. [Google Scholar] [CrossRef]
  55. Nampak, H.; Pradhan, B.; Mojaddadi Rizeei, H.; Park, H. Assessment of Land Cover and Land Use Change Impact on Soil Loss in a Tropical Catchment by Using Multitemporal SPOT -5 Satellite Images and R Evised U Niversal Soil L Oss E Quation Model. Land Degrad. Dev. 2018, 29, 3440–3455. [Google Scholar] [CrossRef]
  56. Ai, X.; Wang, L.; Xu, D.; Rong, J.; Ai, S.; Liu, S.; Li, C.; Ai, Y. Stability of Artificial Soil Aggregates for Cut Slope Restoration: A Case Study from the Subalpine Zone of Southwest China. Soil Tillage Res. 2021, 209, 104934. [Google Scholar] [CrossRef]
  57. Giovannini, G.; Vallejo, R.; Lucchesi, S.; Bautista, S.; Ciompi, S.; Llovet, J. Effects of Land Use and Eventual Fire on Soil Erodibility in Dry Mediterranean Conditions. Forest Ecol. Manag. 2001, 147, 15–23. [Google Scholar] [CrossRef]
  58. Corella, J.P.; Benito, G.; Wilhelm, B.; Montoya, E.; Rull, V.; Vegas-Vilarrúbia, T.; Valero-Garcés, B.L. A Millennium-Long Perspective of Flood-Related Seasonal Sediment Yield in Mediterranean Watersheds. Global Planet. Change 2019, 177, 127–140. [Google Scholar] [CrossRef]
  59. Sun, R.; Wu, Z.; Lan, G.; Yang, C.; Fraedrich, K. Effects of Rubber Plantations on Soil Physicochemical Properties on Hainan Island, China. J. Environ. Qual. 2021, 50, 1351–1363. [Google Scholar] [CrossRef]
  60. Guo, M.; Wang, W.; Kang, H.; Yang, B.; Li, J. Changes in Soil Properties and Resistance to Concentrated Flow across a 25-year Passive Restoration Chronosequence of Grasslands on the Chinese Loess Plateau. Restor. Ecol. 2020, 28, 104–114. [Google Scholar] [CrossRef]
Figure 1. Research areas and soil sampling points (The photo taken in 2013).
Forests 15 01352 g001
Figure 2. Comparisons of D among different research areas (a) and D among different altitude segments in landslide area (b), transition area (c), and non-landslide area (d). Data are expressed as means ± standard error. Different uppercase letters indicate significant differences among different research areas (n = 15), and different lowercase letters indicate significant differences among different altitude segments for each research area (n = 3) at p < 0.05.
Forests 15 01352 g002
Figure 3. Comparisons of MWD among different research areas (a) and MWD among different altitude segments in landslide area (b), transition area (c), and non-landslide area (d). Data are expressed as means ± standard error. Different uppercase letters indicate significant differences among different research areas (n = 15), and different lowercase letters indicate significant differences among different altitude segments for each research area (n = 3) at p < 0.05.
Forests 15 01352 g003
Figure 4. Comparisons of soil pH among different research areas (a) and soil pH among different altitude segments in landslide area (b), transition area (c), and non-landslide area (d). Data are expressed as means ± standard error. Different uppercase letters indicate significant differences among different research areas (n = 15), and different lowercase letters indicate significant differences among different altitude segments for each research area (n = 3) at p < 0.05.
Forests 15 01352 g004
Figure 5. Comparisons of soil TN among different research areas (a) and soil TN among different altitude segments in landslide area (b), transition area (c), and non-landslide area (d). Data are expressed as means ± standard error. Different uppercase letters indicate significant differences among different research areas (n = 15), and different lowercase letters indicate significant differences among different altitude segments for each research area (n = 3) at p < 0.05.
Forests 15 01352 g005
Figure 6. Comparisons of Kepic among different research areas (a) and Kepic among different altitude segments in landslide area (b), transition area (c), and non-landslide area (d). Data are expressed as means ± standard error. Different uppercase letters indicate significant differences among different research areas (n = 15), and different lowercase letters indicate significant differences among different altitude segments for each research area (n = 3) at p < 0.05.
Forests 15 01352 g006
Figure 7. Comparisons of CSEI among different research areas (a) and CSEI among different altitude segments in landslide area (b), transition area (c), and non-landslide area (d). Data are expressed as means ± standard error. Different uppercase letters indicate significant differences among different research areas (n = 15), and different lowercase letters indicate significant differences among different altitude segments for each research area (n = 3) at p < 0.05.
Forests 15 01352 g007
Figure 8. Spatial distribution map of comprehensive soil erodibility indicator (CSEI) of landslide area (a), transition area (b), non-landslide area (c) in 2013 and landslide area (d), transition area (e), non-landslide area (f) in 2022.
Forests 15 01352 g008
Table 1. Changes in diversity index of plant communities in research areas.
Research AreasYearVegetable LayerHH′JswS
Landslide area2013Arbor0.0000.0000.0000
Shrub1.4750.7180.8236
herbaceous2.3650.8330.67134
2022Arbor1.2770.6440.6148
Shrub3.3820.9470.81663
herbaceous2.8850.9030.74548
Transition area2013Arbor1.1960.6710.8634
Shrub1.7770.7850.8548
herbaceous2.5170.8180.66145
2022Arbor1.3180.7440.8078
Shrub3.1220.9290.76360
herbaceous2.7120.8820.70845
Non-landslide area2013Arbor1.5330.6620.6989
Shrub2.5290.8800.80723
herbaceous2.4370.7780.62350
2022Arbor0.3360.1170.1618
Shrub3.2640.9410.83450
herbaceous2.9900.9000.73658
Note: H, H′, Jsw, and S refer to Shannon–Wiener diversity index, Simpson dominance index, Pielou evenness index, and Richness index, respectively.
Table 2. Index systems and weight distributions of CSEI.
IndexMembership Function TypesCab
KepicS-Curve0.380.010.03
MWDAnti S-Curve0.271.774.32
DS-Curve0.192.203.51
TNAnti S-Curve0.111.845.54
pHAnti S-Curve0.057.338.25
Note: C is the weight of the evaluation index. a and b refer to the upper and the lower critical values of soil index, respectively.
Table 3. A semi variance function model and related parameters of comprehensive soil erodibility index.
YearFunctionC0C + C0C0/(C0 + C)A(m)R2RSS
2013Gaussian1.85 × 10−22.55 × 10−272.5%190.1584.78 × 10−4
2022exponential8.31 × 10−31.67 × 10−249.70%230.1052.16 × 10−4
Note: C0, C + C0, C0/(C0 + C), A, R2, and RSS refer to nugget, silt, ratio of nugget to silt, variable range, determination coefficient, and residual, respectively.
Disclaimer/Publisher’s Note: The statements, opinions and data contained in all publications are solely those of the individual author(s) and contributor(s) and not of MDPI and/or the editor(s). MDPI and/or the editor(s) disclaim responsibility for any injury to people or property resulting from any ideas, methods, instructions or products referred to in the content.

