Article

Can Ecological Protection Affect High-Quality Forestry Development?—A Case Study of China

1
College of Economics and Management, Qingdao Agricultural University, Qingdao 266109, China
2
Research Institute of Forestry Policy and Information, Chinese Academy of Forestry, Beijing 100091, China
*
Author to whom correspondence should be addressed.
Forests 2024, 15(8), 1354; https://doi.org/10.3390/f15081354
Submission received: 3 July 2024 / Revised: 18 July 2024 / Accepted: 31 July 2024 / Published: 2 August 2024
(This article belongs to the Section Forest Economics, Policy, and Social Science)

Abstract

:
As the global ecological environment faces serious challenges, ecological protection has attracted global attention. As a basic industry of the national economy, China’s total forestry output value is 8.04 trillion RMB in 2022. This study aims to assess the impact of ecological protection on high-quality forestry development and find its mechanism by using provincial panel data from 2010 to 2021 in China. The variables of environmental regulation and urbanization level were introduced. The benchmark regression model, mediation effect model and threshold effect model were employed for empirical analysis. The results show that: (1) The estimated ecological protection coefficient is 0.146. The ecological protection level significantly promotes high-quality forestry development; (2) The effect is more significant in the western region and the area with higher forest coverage. The estimated coefficients are 1.392 and 0.745. It is less affected by the marginal effect of the ecological protection level in the east; (3) The estimated environmental regulation coefficient is −0.021. Ecological protection promotes high-quality forestry development by reducing environmental regulations; (4) The impact increases with the level of urbanization. The p-value of the double threshold is 0.073. Therefore, policy recommendations are proposed to strengthen ecological protection and promote high-quality forestry development.

1. Introduction

With the development of the global economy, the deterioration of forestland resources has aroused a global concern [1]. In recent years, countries around the world have paid increasing attention to environmental protection and sustainable development, which is in line with United Nations Sustainable Development Goal 7 [2]. The United Nations Sustainable Development Goal 7.1 is “By 2023, ensure universal access to affordable, reliable and modern energy services”. Accordingly, countries have formulated national policies and some measures to protect the environment, which indirectly promote industrial development. Forestry is one of the important industries [3]. On 27 April 2017, the 71st session of the United Nations General Assembly considered and adopted the United Nations Strategic Plan for Forests (2017–2030) [4], the first global forest development strategy made in the name of the United Nations. It highlights the great importance that the international community attaches to forestry. As a member of the United Nations, China is also very important to forestry development. Forestry is irreplaceable in China’s green transformation and low-carbon development [5]. Chinese forestry output value has increased rapidly from 2.58 trillion RMB in 2010 to 6.51 trillion RMB in 2021 [6]. However, with the continuous development of high-quality forestry, forestry problems have gradually become a realistic obstacle to sustainable economic development, such as declining forest productivity, increasing demand for forest products [7] and a sharp decline in biodiversity [8]. And the emergence of ecological protection provides a historic opportunity to address this issue.
With the continuous global pursuit of sustainable development, the importance of ecological protection has become increasingly prominent. The stability of ecosystems is essential for sustaining life on Earth. Ecological protection is an important issue in the current global environmental problems. The current concept of ecological civilization requires the sustainable development of forestry, which aims to restore ecosystems and balance the harmonious development of the economy, humanity, society, and ecology. In this situation, ecological protection is particularly crucial. The sustainable development of forestry is multi-objective and multi-pathway. It is a sustainable development of the management model, which uses scientific management technology to match the new and old forest stands. In addition, it is necessary to restore and protect the forestry ecosystem. The minimization of harm to forestry business activities can be achieved by advancing management technology. Strengthening the eco-protection of forestry can realize the sustainable development of forestry [9]. The accumulation and sustainable application of forest products can be realized by improving the ecological service function [10], increasing the strength of the forestry industry [11], and developing forestry by science and technology [12]. It can promote the sustainable production of forest products, show the multiple values of forests and promote high-quality forestry development.
There is no end to the discussion on ecological protection and high-quality forestry development. Existing research has focused on four main aspects. First, ecological protection has a multifaceted impact on upgrading forestry production factors and industrial institutions. On the one hand, ecological protection can significantly increase the total forestry output value [12] and green total factor productivity [13,14]. There is a positive correlation between environmental protection courts [15], natural forest protection projects [16] and total factor productivity. Green education plays a key role in improving the quality of agricultural personnel training and promoting innovative applications of agricultural technology [17]. On the other hand, the high level of ecological protection promotes industrial transformation and upgrading [18] by technological innovation [19]. Strengthening agro-ecological environmental protection can promote economic development [20].
Second, there are differences in the impact of high-quality forestry development in different regions. On the one hand, the level of forestry industry integration is higher in the central and northeastern regions than in the eastern and western regions [21]. Compared with the western cities, the eastern and the central cities have relatively faster industrialization and urbanization [22] and higher levels of economic development [23]. In addition, the impact of the digital economy on green total factor productivity in forestry is more obvious in regions with faster economic development or richer natural resources [24]. On the other hand, forest coverage has a positive effect on agricultural total factor productivity [25], which can promote the optimal adjustment of regional industrial structure [26]. Forest coverage has increased with the development of forestry to a certain extent [27].
The third is the impact of environmental regulation on forestry. Environmental regulation [28] can reduce ecological hazards through industrial structure upgrading [29] and effectively enhance ecological resilience [30]. On the one hand, environmental regulation promotes advanced industrial structure [18] and optimal allocation of production factors [19] to optimize resource utilization. Enterprises are forced to carry out green production, promoting the growth of green total factor productivity [31,32]. On the other hand, the excessive burden of high pollution control costs affects resource allocation [33] and inhibits high-quality economic development [34]. In addition, factors such as the digital economy [35,36], innovation environment [5], natural environment [37,38,39], industrial structure [40], and government intervention [41] are all important affecting high-quality forestry development.
The fourth is the impacts of urbanization on forestry. On the one hand, urbanization can promote upgrading industrial structures [42] through various channels, such as technological innovation and human capital [43]. It has a significant spatial effect on upgrading industrial structures [44]. Urbanization can enhance the level of green development [45] through the intermediary effect channel of promoting the upgrading of consumption and industrial structures. On the other hand, in the context of urbanization, rapid economic development has led to issues such as forest land occupation and decreased forest productivity, which has also had a negative impact on forest quality [46].
Existing research on the impact of high-quality forestry development in China has mainly focused on the effects of forestry total factor productivity and upgrading forestry industry structure. However, there are fewer overall studies on high-quality forestry development. First, most scholars’ studies on the impact of ecological protection on forestry development are based on empirical analyses at the individual level of forestry, which may not accurately reflect high-quality forestry development. Second, studies on environmental regulation have mainly focused on forestry development. There is little research on using it as an intermediary variable between ecological protection and high-quality forestry development. Third, there are differences in different geographic regions and forest coverage in China. Studying the overall region and forest coverage may be biased. Finally, there may be a threshold effect due to the large span of China.
In summary, existing research on the impact of ecological protection on high-quality forestry development is not sufficient. Our study aims to conduct an in-depth empirical analysis of the impact of ecological protection on high-quality forestry development using panel data. By conducting heterogeneity analyses, introducing mediating variables, and introducing threshold variables, a deeper understanding of the different impacts of ecological protection on high-quality forestry development has been gained. This study aims to provide empirical evidence for accelerating the construction of ecological civilization and promoting sustainable development.

2. Theoretical Analysis and Research Hypotheses

Ecological protection has an impact on high-quality forestry development. On the one hand, high-quality forestry development is influenced by ecological protection through industrial ecology and industrial structural transformation. On the other hand, ecological protection indirectly affects high-quality forestry development through environmental regulation. It is limited by the level of economic development and the intensity of environmental pollution, and it is affected by the level of urbanization (Figure 1).

2.1. The Direct Impact of Ecological Protection on High-Quality Forestry Development

Ecological protection has an impact on high-quality forestry development. Ecological protection can effectively protect forest resources by strengthening wildlife protection, pest control [47] and other measures. It further prevents ecological damage and ensures the long-term use of forestry resources. Ecological protection enhances the supply capacity of forest products [48], which not only increases the income of forest farmers but also provides impetus for the long-term development of forestry. Strengthening the ecological protection of forestry is conducive to the transition of the Economic model and promotes the continuous improvement of the forestry economic level. Industrial transformation and upgrading are promoted [18]. Furthermore, implementing the concept of ecological protection is conducive to guiding forestry enterprises to change their development mode, and it reduces the problems of under-age logging and over-harvesting. Forestry resources were further upgraded. Therefore, ecological protection promotes high-quality forestry development. Based on this, this study proposes the following hypotheses.
Hypothesis 1. 
Ecological Protection promotes high-quality forestry development.

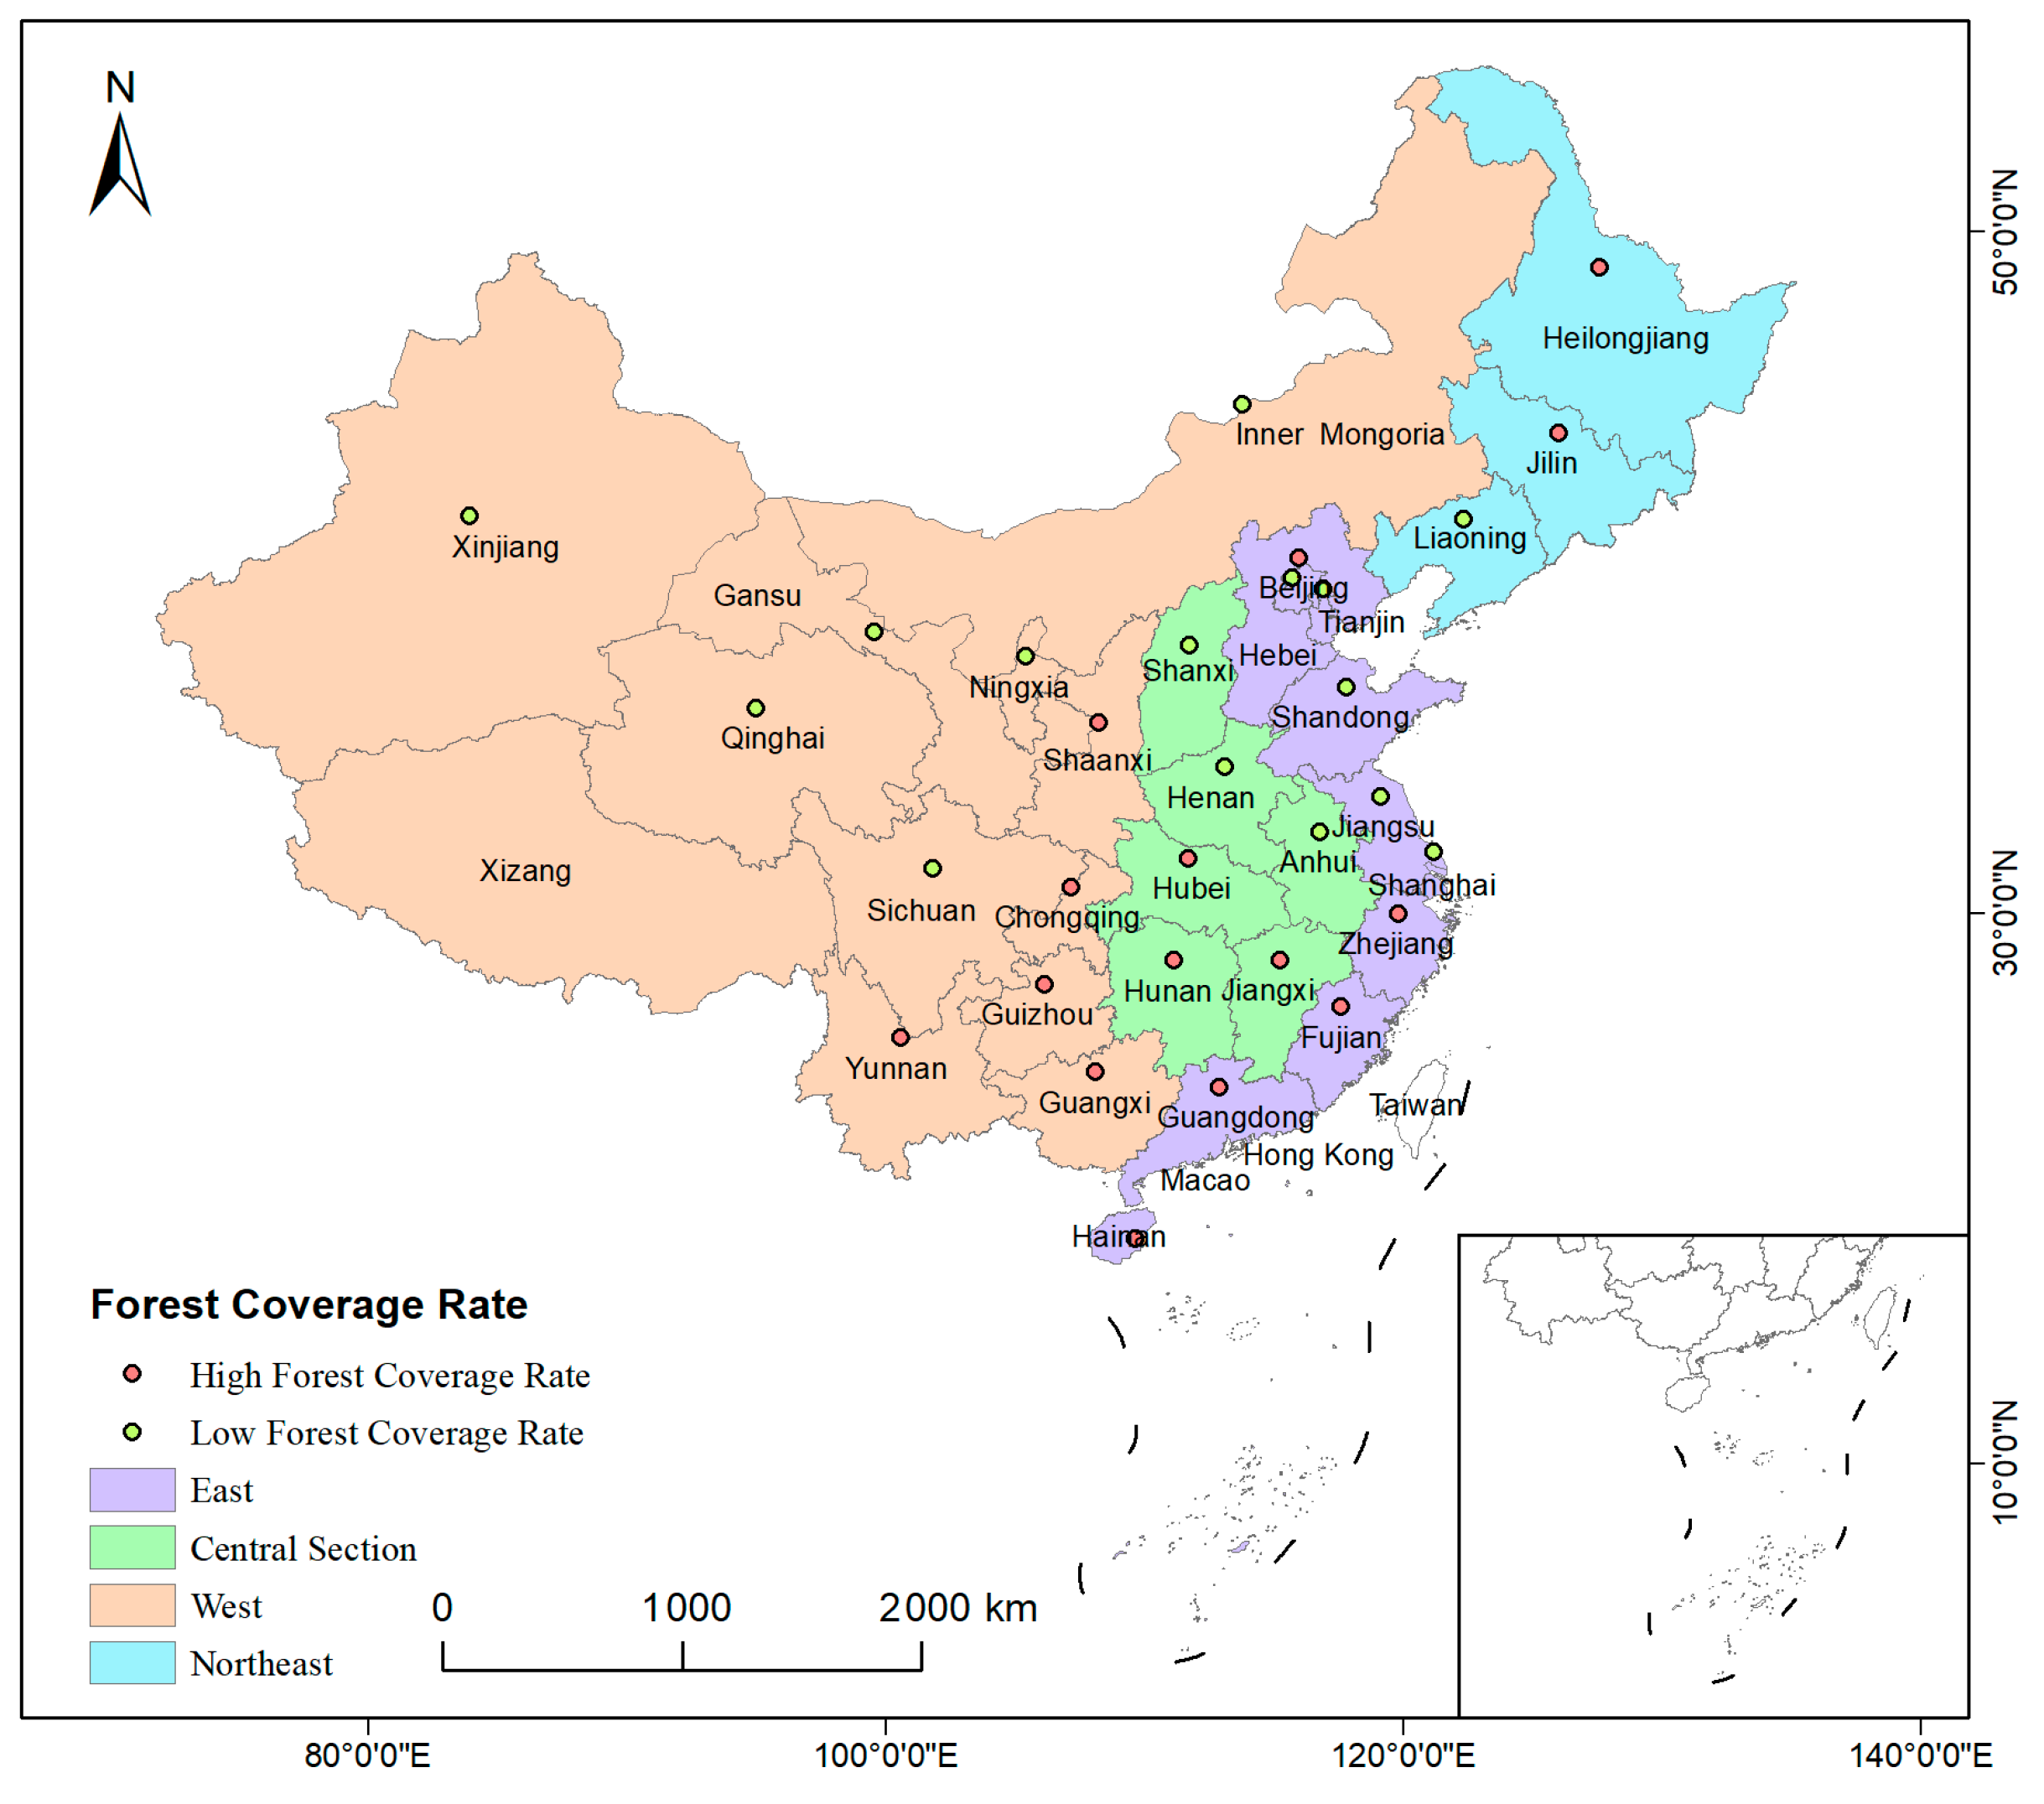
2.2. Heterogeneity Analysis of Ecological Protection for High-Quality Forestry Development

The impact of ecological protection on high-quality forestry development varies in different regions. Since the reform and opening up, there have been huge differences in economic development imbalances, factor endowments and institutional environments in different regions of China [31]. Compared with the western regions, the eastern and central regions of China have better resource endowments and development foundations. [32,33]. In addition, high forest cover can attract more tourism and recreation industries, and it promotes the transformation and upgrading of the forestry industry. High forest cover means more forest resources. The supply capacity of forest products is boosted, and the development of the forestry economy is promoted [49]. Therefore, improving the level of ecological protection is more conducive to the high-quality development of forestry in the western regions and areas with high forest cover. Accordingly, the research made the following hypotheses.
Hypothesis 2. 
Elevated levels of ecological protection will contribute more significantly to the high-quality forestry development in the western regions and areas with high forest coverage.

2.3. The Mediating Impact of Environmental Regulations on High-Quality Forestry Development

Ecological protection affected high-quality forestry development by environmental regulation. Environmental regulation can promote the transformation of local industrial layouts to low-pollution, high-efficiency green industries by optimizing resource utilization, including accelerating the advanced industrial structure [50] and optimizing the allocation of production factors [51]. Thus, high-quality forestry development is promoted. However, stringent emission standards and limits may make it difficult for subjects to meet or be overburdened with high pollution control costs, which affects resource allocation [42] and inhibits high-quality economic development [43]. In addition, the long-term exploitation and occupation of forest land has gone uncorrected. Such behavior violates the original purpose of environmental regulation and causes damage to forestry resources and the ecological environment. Therefore, ecological protection affects the high-quality development of forestry by reducing environmental regulation. Therefore, the following hypothesis is proposed.
Hypothesis 3. 
Ecological protection affects high-quality forestry development by reducing environmental regulation.

2.4. Threshold Effect on the Impact of Ecological Protection on High-Quality Forestry Development

There is a threshold effect in the influence of ecological protection on high-quality forestry development. New urbanization promotes the upgrading of the industrial structure [45] and the improvement of the level of green development [52]. With the transfer of the rural population to the cities, a large amount of unused rural land has been revitalized, which has provided conditions for the implementation of forestry projects and promoted forestry ecological construction. In addition, the advancement of urbanization has brought priority attention to the construction and protection of the ecological environment. By accelerating population transfer, land resource revitalization, forest city construction and other aspects, urbanization effectively promotes the development of forestry and achieves a win-win situation for both ecology and economy. Therefore, the impact of the level of ecological protection on high-quality forestry development increases with the level of urbanization. Based on this, this paper proposes Hypothesis 4.
Hypothesis 4. 
The impact of the level of ecological protection on high-quality forestry development increases with the level of urbanization.

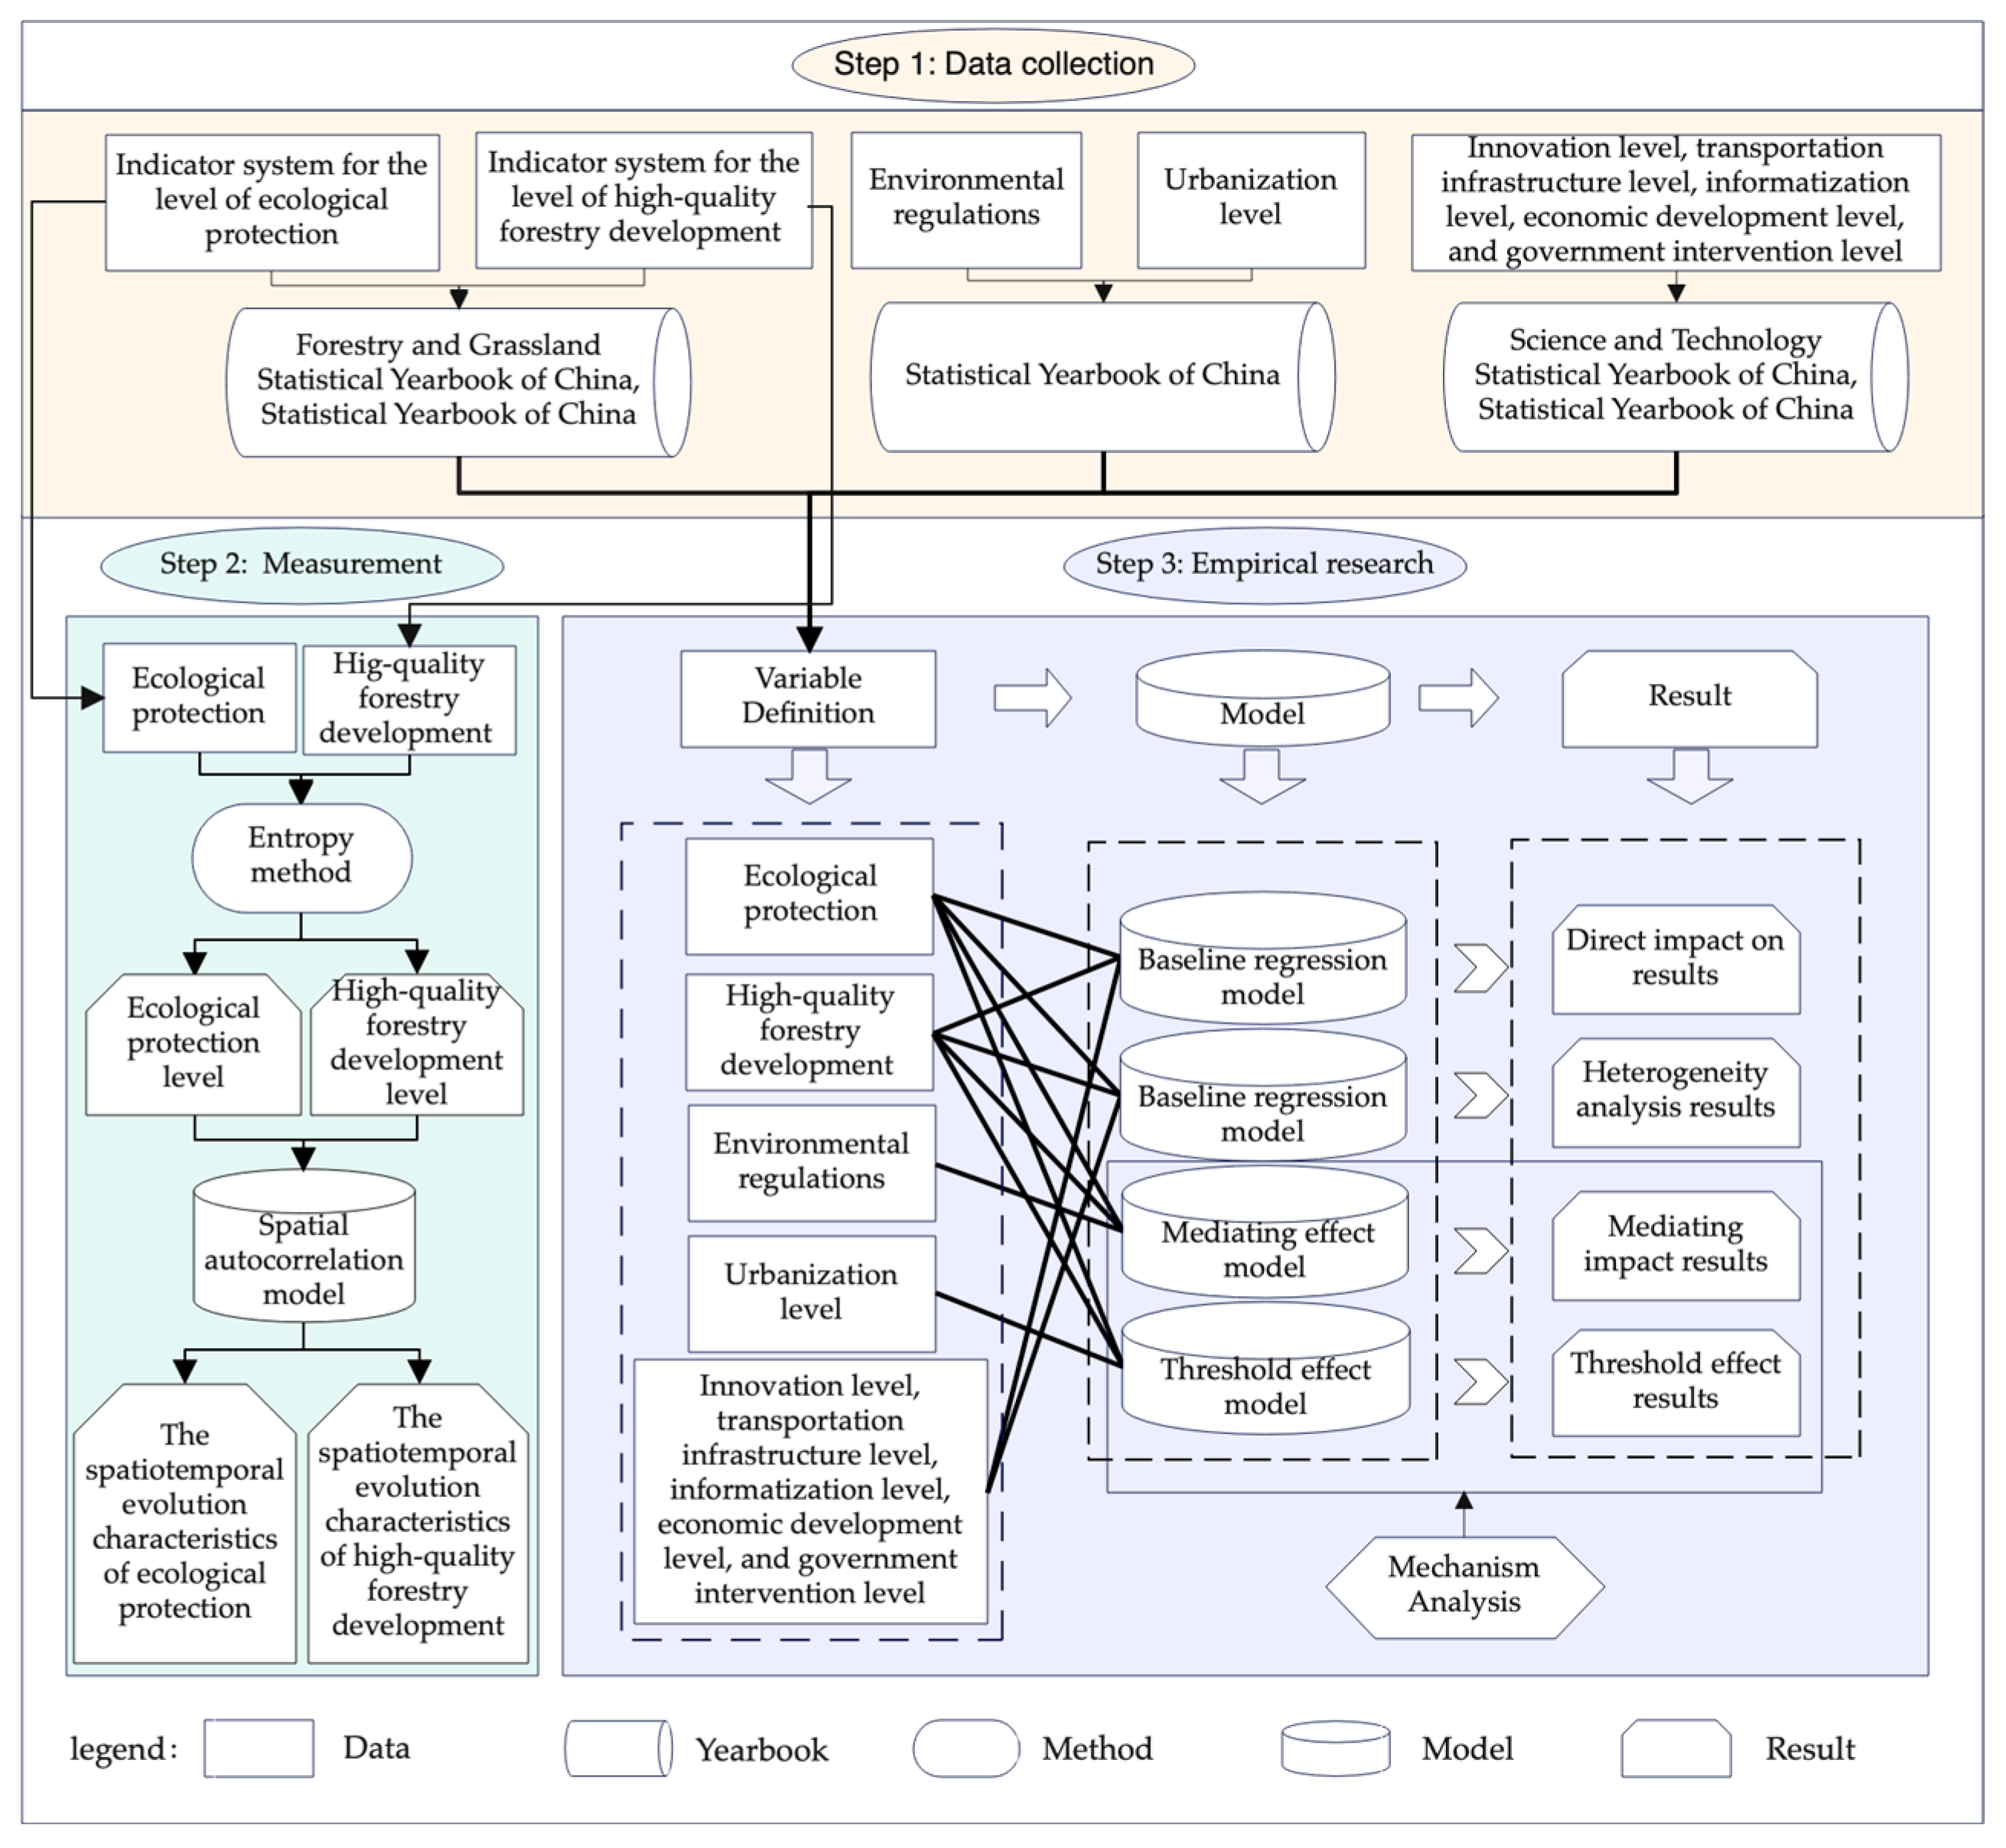
3. Materials and Methods

3.1. Sources of Information

Based on the National Bureau of Statistics (NBS) criteria for dividing economic regions of China, the geographic regions are divided into four major regions (Figure 2): eastern, central, western, and northeastern regions. As the engine of China’s economic development, the eastern regions have a well-developed digital economic foundation and an efficient resource allocation mechanism. Although the central regions have a slightly lower level of economic development than the eastern regions, and its capital and technological strength are relatively weaker, it still has a certain industrial foundation and resource advantages. The western regions all lag behind the eastern and central regions in terms of the level of economic development, infrastructure construction and so on. The northeastern regions have a lower level of economic development. Using the forest coverage of each province in 2022, the article divides the samples into high forest cover and ground forest cover areas, and it aims to research the impact of ecological protection on high-quality forestry development in areas with different forest coverages.

3.2. Model Specification

In this article, 30 provinces (autonomous regions and municipalities directly under the central government) in China were taken as the research objectives from 2010 to 2021. The research methodology and main process adopted in this study are shown in Figure 3, including the following procedures: (1) This article constructed an indicator system suitable for the level of ecological protection and the level of high-quality forestry development through literature research. (2) This article evaluated the level of ecological protection and the level of high-quality forestry development by using the entropy method. (3) This article analyzed the impact of ecological protection on high-quality forestry development, as well as the heterogeneity analysis, using the basic regression model. The threshold regression model was used to analyze the sub-linear impact of ecological protection on high-quality forestry development.

3.2.1. Baseline Regression Modeling

After the multicollinearity test and Hausman test, this article adopts the two-way fixed effects model used in the research results of Bei Shuhua [5]. The specific measurement model is as follows in Equation (1). Due to the inclusion of many forestry industry development-related indicators in the evaluation index system for high-quality forestry development, the selection of control variables mainly considers other indicators at the provincial level that may have an impact on the level of high-quality forestry development. Specifically, it includes the innovation level (LnInno), the transport infrastructure level (LnTrans), the informatization level (Infor), the economic development level (LnGDP), and the government intervention level (Gov).
H Q D i t = α + β E c o l o g i c a l i t + γ X i t + η i + η t + ε i t
In Equation (1), H Q D i t denotes the level of high-quality forestry development in province i in year t. E c o l o g i c a l i t denotes the level of ecological protection in province i in year t. η i and η t denotes respectively the area-fixed effect and time-fixed effect. ε i t is a random perturbation term. α is a constant term. β and γ are the coefficients of E c o l o g i c a l i t and X i t , respectively. X i t denotes other control factors affecting the level of high-quality forestry development in province i in year t.

3.2.2. Mediating Effects Modeling

To further explore the transmission mechanism of ecological protection affecting high-quality forestry development, this article took environmental regulation as the mediating variable. It drew the mediating effects operation suggestions proposed by Jiang Ting [53] to overcome the shortcomings of traditional mediating effects analysis methods. Based on the model (1), the following mediation model is established.
M i t = a 0 + a 1 H Q D i t + a 2 M i t 1 + j = 1 n ω j X i t + η i + η t + ε i t
Among them, M i t denotes the mediator variable. The remaining variables have the same meaning as mentioned above.

3.2.3. Threshold Effect Modeling

To further explore whether there is a threshold effect of ecological protection on high-quality forestry development, the following dynamic threshold model was constructed for testing. The method of Hansen [54] is a common practice to test the threshold effect, which is based on the fixed effects of a static panel. However, this method requires the covariates to remain strongly exogenous. Therefore, this article referred to the approach of Seo et al. [55] to construct a single dynamic threshold model with the level of urbanization (urban) as the threshold variable.
H Q D i t = β 0 + Ω H Q D i t 1 + β 1 E c o l o g i c a l i t × I q i t γ + β 2 E c o l o g i c a l i t × I q i t > γ + a j j = 1 n ω j X i t + + η i + η t + ε i t
The function I (·) is an indicator function. It denotes a value of 1 if the condition within parentheses is satisfied and 0 otherwise. q i t represents the threshold variable. When the urbanization level falls below the threshold value γ , the coefficient of ecological protection on high-quality forestry development is β 1 . When the urbanization level exceeds γ , this coefficient becomes β 2 . The meanings of other variables remain unchanged.

3.3. Variables

3.3.1. Dependent Variables

The dependent variable is high-quality forestry development. Drawing on the research results of Zhang Handan [56], a research system was established based on the three aspects of wealth sharing, talent development, and green development. Three secondary indicators and nine tertiary indicators were designated. Wealth sharing was considered the driving force behind high-quality forestry development. Talent development was regarded as the premise of high-quality forestry development. Green development was the goal for high-quality forestry development (Table 1). Referring to the research of Li Fuzhu et al. [57], this article used the entropy method model and fully utilized the information from the original data. Its results can quantitatively reflect the level of high-quality forestry development in various regions of China. The specific calculation steps of the entropy method model are as follows: first, each indicator of the indicator system is standardized; second, the weight of each indicator is calculated using the entropy value method; third, the entropy value is calculated; fourth, the coefficient of variation of the indicators is calculated; fifth, the weights of the indicators are calculated; and sixth, the comprehensive score is calculated. As shown in Table 1, “Green development” has the highest weight among all the secondary indicators. Its weight is 0.422, indicating that “Green development” is the foundation of high-quality forestry development. “Wealth sharing” is the second most important. Its weight is 0.350, indicating that “Wealth sharing” is an indispensable part of high-quality forestry development.

3.3.2. Explanatory Variable

The core explanatory variable is ecological protection (Eco). Drawing the research results of Sun Jiqiong [58], the construction of the eco-protection indicator system is mainly based on the PSR framework. Namely, it is the pressure-state-response system. The system can reflect the current state characteristics of ecological protection. It also can reflect the external pressure of eco-protection and people’s efforts to improve the ecological environment. Based on this logic, the eco-protection indicator system consists of eight indicators in three dimensions, including pressure (pollutant emissions), state (status of ecological resources), and response (environmental governance). Among them, the pressure dimension mainly reflects the impact of pollution emissions and environmental emergencies on the environment. The state dimension mainly reflects the status characteristics of regional water and air quality. The response dimension reflects the corresponding initiatives adapted to protect the ecology. The level of ecological protection is also calculated using the entropy method. As shown in Table 1, the highest weight among all secondary indicators is “Pollutant emissions t”. Its weight is 0.570, indicating that “Pollutant emissions” is a key issue in ecological protection. “Status of eco-logical resources” is the second most important factor. Its weight is 0.273, indicating that the “Status of ecological resources” is an important factor of ecological protection.

3.3.3. Mediating Variable

Environmental regulation (Env) refers to the investment/industrial added value achieved through industrial pollution control. The enterprise can promote economic growth by environmental regulations [59]. Increasing the intensity of environmental regulation on high-quality development has a significant enhancement effect [60]. Environmental regulation leads to an increase in the cost of corporate environmental compliance. Economic growth is inhibited.

3.3.4. Threshold Variable

Urbanization level (Urban). The level of urbanization is expressed in terms of the proportion of the urban population. It reflects the process of industrialization and modernization. The higher the urbanization level, the higher the economies of scale and the degree of concentration in large cities. Thus, the level of high-quality forestry development is higher.

3.3.5. Control Variables

According to the previous theoretical analysis and based on the availability of data, the control variables are selected in this article, including the level of innovation, the level of transportation infrastructure, the level of informatization, the level of economic development, and the degree of government intervention. The symbols and meanings of the specific variables are as follows in Table 2.

3.4. Data Sources and Descriptive Statistics

This article is based on the balanced panel data of 30 provinces (autonomous regions and municipalities directly under the central government) (except Hong Kong, Macao, Taiwan, and Tibet) from 2010 to 2021. In terms of data sources, dependent variables data come from the “China Forestry and Grassland Statistical Yearbook” and the Statistical Yearbook of China; the explanatory variables data come from the “China Forestry and Grassland Statistical Yearbook” and the Statistical Yearbook of China; Environmental regulation and Urbanization level come from “Statistical Yearbook of China”; Control variables such as Level of innovation, Level of informatization come from the “China Science and Technology Statistical Yearbook”, Level of transport infrastructure, Level of economic development, and Level of government intervention come from the “China Statistical Yearbook”.
Some missing variable data are fully used by averaging the two years of data before and after. Finally, considering the possible heteroskedasticity of the data, some of the continuous variables are logarithmically processed. The original indicators of the level of ecological protection and the level of high-quality forestry development have already been algorithmicized, so they are not logarithmically processed for a second time. The following are descriptive statistical of variables (Table 3).

4. Empirical Results

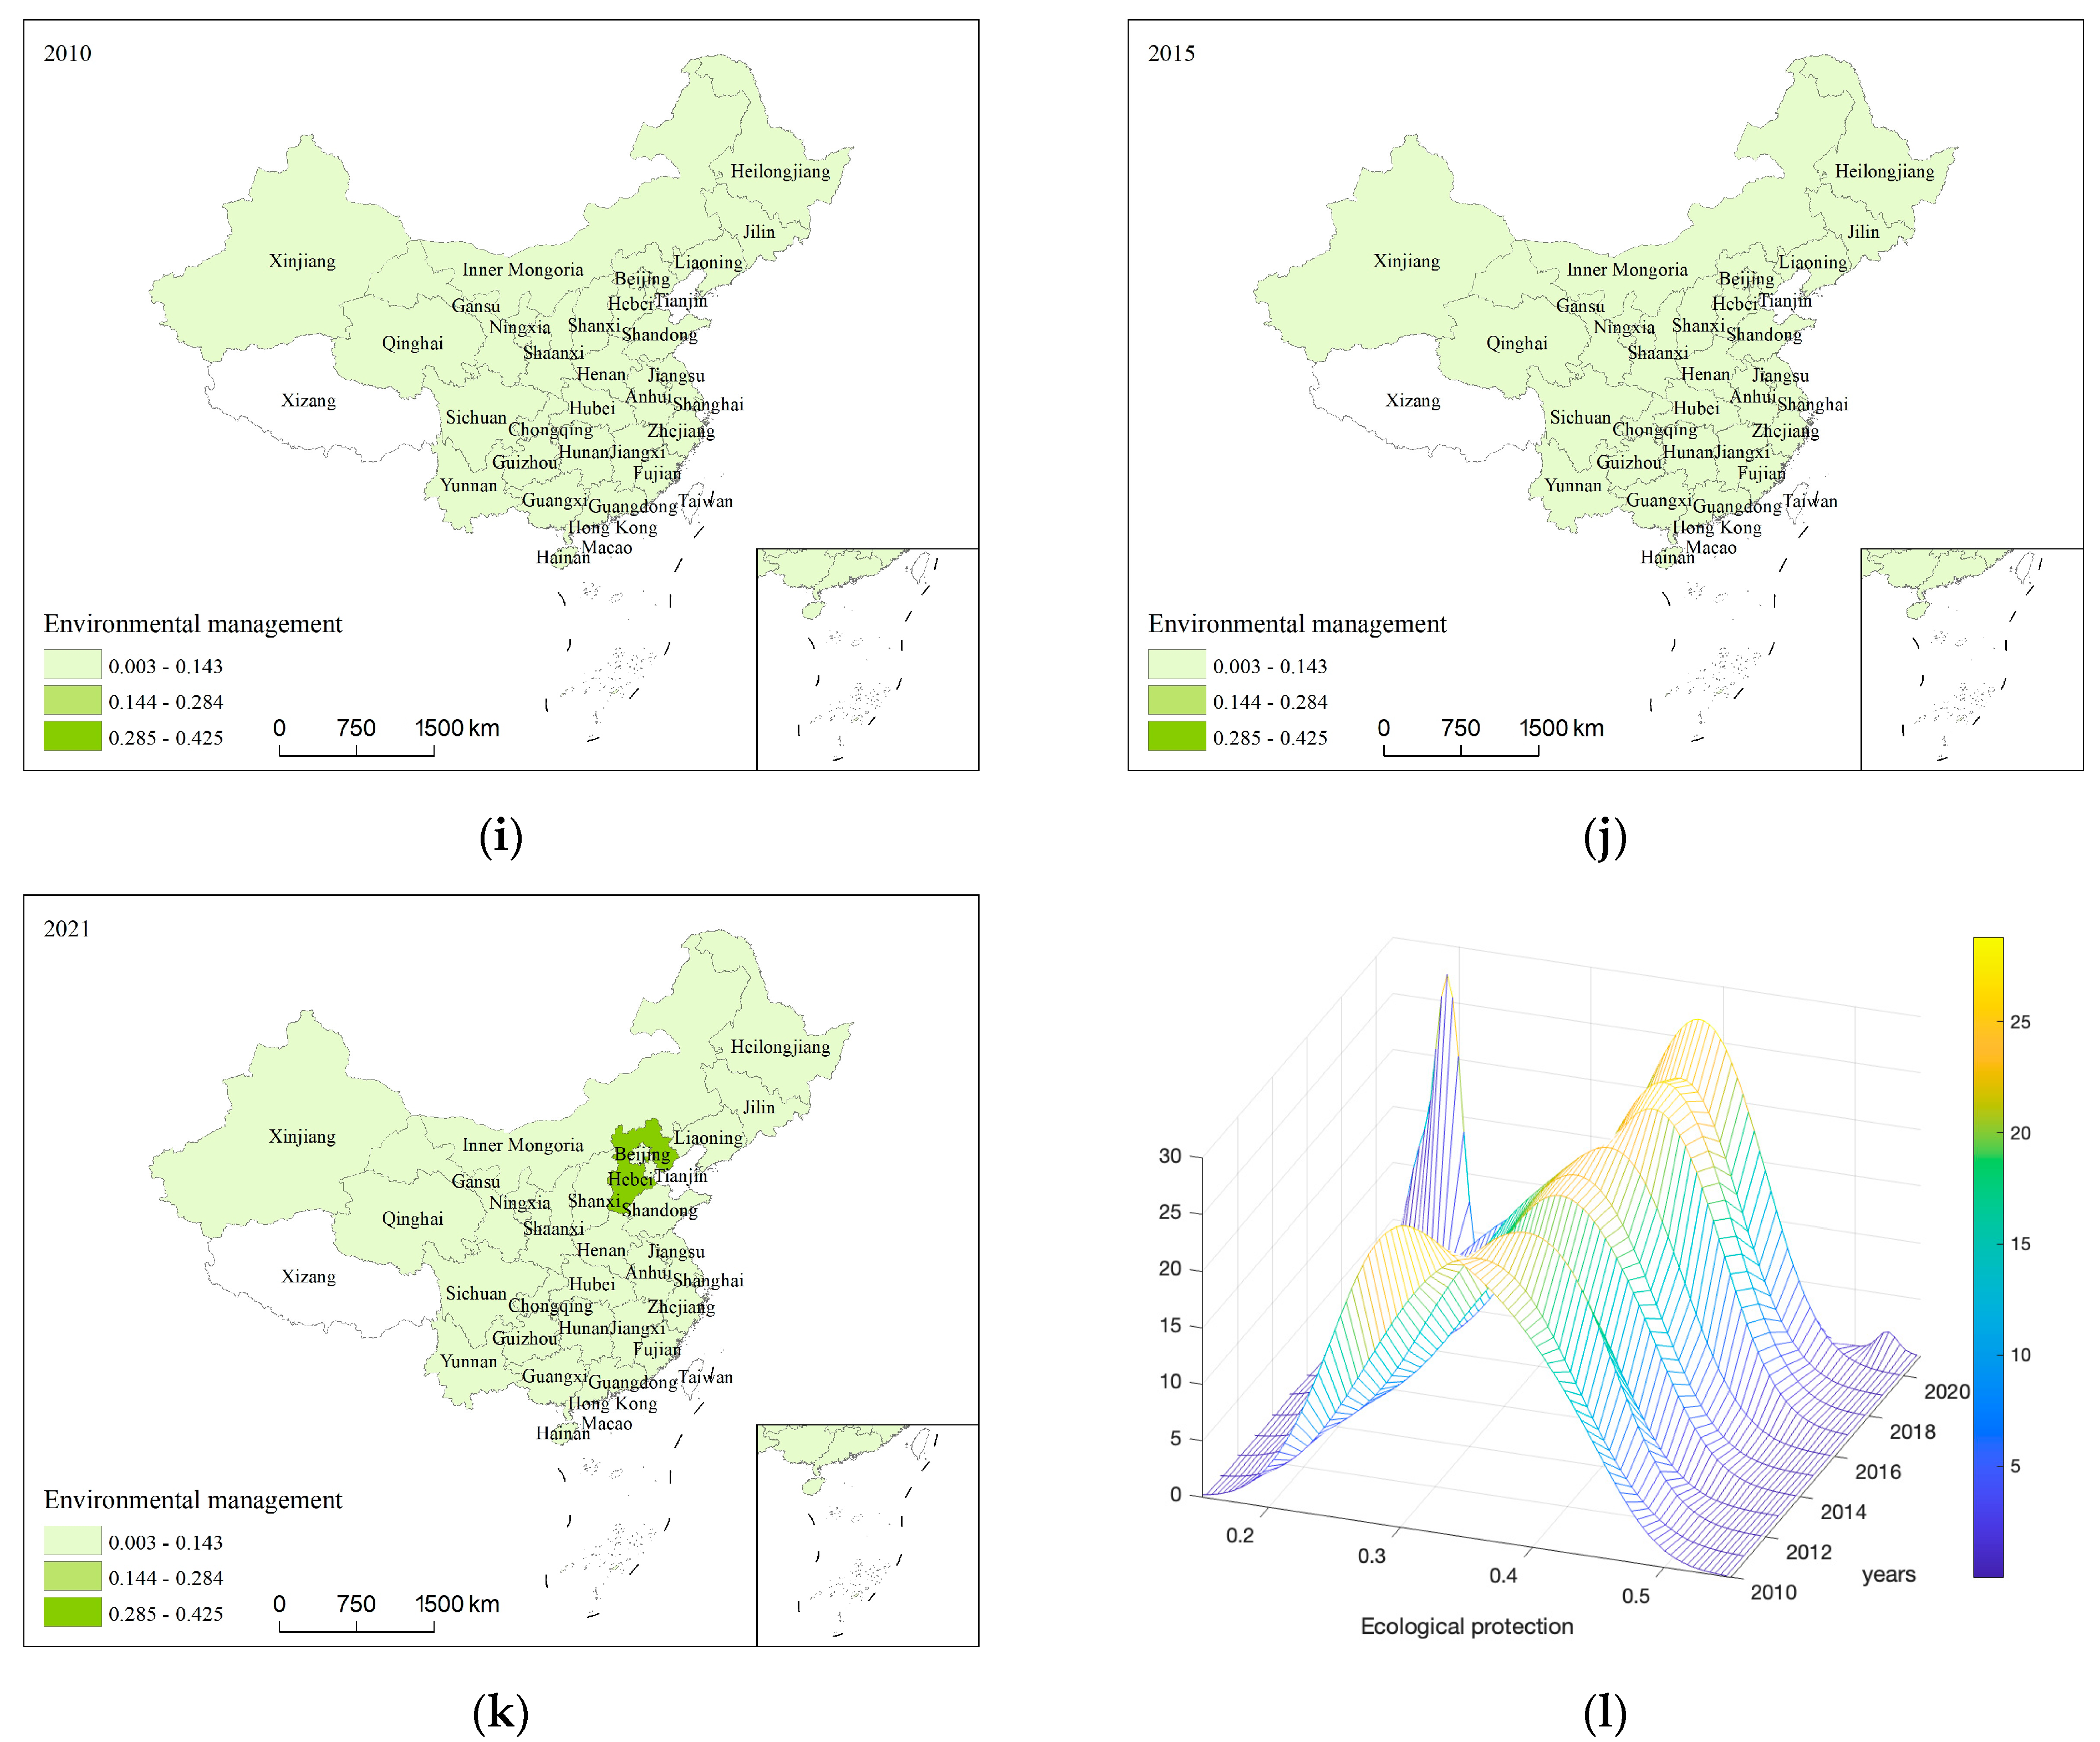
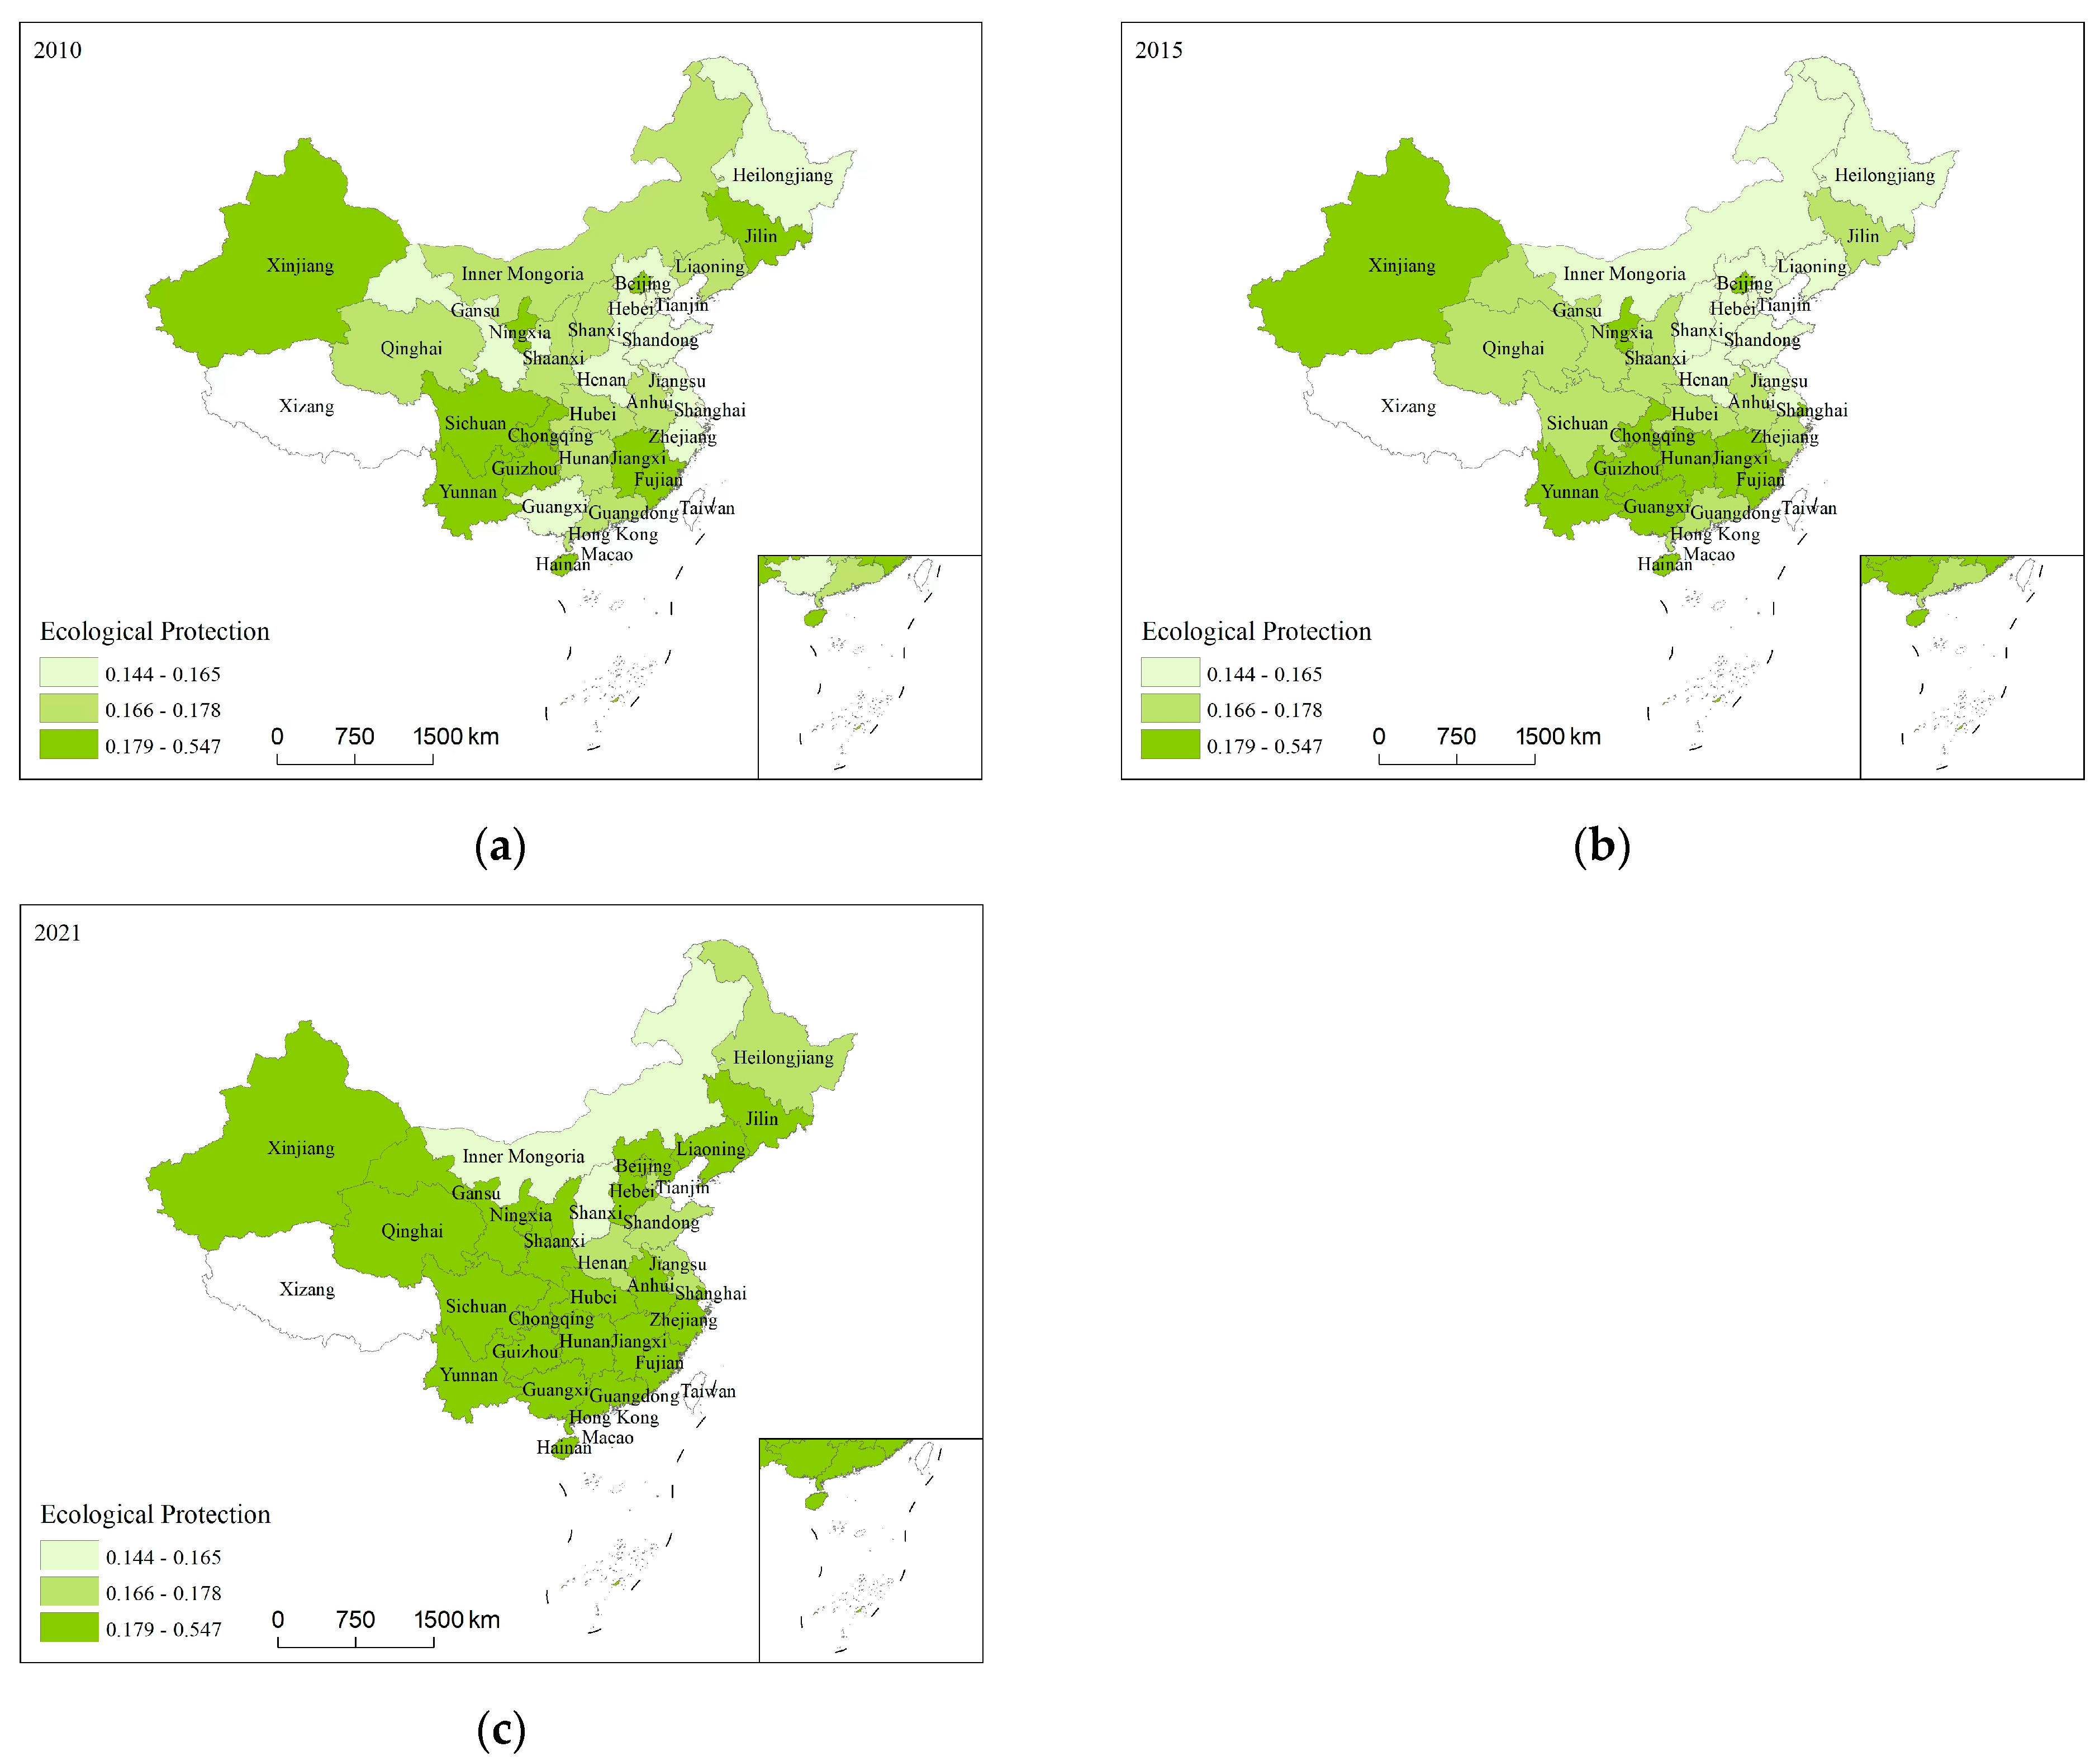
4.1. Spatial and Temporal Characteristics of the Explanatory and Dependent Variables

4.1.1. Spatial and Temporal Characteristics of Ecological Protection

The ecological protection level of China shows a decreasing and then increasing trend (Figure 4a). The specific dimensional changes are shown in Figure 4c–k. The composite index of ecological protection for each province shows an annual increasing trend from 2010 to 2021 (Figure 4b). At first, the kernel density curve for the level of ecological protection in China decreases in peak value and increases in width. It shows that there is a trend of widening differences between provinces with higher and lower levels of ecological protection in China. Then, the peak value is increasing, and the width is decreasing. It shows a trend of narrowing differences between provinces with higher and lower levels of ecological protection in China. The graph shows a clear single-peak situation, and there is no polarization (Figure 4l).
In this article, data from three years (2010, 2015, and 2021) are selected to explore the spatial layout of ecological protection. The level of ecological protection in China is on an upward trend (Figure 5a–c). There are significant differences in regions. Compared with 2010 and 2015, the ecological protection index will generally be positive in 2021. Compared with the index in 2010, the index in 2021 shows a clear upward trend in the western regions.

4.1.2. Spatial and Temporal Characteristics of High-Quality Forestry Development

The level of high-quality forestry development in China shows a downward trend (Figure 6a). The specific dimensional changes are shown in Figure 6c–k. The high-quality forestry development composite index for each province shows a yearly increasing trend from 2010 to 2021 (Figure 6b). At first, the kernel density curve for the level of high-quality forestry development in China increases in peak value and decreases in width. It shows that there is a trend of narrowing differences in provinces with higher and lower levels of high-quality forestry development in China. Then, the peak value decreases, and the width value increases. It shows that there is a trend of widening differences in provinces with higher and lower levels of high-quality forestry development in China. The graph shows a clear single-peak situation, and there is no polarization (Figure 6l).
This article selects data from three years before, during and after to explore the spatial layout of high-quality forestry development. The level of high-quality forestry development in China is on an upward trend (Figure 7a–c). There are significant differences in regions. In 2010, 2015, and 2021, the high-quality forestry development index in the eastern regions is higher than that in other regions. Compared with the index in 2010, in 2021, a clear upward trend is demonstrated in the eastern and central regions.

4.2. Baseline Regression

The variables are tested for multicollinearity to ensure that the variables meet the regression model criteria and there are no pseudo-regressions. After calculation, the maximum value of the Variance Inflation Factor (VIF) of all variables is 3.69, and the mean value is 2.13. There is no multicollinearity among the variables. At the same time, applying the Hausman test for the selection of random and fixed effects, the results show that the p-value of the Hausman test is 0.0119. So, the fixed effects model should be selected. The results of the benchmark regression are as follows in Table 4.
Table 4 reports the baseline regression results of the impact of ecological protection level on high-quality forestry development. Column (1) of Table 4 shows the fixed effects regression results without adding control variables. It shows that the estimated coefficient of the level of ecological protection is 0.179, and it is significantly positive at the 5% level. That indicates that the level of ecological protection significantly promotes high-quality forestry development. Column (2) of Table 4 shows the fixed effects regression results by adding control variables. It shows that the estimated coefficient of the level of ecological protection is 0.146, and it is significantly positive at 5%. The results further validate H1.

4.3. Robustness Test

This article adopts the following three methods for robustness testing to ensure the robustness of the results. First, some samples are excluded. This article excludes the sample data of four municipalities to avoid possible statistical differences, including Beijing, Tianjin, Shanghai, and Chongqing. The remaining 312 samples are re-regressed. Second, the core explanatory variables are replaced. The core dependent variable (HQD) is re-measured and re-estimated using principal component analysis. After the KMO test and Bartlett’s test, the KMO is 0.592, which is greater than 0.5. That indicates that it is suitable for principal component analysis. The significance of Bartlett’s test is 0, which indicates that it meets the preconditions of principal component analysis. Thirdly, tail processing is shrunken. To avoid the influence of extreme values on the regression results, the upper and lower 5% of the sample values are shrink-tailed and regressed again.
According to the results in columns (1)–(3) of Table 5, the significance and estimated coefficients of the core explanatory variable (HQD) are consistent with the benchmark regression, which provides solid evidence for the results of this study. In particular, column (2) of Table 5 shows that the effect of ecological protection on high-quality forestry development is still significant, and it increases to 1.624, which indicates that the regression is smoother after replacing the core dependent variables. The conclusion that ecological protection is effective in empowering high-quality forestry development is robust, which further verifies Hypothesis 1.

4.4. Heterogeneity Analysis

Heterogeneity analysis based on geographical location. Columns (1) to (4) in Table 6 show that the eco-protection level has a significant positive effect on the level of high-quality forestry development in the central, western, and northeastern regions, especially in the western regions, which is remarkable at 1% statistical level. However, there is no significant effect on the level of high-quality forestry development in the eastern regions. The possible reason for this is that it has a more developed economy, which has wider funding sources and better infrastructure. It is less affected by the marginal effect of the level of ecological protection. Compared with other regions, the overall eco-protection level in the western regions is lower. Variation in ecology levels has a more significant impact on the promotion of the local forestry industry and the upgrading of the industrial structure. The degree of solidification of the development of local forestry is lower, which can better adapt to changes brought about by the ecological protection of the forestry industry. Therefore, eco-protection is conducive to promoting high-quality forestry development.
Heterogeneity analysis is based on forest coverage. The results are shown in columns (5) and (6) of Table 6. The estimated coefficients of ecological protection are 0.745 and −0.002, which are significant at the 5% confidence level in high forest coverage areas. It indicates that ecological protection has a facilitating effect on high-quality forestry development in high-forest-coverage areas, which is not significant in low-forest-coverage areas. In high forest coverage areas, which are rich in forest resources and have higher requirements for ecological protection, the impact of eco-protection policies can be better leveraged to better cope with external shocks and enhance high-quality forestry development.

5. Mechanism Analysis

5.1. Analysis of Mediating Mechanisms

5.1.1. Mediating Effect Regression Results

Table 7 shows the results of the mediation effect test analysis of environmental regulation. Among them, column (1) of Table 7 shows the regression results of the impact of ecological protection on forestry high-quality development, and its estimated coefficient is significant at the 5% statistical level. Column (2) of Table 7 shows the regression results of the impact of the level of ecological protection on environmental regulation. The estimated coefficient of the benchmark model is −0.0212, which is significant at the 1% statistical level. It indicates that ecological protection has a significant negative impact on environmental regulation. The higher the level of ecological protection, the lower the degree of environmental regulation. Column (3) of Table 7 shows the regression results of adding ecological protection level and environmental regulation. The estimated coefficient of environmental regulation is −2.998, which is significant at a 1% statistical level. The estimated coefficient of 0.116 for the ecological protection level is not significant, indicating the presence of a full mediation effect. The results suggest that environmental regulations have a statistically significant negative impact on high-quality forestry development. Ecological protection affects high-quality forestry development by influencing environmental regulations. Accordingly, Hypothesis 2 is verified.

5.1.2. Tests of Mediating Effect Results

1.
Sobel Test
The testing power of the Sobel method is higher than that of the three-step regression method. Sobel’s text can test more mediation effects than the three-step regression method. However, its prerequisite assumption is that the estimation values of a and b obey the normal distribution, which is difficult to guarantee. There are some limitations of the Sobel test. The p-value of the Sobel test is significant at 0.010 (Table 8), which indicates that the mediation effect is significantly present.
2.
Bootstrap Test
As can be seen from the results (Table 9), the p-value of the indirect (mediating) effect is significant at 0.091, indicating that the mediating effect is significantly present. The confidence interval for the indirect (mediated) effect does not contain 0, which shows that the mediating effect is significantly present.

5.2. Threshold Effect Test

The double-threshold F-test value and its corresponding prob are assumed to have no threshold value. If rejected, it indicates the existence of a threshold value. The p-value of a single threshold is 0.007, which indicates that the null hypothesis is rejected at a significance level of 1% and a single threshold value exists. The p-value of the double threshold is 0.073, indicating rejection of the null hypothesis at a significance level of 10%. After verification, there is no triple threshold, indicating that the model has a double threshold effect. The data above are estimated using double thresholds.
The result is the threshold estimation result. It has the estimation result of the control variables and the estimation result of the explanatory variables affected by the threshold variables. Namely, the numbers 0, 1, and 2 names the level of urbanization (Table 10). Because of the double threshold, the estimation result is divided into three intervals, which represent the difference of the impact of ecological protection on high-quality forestry development in different intervals. The number 0 indicates that the threshold variable is smaller than the first threshold. The results show that eco-protection has a positive and significant effect on high-quality forestry development.
Since there are two thresholds, LR21 and LR22 are constructed. The LR test plot is plotted (Figure 8). Among them, 7.3523 represents the critical value of LR statistics at a 95% confidence level. According to the principle of the threshold model, the threshold estimate is the value taken when the LR value of the likelihood ratio statistic is close to 0. Namely, it shows the lowest point in the LR plot. When the threshold estimate corresponds to an LR smaller than the critical value of 7.3523, the threshold estimate passes the test. The lowest point of both thresholds in the graph is less than the critical value. Threshold estimates can be considered valid.

6. Discussion

First, ecological protection promotes high-quality forestry development. Ecological protection can effectively protect forest resources, which enhances the supply capacity of forest products [48] and promotes industrial transformation and upgrading [18]. The research results on forest resource utilization efficiency and high-quality economic development are consistent with those of Huang Xiujuan et al. [61], Qi Fangmei et al. [62], Wen Saisai et al. [63], and Wang Yun et al. [64]. This is probably because strengthening forestry ecological protection can improve the forest structure and environment through scientific management to enhance the supply capacity of forest products. High-quality forestry development can be effectively promoted by further cultivating high-quality forest resources. In addition, its ecological advantages can be transformed into economic advantages by protecting and developing forestry. To meet the increasing levels of consumption brought about by rapid economic development, the forestry labor force is stimulated to explore high economic return forestry practices. Therefore, ecological protection can be strengthened, and forestry development can be continually promoted. The advantages of ecology in promoting high-quality forestry development are given fully. On the one hand, the value of global forestry resources can be enhanced. The direct sale of forest trees generates economic benefits. These trees are used adequately in many fields, such as papermaking and wood facility research and development. On the other hand, it is necessary to protect the global forestry ecology and natural forests. It can curb the overdevelopment and waste of forest resources. It also slows down the destruction of vegetation and reduces soil erosion and the frequency of natural disasters such as mudslides, droughts, floods, and the degree of damage.
Secondly, although there is a positive and significant relationship between ecological conservation and high-quality forestry development, it can be affected differently due to the intervention of geographical factors. In this study, the effect of ecological protection on high-quality forestry development in the western regions is significant, and it has the highest significance. This is consistent with the findings of Wang Che [31]. This is probably because significant achievements in ecological conservation have been made in the western regions. These achievements are reflected in the improvement of the ecological environment, the protection of forestry resources, and the promotion of economic development. In addition, it is significant in areas with high forest coverage, indicating that ecological protection contributes to high-quality forestry development in high forest coverage areas. This is consistent with the findings of Li Shimei et al. [25]. It may be because forestry development in areas with high forest coverage has significant advantages and potential. These areas are usually rich in natural resources [24], providing unique conditions for forestry development. Therefore, considering the resource endowments, environmental conditions, and industrial characteristics in different regions around the world, a strategy for high-quality forestry development is tailored to local conditions. For regions with lower global economies, we should insist on increasing the strength of policy support. On the one hand, preferential policies and support measures for ecological conservation in less economically developed regions should be developed, including financial support, tax exemption, and other measures. On the other hand, A series of measures to prevent and treat sand are to be implemented, and a unique ecological protection barrier is to be created. It can turn the advantages of local characteristics into advantages in the development of forestry specialty industries.
Third, regarding mediating effects, environmental regulation tools are the key to achieving synergy between high-quality economic development and ecological civilization [28]. Ecological protection promotes high-quality forestry development by reducing environmental regulation. Ecological protection has a significant negative effect on environmental regulation, which is consistent with the findings of Huang Jin et al. [28]. Perhaps resource allocation is affected due to overly strict environmental regulations and high pollution control costs [33]. To maximize economic benefits, forestry economic policy will adopt various measures to regulate supply and demand, such as market regulation, price regulation, tax policy, etc. These measures will have a significant impact on the utilization and management of forest resources, constraining high-quality economic development [34]. In addition, the issue of long-term exploitation and occupation of forest land has not been corrected. This behavior goes against the original intention of environmental regulation. Therefore, the global public awareness of environmental protection should be raised, and the role of implicit environmental regulation should be played. Global regions need to concretize the environmental information disclosure system through further environmental legislation. It can promote the transformation and upgrading of industrial, energy, and transport structures through high levels of protection. That can accelerate the formation of green modes of production and lifestyles. The green undertones of high-quality development are thus thickened.
Finally, from the perspective of threshold effect, ecological protection has a double threshold effect on high-quality forestry development. The intersection of ecological protection level and urbanization level has an increased impact on high-quality forestry development, which is consistent with the findings of Wang Fang et al. [45]. This is more conducive to promoting high-quality forestry development [44]. The possible reason is that with the improvement of urbanization level and the acceleration of population transfer and urbanization process, this transformation reduces dependence on forest resources. It promotes the growth of forest areas and the improvement of forest quality. In addition, the construction of forest cities has promoted the development of forestry-related industries through measures such as increasing forest ecological recreational spaces and improving the network of leisure greenways. Therefore, through urbanization, infrastructure construction is driven, and product demand is increased to promote the development of the forestry industry. Meanwhile, increasing the variety of forestry products and vigorously developing industries such as forest health tourism and natural education bases is necessary.
However, the analyses in this article still have some limitations. Due to the limited availability of data, the empirical analysis in this article only uses data from 30 provinces (autonomous regions and municipalities directly under the central government) in China. The level of forestry development varies greatly in provinces. So, if we can obtain more detailed public data at the prefecture or county level, we can obtain more meaningful conclusions and put forward more targeted policy recommendations. This is a direction in which future research could expand.

7. Conclusions

The first concept is the analysis of benchmark regression. Ecological protection has a significant positive promotion effect on high-quality forestry development. The estimated ecological protection coefficient is 0.146, which is significantly positive at the 5% level. This conclusion remains robust under the robustness test scenarios of excluding sample size, replacing the explanatory variables, and shrinking the tails.
The second concept is the analysis of heterogeneity. The heterogeneity analysis shows that the ecological protection effect of promoting high-quality forestry development is more significant in the remote western regions. The estimated coefficient is 1.392, which is significantly positive at the 1% level. The effect of ecological protection on high-quality forestry development is more significant in the areas with higher forest coverage. The estimated coefficient is 0.745. There are significant at the 5% confidence level.
The third concept is the analysis of mediation. The estimated environmental regulation coefficient is −0.021. Ecological protection promotes high-quality forestry development by reducing environmental regulations.
The fourth content is the analysis of the threshold effect. The p-value of the double threshold is 0.073, indicating rejection of the null hypothesis at a significance level of 10%. The results show that under the influence of urbanization level, eco-protection positively and significantly affects high-quality forestry development.

Author Contributions

Conceptualization, J.F. and L.M.; methodology, J.F.; software, J.F.; validation, J.F., L.M., and Q.W.; investigation, R.Z.; writing—original draft preparation, J.F.; writing—review and editing, L.M.; funding acquisition, L.M. All authors have read and agreed to the published version of the manuscript.

Funding

This research was funded by the National Forestry and Grassland Administration Forestry Soft Science Project (2022131016), the Cooperative Forestry Science and Technology Project of Zhejiang Provincial Academy (Nos. 2023SY02) and the Central Public Research Institutes Fundamental Research Funds for the Project of Chinese Academy of Forestry (grant number CAFYBB2021QC002).

Data Availability Statement

The data used in this study are all sourced from public datasets and can be found on the China Economic and Social Big Data Research Platform. The specific link is https://data.cnki.net/ (accessed on 7 September 2023).

Conflicts of Interest

The authors declare no conflicts of interest.

References

  1. Kumar, T.B.; Akhter, T.P.; Rajasree, N.; Shiba, K.; Mohammed, M. Composition of homestead forests and their contribution to local livelihoods and environment: A study focused on Bandarban hill district, Bangladesh. Trees For. People 2021, 5, 100117. [Google Scholar]
  2. Abila, S. An Appraisal of Goal 7 of the Millennium Development Goals of the United Nations VIS-À-VIS the Implementation of the 2011 United Nations Environment Programme Report on the Environmental Assessment of Ogoni Land in Nigeria and the Activities of the Hydro. Civ. Environ. Res. 2020, 12, 25–33. [Google Scholar]
  3. Jung, H.Y.; Gene, E.S. Plans to Help Forestry Households Overcome Their CRISIS through Their Linkage to a 6th Industry in South KOREA. Int. J. Hum. Disaster. 2017, 2, 23–26. [Google Scholar]
  4. Bola, F. Making the Case for Reforms of Forestry Policy and Law: Lessons and Experiences from Nigeria. Environ. Law Policy 2021, 51, 317–325. [Google Scholar]
  5. Bei, S.; Wang, Y.; Shen, J. Research on the impact of innovation on the level of high-quality forestry development. For. Econ. 2023, 45, 5–19. [Google Scholar]
  6. Bureau of Statistics of the People’s Republic of China. China Statistical Yearbook; China Statistics Press: Beijing, China, 2022.
  7. Hamza, I.A.; Iyela, A. Land Use Pattern, Climate Change, and Its Implication for Food Security in Ethiopia: A Review. Ethiop. J. Environ. Stud. Manag. 2012, 5, 26–31. [Google Scholar] [CrossRef]
  8. Wei, X.; Wang, S.; Tang, J.; Zhao, J.; Huang, L. Effects of multi-generation continuous planting of eucalyptus on soil fertility in the red soil area of Guinan. J. Southwest Univ. (Nat. Sci.) 2023, 43, 81–88. [Google Scholar]
  9. Li, Z.; Qi, L.; Wei, X. Relationship between forestry ecological security protection and sustainable development--A review of Research on Forestry Ecological Security and Law Enforcement of Endangered Wildlife Protection. J. China Saf. Sci. 2023, 33, 241–242. [Google Scholar]
  10. Yang, H.; Gou, X.; Ma, W.; Tang, C.; Xue, B. Research progress on the valuation of forest ecosystem service functions in China from 2010 to 2021. Chin. J. Ecol. 2024, 43, 244–253. [Google Scholar] [CrossRef]
  11. Li, Z.; Sun, D.; Wang, Z. Diagnosis of Drivers and Obstacles to the Performance of Industrial Transformation in State Forestry Areas of Greater and Lesser Xing’anling. J. Northeast. For. Uni. 2020, 48, 133–138. [Google Scholar]
  12. Wen, N.; Zhou, H.; Zhang, H. Study on the Influencing Factors of Farmers’ Behavioral Response to Farmland Protection Forest Management—Based on the Survey Data of 1106 Farmers in Xinjiang. For. Econ. 2021, 43, 71–83. [Google Scholar]
  13. Jiang, X.; Niu, Z.; Wang, H.; Wang, W. Impact of forestry ecological construction and protection investment on forestry industry development. Ecol. Econ. 2023, 39, 112–121. [Google Scholar]
  14. Oh, D. A global Malmquist-Luenberger productivity index. J. Product. Anal. 2010, 3, 183–197. [Google Scholar] [CrossRef]
  15. Xu, L.; Liu, Y. Ecological Legal Construction and Green Total Factor Productivity—Based on an Environmental Court Perspective. Front. Econ. Manag. 2024, 5, 11–17. [Google Scholar]
  16. Yin, H.; Cao, Y. Test on the Policy Effect of Natural Forest Protection Project Using Double Difference Model from the Perspective of Forestry Total Factor Productivity. Math. Probl. Eng. 2022, 1, 9800727. [Google Scholar] [CrossRef]
  17. Fan, W. Green Education Promotes the Mechanism of Green Agricultural Production by Farmers in Hunan Region and Its Influencing Factors. J. Innov Devel. 2024, 6, 62–70. [Google Scholar] [CrossRef]
  18. Xu, G.; Xue, D. Driving high-quality development of the Yellow River Basin with high-level ecological protection. Acad. J. Zhongzhou 2021, 10, 26–32. [Google Scholar]
  19. Porter, M.E.; Linde, C. Toward a new conception of the environment competitiveness relationship. J. Econ. Persp. 1995, 4, 97–118. [Google Scholar] [CrossRef]
  20. Bai, Y.; Feng, D. Research on the coupling and coordinated development of agricultural economy and ecological environment system in Chongqing municipality. Agric. For. Econ. Manag. 2024, 7, 112–122. [Google Scholar]
  21. Jin, M.; Chen, N.; Sun, H.; Cao, F. Characteristics of Spatial–Temporal Differences and Measurement of the Level of Forestry Industry Integration in China. Sustainability. 2023, 15, 8855. [Google Scholar] [CrossRef]
  22. Yuan, B.; Xiang, Q. Environmental regulation, industrial innovation and green development of Chinese manufacturing: Based on an extended CDM model. J. Clean. Prod. 2018, 176, 895–908. [Google Scholar] [CrossRef]
  23. Cheng, M.; Shao, Z.; Yang, C.; Tang, X. Analysis of coordinated development of energy and environment in China’s manufacturing industry under environmental regulation: A comparative study of sub-industries. Sustainability. 2019, 11, 6510. [Google Scholar] [CrossRef]
  24. Chen, H.; Ma, Z.; Xiao, H.; Li, J.; Chen, W. The Impact of Digital Economy Empowerment on Green Total Factor Productivity in Forestry. Forests 2023, 14, 1729. [Google Scholar] [CrossRef]
  25. Li, S.; Yin, X. Analysis of the impact of rural labor transfer on agricultural total factor productivity in China. J. Agrotech. Econ. 2017, 9, 4–13. [Google Scholar]
  26. Wang, S.; Liao, C.; Xu, S.; Huang, M. Competitiveness evaluation of low-carbon development in central China under the orientation of people’s livelihood and well-being—Empirical evidence based on AHP-TOPSIS model. Reg. Res. Devel. 2014, 33, 153–158. [Google Scholar]
  27. Lei, S.; Fan, Y.; Xie, J. Evaluation of soil erosion risk and its correlation with the development of agriculture, forestry, animal husbandry and fishery in western China. Dis. Sci. 2023, 38, 25–29+52. [Google Scholar]
  28. Li, D.; Li, Y.; Tian, G.; Mendako, R.K. The Impact of Environmental Regulation on the Green Overall Factor Productivity of Forestry in the Yangtze River Economic Belt. Forests 2023, 14, 2004. [Google Scholar] [CrossRef]
  29. Ahakwa, I.; Tackie, A.E. Natural resources as a double-edged sword towards ecological quality: Can environmental regulations and green human capital rectify the adverse impacts? J. Clean. Prod. 2024, 457, 142436. [Google Scholar] [CrossRef]
  30. Lu, W.; Qin, Z.; Yang, S. Heterogeneity effects of environmental regulation policy synergy on ecological resilience: Considering the moderating role of industrial structure. Environ. Sci. Pollut. Res. 2024, 31, 8566–8584. [Google Scholar] [CrossRef]
  31. Wang, Z.; Chen, Y.; Zhang, M. Traditional financial supply and digital financial development: Supplement or substitute?—Based on the perspective of regional institutional differences. Econ. Manag. 2021, 43, 5–23. [Google Scholar]
  32. Wang, J.; Che, S. Policy effectiveness of environmental information disclosure under the dual-carbon goal—Empirical evidence from a quasi-natural experiment. Syst. Eng. 2023, 41, 41–51. [Google Scholar] [CrossRef]
  33. Cui, W.; Man, Y.; Yang, R. Regional economic growth, energy consumption structure, and carbon neutrality in China. Consum. Econ. 2023, 39, 51–64. [Google Scholar]
  34. He, L.; Qi, X. Environmental regulation and green total factor productivity—Evidence from Chinese industrial firms. Econ. Perspect. 2022, 6, 97–114. [Google Scholar]
  35. Ren, Y.; Wang, W.; Song, H. Environmental regulation and high-quality economic development: Linkage and transmission mechanism. J. Shandong Univ. (Philos. Soc. Sci.) 2022, 5, 154–164. [Google Scholar]
  36. Liu, T.; Du, S. Construction of evaluation index system of agricultural high-quality development based on new development concept. Chin. J. Agric. Resour. Reg. Plan. 2021, 42, 1–9. [Google Scholar]
  37. Wu, L.; Zhang, Z. Impact and threshold effect of Internet technology upgrade on forestry green total factor productivity: Evidence from China. J. Clean. Prod. 2020, 271, 122657. [Google Scholar] [CrossRef]
  38. Song, M.; Zhao, X.; Choi, Y. Technical efficiency of Chinese forestry and its total factor productivity for the adaption of climate change. J. For. Econ. 2020, 35, 149–175. [Google Scholar] [CrossRef]
  39. Tanja, M. Environmental management of a tourist destination—A factor of tourism competitiveness. Tour. Manag. 2000, 21, 65–78. [Google Scholar]
  40. Twan, H.; Jeff, B. Environmental management and the competitiveness of nature-based tourism destinations. Environ. Resour. Econ. 2003, 24, 213–233. [Google Scholar]
  41. Zhang, Z.; Zhao, W. Does digital finance promote the upgrading of county industrial structure?—A Quasi-Natural Experiment Based on the Entry of Netcommerce Bank into Rural Market. Financ. Econ. 2024, 3, 47–57. [Google Scholar]
  42. Xu, C.; Pan, Z. Threshold effect of regional green water resources efficiency enhancement—A perspective based on heterogeneous environmental regulation. Jilin Univ. J. Soc. Sci. Ed. 2019, 59, 83–94+220–221. [Google Scholar]
  43. Shadbegian, R.J.; Gray, W.B. Pollution Abatement Expenditures and Plant-level Productivity: A Production Function Approach. Ecol. Econ. 2005, 54, 196–208. [Google Scholar] [CrossRef]
  44. Jia, P.; Yang, B.; Wang, H.; Liu, Y. Assessment of green development level of industries in the Yangtze River Economic Zone. Water Source Prot. 2023, 39, 142–149. [Google Scholar]
  45. Wang, F.; Tian, M.; Qin, G. Coupling, coordination and optimization of new urbanization and industrial structure upgrading. East China Econ. Manag. 2020, 03, 59–68. [Google Scholar]
  46. Zhou, M.; Li, L.; Zhu, X. Influence of New Urbanization on Industrial Structure Adjustment and its Path of Action—An Empirical Analysis Based on the Mediation Effect. Financ. Trade Res. 2020, 5, 28–38. [Google Scholar]
  47. Liu, X. Case study of common forest planting techniques and forest resource management. Digit. Agric. Intell. Agric. Mach. 2024, 2, 97–100. [Google Scholar]
  48. Xing, Y.; Chen, D. Research on ecological forestry compensation mechanism based on evolutionary game. J. Harbin Univ. Commer. (Nat. Sci. Ed.) 2018, 5, 77–87+97. [Google Scholar]
  49. Zhao, H.; Huang, A. Impact of rural informal finance on forestry industry development—An empirical analysis based on panel data from 30 provinces in China. For. Econ. 2022, 44, 50–60. [Google Scholar]
  50. Yang, L.; Zhou, Y. Environmental regulation and the transformation and upgrading of urban manufacturing industry—A dual perspective analysis based on green transformation of industrial structure and technological upgrading of enterprises. Syst. Eng. Theory Pract. 2022, 42, 1616–1631. [Google Scholar]
  51. Lin, P.; Meng, N. Measuring the quality and deconstructing the dynamics of economic development in Beijing-Tianjin-Hebei region under environmental constraints--Based on the perspective of green total factor productivity. Econ. Geogr. 2020, 40, 36–45. [Google Scholar]
  52. Zhao, Y.; Wang, J.; Pan, W. Regional Characteristics of New Urbanization Level and Green Development Level in Chinese Provinces and Their Influencing Mechanisms. Econ. Geogr. 2023, 43, 1–9. [Google Scholar]
  53. Jiang, T. Mediating and moderating effects in empirical studies of causal inference. China Ind. Econ. 2022, 5, 100–120. [Google Scholar]
  54. Hansen, B.E. Threshold effects in non-dynamic panels: Estimation, testing, and inference. J. Econ. 1999, 2, 345–368. [Google Scholar] [CrossRef]
  55. Seo, M.H.; Shin, Y. Dynamic panels with threshold effect and endogeneity. J. Econ. 2016, 195, 169–186. [Google Scholar] [CrossRef]
  56. Zhang, H.; Li, Y. Research on the coupling and coordination relationship between digital economy and high-quality forestry development. For. Econ. 2023, 45, 50–72. [Google Scholar]
  57. Li, F.; Miao, Q. Spatial network characteristics of the coupling of urban ecological protection and high-quality economic development in the Yellow River Basin. Stat. Decis. 2022, 38, 80–84. [Google Scholar]
  58. Sun, J. Coupled coordination of ecological protection and high-quality development in the Yellow River Basin: Evaluation and trend. Financ. Econ. 2021, 3, 106–118. [Google Scholar]
  59. Shi, B.; Feng, C.; Zhang, Y.; Yang, F. Marginal incremental effect of environmental regulation dividend. China Ind. Econ. 2017, 12, 40–58. [Google Scholar]
  60. Shi, H.; Yi, M. Research on the impact of environmental regulation on high-quality development and spatial spillover effects. Inq. Econ. Issues 2020, 5, 160–175. [Google Scholar]
  61. Huang, X.; Zhu, J.; Yang, M. Research on the impact of environmental protection on the utilization efficiency of forest resources. For. Grassl. Resour. Res. 2017, 6, 113–119. [Google Scholar]
  62. Qi, F.; Pei, X.; Ye, Y. Empirical evidence on the impact of environmental protection and green finance on high-quality economic development. Stat. Decis. 2022, 38, 160–164. [Google Scholar]
  63. Wen, S.; Guan, J.; Yang, Y. Construction and measurement of evaluation index system for high-quality development of China’s forestry industry. Issues For. Econ. 2022, 42, 241–252. [Google Scholar]
  64. Wang, Y.; Sun, X.; Guo, X. Environmental Regulation and Green Productivity Growth: Empirical Evidence on the Porter Hypothesis from OECD Industrial Sectors. Energy Policy 2019, 132, 613–619. [Google Scholar] [CrossRef]
Figure 1. Mechanisms for the impact of ecological protection on high-quality forestry development. Note: Hypothesis 1 is the direct effect of ecological protection on high-quality forestry development. Hypothesis 2 introduces heterogeneity analyses in terms of geography and forest cover. Hypothesis 3 introduces environmental regulation to explore the mediating effects. Hypothesis 4 introduces the level of urbanization to explore the non-linear effect.
Forests 15 01354 g001
Figure 2. The division of eastern, central, western, and northeastern areas, as well as the distribution of areas with high and low forest coverage in China. Note: The maps are based on the standard map produced under the supervision of the Ministry of Natural Resources of the People’s Republic of China: Approval number GS (2019) 1823. We can enter the map approval number (GS (2019) 1823) in the search bar (http://bzdt.ch.mnr.gov.cn/) on the webpage to confirm. The eastern regions include Beijing, Tianjin, Shanghai, Hebei, Shandong, Jiangsu, Zhejiang, Fujian, Guangdong, and Hainan. The central regions include Shanxi, Henan, Hubei, Anhui, Hunan, and Jiangxi. The western regions include Inner Mongolia, Xinjiang, Ningxia, Shaanxi, Gansu, Qinghai, Chongqing, Sichuan, Guangxi, Guizhou, and Yunnan. The Northeast regions include Heilongjiang, Jilin, and Liaoning. The high forest coverage regions include Heilongjiang, Jilin, Beijing, Zhejiang, Fujian, Jiangxi, Hubei, Hunan, Guangdong, Guangxi, Hainan, Chongqing, Guizhou, Yunnan, and Shaanxi. The low forest coverage regions include Tianjin, Hebei, Shanxi, Inner Mongolia, Liaoning, Shanghai, Jiangsu, Anhui, Shandong, Henan, Sichuan, Gansu, Qinghai, Ningxia, and Xinjiang. Tibet has been excluded in this article.
Forests 15 01354 g002
Figure 3. Methodological Technology Roadmap. Note: The white diamond-shaped boxes are mechanism analyses, including heterogeneity and threshold effect analyses.
Forests 15 01354 g003
Figure 4. Map of temporal characteristics of ecological protection. Note: The detailed distribution of the 30 provinces in China is shown in Figure 2. (a) The changes in the ecological protection index from 2010 to 2021. (b) The ecological protection index for 30 provinces from 2010 to 2021. (c–e) represent the changes in the composite index of the first dimension of China’s ecological protection level in 2010, 2015, and 2022. (fh) represent the changes in the second dimension composite index of China’s ecological protection level in 2010, 2015 and 2022. (ik) represent the changes in the third dimension composite index of China’s ecological protection level in 2010, 2015 and 2022. (l) The map of kernel density for ecological protection from 2010 to 2021 in China.
Forests 15 01354 g004aForests 15 01354 g004bForests 15 01354 g004c
Figure 5. Map of spatial characteristics of ecological protection. Note: (ac) indicate the ecological protection level index distribution in China in 2010, 2015 and 2021.
Forests 15 01354 g005
Figure 6. Map of temporal characteristics of high-quality forestry development. Note: The detailed distribution of the 30 provinces in China is shown in Figure 2. (a) The changes in the high-quality forestry development index from 2010 to 2021. (b) High-quality forestry development index for 30 provinces from 2010 to 2021. (ce) represent the changes in the first dimension composite index of China’s high-quality forestry development in 2010, 2015 and 2022. (fh) denote the changes in the second dimension composite index of high-quality development of China’s forestry industry in 2010, 2015, and 2022. (ik) represent the changes in the third dimension composite index of high-quality development of China’s forestry industry in 2010, 2015, and 2022. (l) The map of kernel density for high-quality forestry development from 2010 to 2021 in China.
Forests 15 01354 g006aForests 15 01354 g006b
Figure 7. Map of spatial characteristics of high-quality forestry development. Note: (ac) The distribution of the high-quality forestry development level index in 2010, 2015, and 2021 in China.
Forests 15 01354 g007
Figure 8. Plot of threshold likelihood ratio function. Note: Red dotted line (7.3523) represents the critical value of LR statistics at a 95% confidence level.
Forests 15 01354 g008
Table 1. Evaluation index system for ecological protection level and high-quality forestry development level.
Target LayerRule LayerIndex LayerUnitCharacteristicWeight
High-quality forestry developmentWealth sharing (0.350)Total forestry outputTen thousand RMB+0.140
Percentage of forestry output in the primary sector%+0.137
Investment in forestry research and developmentBillion RMB+0.074
Talent development (0.226)Number of people working in forestryPerson+0.033
Average annual wage in forestryRMB+0.087
Percentage of professional and technical staff%+0.106
Green development (0.422)Afforestation areaHm2+0.121
Forest pest and rodent control rate%+0.141
Forest cover%+0.160
High level of ecological protectionStatus of ecological resources (0.273)Compliance rate for Class I and II water%+0.106
Air quality excellence rate%+0.094
Pollutant emissions (0.570)Industrial wastewater dischargeMillion tons-0.182
General industrial solid waste generationMillion tons-0.157
The number of environmental emergenciesPiece-0.288
Environmental management (0.157)Centralized treatment rate of sewage treatment plants%+0.090
Greening coverage in built-up areas%+0.068
Funding for ecological environmental protectionBillion RMB+0.014
Table 2. Control variables and variable definitions.
Variable NameVariable SymbolVariable Definition
Level of innovationLnInnoNumber of domestic patent applications received (logarithms)
Level of transport infrastructureLnTransMiles of road (logarithmic)
Level of informatizationInforTotal post and telecommunications business/GDP
Level of economic developmentLnGDPGDP per capita (logarithmic)
Level of government interventionGovFiscal expenditure/GDP
Table 3. Descriptive statistics of variables.
VariablesSample SizeAverageStandard DeviationMinimumMaximum
HQD3600.1530.0390.0830.281
Eco3600.1800.0250.1270.547
LnInno3607.8801.6153.68911.896
LnTrans36011.2820.8868.74612.643
Infor3600.0760.0470.0180.290
LnGDP3609.3190.4648.46710.781
Gov3600.1900.0840.0790.612
Table 4. Baseline regression results of the impact of ecological protection on the high-quality forestry development.
(1)(2)
Core Explanatory VariableCore Explanatory Variable + Control Variables
Eco0.179 **
(2.17)
0.146 **
(2.22)
LnInno-0.006 ***
(3.62)
LnTrans-0.026 ***
(8.67)
Infor-0.086 **
(2.42)
LnGDP-0.005
(0.8)
Gov-−0.001
(−0.07)
_Cons0.121 ***
(8.08)
−0.269 ***
(−3.22)
Sample size360360
R-sq0.0130.439
F4.70346.02
Province FEYY
Year FEYY
Note: *** and ** are significant at the 1% and 5% statistical levels, with standard errors in parentheses.
Table 5. Robustness test results.
(1)(2)(3)
Excluding Some SamplesReplacing Core Explanatory VariablesShrinking Tail Processing
Eco0.169 **
(2.39)
1.624 ***
−3.47
0.587 ***
−5.54
LnInno0.006 ***
(2.97)
0.057 ***
−4.95
0.005 ***
−3.22
LnTrans0.026 ***
(6.02)
0.067 ***
−3.12
0.027 ***
−10.06
Infor0.083 **
(2.02)
0.205
−0.81
0.092 **
−2.5
LnGDP0.002
(0.27)
0.014
−0.3
0.007
−1.1
Gov−0.009
(−0.37)
−0.901 ***
(−5.90)
−0.040 *
(−1.66)
_Cons−0.238 **
(−2.48)
−1.191 **
(−2.00)
−0.362 ***
(−4.58)
Sample size312360360
R-sq0.390.3640.505
F32.5133.6460.06
Province FEYYY
Year FEYYY
***, **, and * are significant at the 1%, 5%, and 10% statistical levels, with standard errors in parentheses.
Table 6. Results of the heterogeneity analysis of ecological protection on high-quality forestry development.
(1)(2)(3)(4)(5)(6)
Eastern RegionCentral RegionWestern RegionNortheastern RegionHigh Forest CoverLow Forest Cover
Eco−0.023
(−0.54)
0.479 *
(1.88)
1.392 ***
(4.13)
4.765 *
(1.83)
0.745 **
(2.54)
−0.002
(−0.06)
Cons0.625 **
(−2.41)
−0.0876 *
(−1.70)
0.180 ***
(−5.06)
0.748
(0.35)
−1.023 ***
(−4.15)
−0.626 ***
(−3.79)
Sample size1207213236180180
Control variablescontrolcontrolcontrolcontrolcontrolcontrol
Province FEYYYYYY
Year FEYYYYYV
Observations11.8614.6211.641.11315.0811.03
R20.6840.8350.6550.5420.6340.559
Note: ***, **, and * are significant at the 1%, 5%, and 10% statistical levels, with standard errors in parentheses. Heterogeneity analysis based on geographical location (1)–(4) and forest coverage (5)–(6) (Please refer to the note in Figure 3 for details).
Table 7. Results of the mediating mechanism test.
(1)(2)(3)
HQDEnvHQD
Eco0.179 **
(2.17)
−0.021 ***
(−2.97)
0.116
(1.43)
Env--−2.998 ***
(−5.07)
Control variablesControlControlControl
_Cons0.121 ***
(8.08)
0.007 ***
(5.53)
0.143 ***
(9.44)
R-sq0.0130.0240.079
F0.010.020.07
Note: *** and ** are significant at the 1% and 5% statistical levels, with standard errors in parentheses.
Table 8. Sobel test results.
Efficiency ValueStandard Errorp > |Z|Percentage of Effect
Sobel0.0640.2480.010-
Total effect0.1790.0830.0300.355
Indirect effect0.0640.0250.010-
Direct effect0.1160.0810.153-
Table 9. Bootstrap test results.
Standard Errorp > |Z|Confidence Interval
Lower LimitUpper Limit
Indirect effect0.0380.0910.0340.169
Direct effect0.1580.4650.0060.544
Table 10. Threshold effect test results.
CoefficientRobust Standard Errorp > |Z|Confidence Interval
00.1560.0610.0100.276−0.037
10.0600.0530.2540.0470.164
20.2260.0560.0000.1150.337
_Cons0.130−3.3400.0000.1090.151
Disclaimer/Publisher’s Note: The statements, opinions and data contained in all publications are solely those of the individual author(s) and contributor(s) and not of MDPI and/or the editor(s). MDPI and/or the editor(s) disclaim responsibility for any injury to people or property resulting from any ideas, methods, instructions or products referred to in the content.

