Article

Factors Driving Unexpected Drought-Induced Nothofagus dombeyi Mortality in a Valdivian Temperate Rainforest, Argentina

by
María Laura Suarez
*,
Yamila Sasal
and
Loreta Facciano
Laboratorio de Investigaciones en Ecología de Bosques-LIEB, Instituto de Investigaciones en Biodiversidad y Medioambiente (INIBIOMA, CONICET-UNCO), Pasaje Gutiérrez 1415, San Carlos de Bariloche CP8400, Rio Negro, Argentina
*
Author to whom correspondence should be addressed.
Forests 2024, 15(8), 1355; https://doi.org/10.3390/f15081355
Submission received: 28 June 2024 / Revised: 30 July 2024 / Accepted: 31 July 2024 / Published: 2 August 2024
(This article belongs to the Special Issue Tree Growth in Relation to Climate Change)

Abstract

:
Understanding the drivers of drought-induced tree mortality remains a significant scientific challenge. Here, we investigated an unexpected mortality event of Nothofagus dombeyi (Mirb.) Oerst. following the 2014–15 drought in a Valdivian rainforest, Argentina. Our focus was on long-term growth trend differences between vital and dead trees, and how the mixing of species in tree neighbourhoods drives tree growth during drought. The inter-annual variation of basal area increments of vital and 2014–15-dead N. dombeyi trees showed a similar pattern through the 1930–2015 period, while the climate–growth relationships indicated that precipitation during the growing season promoted growth in both vitality classes, regardless of whether they were in the wettest location. For the period 1990–2015, both vitality classes showed similar estimated growth regardless of competition level, whereas species mingling in the neighbourhood significantly affected the dead tree growth. Network analysis revealed that drought performance covaried positively with a neighbourhood dominated by species functionally different from the focal species only in vital trees. These findings suggest a nuanced response of N. dombeyi to drought, shaped by multifaceted interactions at both the individual tree and neighbourhood levels. This research underscores that species-specific relationships under different mixtures imply different tree responses within a stand, and add complexity to understanding drought response at the individual level.

1. Introduction

A report by the IPCC warns that the average global temperature will reach 1.5 °C warmer than pre-industrial times due to human activity, and the frequency and severity of heatwaves and droughts are projected to increase in many regions worldwide [1]. In this context, the southern Andean region has proved to be no exception, as the region has shown an abrupt trend toward warmer and drier conditions since the mid-twentieth century [2]. These already occurring and expected changes in temperature and precipitation may have important consequences for the southern ecosystems with a significant level of endemism and endangered species. The temperate forests of southern Patagonia, among other Andean ecosystems, have begun to show clear evidence of a negative impact from the changes in climate parameter trends, as widespread tree mortality events following droughts are being recorded in Chile and Argentina [3,4,5]. However, understanding and predicting tree mortality during or after droughts remains a scientific challenge worldwide, as it is still hard to predict when and where it will occur, and which tree will die as a consequence of a drought [6].
Tree rings store information on climate, site, and local environmental effects on tree growth, and are a powerful tool for studying drought impacts on multi-year tree performance. Tree ring patterns can reveal not only short- and long-term trends in climate influence on tree productivity, but also mid- and long-term trends in nutrient uptake [7], water use efficiency [8], and competition pressure at the local neighbourhood scale during dry spells [9]. This retrospective quantification of drought impact on long-term growth and vigour highlights the declining trend that prevails after droughts in many species worldwide [10]. Successive drought events can compound the stress that trees experience, leading to more pronounced decreases in growth rates [11], which finally erodes trees’ resilience capacity (i.e., reduces their ability to regain pre-drought growth rates [12,13]).
Although tree physiological traits remain an important factor in understanding drought-driven death [14], the accuracy of explanations has been limited as trees’ drought performance covaries with factors acting at individual, site, and community levels. In this regard, tree resilience components, in terms of growth performance, depend among others factors like soil characteristics [15], stand density [16], and species composition [17]. This creates a complex network that ultimately influences individual tree performance and resilience to dry spells [18], which makes it very difficult to rank individual responses in a stand. Species mixing implies the presence of different compensation strategies to cope with droughts in relation to the species’ different functional traits [19]. These strategies can operate at the underground level, with root systems occupying different soil layers to access water resources, thereby creating spatial complementarity that can benefit other species [20]. Additionally, the development of canopies with varied architecture and phenology allows for the efficient use of light. Shade-tolerant species can establish beneath the canopy, while light-dependent species thrive in direct sunlight [21]. While stand diversity improves the average stand productivity due to complementary, the positive effects cannot prevail over negative effects (e.g., competition) during stressful conditions [22,23]. However, additional factors could unbalance this relationship, leading to disparate results of the effects of stand diversity on tree performance in the face of drought [24,25]. Different climate–growth sensitivity along gradients drives different patterns in tree drought response across species’ distribution range [26]. Thus, in dry sites where water availability is a major constraint, competition could override any complementarity advantage of stand diversity, whereas in humid sites, the complementarity effect could determine drought response [22]. However, species-specific relationships under different mixtures in the immediate tree neighbourhood add complexity to understanding drought response at the individual level [27]. While the influence of climatic stressors on tree growth responses is recognized, the specific impact of other ecological traits on these relationships remains a topic of ongoing research.
As we stated above, Andean temperate forests have not been an exception to the context of forest vulnerability to climate change. Over the last few decades, there has been a significant negative impact of droughts on Nothofagus dombeyi (Mirb.) Oerst. (Nothofagaceae), a dominant tree species of the temperate forest in Patagonia, Argentina, with strong pervasive effects on species growth, leading to mortality [5,7,28,29]. N. dombeyi is one of the ten Nothofagus species in southern South America, and is considered a shade- and drought-intolerant species, conditions found in several environments of the Patagonian Andes. As a broadleaf evergreen species, reaching 30–40 m tall, it has suffered leaf browning and shedding during past droughts, which implies crown dieback and sudden tree mortality [28]. All the recorded mortality events in N. dombeyi have been observed towards the eastern limit of the species distribution, suggesting that the negative impacts of drought are more pronounced on the leeward side of the Andes, which typically receives less moisture. This spatial dimension in the discussion of N. dombeyi’s response to drought and mortality led us to suggest a gradient of vulnerability to drought impacts [30]. However, following the 2014–15 dry period, an unexpected event of sudden N. dombeyi mortality occurred in a portion of the Valdivian rainforests, a region with ~3500 mm year−1 in precipitation [31].
Motivated by this unique and rare event, we started a dendroecological study to uncover the factors that led to N. dombeyi mortality in this specific location, which also has a high level of tree biodiversity. We specifically (i) reconstructed and analysed the growth patterns and climate sensitivity in vital and dead N. dombeyi trees, and (ii) related these growth patterns and drought responses to several factors associated with tree neighbourhood characteristics in order to determine their role as drivers of tree mortality. Our main hypothesis posited that an increased proportion of species diversity within the tree’s vicinity, or a less dense neighbourhood, positively influences both individual growth patterns and a tree’s response to drought, enhancing its resilience. The study aims to unravel these factors and shed light on why some trees were affected more than others, ultimately contributing to a better understanding of the species response to environmental stressors in this specific context. Although the main areas affected by N. dombeyi forests are included in national parks and no management actions are planned, the identification of mortality factors that can be reduced or reversed, and the synthesis of responses, can be brought back to a set of general management goals relevant for national park policies worldwide.

2. Materials and Methods

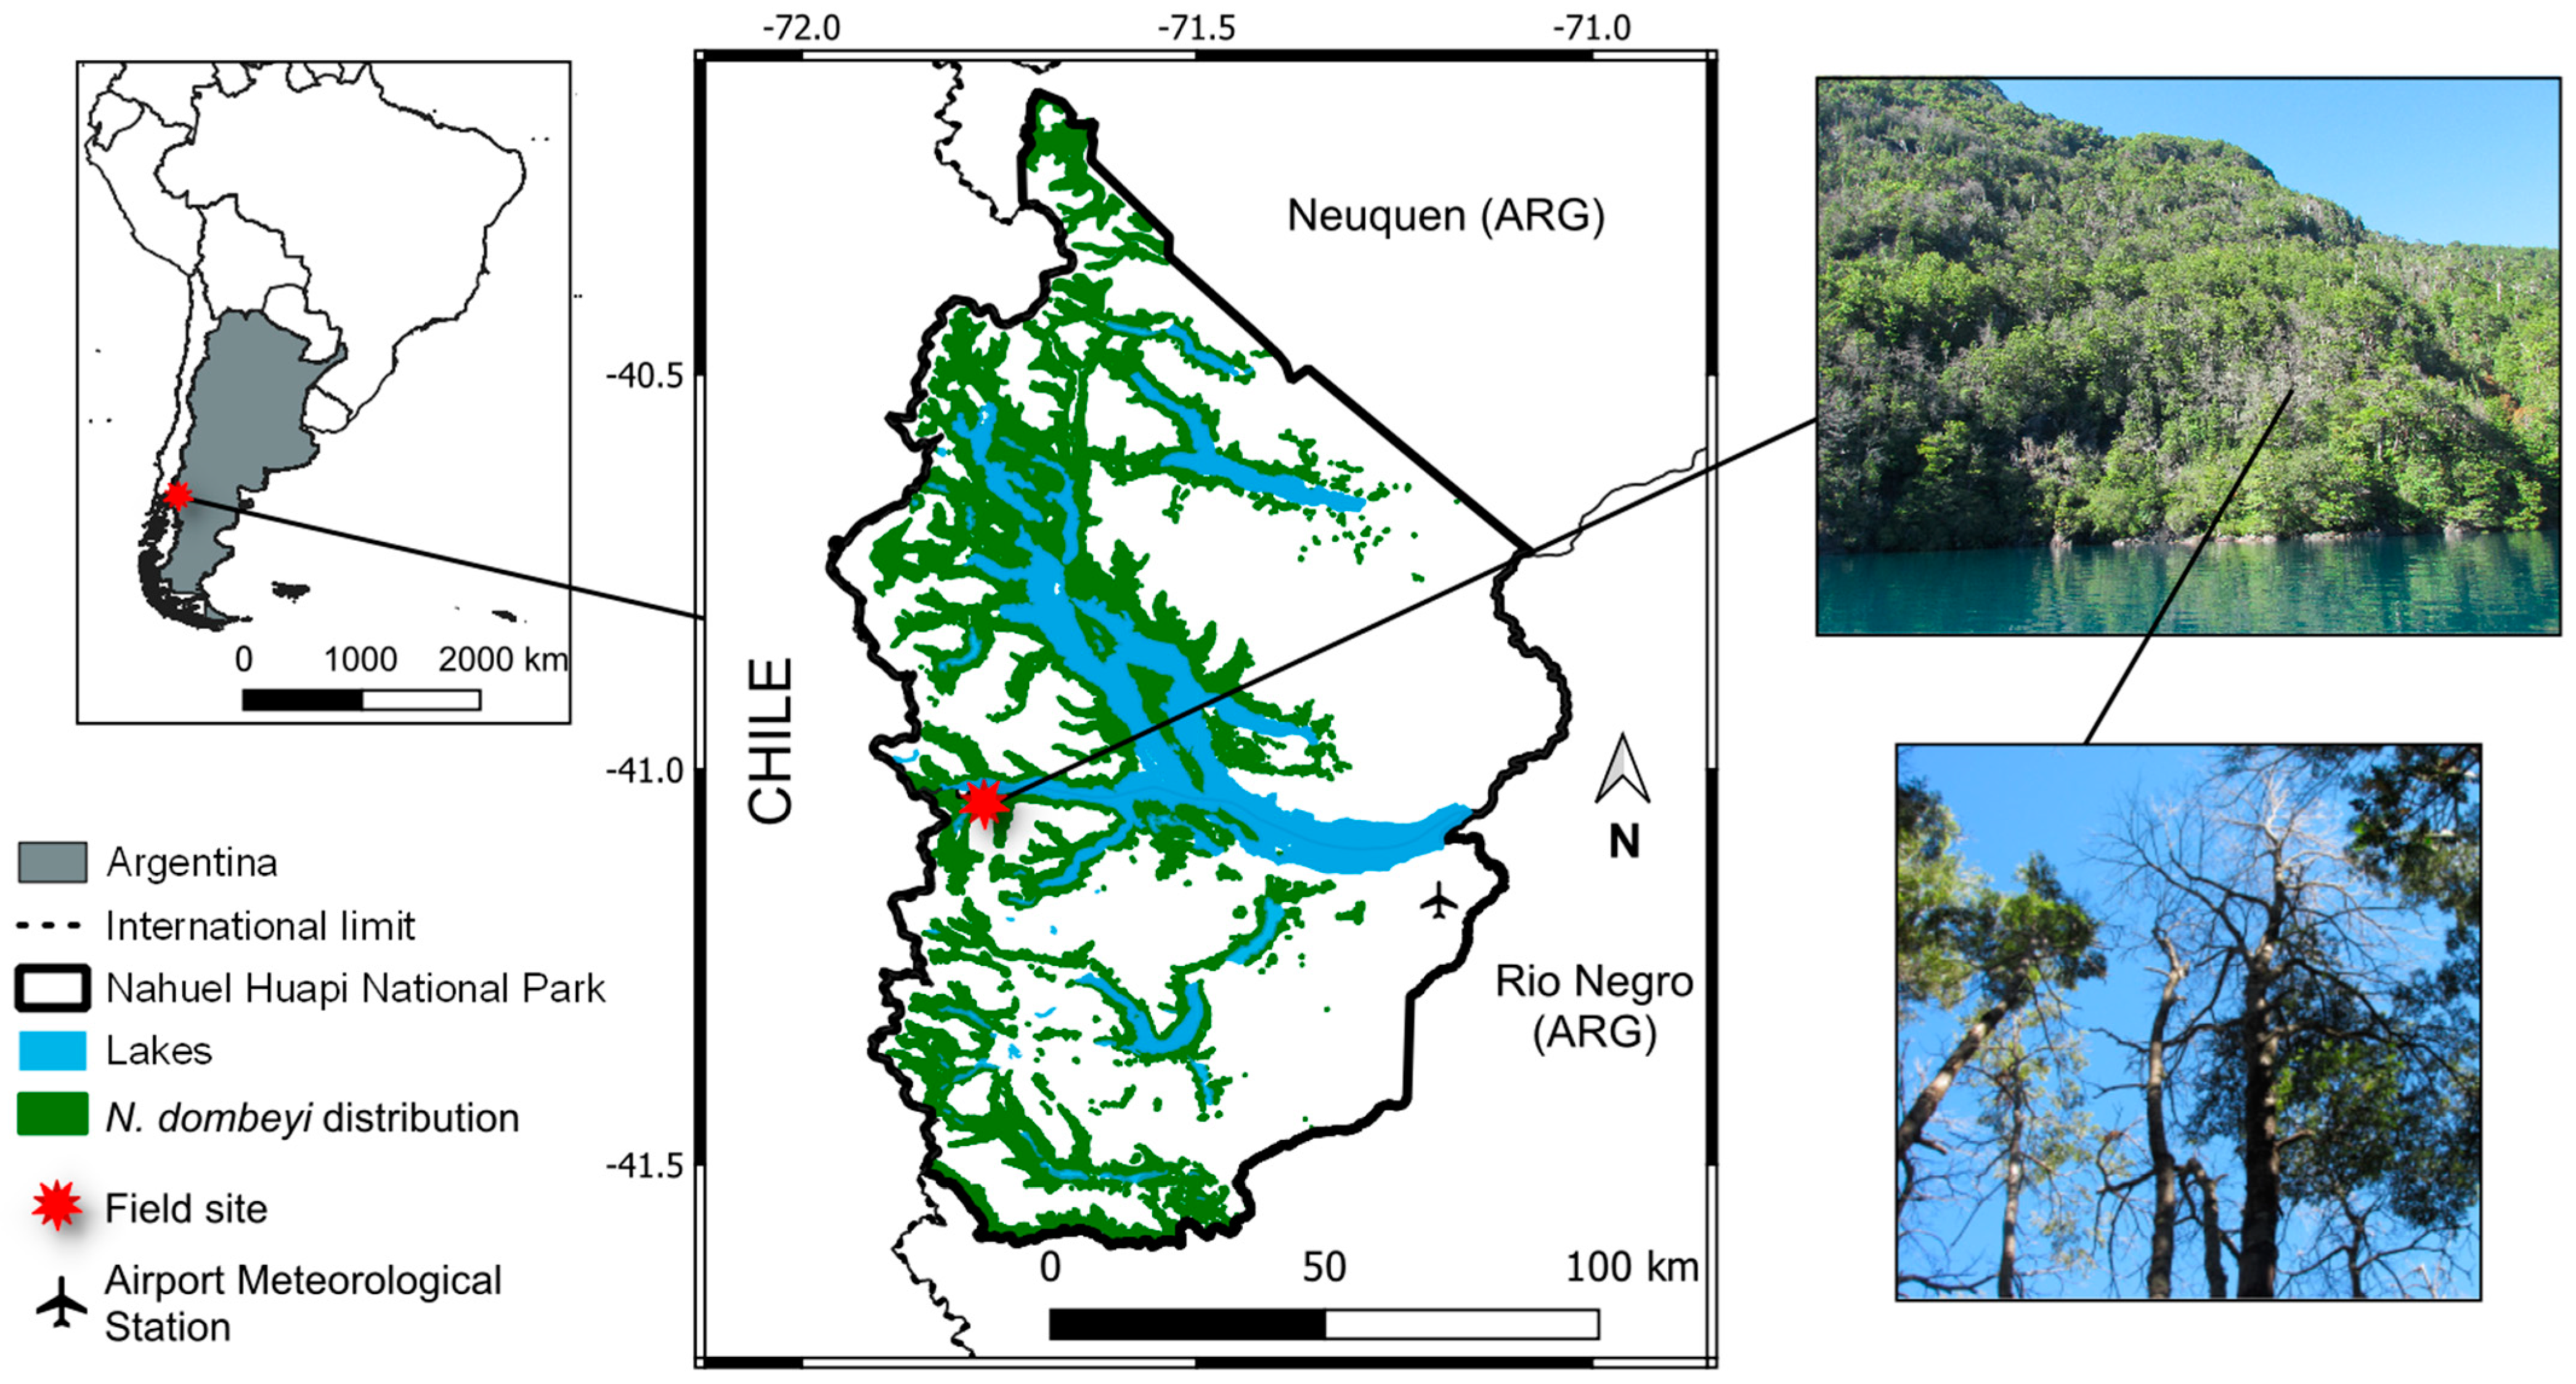
2.1. Study Site and Species

The study area is located near Puerto Blest (41°02′ S, 71° 49′ W; 750 m.a.s.l., Figure 1), and belongs to one of the easternmost relicts of the Valdivian rainforest on the leeward side of the Andes. In Argentina, Valdivian rainforest extends in small fragmented areas, from 40° S to 42° S, and in Nahuel Huapi National Park, Río Negro Province, it comprises a total area of 3.6 km2 (Figure 1) distributed in different small fragments across the National Park. Valdivian rainforest is the westernmost end of a striking west-to-east gradient of precipitation and associated vegetation that characterize the southern Andes, with precipitation ranging from ~3500 mm year−1 (in Valdivian rainforest, Figure S1) to ~500 mm year−1 (on Patagonian steppe) only 100 km to the east [31]. Average annual precipitation in the study area is estimated at ~3500 mm year−1 (Figure S1) and is seasonally distributed with approximately 60% falling between May and August (winter in the Southern Hemisphere), and the annual mean temperature is 9 °C (Figure S1). Between 750 and 900 m. a.s.l., the rainforest is dominated by the shade-intolerant Nothofagus dombeyi, along with the shade-tolerant broadleaf evergreen tree species Saxegothaea conspicua Lindl. (Podocarpaceae), Archidasyphyllum diacanthoides (Less.) P.L. Ferreira, Saavedra & Groppo (Asteraceae), and Weismania tricosperma Cav. (Cunoniaceae). In addition, this relict of the Valdivian rainforests holds the wettest margin population of the conifer Austrocedrus chilensis (D. Don) Florin & Boutelje (Cupressaceae). N. dombeyi establishes immediately following fires and for a period lasting c. 30 years, while the shade-tolerant co-occurring species continue the establishment period under the closed canopy [32]. The understory is shaded by a dense forest canopy and consists of a great diversity of plants [33]. Layers of volcanic ash cover the glacial topography, and the soil throughout the region is derived from these parent materials (Andosol type soils). At the study site, the mean slope was c. 20%, with a northern orientation.
The study area came to our attention when, in the summer of 2015–2016 (September to March in the Southern Hemisphere), a wide portion of the Valdivian rainforests near Puerto Blest showed browned crowns of N. dombeyi trees (Figure 1). This event constitutes the first recorded mortality episode in a Valdivian rainforest of Argentina, but it was not isolated, as we documented other mortality locations in Lago Puelo National Park during the same summer (Suarez, personal record).

2.2. Climate Data, Drought Index, and Selected Dry Spells

Due to the lack of a meteorological station network in northern Patagonia that provides long-term records of climatic data, we downloaded climate data from the Climatic Research Unit, UK (http://www.cru.uea.ac.uk/, accessed on 18 August 2022). We used monthly temperature and precipitation grid-box data for 41.25 S and 71.75 W (grid cell 0.5° × 0.5° latitude–longitude) from the CRUTS v4.05 dataset over the period 1930–2020 [34] to characterize drought severity and climate–growth performance. To do this, we used the climatic data to calculate the standardized precipitation evapotranspiration index (SPEI) for the period 1930–2014 using the SPEI R package [35]. SPEI is a standardized multi-scalar drought index based on precipitation and potential evapotranspiration, in which negative values indicate a negative cumulative water balance [36]. The bootstrapped correlation between residual tree ring chronologies and SPEI showed the strongest correlation during the summer season (SPEI3Jan; Figure S2). We used the R-package treeclim [37] to assess the climate–growth relationships using the correction for the Southern Hemisphere. We focused on the dry spells that caused N. dombeyi mortality (2014–15) and the two main droughts that happened during the last thirty years, 1998–99 and 2008–09, taking into account the calendar year when the growing process starts in the Southern Hemisphere. We defined dry years under the criterion that SPEI values were higher than −1.5 SD (or values were within 10% of the lower values during the same period).

2.3. Field Sampling and Dendrochronological Methods

Across the study area, we sampled 30 dominants that were vital N. dombeyi trees, and 30 dominants that were defoliated (dead) N. dombeyi individuals. The vitality state of the selected trees (focal trees) was assessed based on the presence of non-defoliated crowns. Focal trees were randomly selected across the affected area, with an aspect from north to west. Each focal tree was cored twice at a height of 1.30 m (diameter at breast height (DBH)) using a Pressler increment borer, and perpendicular to the slope. Cores were taken back to the pith in order to estimate tree age at coring height. We recorded the DBH, height, and crown dimensions of the focal tree. Additionally, we characterized its neighbourhood environmental pressure through the following variables: the distance to each neighbour, and the DBH, identity and height of each tree in the focal tree’s vicinity. The area of the neighbourhood was variable as any tree crown that was in contact with the focal tree’s crown was considered as a neighbour. In the lab, the tree cores were air-dried and polished with sandpaper until the tree rings were clearly visible. Afterwards, the tree ring samples were visually cross-dated, scanned at 2400–3200 dpi resolution, and measured to the nearest 0.01 mm using CooRecorder software v9.6. The quality of the cross-dating was examined using COFECHA v 6.06P [38], and we followed the convention for the Southern Hemisphere to date cores (assigning to each tree ring the date of the year in which growth started). The mortality dates of the dead trees (the date of the outermost tree ring) were defined using the chronology developed for healthy trees, and were stated to the summer of 2014–15.

2.4. Long-Term Growth Trend of Vital and Dead Trees

The tree ring width series were transformed into basal area increments (BAIs), which account for decreasing ring widths with increasing tree size [39]. For the BAI calculations, we used the formula
BAI = π (r2t − r2t−1),
where rt and rt−1 is the stem radius corresponding to years t and t − 1, respectively. Each BAI chronology (vital and dead) was obtained by averaging the individual series year-by-year using a biweight robust mean. To detrend each individual tree ring width series (for climate–growth correlation inspection), we applied a cubic regression spline method to remove any influence of age-related trends, with a 50% frequency response cut off at 2/3 of the ring width series length. Afterwards, we applied an autoregressive model to each detrended series to remove the first-order autocorrelation, therefore building residual, pre-whitened ring width indexes. The BAI and ring width index (RWI) chronologies were developed for each tree vitality class (vital and dead). The BAI calculations, series detrending, and chronology computation were performed using the dplR R-package [40] in R software v4.3.3 [41].
To quantify N. dombeyi long-term growth trends according to vitality for the period 1925–2015 and as a function of the tree characteristics and response to climate variables relevant to growth, we built a generalized additive mixed model (GAMM; [42]) by adjusting the individual BAI as a function of linear and smooth predictors. We considered tree vitality (vital or dead) and DBH (to control for ontogenetic factors) as linear predictors, and calendar year, SPEI3Jan, and their interaction as thin plant spline regression with 4 degrees of freedom or tensor products [42]. As the BAI data represent repeated measures of the same individual, we included tree identity as a random factor. Finally, we included a first-order autocorrelation structure (AR1) to account for dependency of the BAI in year t on the BAI of the previous year, t−1. To achieve normality assumptions, the BAI was log-transformed [log (BAI + 1)] prior to the analyses, and all explanatory variables were standardized by subtracting their means and dividing by their standard deviation to provide comparable coefficients. We used the mgcv R-package [43] to build the generalized additive mixed models.

2.5. Effect of Species Diversity on Tree Growth and Drought Performance

We quantified the immediate neighbourhood influence by a tree-based size–distance-dependent competition index (CI) and a species mingling index (M). The CI of each focal tree i was calculated taking into account the DBH of the focal tree and the number, DBH, and distance to the neighbouring trees as follows:
C I i = j = 1 N D B H j D B H i × d i s t i j ,
where DBHi and DBHj are the DBH measurements for the i focal and j neighbouring trees, respectively, and distij is the distance between them [44]. The mingling index describes the species variety (vij) in the vicinity of the focal tree i and is defined as the proportion of the n nearest neighbours j that do not belong to the same species [45], as follows:
M i = 1 n × j = 1 n v i j ,
The mingling values range between zero and one (0 ≤ M ≤ 1), with M close to zero meaning that the neighbour j belongs to the same species as the focal tree i, while M values close to one indicate the opposite. The advantage of mingling over common diversity indices (e.g., Shannon) is the ability to distinguish a neighbourhood dominated by N. dombeyi from one dominated by a species other than the focal species, both being of low diversity.
To evaluate the effect of neighbourhood influence on tree growth, we built a linear mixed-effect model for the period 1990–2014. We selected a linear model instead of an additive one, because we shortened the period to avoid uncertainty regarding the stand structure >25 years ago (although no evidence of past logging, recent fire, or mortality was recorded, and the trees are long-lived species). We included the effect of SPEI3Jan (standardized drought index over November, December, and January), competition (CI), neighbourhood mingling (M), and the vitality condition of the N. dombeyi trees as fixed effects. As above, since the BAI measurements represent repeated measures of the same individuals, tree identity was regarded as a random factor; and we included a first-order autocorrelation structure (AR1) to account for the yearly dependence on the BAI.
In addition, we quantified short-term growth responses to each selected drought and according to tree vitality. The short-term growth responses were quantified by applying a resilience index [25,46,47], considering consistent pre-drought and post-drought periods of three years. We used a period of 3 years to calculate the resilience components, as a good compromise with low bias in the calculation of resilience (Figure S3, Table S1). In addition, we set a maximum recovery period of 6 years, as a good compromise with not including subsequent droughts. However, due to the sampling date, we were limited to including short-term responses following the last drought. All the conventional indexes (resistance (Rt), recovery (Rc), resilience (Rs)) were calculated following the formulas in Lloret et al. [46], and based on the ratios of the pre-drought, drought, and post-drought BAI values. We quantified mid-term responses following the 1998–99 drought event to account for the direction of potential legacy effects as a consequence of the most severe drought in the region, by considering the ratio between the 10 years before and after the dry spell (legacy98). We applied linear mixed-effect models to compare the short-term responses (Rt, Rc, Rs) as a function of the fixed factors, i.e., vitality, magnitude of the drought event (SPEI3Jan), DBH, CI, and M, as well as the interactions between them. Again, we included tree identity as a random factor and an autocorrelation structure as explained above. All the linear mixed-effects models were built using the nlme R-package [48] in R software, and the goodness-of-fit of the models was assessed using conditional and marginal R2.

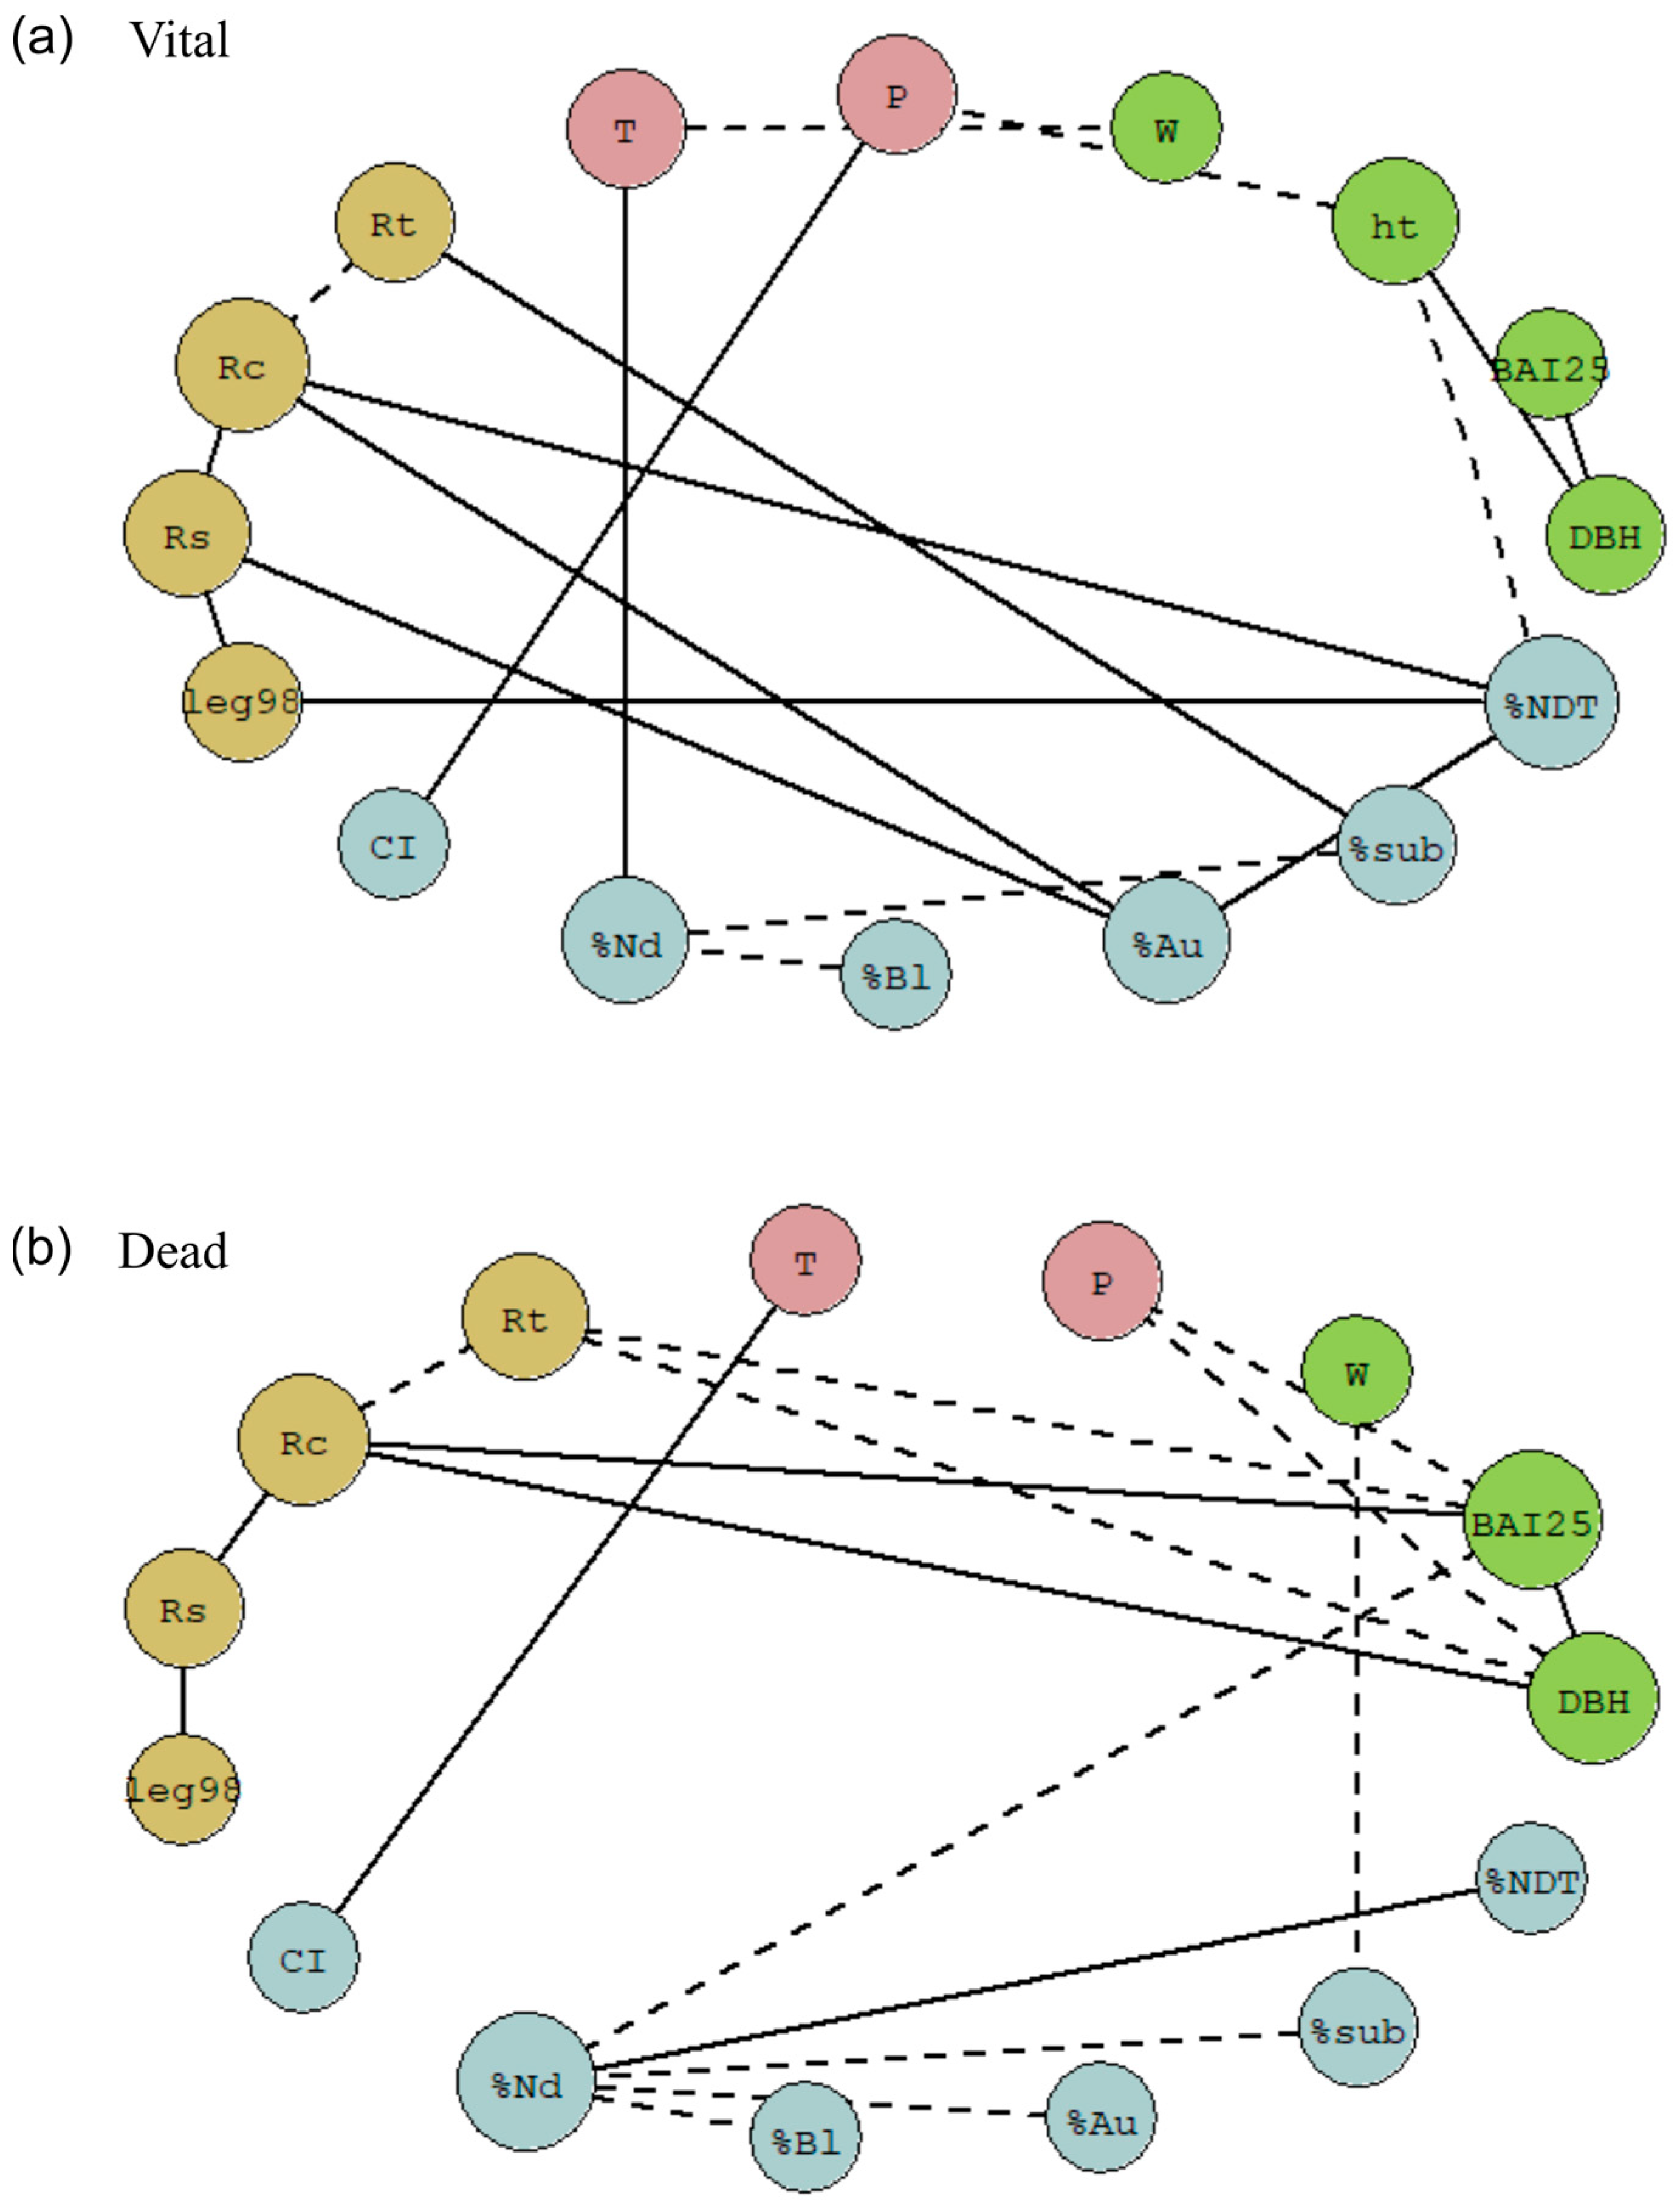
2.6. Network Analysis for Vital and Dead Trees

We evaluated the covariations between all the considered variables and their effect on the health status of each N. dombeyi tree by correlational network analysis, which is flexible, allows for the untargeted exploration of the data without prior known relationships, and accommodates many data types [49]. We linked all the tree and neighbourhood variables by tree vitality status, using a set of variables grouped in four classes: tree characteristics (BAI25, DBH, height (ht), and crown spread (W)); climate–growth relationship (with temperature (T) and precipitation (P)); drought–growth performance (Rt, Rc, Rs, and legacy98), and neighbourhood pressure (CI, % N. dombeyi (%Nd), % A. chilensis (%Au), % broadleaf codominant species (%Bl), % subdominant species (%sub), and proportion of dead N. dombeyi following 2014–15 drought (%NDT)). We decided not to include mingling (M), as we characterized mingling values with the proportion of species in the neighbourhood.
In the correlation network analysis, selected variables are represented as nodes in the network, and significant relationships between them are represented as edges. To test the significance of the correlation coefficients between the variables, we used Pearson correlations, where only significant coefficients (p < 0.05) were considered as connections between nodes (edges). We used the igraph R-package [50] in R environment [41]. The degree function, which counts the number of connections of each node (significant correlations), was used to analyse the importance of the nodes within a network (centrality). Network analysis provides valuable insights into the structure of systems with interconnected elements, and is a powerful tool to understand and optimize complex relationships.

3. Results

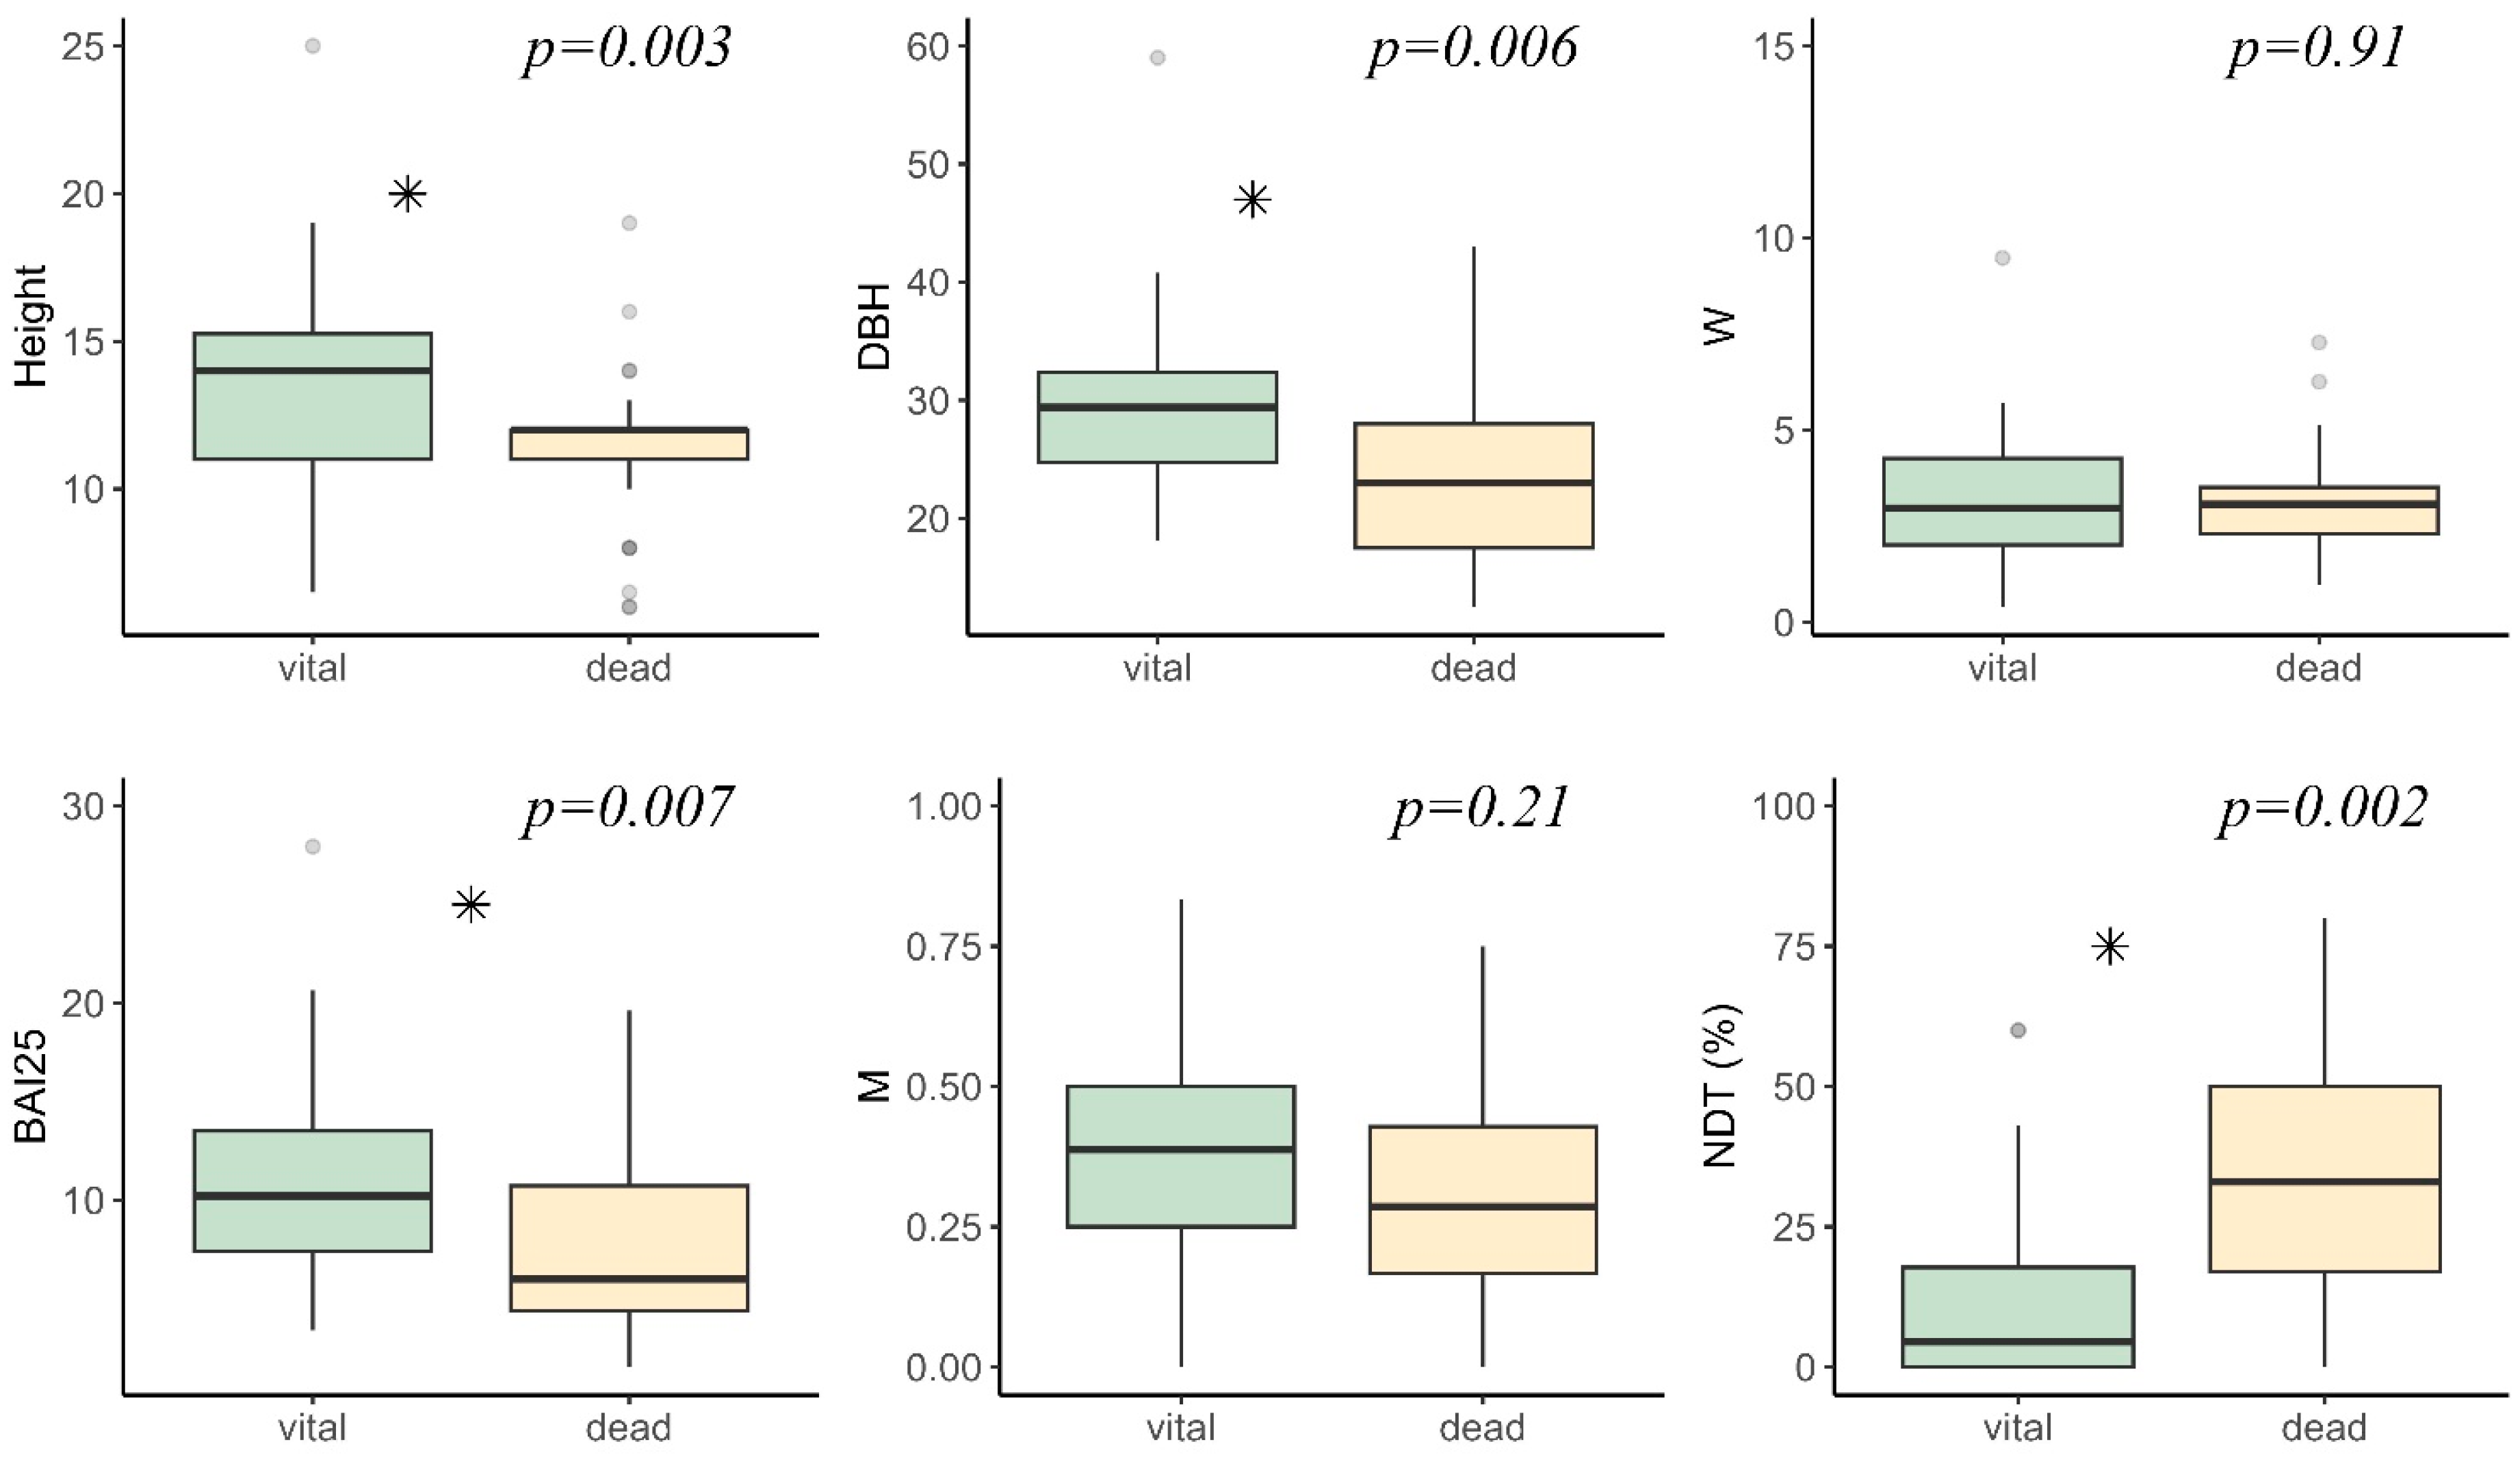
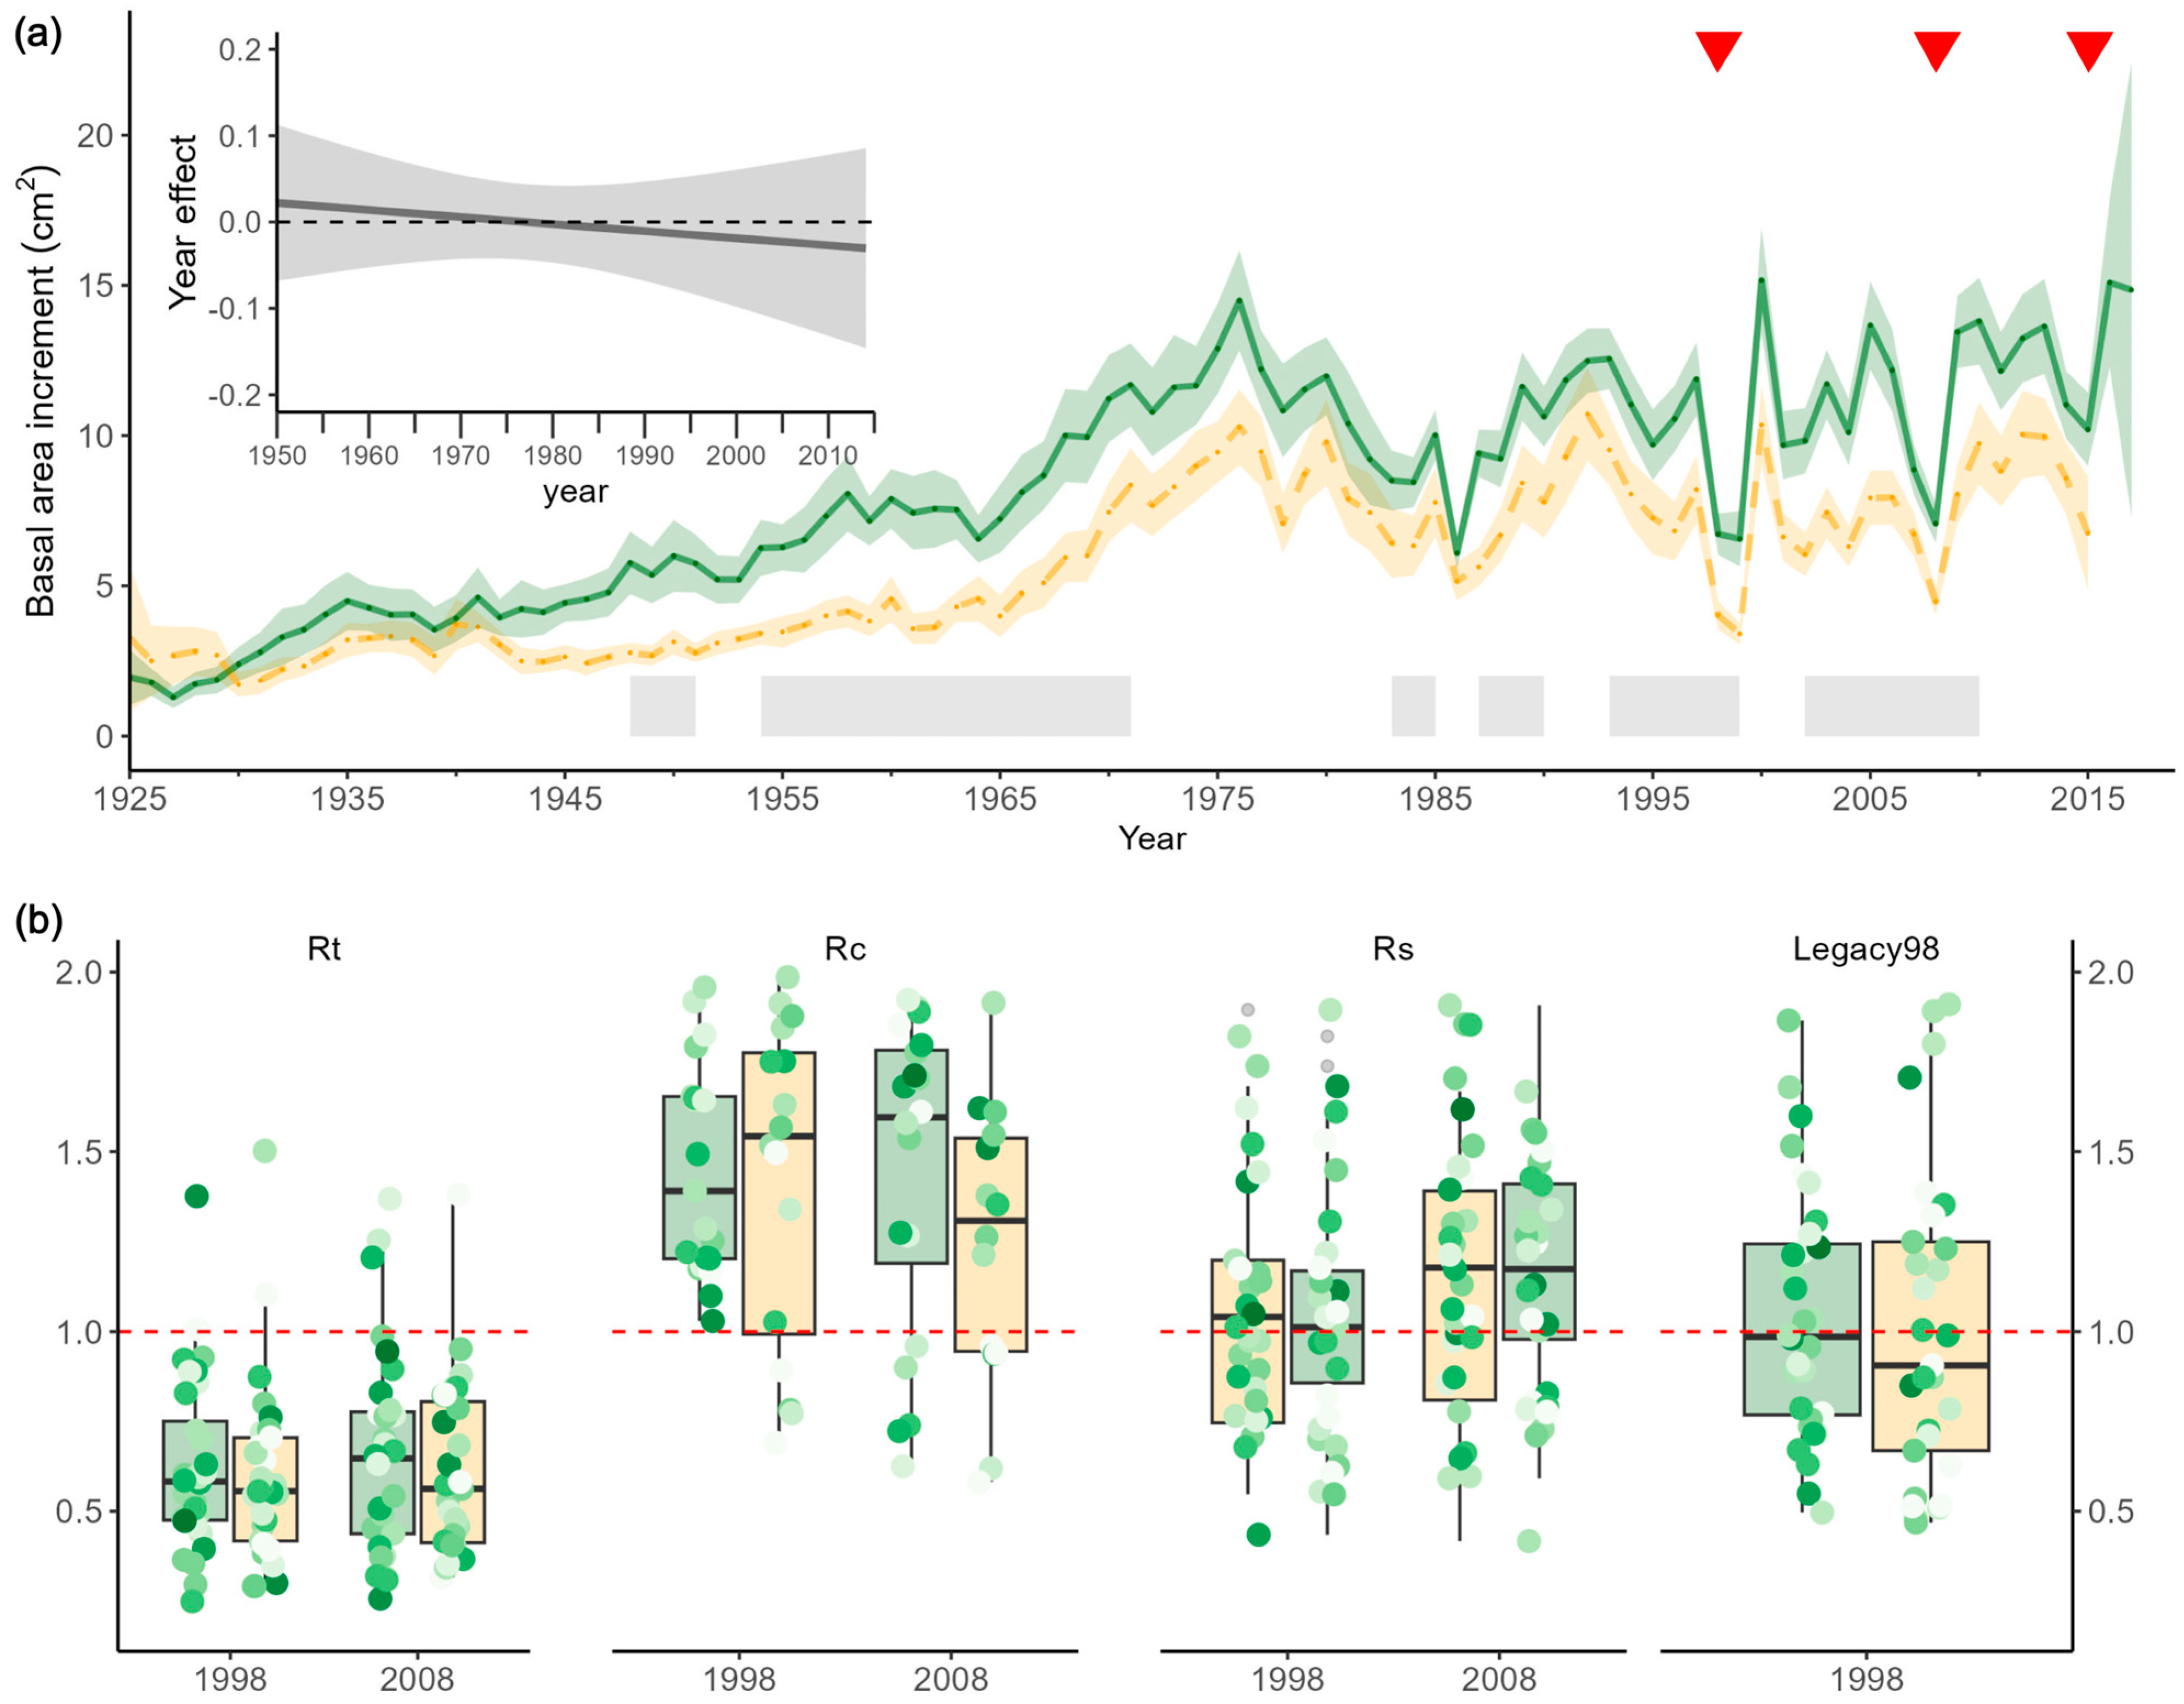
3.1. Long-Term Growth Trend Differed between Vital and Dead Trees

The inter-annual variation of the basal area increment (BAI) of the vital and 2014–15-dead N. dombeyi trees showed a similar pattern through the analysed period, and a common growth reduction in response to the main droughts happened in the last decades (Figure 2a). However, the vital trees presented higher BAI values than the trees that died during the last drought, for almost all the analysed period (Figure 2a grey rectangles). In addition, the vital trees belonged to a group of larger trees compared to the dead ones (Figure A1), although the larger structure (height, diameter) of the vital trees did not lead to a larger mean canopy spread (Figure A1).
Consistent with similar BAI variability between the vital and dead trees, we found comparable responses to climate in both vitality groups that modelled tree growth. The correlation coefficients between the vital and dead residual RWI chronologies and climate variables indicated that precipitation during December and January in the current growing season promoted growth, whereas higher temperatures during the same period inhibited tree growth. Only dead trees showed an additional dependence on temperature during the previous growing season (October and February). Although the ranges were often similar, the correlation between climate and individual detrended and prewhitened series mostly indicated stronger correlations than would be expected based on the mean group RWI chronology (Figure 3).
According to the GAMM, the effect of year did not differ between the vitality classes (Table 1; Figure 2a, inset in figure). Further, for the vital and dead trees, the spline described a positive effect of year starting from the mid-1970s, pointing to a growth enhancement in both vitality classes since the late 20th–early 21st centuries (Figure A2). Changes in the climate variables relevant to growth, with the integer as the 3-month January SPEI (SPEI3Jan; including November, December, and January) significantly influenced the BAI (Table 1) as the resultant growth was lowest under dry conditions and significantly increased during moister conditions. However, the vital trees did not show a higher growth performance during moister conditions, and neither did the dead trees show their lowest growth rates during drier ones (Table 1, Figure A3).

3.2. Role Played by Neighbourhood in Growth and Resilience

For the period 1990–2015, the linear mixed-effect model detected no significant differential effect of competition on the BAI between the vital and dead trees (Table 2). Thus, the dead and vital trees showed similar estimated BAI values regardless of the competition level exerted by the immediate neighbourhood. In contrast, species mingling in the neighbourhood (M) had a significant effect on the 1990–2015 BAI in the dead trees (Table 2), as the greater the species mingling in the neighbourhood, higher the estimated BAI values of the trees.
In agreement with similar climate–growth sensitivity and BAI patterns, no significant differences were observed in the post-drought responses (1998 and 2008) between the vitality classes of the trees. Likewise, there were no differences in the magnitude of the legacy effect following the 1998 drought (Figure 2b, Table 3). During the adverse climatic conditions prevailing in the summer of the 1998 and 2008 droughts, both vitality classes showed resistance values of around 0.5, although recovered their previous growth in the following 3 years (Figure 2b). Moreover, we obtained unexpected findings regarding the impact of the competition index and mingling values on growth response during droughts. The linear mixed-effect models did not reveal any significant influence of competition or mingling on driving resistance or recovery, nor did they indicate a potential buffering effect of neighbourhood on post-drought responses (Table 3). We found only an effect of DBH on the resilience indices for the dead trees, where bigger dead trees showed a more significant drop (lower resistance) during the previous drought, but also showed better recovery following the dry spells (Table 3). Finally, SPEIJan during the analysed droughts did not affect the resilience indices, neither as simple predictors nor as an interactions with the vitality class.

3.3. Integrating Predictors of Tree Mortality

The visual representation of the covariation among the predictors highlighted variables with greater centrality (i.e., number of significant correlations with other predictors) for the dead trees (Table 4). However, the expected covariation between the drought performance and neighbourhood characteristics was only evidenced for the vital trees (Figure 4a).
Despite the predictable significant correlations of variables within the groups (particularly within drought response and tree characteristic group), network analysis showed that the neighbour pressure predictors were related to drought response in the vital trees. The percentage of subcanopy species (%sub), A. chilensis (%Au), or dead N. dombeyi (%NDT) in the neighbourhood showed a positive relationship with N. dombeyi drought performance (Figure 4a). Furthermore, the vital trees experienced greater sensitivity to precipitation under increased competitive pressure, while if the neighbourhood was dominated by N. dombeyi, temperature sensitivity become more relevant (more negative). Thus, drought performance following droughts (Rc and Rs) covaried positively with a neighbourhood dominated by species taxonomically and functionally different from the focal species (i.e., %Au; Figure 4a).
For dead trees, network analysis showed that BAI25 and the percentage of N. dombeyi in the neighbourhood (%Nd) were the variables with the highest centrality (Table 4). As expected, BAI25 was positively related to DBH; and the drought performance predictors covaried with each other (Figure 4b). The variables with higher centrality were negatively related, indicating that the dead trees that had grown less (lower BAI25) were surrounded by a higher proportion of N. dombeyi and the neighbourhood experienced higher levels of 2014–15 tree mortality. Also, smaller trees (low DBH and low BAI25) experienced lower Rt values (values far from 1) during the 1998 and 2008 droughts, and had higher dependence on growing season precipitation (Figure 4b). In contrast, bigger dead trees had endured previous droughts and demonstrated higher recoveries, and, indirectly, higher resilience values. Finally, the dead trees that experienced higher competition pressure were related to more negative temperature sensitivity. However, these predictors did not depict covariation with any other variable in the network.

4. Discussion

In this study, we have observed how long-term growth trends, climate sensitivity, response to previous droughts, and neighbourhood structure constitute a complex network of predictors of N. dombeyi growth when the species develops in highly diverse and wet environments. N. dombeyi is a species with high safety margins, and, like other Nothofagus species, its leaves are more vulnerable to embolism than its stems [52]. Thus, death appears to be a consequence of the total loss of leaf hydraulic conductance, which leads to sudden leaf dehydration and leaf drop under stress conditions [53]. This mechanism seems a plausible explanation for what happened during the 2014–15 drought, as dead trees were characterized by entirely desiccated crowns (brownish leaves) in the late summer of 2015. However, rather than elucidate which potential predictors could help us to estimate death following 2014–15 drought, the vital and dead co-occurring tree differences were mainly associated with the size-related variables (BAI, DBH, height). Contrary to our expectations, we did not find divergent growth trajectories in the co-occurring vital and dead trees. Thus, the trees impacted by the 2014–15 drought had not experienced previous growth decline or crown dieback, highlighting the sudden nature of the mortality event and its relationship with other driving factors rather than previous vigour loss. In addition, the drought response, in terms of the resilience components during the previous droughts, was also not related to tree death during 2014–15 drought. Finally, the dead trees grew in neighbourhoods that were neither denser nor less diverse than those of the vital trees, factors which could have been expected to contribute to the probability of the trees dying.

4.1. Tree Size and Long-Term Growth in Relation to Drought Response

Several studies have predicted that taller and dominant trees will be at greater risk of dying following droughts due to their inherent vulnerability to hydraulic stress, higher radiation, and evaporative demand experienced by their exposed crowns [54,55,56]. This idea, coupled with greater leaf size and stomata amount in N. dombeyi genotypes from humid environments [57], led us to predict a greater risk for bigger N. dombeyi individuals in the Puerto Blest mortality event. However, our results were in agreement with others [58,59] who found a greater survivorship of bigger trees. Despite a low number of studies recreating in detail the leaf–soil moisture dynamics during droughts [60], we may speculate that lower growth (and lower size) in dead trees could probably be a consequence of less favourable microsite conditions that were acting to limit growth [28]. This coincides with the fact that, although the vital and dead trees showed comparable responses to precipitation and temperature, the trees that died during the 2014–15 drought had experienced more dependence on the previous year’s climatic conditions. Mortality tended to be higher in small-sized N. dombeyi individuals [61] with smaller basal area increments and more dependence on the previous year’s carbon reserves, probably due to smaller rooting systems related to shallow soils or a higher degree of rockiness at the microsite level [59]. The potentially less favourable microsite conditions prevailing since the tree establishment may have led the now-dead N. dombeyi trees to exhibit lower growth performance during their lifetime, although the extremely wet climate did not exacerbate the growth-limiting factors enough to drive differences in noticeable climatic sensitivity between the vital and dead trees. Moreover, less favourable microsite conditions, serving as an underlying inciting factor at the tree level, are consistent with the observation that the dead N. dombeyi trees had a larger number of 2014–15 dead trees in their vicinity.
Even though the dead trees were smaller compared to the vital trees, our results strongly highlight the similar long-term growth trend and variability between the co-occurring vital and dead trees. A long-term reduction in radial growth (vigour loss) is a common growth pattern of trees that died following severe droughts [4,62,63], pointing to the so-called ‘legacy effect as a framework for explaining tree death [64,65,66]. Physiological changes can lead to higher drought impact and reduce growth recovery (loss of resilience capacity) in subsequent droughts, ultimately resulting in tree death [11]. This legacy effect has been identified in N. dombeyi trees that died following severe droughts in northern Patagonia [28]. Moreover, a study considering highly to fully defoliated N. dombeyi trees following the 1998–99 drought affecting the easternmost populations exhibited a significant growth decline that was related to reduced growth and a negative post-drought response during previous droughts (Suarez ML submitted manuscript). This increasing loss in resilience points to an irreversible increase in drought vulnerability in the more recent droughts, indicating a state of change that denotes a negative legacy effect, although the dead N. dombeyi trees growing in the relict Valdivian rainforest near Puerto Blest neither showed previous growth decline nor a long-term loss of growth resilience. Furthermore, the vital and 2014–15 dead trees showed similar resistance to drought, and rapid growth recovery upon rewatering when previous droughts ended. This represented an unexpected result considering the behaviour of the species in the eastern populations. Nevertheless, it would be simplistic to assume that the loss of resilience alone can explain tree death probability.

4.2. Neighbour Effect on Tree Growth and Drought Performance

Bigger and taller surviving N. dombeyi trees appear to be surrounded by a more species-mixed environment (Figure 2). Besides other factors, species mingling in the tree vicinity exhibiting different functional traits is assumable to imply different resource utilization during drought, attenuating negative growth reactions [9,27,67,68,69]. Inter-specific differences in physiology (e.g., isohydric vs. anisohydric) and morphology, as well as intra-specific differences resulting from intra- and inter-specific interactions (e.g., vertical positioning within the canopy or phenotypes), contribute to a positive effect on radial growth and performance in the face of drought [17,27,67], while the opposite could be attributed to a less complementary neighbourhood. In the studied stand, better drought performance during the previous dry spells was shaped by a neighbourhood dominated by a shade-tolerant conifer species with different physiological and morphological traits compared to N. dombeyi [70], and/or species with different maximum heights as a species trait, leading to differences in resource consumption strategies.
However, the relationship between neighbourhood pressure (competition and mingling) and the previous drought performance of the now-dead N. dombeyi trees was less straightforward. Furthermore, competition levels neither explained part of the recent growth trends at local scales, nor implied negative growth trends in the dead trees. This result was in agreement with studies suggesting that the current competition levels (last decades) have a low effect on growth, potentially due to underestimated past competition [62,71] or due to pressure from neighbours, not considering the critical role played by neighbours’ identity in plant performance [72]. The beneficial effects of mingling have been shown to strongly influence tree growth [25], though its role in lessening the severity of drought impacts and survival is still controversial [24,27]. Here, we use the basal area increment as an indicator of the tree’s stress during its lifetime. Thereby, we can assume that the current species mingling arrangement in the neighbourhood of the now-dead trees had enhanced the tree growth, as the trees with greater species mingling in their neighbourhood showed higher estimated BAI values during the last 25 years. However, bigger trees, which are assumed to be benefited by the species mixture in their surroundings, displayed lower resistance (closer to 0.5) and even higher recovery following past droughts, highlighting that the net effects of neighbourhood pressure can vary, resulting in a different outcome in drought performance. It is noteworthy that the strength of the correlation between the factors could be constrained by the number of analysed individuals.
Finally, it is of particular interest that higher competitive pressure (measured as size–distance competition index) or fewer species mingling in the environment (measured as a neighbourhood dominated by N. dombeyi) covaried with the climatic sensitivity of the vital and dead trees. By considering the intra-population variability in the growth responses to the climate, we can capture the range of responses to drought, recognizing which local neighbours could be more resilient or vulnerable than others, responses that are often averaged or masked when we focus on competition or mixing influences at plot or stand level [73,74]. At first glance, the climate–growth responses varied among the trees, with more climate sensitivity as the neighbourhood pressure increased in both vitality classes (neighbourhoods dominated by N. dombeyi or greater size–distance competition levels). The intra-population variability in the N. dombeyi climate–growth relationship could be attributed to xylem anatomy variability or root development, modulated by the balance between the intra- and inter-specific relationships in the neighbourhood, soil conditions, and genetic uniqueness. Therefore, our findings agree with studies pointing out that trees with high competition in the close vicinity show greater climate sensitivity and could potentially be more prone to drought-induced mortality [18,71,75]. This suggests that the local context, in terms of the micro-environmental factors and species arrangement in the vicinity, interact in a complex way, impacting the resilience and adaptability of tree populations. Understanding the dynamics of this network can be crucial for effective forest management and conservation efforts.

5. Conclusions

Our findings shed light on the possible drivers acting at the tree-to-tree level in driving growth, resilience, and death following the 2014–15 drought in the northern Patagonian rainforest. Despite differences in factor covariation between the two vitality classes, here we have demonstrated that smaller trees were more susceptible to drought-induced mortality, which is likely to be due to the worse microsite conditions they experienced during their lifetime. However, contrary to our expectations, based on the potential vigour loss in the dead trees, both vitality classes showed similar long-term growth trends, with no significant prior growth declines characterizing the dead trees. This highlights the sudden nature of mortality events, rather than a gradual loss of vigour, and the role played by other driving factors. Furthermore, our hypothesis posited increased neighbourhood diversity or a less dense vicinity as driving factors influencing both individual growth patterns and a tree’s response to drought, enhancing tree resilience. However, partially agreeing with our initial predictions, the results showed that neighbour pressure was related to drought response in the vital trees. It is worth mentioning that the ecological relationships between individual trees and their neighbours are more complex than those we evidenced, and the positive effect of a less uniform neighbourhood on the drought performance of the vital trees helps us to forecast N. dombeyi drought responses under the prevailing climate in humid diverse stands. These results constitute a useful tool in planning effective forest management and conservation efforts, considering the complex interplay of tree size, growth history, neighbourhood composition, and micro-environmental factors to enhance the resilience and adaptability of tree populations in future dry spells.

Supplementary Materials

The following supporting information can be downloaded at: https://www.mdpi.com/article/10.3390/f15081355/s1, Figure S1: Puerto Blest Climograph; Figure S2: Bootstrapped climate–growth correlation coefficients; Figure S3: Integration period of resilience values; Table S1: ANOVA table of integration period model.

Author Contributions

Conceptualization and methodology, M.L.S. and Y.S.; tree ring measurements and dendroecological and network analysis, M.L.S.; data analysis, M.L.S. and Y.S.; writing—original draft preparation, M.L.S.; review and editing, M.L.S., Y.S., and L.F.; funding acquisition, M.L.S. and Y.S. All authors have read and agreed to the published version of the manuscript.

Funding

The study has been funded by Fondo para la Investigación Científica y Tecnológica (AGENCIA I+D+i) projects PICT 2017-3843 and PICT 2021-0187; and by CONICET project PIP 2017-0484. M.L.S. is grateful to Idea Wild (Fort Collins, CO) for providing essential equipment.

Data Availability Statement

The data in this study are available from the authors upon reasonable request.

Acknowledgments

We acknowledge logistical support from the personnel of the Nahuel Huapi National Park. The authors are also grateful to the technical staff of INIBIOMA for their commitment and dedication to the fieldwork.

Conflicts of Interest

The authors declare no conflicts of interest.

Appendix A. Vital and Dead Tree Characteristics

Figure A1. Differences in tree characteristics between vital (light green) and dead (light orange) N. dombeyi trees. W depicts average crown spread, M is the mingling index, and NDT is the proportion of dead trees in the focal neighbourhood. Asterisks and p-values depict differences according to Wilcoxon rank sum test.
Forests 15 01355 g0a1

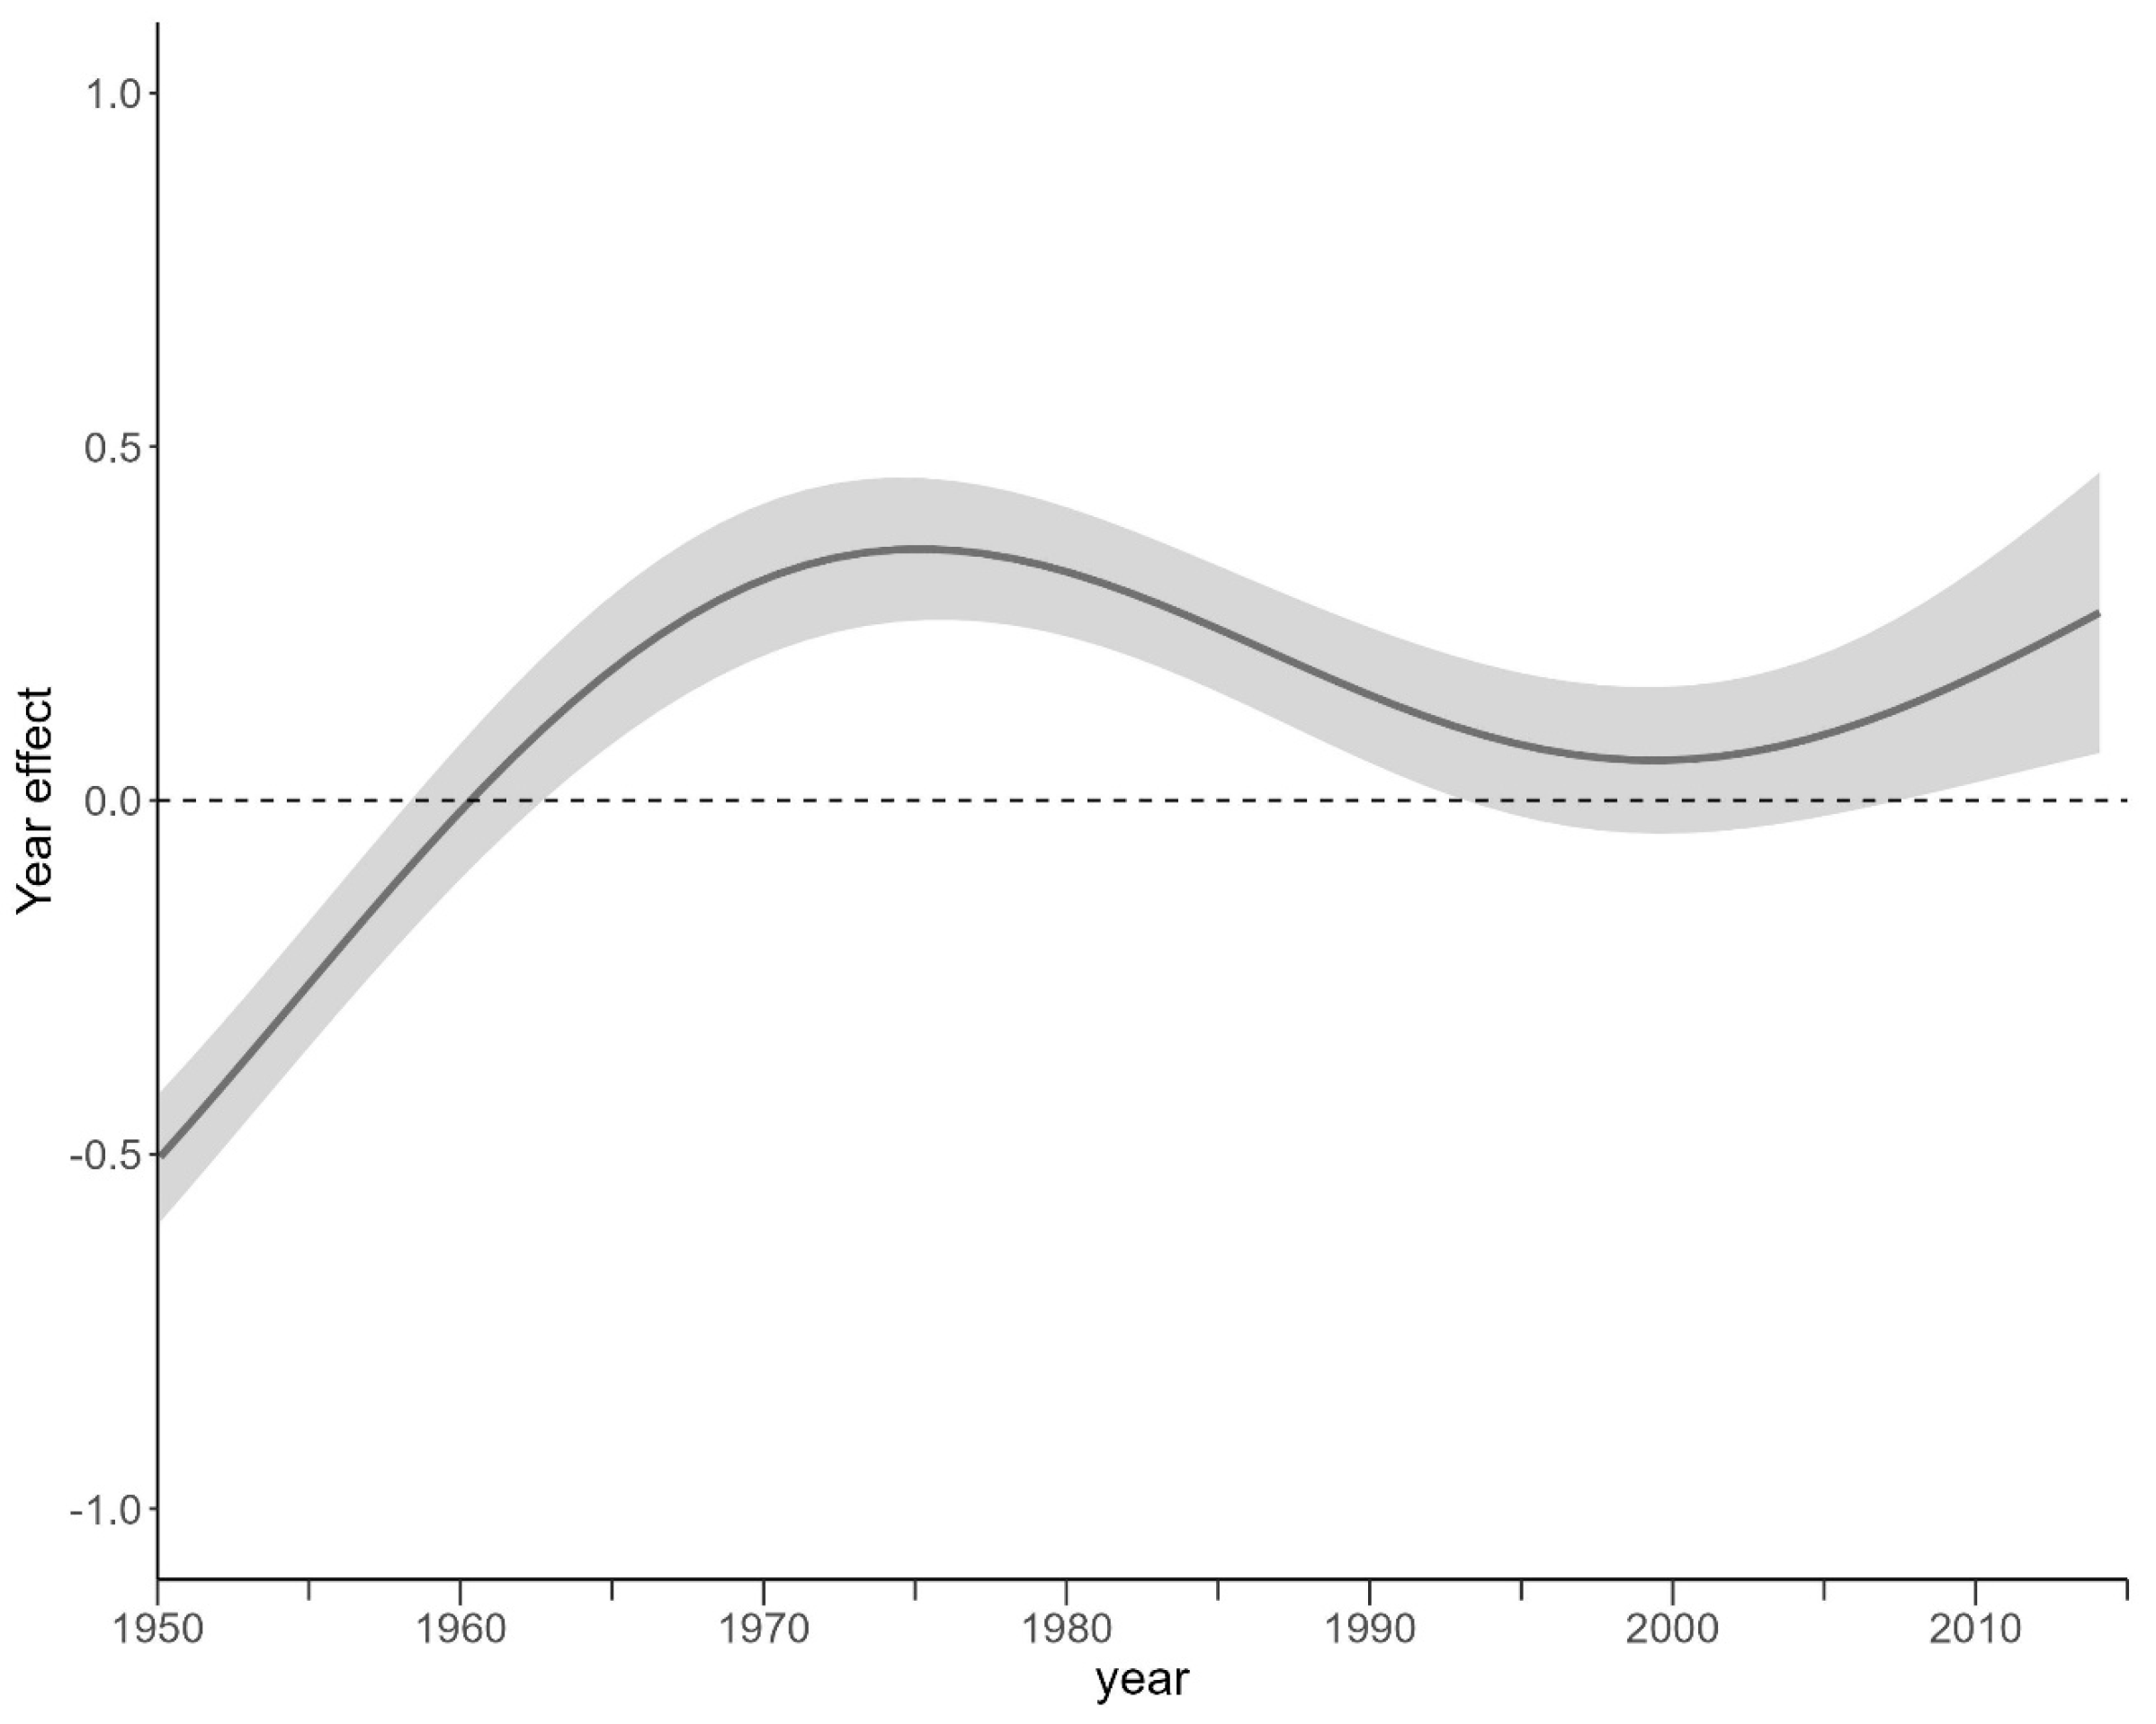
Appendix B. Partial Effect of the General Additive Linear Model

Figure A2. Effect of calendar year on growth trends (BAI) of N. dombeyi regardless of vital conditions.
Forests 15 01355 g0a2
Figure A3. Predicted log (BAI + 1) for vital (solid green lines) and dead (dashed orange lines) N. dombeyi trees in function of changes in SPEI3Jan according to GAMM model. The shaded areas depict the 95% confidence intervals.
Forests 15 01355 g0a3

References

  1. Lee, H.; Calvin, K.; Dasgupta, D.; Krinner, G.; Mukherji, A.; Thorne, P.; Trisos, C.; Romero, J.; Aldunce, P.; Barret, K. IPCC, 2023: Climate Change 2023: Synthesis Report, Summary for Policymakers. Contribution of Working Groups I, II and III to the Sixth Assessment Report of the Intergovernmental Panel on Climate Change; Core Writing Team, Lee, H., Romero, J., Eds.; IPCC: Geneva, Switzerland, 2023. [Google Scholar]
  2. Aguayo, R.; León-Muñoz, J.; Garreaud, R.; Montecinos, A. Hydrological Droughts in the Southern Andes (40–45 S) from an Ensemble Experiment Using CMIP5 and CMIP6 Models. Sci. Rep. 2021, 11, 5530. [Google Scholar] [CrossRef] [PubMed]
  3. Urrutia-Jalabert, R.; Barichivich, J.; Rozas, V.; Lara, A.; Rojas, Y.; Bahamondez, C.; Rojas-Badilla, M.; Gipoulou-Zuñiga, T.; Cuq, E. Climate Response and Drought Resilience of Nothofagus Obliqua Secondary Forests across a Latitudinal Gradient in South-Central Chile. For. Ecol. Manag. 2021, 485, 118962. [Google Scholar] [CrossRef]
  4. Rodríguez-Catón, M.; Villalba, R.; Srur, A.; Williams, A.P. Radial Growth Patterns Associated with Tree Mortality in Nothofagus Pumilio Forest. Forests 2019, 10, 489. [Google Scholar] [CrossRef]
  5. Fasanella, M.; Suarez, M.L.; Hasbun, R.; Premoli, A.C. Individual-Based Dendrogenomic Analysis of Forest Dieback Driven by Extreme Droughts. Can. J. For. Res. 2021, 51, 420–432. [Google Scholar] [CrossRef]
  6. Trugman, A.T.; Anderegg, L.D.L.; Anderegg, W.R.L.; Das, A.J.; Stephenson, N.L. Why Is Tree Drought Mortality so Hard to Predict? Trends Ecol. Evol. 2021, 36, 520–532. [Google Scholar] [CrossRef] [PubMed]
  7. González de Andrés, E.; Suárez, M.L.; Querejeta, J.I.; Camarero, J.J. Chronically Low Nutrient Concentrations in Tree Rings Are Linked to Greater Tree Vulnerability to Drought in Nothofagus Dombeyi. Forests 2021, 12, 1180. [Google Scholar] [CrossRef]
  8. Mathias, J.M.; Thomas, R.B. Global Tree Intrinsic Water Use Efficiency Is Enhanced by Increased Atmospheric CO2 and Modulated by Climate and Plant Functional Types. Proc. Natl. Acad. Sci. USA 2021, 118, e2014286118. [Google Scholar] [CrossRef] [PubMed]
  9. Castagneri, D.; Vacchiano, G.; Hacket-Pain, A.; DeRose, R.J.; Klein, T.; Bottero, A. Meta-Analysis Reveals Different Competition Effects on Tree Growth Resistance and Resilience to Drought. Ecosystems 2022, 25, 30–43. [Google Scholar] [CrossRef]
  10. Cailleret, M.; Dakos, V.; Jansen, S.; Robert, E.M.; Aakala, T.; Amoroso, M.M.; Antos, J.A.; Bigler, C.; Bugmann, H.; Caccianiga, M. Early-Warning Signals of Individual Tree Mortality Based on Annual Radial Growth. Front. Plant Sci. 2019, 9, 1964. [Google Scholar] [CrossRef]
  11. Peltier, D.M.P.; Ogle, K. Legacies of More Frequent Drought in Ponderosa Pine across the Western United States. Glob. Change Biol. 2019, 25, 3803–3816. [Google Scholar] [CrossRef]
  12. Serra-Maluquer, X.; Granda, E.; Camarero, J.J.; Vilà-Cabrera, A.; Jump, A.S.; Sánchez-Salguero, R.; Sangüesa-Barreda, G.; Imbert, J.B.; Gazol, A. Impacts of Recurrent Dry and Wet Years Alter Long-term Tree Growth Trajectories. J. Ecol. 2021, 109, 1561–1574. [Google Scholar] [CrossRef]
  13. Cabon, A.; DeRose, R.J.; Shaw, J.D.; Anderegg, W.R.L. Declining Tree Growth Resilience Mediates Subsequent Forest Mortality in the US Mountain West. Glob. Change Biol. 2023, 29, 4826–4841. [Google Scholar] [CrossRef] [PubMed]
  14. Serra-Maluquer, X.; Gazol, A.; Anderegg, W.R.L.; Martínez-Vilalta, J.; Mencuccini, M.; Camarero, J.J. Wood Density and Hydraulic Traits Influence Species’ Growth Response to Drought across Biomes. Glob. Change Biol. 2022, 28, 3871–3882. [Google Scholar] [CrossRef] [PubMed]
  15. Pretzsch, H.; Dieler, J. The Dependency of the Size-Growth Relationship of Norway Spruce (Picea abies [L.] Karst.) and European Beech (Fagus sylvatica [L.]) in Forest Stands on Long-Term Site Conditions, Drought Events, and Ozone Stress. Trees 2011, 25, 355–369. [Google Scholar] [CrossRef]
  16. Schmitt, A.; Trouvé, R.; Seynave, I.; Lebourgeois, F. Decreasing Stand Density Favors Resistance, Resilience, and Recovery of Quercus petraea Trees to a Severe Drought, Particularly on Dry Sites. Ann. For. Sci. 2020, 77, 52. [Google Scholar] [CrossRef]
  17. Bello, J.; Vallet, P.; Perot, T.; Balandier, P.; Seigner, V.; Perret, S.; Couteau, C.; Korboulewsky, N. How Do Mixing Tree Species and Stand Density Affect Seasonal Radial Growth during Drought Events? For. Ecol. Manag. 2019, 432, 436–445. [Google Scholar] [CrossRef]
  18. Serra-Maluquer, X.; Gazol, A.; Igual, J.M.; Camarero, J.J. Silver Fir Growth Responses to Drought Depend on Interactions between Tree Characteristics, Soil and Neighbourhood Features. For. Ecol. Manag. 2021, 480, 118625. [Google Scholar] [CrossRef]
  19. Anderegg, L.D.L.; HilleRisLambers, J. Drought Stress Limits the Geographic Ranges of Two Tree Species via Different Physiological Mechanisms. Glob. Change Biol. 2016, 22, 1029–1045. [Google Scholar] [CrossRef] [PubMed]
  20. Zapater, M.; Hossann, C.; Bréda, N.; Bréchet, C.; Bonal, D.; Granier, A. Evidence of Hydraulic Lift in a Young Beech and Oak Mixed Forest Using 18O Soil Water Labelling. Trees 2011, 25, 885–894. [Google Scholar] [CrossRef]
  21. Forrester, D.I. Linking Forest Growth with Stand Structure: Tree Size Inequality, Tree Growth or Resource Partitioning and the Asymmetry of Competition. For. Ecol. Manag. 2019, 447, 139–157. [Google Scholar] [CrossRef]
  22. González De Andrés, E.; Seely, B.; Blanco, J.A.; Imbert, J.B.; Lo, Y.; Castillo, F.J. Increased Complementarity in Water-limited Environments in Scots Pine and European Beech Mixtures under Climate Change. Ecohydrol. Hydrobiol. 2017, 10, e1810. [Google Scholar] [CrossRef]
  23. Liu, C.L.C.; Kuchma, O.; Krutovsky, K.V. Mixed-Species versus Monocultures in Plantation Forestry: Development, Benefits, Ecosystem Services and Perspectives for the Future. Glob. Ecol. Conserv. 2018, 15, e00419. [Google Scholar] [CrossRef]
  24. Gillerot, L.; Forrester, D.I.; Bottero, A.; Rigling, A.; Lévesque, M. Tree Neighbourhood Diversity Has Negligible Effects on Drought Resilience of European Beech, Silver Fir and Norway Spruce. Ecosystems 2021, 24, 20–36. [Google Scholar] [CrossRef]
  25. Schwarz, J.A.; Bauhus, J. Benefits of Mixtures on Growth Performance of Silver Fir (Abies alba) and European Beech (Fagus sylvatica) Increase with Tree Size without Reducing Drought Tolerance. Front. For. Glob. Change 2019, 2, 79. [Google Scholar] [CrossRef]
  26. Sánchez-Salguero, R.; Camarero, J.J.; Rozas, V.; Génova, M.; Olano, J.M.; Arzac, A.; Gazol, A.; Caminero, L.; Tejedor, E.; De Luis, M.; et al. Resist, Recover or Both? Growth Plasticity in Response to Drought Is Geographically Structured and Linked to Intraspecific Variability in Pinus pinaster. J. Biogeogr. 2018, 45, 1126–1139. [Google Scholar] [CrossRef]
  27. Vitali, V.; Forrester, D.I.; Bauhus, J. Know Your Neighbours: Drought Response of Norway Spruce, Silver Fir and Douglas Fir in Mixed Forests Depends on Species Identity and Diversity of Tree Neighbourhoods. Ecosystems 2018, 21, 1215–1229. [Google Scholar] [CrossRef]
  28. Suarez, M.L.; Ghermandi, L.; Kitzberger, T. Factors Predisposing Episodic Drought-Induced Tree Mortality in Nothofagus– Site, Climatic Sensitivity and Growth Trends. J. Ecol. 2004, 92, 954–966. [Google Scholar] [CrossRef]
  29. Suarez, M.L.; Kitzberger, T. Differential Effects of Climate Variability on Forest Dynamics along a Precipitation Gradient in Northern Patagonia. J. Ecol. 2010, 98, 1023–1034. [Google Scholar] [CrossRef]
  30. Suarez, M.L.; Villalba, R.; Mundo, I.A.; Schroeder, N. Sensitivity of Nothofagus Dombeyi Tree Growth to Climate Changes along a Precipitation Gradient in Northern Patagonia, Argentina. Trees 2015, 29, 1053–1067. [Google Scholar] [CrossRef]
  31. Perotti, M.G.; Diéguez, M.C.; Jara, F.G. State of the Knowledge of Moist Soils of the Patagónico North (Argentina): Excellent Aspects and Importance for the Conservation of the Regional Biodiversity. Rev. Chil. Hist. Nat. 2005, 78, 723–737. [Google Scholar]
  32. Kitzberger, T. Fire Regime Variation along a Northern Patagonian Forest-Steppe Gradient: Stand and Landscape Response; University of Colorado, Department of Geography: Boulder, CO, USA, 1994. [Google Scholar]
  33. Ezcurra, C.; Brion, C. Plantas Del Nahuel Huapi Catálogo de La Flora Vascular Del Parque Nacional Nahuel Huapi, Argentina; Universidad Nacional del Comahue, Red Latinoamericana de Botánica: Bariloche, Argentina, 2005. [Google Scholar]
  34. Harris, I.; Osborn, T.J.; Jones, P.; Lister, D. Version 4 of the CRU TS Monthly High-Resolution Gridded Multivariate Climate Dataset. Sci. Data 2020, 7, 109. [Google Scholar] [CrossRef]
  35. Beguería, S.; Vicente-Serrano, S.M. SPEI: Calculation of the Standardised Precipitation-Evapotranspiration Index. R Package Version 1.7. 2017. Available online: https://CRAN.R-project.org/package=SPEI (accessed on 12 October 2022).
  36. Vicente-Serrano, S.M.; Beguería, S.; López-Moreno, J.I. A Multiscalar Drought Index Sensitive to Global Warming: The Standardized Precipitation Evapotranspiration Index. J. Clim. 2010, 23, 1696–1718. [Google Scholar] [CrossRef]
  37. Zang, C.; Biondi, F. Treeclim: An R Package for the Numerical Calibration of Proxy-Climate Relationships. Ecography 2015, 38, 431–436. [Google Scholar] [CrossRef]
  38. Holmes, R.L. Computer-Assisted Quality Control in Tree-Ring Dating and Measurement. Tree-Ring Bull. 1983, 43, 69–75. [Google Scholar]
  39. Biondi, F.; Qeadan, F. A Theory-Driven Approach to Tree-Ring Standardization: Defining the Biological Trend from Expected Basal Area Increment. Tree 2008, 64, 81–96. [Google Scholar] [CrossRef]
  40. Bunn, A.; Korpela, M.; Biondi, F.; Campelo, F.; Mérian, P.; Qeadan, F.; Zang, C. dplR: Dendrochronology Program Library in R. R Package Version 1.7.6. 2020. Available online: https://CRAN.R-project.org/package=dplR (accessed on 23 June 2022).
  41. R Core Team. R: A Language and Environment for Statistical Computing; R Core Team: Vienna, Austria, 2021. [Google Scholar]
  42. Wood, S.N. Generalized Additive Models: An Introduction with R; CRC Press: Boca Raton, FL, USA, 2017. [Google Scholar]
  43. Wood, S.; Wood, M.S. Package ‘Mgcv’. R Package Version 2015, 1, 29. [Google Scholar]
  44. Hui, G.; Wang, Y.; Zhang, G.; Zhao, Z.; Bai, C.; Liu, W. A Novel Approach for Assessing the Neighborhood Competition in Two Different Aged Forests. For. Ecol. Manag. 2018, 422, 49–58. [Google Scholar] [CrossRef]
  45. Von Gadow, K.; Hui, G.Y. Characterizing Forest Spatial Structure and Diversity. In Sustainable Forestry in Temperate Regions; Björk, L., Ed.; SUFOR, University of Lund: Lund, Sweden, 2002; pp. 20–30. [Google Scholar]
  46. Lloret, F.; Keeling, E.G.; Sala, A. Components of Tree Resilience: Effects of Successive Low-Growth Episodes in Old Ponderosa Pine Forests. Oikos 2011, 120, 1909–1920. [Google Scholar] [CrossRef]
  47. Thurm, E.A.; Uhl, E.; Pretzsch, H. Mixture Reduces Climate Sensitivity of Douglas-Fir Stem Growth. For. Ecol. Manag. 2016, 376, 205–220. [Google Scholar] [CrossRef]
  48. Pinheiro, J.; Bates, D.; DebRoy, S.; Sarkar, D.; Team, R.C. Nlme: Linear and Nonlinear Mixed Effects Models. R Package Version 2013, 3, 111. [Google Scholar]
  49. Ramirez, K.S.; Geisen, S.; Morriën, E.; Snoek, B.L.; van der Putten, W.H. Network Analyses Can Advance Above-Belowground Ecology. Trends Plant Sci. 2018, 23, 759–768. [Google Scholar] [CrossRef]
  50. Csardi, G.; Nepusz, T. The Igraph Software Package for Complex Network Research. Int. J. Complex Syst. 2006, 1695, 1–9. [Google Scholar]
  51. Nakagawa, S.; Johnson, P.C.; Schielzeth, H. The Coefficient of Determination R 2 and Intra-Class Correlation Coefficient from Generalized Linear Mixed-Effects Models Revisited and Expanded. J. R. Soc. Interface 2017, 14, 20170213. [Google Scholar] [CrossRef] [PubMed]
  52. Bucci, S.J.; Scholz, F.G.; Campanello, P.I.; Montti, L.; Jimenez-Castillo, M.; Rockwell, F.A.; Manna, L.L.; Guerra, P.; Bernal, P.L.; Troncoso, O. Hydraulic Differences along the Water Transport System of South American Nothofagus Species: Do Leaves Protect the Stem Functionality? Tree Physiol. 2012, 32, 880–893. [Google Scholar] [CrossRef] [PubMed]
  53. Scholz, F.G.; Bucci, S.J.; Goldstein, G. Strong Hydraulic Segmentation and Leaf Senescence Due to Dehydration May Trigger Die-Back in Nothofagus Dombeyi under Severe Droughts: A Comparison with the Co-Occurring Austrocedrus Chilensis. Trees 2014, 28, 1475–1487. [Google Scholar] [CrossRef]
  54. Bennett, A.C.; McDowell, N.G.; Allen, C.D.; Anderson-Teixeira, K.J. Larger Trees Suffer Most during Drought in Forests Worldwide. Nat. Plants 2015, 1, 15139. [Google Scholar] [CrossRef] [PubMed]
  55. McDowell, N.G.; Allen, C.D. Darcy’s Law Predicts Widespread Forest Mortality under Climate Warming. Nat. Clim. Change 2015, 5, 669–672. [Google Scholar] [CrossRef]
  56. Leifsson, C.; Buras, A.; Klesse, S.; Baittinger, C.; Bat-Enerel, B.; Battipaglia, G.; Biondi, F.; Stajić, B.; Budeanu, M.; Čada, V.; et al. Identifying Drivers of Non-Stationary Climate-Growth Relationships of European Beech. Sci. Total Environ. 2024, 937, 173321. [Google Scholar] [CrossRef] [PubMed]
  57. Diaz, D.G.; Ignazi, G.; Mathiasen, P.; Premoli, A.C. Climate-Driven Adaptive Responses to Drought of Dominant Tree Species from Patagonia. New For. 2022, 53, 57–80. [Google Scholar] [CrossRef]
  58. Colangelo, M.; Camarero, J.J.; Borghetti, M.; Gazol, A.; Gentilesca, T.; Ripullone, F. Size Matters a Lot: Drought-Affected Italian Oaks Are Smaller and Show Lower Growth Prior to Tree Death. Front. Plant Sci. 2017, 8, 135. [Google Scholar] [CrossRef]
  59. Galiano, L.; Martínez-Vilalta, J.; Sabaté, S.; Lloret, F. Determinants of Drought Effects on Crown Condition and Their Relationship with Depletion of Carbon Reserves in a Mediterranean Holm Oak Forest. Tree Physiol. 2012, 32, 478–489. [Google Scholar] [CrossRef]
  60. Cranston, B.M.; Powers, B.F.; Macinnis-Ng, C. Inexpensive Throughfall Exclusion Experiment for Single Large Trees. Appl. Plant Sci. 2020, 8, e11325. [Google Scholar] [CrossRef]
  61. Molowny-Horas, R.; Suarez, M.L.; Lloret, F. Changes in the Natural Dynamics of Nothofagus Dombeyi Forests: Population Modeling with Increasing Drought Frequencies. Ecosphere 2017, 8, e01708. [Google Scholar] [CrossRef]
  62. Neycken, A.; Scheggia, M.; Bigler, C.; Lévesque, M. Long-Term Growth Decline Precedes Sudden Crown Dieback of European Beech. Agric. For. Meteorol. 2022, 324, 109103. [Google Scholar] [CrossRef]
  63. Cailleret, M.; Jansen, S.; Robert, E.M.; Desoto, L.; Aakala, T.; Antos, J.A.; Beikircher, B.; Bigler, C.; Bugmann, H.; Caccianiga, M. A Synthesis of Radial Growth Patterns Preceding Tree Mortality. Glob. Change Biol. 2017, 23, 1675–1690. [Google Scholar] [CrossRef]
  64. Kannenberg, S.A.; Novick, K.A.; Alexander, M.R.; Maxwell, J.T.; Moore, D.J.; Phillips, R.P.; Anderegg, W.R. Linking Drought Legacy Effects across Scales: From Leaves to Tree Rings to Ecosystems. Glob. Change Biol. 2019, 25, 2978–2992. [Google Scholar] [CrossRef]
  65. Gazol, A.; Camarero, J.J.; Sánchez-Salguero, R.; Vicente-Serrano, S.M.; Serra-Maluquer, X.; Gutiérrez, E.; de Luis, M.; Sangüesa-Barreda, G.; Novak, K.; Rozas, V. Drought Legacies Are Short, Prevail in Dry Conifer Forests and Depend on Growth Variability. J. Ecol. 2020, 108, 2473–2484. [Google Scholar] [CrossRef]
  66. Vilonen, L.; Ross, M.; Smith, M.D. What Happens after Drought Ends: Synthesizing Terms and Definitions. New Phytol. 2022, 235, 420–431. [Google Scholar] [CrossRef]
  67. Chen, Y.; Wright, S.J.; Muller-Landau, H.C.; Hubbell, S.P.; Wang, Y.; Yu, S. Positive Effects of Neighborhood Complementarity on Tree Growth in a Neotropical Forest. Ecology 2016, 97, 776–785. [Google Scholar] [CrossRef]
  68. Fichtner, A.; Härdtle, W.; Bruelheide, H.; Kunz, M.; Li, Y.; von Oheimb, G. Neighbourhood Interactions Drive Overyielding in Mixed-Species Tree Communities. Nat. Commun. 2018, 9, 1144. [Google Scholar] [CrossRef]
  69. Pretzsch, H.; Schütze, G.; Uhl, E. Resistance of European Tree Species to Drought Stress in Mixed versus Pure Forests: Evidence of Stress Release by Inter-specific Facilitation. Plant Biol. 2013, 15, 483–495. [Google Scholar] [CrossRef]
  70. Gyenge, J.E.; Fernández, M.E.; Dalla Salda, G.; Schlichter, T. Leaf and Whole-Plant Water Relations of the Patagonian Conifer Austrocedrus Chilensis (D. Don) Pic. Ser. et Bizzarri: Implications on Its Drought Resistance Capacity. Ann. For. Sci. 2005, 62, 297–302. [Google Scholar] [CrossRef]
  71. Sangüesa-Barreda, G.; Camarero, J.J.; Oliva, J.; Montes, F.; Gazol, A. Past Logging, Drought and Pathogens Interact and Contribute to Forest Dieback. Agric. For. Meteorol. 2015, 208, 85–94. [Google Scholar] [CrossRef]
  72. Grossiord, C. Having the Right Neighbors: How Tree Species Diversity Modulates Drought Impacts on Forests. New Phytol. 2020, 228, 42–49. [Google Scholar] [CrossRef]
  73. Ford, K.R.; Breckheimer, I.K.; Franklin, J.F.; Freund, J.A.; Kroiss, S.J.; Larson, A.J.; Theobald, E.J.; HilleRisLambers, J. Competition Alters Tree Growth Responses to Climate at Individual and Stand Scales. Can. J. For. Res. 2017, 47, 53–62. [Google Scholar] [CrossRef]
  74. Versace, S.; Gianelle, D.; Garfì, V.; Battipaglia, G.; Lombardi, F.; Marchetti, M.; Tognetti, R. Interannual Radial Growth Sensitivity to Climatic Variations and Extreme Events in Mixed-Species and Pure Forest Stands of Silver Fir and European Beech in the Italian Peninsula. Eur. J. For. Res. 2020, 139, 627–645. [Google Scholar] [CrossRef]
  75. González De Andrés, E.; Camarero, J.J.; Blanco, J.A.; Imbert, J.B.; Lo, Y.; Sangüesa-Barreda, G.; Castillo, F.J. Tree-to-tree Competition in Mixed European Beech–Scots Pine Forests Has Different Impacts on Growth and Water-use Efficiency Depending on Site Conditions. J. Ecol. 2018, 106, 59–75. [Google Scholar] [CrossRef]
Figure 1. Map showing N. dombeyi distribution (green) in Nahuel Huapi National Park, northern Patagonia (Argentina), and the location of the field sampling site (red star). Coordinates on the axes are given in the World Geodetic System (WGS 84). To the right, illustrative views of the site in 2019 (top photograph), and trees that died in 2015 (bottom photograph).
Forests 15 01355 g001
Figure 2. (a) Inter-annual variation of basal area increment (BAI) of vital (solid green lines) and dead (dashed orange lines). Solid lines represent the means and shaded areas around them the standard error of the mean. The grey rectangles indicate the periods when BAI significantly (p < 0.05) differed between vigour classes (Wilcoxon rank-sum tests). Downward triangles in red represent the main drought years during the last decades (1998, 2008 and 2015). The plot inset in figure represents predicted smooth differences in the effect of calendar year on growth trends according to GAMMs. (b) Resistance (Rt), recovery (Rc), resilience (Rs) and Legacy98 (pre/post 10 years) against the driest spells (1998 and 2008). The mingling index (M) was used as colour scale (0 = light green to 1 = dark green) for individual resilience components.
Forests 15 01355 g002
Figure 3. Pearson correlation coefficients using detrended prewhitened individual tree ring index (coloured jitter points with mean (red line)) and group residual chronology (black point range) with mean monthly temperature and total monthly precipitation for vital (top) and dead (bottom) N. dombeyi trees. Solid black point range depicts significant correlation according to bootstrap. The mingling index (M) was used as colour scale (0 = light green to 1 = dark green) for individual climate–growth tree coefficients.
Forests 15 01355 g003
Figure 4. Visual representation of the significant correlation between tree level characteristics (diameter at breast height = DBH, 25-year mean BAI = BAI25, tree height = ht, crown spread = W; green circles), climate–growth relationships (P = with precipitation, T = with temperature, light pink circles), drought response indices (resistance = Rt, recovery = Rc, resilience = Rs, 10-year post-drought response following 1998 drought = leg98, brown circles), and neighbour pressure (competition index = CI, percentage of N. dombeyi = %Nd, percentage of co-dominant broadleaf = %Bl, percentage of A. chilensis = %Au, percentage of subcanopy species = %sub, percentage of dead N. dombeyi = %NDT, light blue circles). Solid lines (edges) represent positive correlations and dashed lines negative correlations. Circle (nodes) size represents degree of centrality. The top panel (a) corresponds to network representation of vital trees, and the bottom panel (b) to dead ones. Please refer to the web version of this article for an interpretation of the reference colours.
Forests 15 01355 g004
Table 1. Summary of the fitted generalized additive mixed model (GAMM) explaining changes in BAI (log BAI + 1) of vital and dead N. dombeyi trees over the period 1925–2015. Smooth terms correspond to the difference in the smooth terms between vital and dead trees, as the model was set with vital group as the reference level of vitality. Estimate and standard error (Std. Error) is shown for the linear term, whereas estimated degree of freedom (Edf) and the F-value are given for the smooth terms. Significant p-values are in bold.
Predictor VariablesEstimate/EdfStd. Error/
F-Value
p
Linear Terms
Height0.0370.0270.164
DBH0.3770.025<0.001
Vitality (dead)0.0690.0490.159
Smooth terms
SPEI3Jan1.4949.2860.007
Year3.91070.40<0.001
Year × Vitality (dead)1.0000.3050.581
SPEI3Jan × Vitality (dead)1.0000.1400.708
Year × SPEI3Jan10.98513.759<0.001
Year × SPEI3Jan × Vitality (dead)1.0280.1780.072
Observations4533
Adjusted R20.554
Table 2. Summary of the fitted linear mixed-effect model estimating the effect of SPEI3Jan, competition, and species mingling on BAI (log BAI + 1) of vital and dead N. dombeyi trees over the period 1990–2015. SPEI3Jan corresponds to standardized drought index over November, December, and January, CI indicates the competition index, and M is the mingling index. Significant p-values are in bold.
VariablesEstimatesStd. Errorp
Fixed effects
Intercept−3.394.030.360
Vitality (vital)0.710.370.060
Year0.0020.0020.181
SPEI3Jan0.030.01<0.001
CI−0.030.050.466
M1.160.400.005
Vitality (vital) × CI0.030.080.719
Vitality (vital) × M−1.350.600.027
Random Effects
σi2 *0.14
N59ID
Observations1457
Marginal R2/Conditional R20.176/0.644
* σi2 represents the mean random effect variance of the model. R-squared values are based on Nakagawa et al. [51].
Table 3. Summary of the fitted linear mixed-effect model estimating the effect of SPEI3Jan (standardized drought index over November, December, and January), competition (CI), and neighbourhood mingling (M) on resilience component (resistance, recovery, and resilience) of vital and dead N. dombeyi trees during 1998 and 2008 dry spells. Significant p-values are in bold.
VariablesLog (Resistance)Log (Recovery)Log (Resilience)
Est. (Std. Error)pEst. (Std. Error)pEst. (Std. Error)p
Fixed effects
Intercept−0.33 (0.38)0.390.39 (0.45)0.390.21 (0.29)0.47
SPEI3Jan0.08 (0.13)0.550.04 (0.13)0.750.10 (0.12)0.43
DBH−0.001 (0.01)0.840.003 (0.01)0.76−0.002(0.01)0.72
Vitality (dead)0.87 (0.50)0.08−0.76 (0.59)0.21−0.16 (0.45)0.73
CI0.03 (0.04)0.500.03 (0.06)0.590.02 (0.03)0.50
M−0.24 (0.28)0.400.29 (0.36)0.420.15 (0.24)0.53
DBH × Vitality (dead)−0.03 (0.01)0.0060.03 (0.01)0.050.004 (0.01)0.68
CI × Vitality (dead)−0.05 (0.05)0.370.01 (0.07)0.910.04 (0.05)0.38
M × Vitality (dead)0.24 (0.39)0.55−0.13 (0.50)0.79−0.10 (0.35)0.76
SPEI3Jan × Vitality (dead)0.07 (0.19)0.72−0.10 (0.18)0.580.02 (0.17)0.88
Random Effects
σi2 *0.160.150.12
N616161
Observations122120121
Marginal R2/Conditional R20.150/0.1540.108/0.3330.044/0.044
* σi2 represents the mean random effect variance of the model. R-squared values are based on Nakagawa et al. [51].
Table 4. Studied variables and values for degree centrality (number of edges per node) in the established network.
Variables GroupCentrality
Tree VitalityVitalDead
Diameter at breast height (DBH)Tree characteristic24
25-year mean BAI (BAI25)Tree characteristic15
Tree height (ht)Tree characteristic2-
Crown spread (W)Tree characteristic11
Temperature relationship (T)Climate–growth12
Precipitation relationship (PClimate–growth21
Resistance (Rt)Drought response indices23
Recovery (Rc)Drought response indices44
Resilience (Rs)Drought response indices21
10-year post-drought response (leg98)Drought response indices21
Competition index (CI)Neighbour pressure11
Percentage of N. dombeyi (%Nd)Neighbour pressure35
Percentage of co-dominant broadleaf (%Bl)Neighbour pressure11
Percentage of A. chilensis (%Au)Neighbour pressure31
Percentage of subcanopy species (%sub) *Neighbour pressure22
Percentage of dead N. dombeyi (%NDT)Neighbour pressure41
* Raukaua laetevirens (Gay) Frodin, Luma apiculate (DC.) Burret, Maytenus magellanica (Lam.) Hook. f., Lomatia hirsuta (Lam.) Diels.
Disclaimer/Publisher’s Note: The statements, opinions and data contained in all publications are solely those of the individual author(s) and contributor(s) and not of MDPI and/or the editor(s). MDPI and/or the editor(s) disclaim responsibility for any injury to people or property resulting from any ideas, methods, instructions or products referred to in the content.

