Review

Understanding Tree Mortality Patterns: A Comprehensive Review of Remote Sensing and Meteorological Ground-Based Studies

by
Filippos Eliades
1,2,*,
Dimitrios Sarris
3,4,
Felix Bachofer
5,
Silas Michaelides
2 and
Diofantos Hadjimitsis
1,2
1
Department of Civil Engineering and Geomatics, Remote Sensing and GeoEnvironment Lab, Cyprus University of Technology, Limassol 3036, Cyprus
2
Eratosthenes Centre of Excellence, Limassol 3012, Cyprus
3
KES Research Centre, Nicosia 1055, Cyprus
4
KES College, Nicosia 1055, Cyprus
5
Earth Observation Center (EOC), German Aerospace Center (DLR), 82234 Wessling, Germany
*
Author to whom correspondence should be addressed.
Forests 2024, 15(8), 1357; https://doi.org/10.3390/f15081357
Submission received: 1 July 2024 / Revised: 30 July 2024 / Accepted: 1 August 2024 / Published: 3 August 2024
(This article belongs to the Section Forest Inventory, Modeling and Remote Sensing)

Abstract

:
Land degradation, desertification and tree mortality related to global climate change have been in the spotlight of remote sensing research in recent decades since extreme climatic events could affect the composition, structure, and biogeography of forests. However, the complexity of tree mortality processes requires a holistic approach. Herein, we present the first global assessment and a historical perspective of forest tree mortality by reviewing both remote sensing and meteorological ground-based studies. We compiled 254 papers on tree mortality that make use of remotely sensed products, meteorological ground-based monitoring, and climatic drivers, focusing on their spatial and temporal patterns and the methods applied while highlighting research gaps. Our core results indicate that international publications on tree mortality are on the increase, with the main hotspots being North America (39%) and Europe (26%). Wetness indicators appear as the barometer in explaining tree mortality at a local scale, while vegetation indicators derived from multispectral optical sensors are promising for large-scale assessments. We observed that almost all of the studies we reviewed were based on less than 25 years of data and were at the local scale. Longer timeframes and regional scale investigations that will include multiple tree species analysis could have a significant impact on future research.

1. Introduction

1.1. Drought Relevance with Tree Mortality

The frequency with which climate change is exerting pressure on ecosystems and the living environment constitutes a major threat to sustaining natural resources in the future. According to the World Meteorological Organization, global temperature projections for the next five years suggest an increase by about 1.5 °C, with a 40% chance [1]. Nevertheless, this reduction of the predicted average warming of 1.5 °C from the initially assumed increase of 2.0 °C will be very beneficial for the ecosystems, reducing stress and maintaining their balance [2]. However, under further warming, forest decline may accelerate in many regions due to a concurrent increase in water deficit. Hence, water shortage and drought might reduce tree productivity and affect forest ecosystems [3]. Drought is a major factor that influences vegetation [4], while related pests and pathogens that can grow on weak trees can unavoidably lead to tree mortality. Significant uncertainty exists as to how these effects and relevant processes will impact the risk of future tree mortality events within the context of a changing climate. While a mix of responses is to be expected, instances of increased tree mortality due to drought and/or high temperature may already be occurring in some areas in response to global climate change (notable examples of recent tree mortality events are well documented in Section 3).
Furthermore, natural processes and exhaustive human activities can lead to a reduction of plant cover, loss of soil and organic matter, as well as increases in run-off [5,6]. The decrease in vegetation coverage can lead to land degradation and even to desertification of dryland ecosystems [7].
One key challenge is to understand and predict changes that may be abrupt, nonlinear and irreversible [8]. These changes are hereafter referred to as “critical transitions”. Critical transitions are experienced when an ecosystem loses its resilience due to sudden drastic changes, such as lake eutrophication or land desertification [9]. In view of the above, various studies investigate the response of forests under extreme droughts and/or high temperatures, which have a high probability of occurrence in several forest regions, thus enhancing the rate of tree mortality [10]. Forested ecosystems, especially in the Mediterranean area, appear to have experienced climatic-induced physiological stress under extreme droughts and warming, raising concerns that forests may become increasingly vulnerable to mortality.
Extreme droughts and wet conditions drastically affect vegetation dynamics, causing abrupt yearly changes in phenological cycles [11]. Water limitations primarily impact four biome types: (i) savannas, (ii) conifer forests, (iii) the Mediterranean woodlands, (iv) temperate evergreen and deciduous forests, and (v) evergreen broadleaved tropical forests [10].
Uncertainty remains as to when and how extreme climatic events will trigger tree mortality. Analyses and investigations from empirical observations are limited, and real-world studies are rare [12]. Continuous observations are key in monitoring environmental variables. Observational limitations lead to difficulties in measuring long-term variables related to high-frequency time series.

1.2. Efforts in Remotely Sensed and Meteorological Monitoring of Tree Mortality

Assessment of desertification is based on three methodological approaches: expert judgment, satellite observation of net primary productivity, and use of biophysical models that, when combined, provide a holistic contemplation of desertification and land degradation; none of these alone can capture the full picture [13]. To monitor complex phenomena, meteorological monitoring of air temperature and precipitation from ground-based stations is essential to assess short-term weather impacts and long-term climatic evolution and to evaluate the effects of atmospheric and climate change processes [14]. For this reason, meteorological station networks improve the understanding of various environments [15] and abrupt changes [16] related to tree mortality. However, individual meteorological stations cannot provide an adequate analysis of spatial and temporal variability over an area [15]. However, remote sensing observations with high temporal resolution can provide important datasets that may be used in retrieving appropriate indicators for assessing critical transitions through the years [8].
The vulnerability of a region to desertification can be assessed with several methods. Today, with the advancement of remote sensing technology, it is possible to investigate desertification using a large number of parameters [17], such as responses of vegetation under human pressure and environmental disturbances, low cost of collecting data, greater spatiotemporal resolution, continuous update and ease in availability of data [18]. Remote sensing has the potential to monitor the long-term dynamics of complex ecosystems in real-time, such as abrupt changes [16]. The utilization of thermal, multispectral and microwave remote sensing could effectively characterize the spatiotemporal characteristics of drought conditions. It is important to note that a number of space-borne sensors can illustrate longer drought events due to the longer-term availability of continuous high-resolution imagery, such as the Landsat sensor operating since 1984 [18]. Other multispectral optical sensors can be used effectively to monitor greenness, tree mortality and density of vegetated areas, such as the Advanced Very High-Resolution Radiometer (AVHRR), Moderate Resolution Imaging Spectroradiometer (MODIS) and Sentinel-2 [19] (for a complete list of all the acronyms and abbreviations used in this paper, please see the Abbreviations section).
The major constraint of various sensors, such as that of multispectral Landsat, is the low revisit time and data gaps due to cloud coverage. The launch in 2015 of Sentinel-2, with a 10 m spatial resolution and revisit time every 10 days, allows an efficient analysis of drought [20]. Also, various sensors provide other opportunities, such as the multispectral imagery of MODIS and NOAA-AVHRR, with low spatial resolution (250 m to 1 km) but with higher temporal resolution up to twice daily [21,22].
Apart from multispectral and thermal sensors, microwave sensors play a vital role in drought monitoring and assessment. In this respect, various sensors can observe atmospheric variables, such as ozone content, precipitation (e.g., Global Precipitation Measurement Mission—GPM) and soil moisture by the Soil Moisture Active and Passive (SMAP) mission. Global coverage allows These sensors to penetrate through cloud cover, haze and dust in near-real-time [23]. It is noteworthy that the utilization of the online platform of Google Earth Engine makes the processing of vast cloud-based datasets possible in order to characterize and assess drought and desertification events [24,25,26]. Nonetheless, integrating ground-based measurements of meteorological variables with data from remote sensing technologies [27], such as radar and LiDAR, makes detecting various environmental anomalies and changes more tangible [28].
In sum, meteorological ground-based monitoring data in real-time [29], including temperature and precipitation, may be used to fill in gaps in remotely sensed data due to cloud cover, haze or dust.
The optical sensors onboard Landsat and MODIS constitute the primary source of data, with NDVI being the most common indicator in mortality detection. Monitoring tree growth, water content, and physiological responses using remotely sensed data has further enhanced the interest of the scientific community in studying forest tree mortality.

1.3. The Objectives and Structure of This Review

In this comprehensive review, our analysis encompasses 254 scientific articles, with a focus on tree mortality due to drought, including 206 studies employing remote sensing and 48 utilizing meteorological ground-based monitoring. We explore the historical development of the field of remote sensing and identify global forest tree mortality research hotspots. This is the first global assessment and a historical perspective of forest tree mortality from a remote sensing perspective, alongside meteorological ground-based approaches, providing an analysis of the indicators employed, the methods used, and the spatiotemporal resolution adopted, while identifying relevant deficiencies and gaps, upon which future research directions are proposed. Subsequently, we address key research questions, explore the historical development of the field, identify tree mortality hotspots, examine spatial and temporal scales, detail sensor usage, elucidate methods for understanding tree mortality, discern prevalent indicators, and highlight predominant research focuses. To enrich our capacity to identify trends in tree mortality, we discuss identified gaps and propose future research directions.
In the upcoming sections, we provide details of our review method (Section 2) and the results related to the research questions set (Section 3). Section 4 discusses the implications of the findings, followed by conclusions and future outlook in Section 5.

2. Materials and Methods

For our analysis, we used the Web of Science digital database, including the Science Citation Index (SCI) (last accessed on 16 October 2023). A systematic review assesses the progress of tree/forest mortality research papers globally based on remote sensing and meteorological ground-based ones. Figure 1a illustrates the workflow adopted, resulting in n = 254 peer-reviewed publications (the list of References does not cover all the papers used in the current analysis; instead, the complete list is given in Supplementary Materials S1). Remote sensing and meteorological ground-based studies are depicted as overlapping circles in Figure 1b. We incorporate the all-possible synonymous terms with tree mortality by combining various groups of terms related to “remote sensing” and “meteorology”.
We considered tree mortality studies that mentioned keywords such as “tree mortality”, “dieback”, or “die-off”, along with specific terms such as “meteorology”, “climatology”, “meteorological station” and “meteorological data”, or any term starting with “meteorolog*” and “climatalo*”. Separately, for studies related to remote sensing, we included those mentioning words such as “remote sensing”, “aerial imagery”, “RS”, “earth observation”, “EO”, or “mapping”.
Using these specific search criteria, our initial query generated more than 18,000 results. To narrow down the scope to publications with a focus on climatic-induced tree mortality, we refined the search by including the terms such as “drought”, “desertification”, “climate change”, and terms beginning with “resilien*” and “disaster*” in the search string. This adjustment resulted in a more manageable set of 3124 results (Figure 1b).
Here, TS means “topic”. Publications are considered if they are focused on the topic, peer-reviewed, and keywords appear in a given paper’s title, abstract, and/or keyword, whereas AND and OR are Boolean conditions used to formulate the search. In light of the above, the returned total number of combinations is n = 3124. Finally, we removed all duplicate articles, manually filtered each article, and selected papers that focused on tree mortality remote sensing and meteorological monitoring. In this filtering stage, we selected results that meet all search terms and additional filters applied so far while specifically addressing tree mortality. In a second step, we manually eliminated any publications that remained but did not align with our scope of tree mortality and focused on: non-forested areas, non-use of meteorological indicators/analysis (for meteorological articles only), “insects”, “pathogens”, “deforestation”, “fire”, “beetle”, “human-induced”, “human practices”, “fertilizers” or ”grazing” (the combinations of searching strings of remote sensing and meteorology of articles is given in the Supplementary Materials S2).
From the beginning, we refined our search by restricting accepted document types to review papers, ensuring that the selected publications underwent peer review scrutiny. Subsequently, we conducted manual filtering of the publications based on full text/topic, identifying and excluding results that did not match our thematic focus despite meeting all search terms and other filtering criteria up to that point. In this final filtering step, only studies focusing on the combination of tree mortality, remote sensing, climatic-induced tree mortality and meteorological monitoring were retained, while those lacking a focus on those fields were filtered out. Regarding tree mortality, our inclusion criteria encompassed specific tree species such as pine, oak, cedar, fir, spruce and beech.
We did not set a temporal frame for the publication year of the included publications, but the first publication that fit our search criteria was from 1993. However, the majority of the works included have been published within the last fifteen years. Taking the above into consideration, we finally reviewed a total of 254 research articles. Each publication was categorized into groups. Given the plethora of variables in this systematic review, we produce the graphs and tables presented in Section 3. Table 1 displays a list of 20 variables relevant to this review.

3. Results

In the following, we first expose the spatial distribution of papers based on remote sensing and meteorological parameters over time and their global distribution. Then, we present the spatial distribution of meteorological drought indicators, biomes monitored, the type of sensors used, as well as the methods and indicators of remote sensing and the meteorological ground-based monitoring applied.

3.1. Tree Mortality Studies over Time

Tree mortality papers appear to have increased over the years (Figure 2). The first pioneer study on tree mortality monitoring related to frequent drought events appeared for patches of California Cuyamaca State Park in 1993 [30]. A few peer-reviewed articles appear until 2009, with data gaps in 1998–2002, 2006, and 2008. Figure 2 depicts an increasing trend, starting from 2010, in the number of published research articles, which will peak in 2021.
The significant increase in tree mortality papers is mostly due to remote sensing-based publications, whereas publications based on meteorological parameters remain relatively stable (ca. two to six per year). In 2021, publications of remote sensing measurements peaked with 29 articles, while meteorological-based publications peaked in 2022 with six articles.

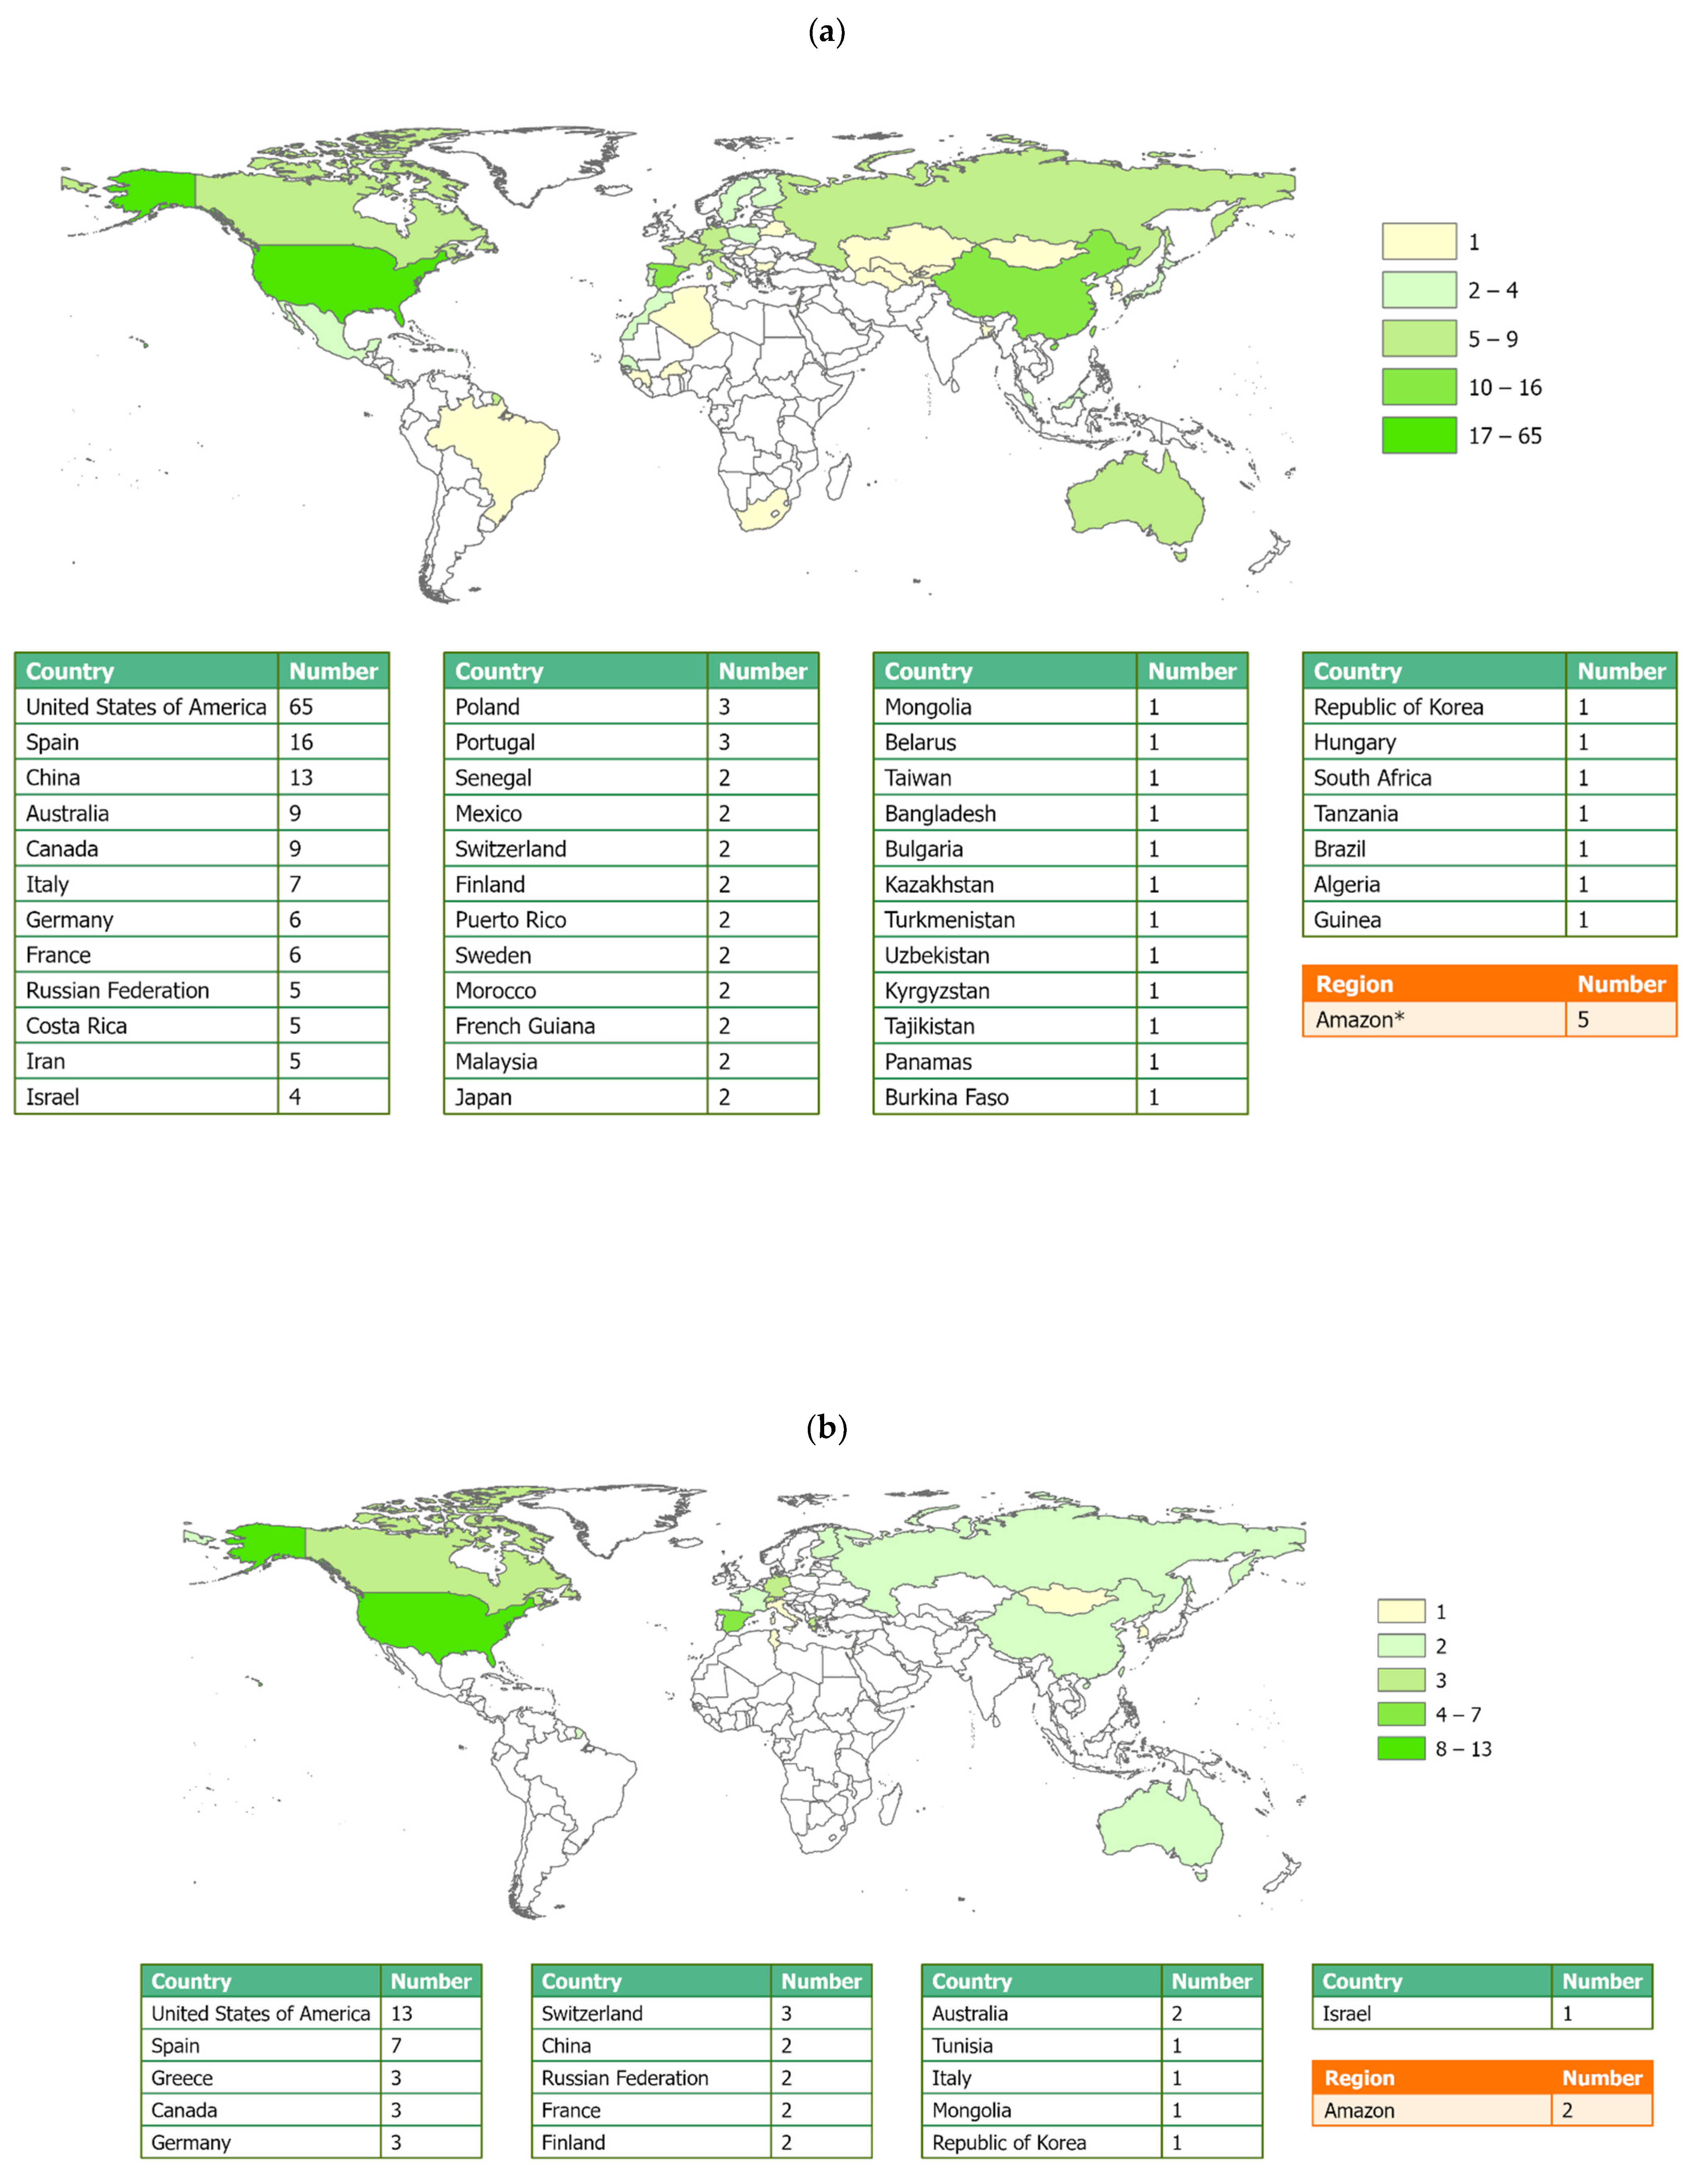
3.2. Spatial Distribution of Reviewed Research Articles

The hotspots of tree mortality publications applying remote sensing or using meteorological ground-based indicators are shown in Figure 3a,b, respectively. Various areas of interest (AOI) are counted separately, and all research articles per country are visualized. Emphasizing this, some studies have multiple AOI. Each country contains the respective number of AOI of tree mortality. In these figures, the classification was performed using five Jenks Natural Breaks clusters to underline the most significant AOI, but also contains the lowest counters, spotting the differences between the countries and regions.
Tree mortality events in diverse ecosystems, from monsoonal savannas with less than 400 mm of annual precipitation to sub-alpine forests in Mediterranean climates and tropical rainforests receiving more than 3000 mm of annual precipitation, are gathering significant attention from researchers. Extensive die-offs are often linked with prolonged water shortages, such as those experienced in savannas and temperate conifer forests during multi-year droughts. In the case of temperate forests, short-term seasonal droughts are more likely to lead to mortality in broadleaved (deciduous angiosperm) trees rather than conifers (evergreen needleleaf trees) due to their higher vulnerability to xylem cavitation [10].
Remotely sensed tree mortality research studies are more frequent in the United States of America (65), followed by Spain (16), China (13), Australia (9), Canada (9), Italy (7), and Germany (6). The five major hotspots in the United States of America (USA) are California (31), New Mexico (7), Arizona (7), Colorado (6), Utah (4), and Texas (4). Dryland forests are a common characteristic of all five areas. Research activity in South America (i.e., 6) is concentrated in the Amazon basin. Research articles focusing on the European continent amount to 54.
Meteorological ground-based research studies on tree mortality have been conducted in the USA (13), Spain (7), Greece (3), Canada (3), Germany (3), and Switzerland (3). Based on Figure 3a,b and Figure 4, eleven papers using remotely sensed and meteorological drought indicators focus on Mediterranean Basin forests. Furthermore, a few papers focused on Africa (five were based on remote sensing, and one was using meteorological parameters), while South America had just one entry from Brazil, which was based on remote sensing.
Interestingly, the review revealed that only 61 meteorological ground-based research studies were combined with remote sensing data, providing a more holistic approach to monitoring tree mortality. USA appears in one-third of all research publications (72) using the two methods. The Amazonian Forest is less often investigated (seven studies overall) despite reports of severe drought events that increased tree mortality rates in the region [31].
To enable a better overview of articles on tree mortality under climatic water stress and high temperatures in forests, we focused on studies founded on meteorological ground-based drought indicators only. To estimate the impact of climate on tree mortality papers globally, we grouped countries with research publications that include Potential Evapotranspiration (PET), Precipitation minus Potential Evapotranspiration (P-PET), Palmer Drought Severity Index (PDSI), Self-Calibrated Palmer Drought Severity Index (scPDSI), Standardized Precipitation Index (SPI), Standardized Precipitation-Evapotranspiration Index (SPEI), and Actual Evapotranspiration (AET), as it is shown in Figure 4. meteorological drought indicators are determined by the location of the country, the impact of climate and the number of cases of tree mortality per country. Figure 4 illustrates an increasing research interest in the USA (37), Spain (13), and China (10), followed by Canada, Germany, and the Russian Federation (6 articles each). Equally important is that studies with the combined use of PDSI, PET, SPI, and remote sensing have not been recorded in Europe. The SPEI indicator was by far the most frequently used meteorological indicator, applied in roughly 49% of the papers published.

3.3. Temporal Scale and Spatial Resolution of Tree Mortality Publications

Drought and tree mortality research has become increasingly available since the launch of the first Landsat program in 1972, which provided a plethora of multi-sensor products [23,32]. The timeframe adopted in each research article is shown in Figure 5, separately for each of the two approaches (remote sensing and meteorological ground-based). The tree mortality study, using meteorological indicators with the longest timeframe of 100 years, was conducted in Switzerland [33]. The average time span of all tree mortality studies is approximately 39 years. Remote sensing articles cover an average time span of about eleven years. Only three research publications based on meteorological monitoring were recorded before 2010, while 57% of tree mortality articles based on remote sensing were published in the last five years. In response to this evidence, tree mortality can be a slow and gradual process, requiring long-term monitoring to document its dynamics and the factors affecting it. An extended timeframe allows for a more detailed understanding of long-term ecological trends, favoring the meteorological ground-based approach instead of remote sensing, which undoubtedly offers large-scale information on forest health.
The major interest in long-term tree mortality monitoring through remote sensing started in 2010. Noticeably, 42 tree mortality research papers covered a time span of over 20 years out of 206 articles using remote sensing. For meteorological ground-based monitoring, there was only one study with a time span of 100 years, whereas 30 out of 48 papers reviewed covered less than 50 years.
The spatial resolution and spatial extent utilized in the studies covered herein are depicted in Figure 6. Spatial extent is categorized based on three different scales: local, regional and global. The majority of tree mortality studies are deployed on a local scale.
Most research articles utilize high (≤10 m) or medium (≤100 m) spatial resolution on mostly Landsat data, although the temporal resolution of Landsat data is restrained by infrequent revisit times, gaps due to cloud presence, shadows or nighttime. In 2022, the time series used in studies at the local scale had an average timeframe of about 13 years, while for the period 2010–2020, the average time series length was 9 years. Additionally, Landsat provides monthly time series due to its temporal resolution of 16 days [34,35,36,37,38], while MODIS provides daily time series due to its higher temporal resolution [39,40].
Taking all of the above into account, there appears to be a tendency for high spatial resolution studies to adopt a low temporal resolution, while studies with low spatial resolution are associated with a longer time span analysis. In order to overcome temporal and spatial gaps, a fusion of various data is pursued by combining remote sensing and meteorological ground-based monitoring. Adopting meteorological drought indicators with long time series and high spatial resolution could allow for a more realistic analysis [10], permitting an assessment of forest health, even for forest patches, in heterogeneous forest landscapes. Collectively, there is a need to link temperature and precipitation climatic drivers with broad-scale remote sensing to permit more accurate modeling simulations of drought stress responses in trees [10].

3.4. Remotely Sensed Sensors’ Distribution

This review identified 29 satellite sensors used in tree mortality studies. The spatial scale, the AOI, and the time span of available data are the three major factors that determine the choice of a particular sensor for monitoring tree mortality. In view of this, we categorized the various satellite sensors into three single types: “active microwave”, “passive microwave” and “optical”. Considering also the multi-type sensors usage, three additional types are added: “optical and active microwave”, “passive, thermal and optical microwave”, and “passive microwave and optical”. The percentages of each of these six categories of sensors used are illustrated in Figure 7a.
The choice of a sensor largely depends on the study’s objectives, such as whether it focuses, the AOI and the length of the timeframe under consideration.
Landsat satellites were the most commonly used sensors for observing and characterizing tree mortality (31.0%), followed by MODIS (27%) and LiDAR (8.2%). Unmanned Aerial Vehicles (UAV), Sentinel-2 and Aerial Imagery sensors are ranked fourth, fifth and sixth place, with a representation of 6.1%, 4.9% and 3.3%, respectively. Studies on AVHRR, QuickBird 1-2, Spectroradiometer, WorldView 2-3, and National Agriculture Imagery Program (NAIP) amounted to between 1% and 3%. The remaining active and passive microwave sensors’ usage had a very low contribution of less than 1% globally.
The major categories of satellite sensor types were divided into passive, active, optical and their combinations. Passive sensors, including multispectral and hyperspectral optical sensors, rely on solar radiation reflected from the Earth’s surface and are sensitive to atmospheric conditions such as clouds and haze. While passive sensors like those on Landsat and MODIS were the most popular (88%) for their high spatial and temporal resolution, they can face challenges with cloud cover, affecting their ability to accurately analyze dynamic changes (Figure 7b). In contrast, a considerable number of studies (6.4%) relied on active microwave sensors, namely LiDAR and SAR sensors, generating their own radiation, which is measured after interacting with an object. LiDAR uses light in visible and infrared wavelengths, while SAR uses microwave radiation to assess backscatter. Active sensors are less affected by atmospheric conditions like clouds, making them valuable for reliable data collection. Although LiDAR is well-suited for topographic and altimetry studies, it is commonly used for forest biomass and structure. Overall, the choice between passive and active sensors depends on the specific needs of the study, such as spatial resolution, temporal frequency, and atmospheric conditions.
Utilizing sensors separately could potentially result in specific limitations that influence their usability. In light of the above, active sensors that are sensitive to the returning signal can be deployed to compensate for anomalies in topography at heterogeneous/uneven areas [36,41]. Combined optical and active sensors are less frequently used (3.9%). The combined use of passive and optical sensors and optical, passive and active microwaves provides opportunities for improved tree mortality monitoring but accounts for only 0.5% of the reviewed studies.

3.5. Methods for Tree Mortality Analysis

Several remote sensing indicators have been developed and applied to analyze and characterize tree mortality events and assess their causes. These causes are frequently not attributable to a single factor but to the interaction of biotic and abiotic factors. Bearing this in mind, the indicators reviewed are categorized as biotic and abiotic.
Figure 8 presents the various indicators extracted from remote sensing articles on tree mortality monitoring and assessment since the first studies of tree mortality in 1993 and 1994 [30,42]. The Normalized Difference Vegetation Index (NDVI) is the most frequently used indicator to monitor tree mortality, represented in 28% of the studies. A notable 9% of publications employ advanced techniques such as unsupervised classification as an approach based on natural patterns, without using sample classes and supervised classification based on chosen samples to delineate tree mortality areas, followed by the Enhanced Vegetation Index (EVI, 6%).
The Normalized Difference Water Index (NDWI) is another less frequently used indicator, used in nearly 4% of the studies; this indicator aims at monitoring the structure and biomass of trees affected by drought [30,43,44]. Noticeably, the Leaf Area Index (LAI) ranked in fifth place with 3.4% of the studies; 2.3% of the studies involve the Normalized Difference Moisture Index (NDMI), Gross Primary Production (GPP), and Normalized Burn Ratio (NBR). LAI takes into account plant or canopy water content [45,46] and is useful in estimating forest density and mortality [47,48]. The remaining indicators are used in less than 2.3% of the literature reviewed.
Associated with the remote sensing approach for understanding tree mortality, in situ measurements appeared in various articles in an effort to deliver accurate information on tree mortality, e.g., related to vegetation, ground and soil data (moisture, biomass, tree diameter etc.). However, in situ measurements vary in scale, accuracy and the application of the data that is obtained at specific locations, leading to gaps in the time series [49]. This approach is mostly based on expensive and limited data collection over large areas, inducing issues with the spatial upscaling of the data.
Figure 9 exhibits the application of biotic (in situ) variables in articles pertaining to remote sensing and meteorological indicators related to tree mortality. The variable with the largest share (15%) is the Diameter at Breast Height (DBH), portraying the available growing, basal area, biomass and carbon stock [50], followed by Tree Ring Width (TRW; 12%). Basal Area Increment (BAI), ranked in third place (8%), has been found to exhibit a strong connection to tree mortality [51]. Water potential of xylem, leaf or soil was used in 4% of the papers reviewed as a robust indicator to monitor the response of plants to drought events; this indicator depicts the movement of water, for instance, from roots to leaves, identifying critical levels or thresholds characterizing the vulnerability of forest biomes to droughts [52]. Other indicators are reported in less than 4% of the papers reviewed.
Abiotic indicators have an essential role in the analysis and characterization of tree mortality. As shown in Figure 9, the majority of studies utilize the meteorological drought indicator SPEI in roughly 15% of the cases. SPEI is a useful indicator in dry regions with high temperatures suffering from water losses through evapotranspiration [53]. The SPEI and SPI indicators are generally similar, with their basic difference being that SPI does not include temperature [54]. Topographic factors, such as PDSI and vapor pressure deficit (VPD), were represented in 4% of the cases. PDSI can monitor the influence on tree growth by assessing the combined effects of both temperature and precipitation [55], while VPD, as an indicator to monitor plant water stress, is linked to stomatal water loss and carbon fixation during photosynthesis [56,57]. Lastly, indicators such as PET, SPI, ET, scPDSI, P-PET, and AET are used in less than 4% of studies each.

3.6. Documented Cases of Drought and/or Heat-Induced Forest Mortality across Biomes

Most papers on drought and/or heat-induced forest mortality have been produced for the Mediterranean Forests, Woodlands and Scrub biome from the Mediterranean Basin and California (43 cases, see Figure 10). California, known for its diverse landscapes and rich biodiversity, is facing a severe crisis of tree mortality, especially in its Mediterranean Forests, Woodlands and Scrub biome, as detailed in 28 publications. An immediate impact is noted in conifer species (13 cases), such as pines or oaks. Considering this aspect, with 17 publications documenting this issue in Spain, too, ten of them were found to refer to conifers.
The Temperate Broadleaf and Mixed Forests biome exhibits a large share of publications, mostly from Central Europe, Eastern USA, and Eastern Asia/China, with 59 publications (Table 2). Extensive interest was demonstrated in evergreen-dominated ecosystems of the Temperate Conifer Forests biome (52 cases). Tree mortality in the exceptional biodiversity of Tropical and Subtropical Moist Broadleaf Forests has been explored in 25 publications. The Boreal Forests or Taiga, known for their resilience in cold climates and distinct coniferous forests, are represented in 20 publications.
Temperate Grasslands, Savannas and Shrublands, important for their diverse plant communities, were covered in 17 publications. Crucial for understanding the adaptation to arid conditions, the Deserts and Xeric Shrublands biome account for eight publications. Tropical and Subtropical Grasslands, Savannas and Scrublands are documented in six publications. The Tundra, characterized by its cold and almost treeless coverage expanses, and Tropical and Subtropical Coniferous Forests are each featured in two publications. This varied distribution highlights the unique ecological characteristics and research challenges of each biome.

3.7. Thematic Foci Analysis of the Remote Sensing and Meteorological Monitoring

The reviewed works were categorized on the basis of two methodological approaches: “remote sensing” and “meteorological ground-based”. We classified 254 publications using these two methods and, further on, into specific subgroups (Figure 11). Some research publications focused on two or three types of methods/indicators/research focus. For instance, in the remote sensing methods classification, the water response of trees related to stem and leaves moisture content is monitored through NDWI, Vegetation Optical Depth (VOD), Normalized Difference Infrared Index (NDII), Canopy Water Content (CWC), Relative Water Content (RWC), and Normalized Difference Moisture Index (NDMI) [59], thus categorized within the Water Content group. For the comprehensive list of all indicators used in this article, the reader is referred to Supplementary Materials S3.

3.7.1. Remote Sensing Sphere

The majority of the reviewed studies (81.1%) have based their analysis on applying remote sensing methods. The most prevalent subcategory within this group is the monitoring of the chlorophyll content in the canopy, thus indicating the level of photosynthetic activity or “greenness” (27%). High chlorophyll levels enable trees to produce the energy they need for growth through photosynthesis. Chlorophyll levels affect foliage greenness and can be used as an indicator of the trees’ water use [60]. Chlorophyll-rich foliage guarantees tree health and can be related to vulnerability and mortality rates [61]. The second larger thematic focus of the published articles was based on Random Forest Classification, analyzing stand density through optical imagery classification (11% of the cases). This method relies on high-resolution multispectral imagery in forest and heterogeneous areas to identify the occurrence and severity of tree mortality [62]. Since forest structure and tree characteristics could play a vital role in assessing mortality, some published articles apply LiDAR (11%) to monitor forest distribution [45,63]. Variations in factors such as canopy cover, tree density, and size can significantly influence a forest’s resilience to environmental stressors such as droughts. For instance, depending on their age and size, tree species exhibit differences in their recovery under various environmental stressors. Analyzing structural characteristics helps identify vulnerable forest areas and localized interventions to prevent widespread tree mortality [10]. In 9% of reviewed cases, water stress and consequent hydraulic failure were investigated using remote sensing. These indicators are very critical in understanding tree mortality patterns. Hydraulic failure occurs during prolonged dry periods, preventing the transportation of water from roots to leaves due to the collapsing of trees’ vascular system. As a result, water stress impairs the tree’s physiological functions and ability to produce leaves, leading to mortality [64]. Another 9% of the investigations focused on the role of the environment and topography on tree mortality. For example, 90% of the south-facing slopes of Mount Gokurakujisann in Hiroshima were reported to have been affected by an extreme drought event [65]. With a focus on environmental conditions, several studies highlighted the adverse impact of low soil moisture levels and the subsequent impacts on tree productivity (7% of the studies). It is an undeniable fact that soil moisture limitations affect the readiness of trees to absorb water and nutrients efficiently, impairing tree growth [66]. The cascading effects of insufficient soil moisture disrupt forest ecosystem services, wildlife, and biomass [67]. It is noteworthy that forecasting models (with a share of 6%) have been reported as a potential solution for the creation of early warning signals to protect vulnerable forest areas during periods of physiological stress and high risk of mortality [68,69].

3.7.2. Meteorological Ground-Based and In-Situ Sphere

As mentioned above, in situ methods appeared in various articles. Meteorological ground-based and in situ indicators were used in 18.9% of papers monitoring forest mortality (Figure 11). Most attention in studies was paid to tree growth (44%), impacted by warming climate and decreasing precipitation, by utilizing in situ indicators, such as TRW, DBH, and BAI. More specifically, measurements of the annual growth of trees via tree ring width provide insights into how temperature and soil moisture influence tree growth patterns [70]. Tree circumference at breast height can indicate tree size and overall tree health, which are directly tied to its survival prospects [71]. Tracking BAI over time can reveal how environmental stressors affect tree size (cross-sectional area), thus shedding light on growth dynamics [72]. Various studies focused on water responses (11% of the studies), exploring growth and resilience levels as indicators of mortality risk [73]. Recovery from water-related stressors is linked to tree resilience, providing long-term survival insights for trees [74]. By tracking the photosynthetic rate (8%) to assess physiological stress, researchers can predict potential effects on tree health, growth trends and energy production [75]. Soil moisture/water was monitored in 7% of studies, 6% focused on VPD, and 4% on low precipitation. It is noteworthy that elevated VPD can lead to physiological stress and even to high mortality risk, characterized by reduced stomatal conductance, impaired photosynthesis, and water stress [64]. SPEI and SPI indicators have been used to evaluate the spatial and temporal characteristics of drought, while Evapotranspiration (ET), AET, and PET indicators have been applied to estimate water loss resulting from soil surface evaporation and plant transpiration. In addition, extended drought conditions identified by meteorological drought indices are related to atmospheric dryness, physiological stress, and growth reduction, leading to tree mortality [76]. As a tool in the hands of forest managers aiming at preventing tree mortality, 4% of the reviewed studies focus on early warning signals. In summarizing the above, it can be noted that by utilizing remotely sensed, meteorological ground-based and in situ indicators, researchers are able to generate accurate early warning signals. The establishment of these signals contributes to the timely adoption of measures to protect the ecological functions of forest ecosystems by designing preventive measures such as targeted watering, pest control or thinning.

3.7.3. Remote Sensing and Meteorological Ground-Based Monitoring Scales

On the one hand, it was noted that 83% of the remote sensing studies focus on the forest scale. In certain instances, detailed observation of mortality is feasible using sensors like LiDAR and UAVs, but for short time series. Cluster or forest plot monitoring was performed in 8% of reviewed articles, while individual tree monitoring in 9%. On the other hand, 33% of papers using meteorological ground-based monitoring focused on individual tree mortality, as such methods could provide more accurate individual tree mortality analysis compared to the cluster or plot scale (this approach comprised 17% of the studies). Forest-scale monitoring was observed in half of meteorological ground-based studies (Figure 12).

3.8. Geographical Distribution of Tree Mortality Research

3.8.1. North America

Most tree mortality publications were recorded in North America, adding up to 100 cases. Using remote sensing, the most common tree mortality indicators/methods were founded on NDVI and classification through Landsat and MODIS satellites, coupled with the influence of topography and NDWI indicators.
California produced the highest number of tree mortality papers [77]. In the Sierra Nevada, scientists utilized the Random Forest algorithm to detect the presence and severity of tree mortality by using the multispectral satellite time series of MODIS [62] while to assess biomass and carbon emissions, both meteorological ground-based indicators and remotely sensed measurements have been taken into account [78]. The PDSI indicator appeared often in the USA, analyzing long-term drought periods, thus providing a detailed soil moisture dataset, making it particularly relevant for agricultural and water resource management.

3.8.2. Europe

Half of meteorological studies focusing on European forests investigate mortality events [33,79,80,81,82,83,84,85,86,87,88,89,90,91,92,93]. The majority of studies, not only in Southern Europe but also in Northern Europe, investigate the interactions between tree growth and climatic conditions [33,79,81,82,84,85]. Tree ring width and soil variables have been linked to drought meteorological indicators, such as SPEI [83,84,86,87,93,94,95,96,97], while the MODIS satellite has been used frequently to evaluate tree growth in Mediterranean holm oak forests [98]. Drought has been found to kill trees much faster than carbon starvation [99]. Stable isotopes δ13 and δ18 have been used to access Water Use Efficiency (WUE) [81,95,100], while TRW, DBH and BAI are common indicators for growth conditions for papers from Spain [93]. In Portugal, satellite images from Sentinel-2 were utilized in order to map the damage from drought events [101]. Furthermore, NDVI has been used to investigate seasonal variations and changes in tree species phenology related to mortality events [102]. Prediction models were presented in fewer European remote sensing studies [103,104] and often focused on analyzing the hydraulic status [105,106,107,108,109,110,111,112,113,114].

3.8.3. South America

In South America, several studies focus on tree mortality in the Amazonian region, using remote sensing to monitor tree canopy loss through very high-resolution (VHR) satellite imagery [115,116,117]. Remote sensing studies from this continent utilize high-resolution imagery from Landsat, Planet Dove, and airborne LiDAR to detect tree loss and plant biomass, which is responsible for carbon emissions [68,116,118,119].
In South America, there was less research interest in tree-water relations. However, the findings in the western Amazon show that water stress affected more than 70 million hectares of forest during the dry season of 2005, leading to canopy shrinkage and moisture deficit [117]. Scientists in southwestern America have also monitored consecutive droughts to assess forest response and develop early warning signals for predicting the spatial distribution of mortality [68]. NDVI was one of the most significant predictor indicators under logistic regression, especially utilizing high-resolution satellite imagery [119]. In South America, few studies were recorded documenting the distribution of tree mortality.

3.8.4. Australia

In Australia, multi-year droughts have been observed. These have triggered widespread eucalyptus, as well as Pine and Fir mortality. The majority of studies focused on changes in tree structure and canopy, characterizing the observable stress symptoms [120,121,122]. Fewer studies concentrate mainly on water dynamics during drought. As hydraulic failure is often experienced, stomatal control and drought tolerance traits are considered [122]. With a focus on different species responses, studies in north Adelaide in South Australia analyzed eucalyptus species, utilizing topography, solar irradiance, and airborne imagery in an effort to understand the mechanisms of drought-related tree mortality [110,123,124].

3.8.5. Asia

Gradual changes in forest cover in Asia comprise the central point in many research articles. In the Zagros Forest of Iran, a study aimed to evaluate the forest decline trend and associated factors through the application of remote sensing techniques during a six-year period between 2012–2017 [125]. In order to understand forest resilience, NDVI was used in studies focusing on stomatal and hydraulic traits between several species with growth affected by drought [95,126]. Tree growth-climate relationship has been used to evaluate the spatial distribution of affected trees [127]. Furthermore, a study in the northern Yunnan-Guizhou Plateau in southwest China investigated the response of tree growth to climate change by studying tree-ring cores [95]. With a focus on forest resilience and resistance, studies aimed to evaluate the feasibility of remotely sensed vegetation/drought indicators through comparisons of meteorological indicators [102]. Zang et al. [128] proposed and compared vegetation indicators to detect the early dying process of the damaged trees.

4. Discussion

4.1. Limitations of Review Methodology

In this review, the focus was placed on the applications of meteorological ground-based and remote sensing methods on forest tree mortality. An initial search in meteorological-related publications utilized keywords relevant to meteorology, drought and mortality. Our Web of Science search returned more than 18,000 results. In view of this, we worked with several combinations to reduce the results to about 1000. Eliminating meteorological articles that did not report on meteorological indicators (such as PDSI, SPEI etc.) or detailed meteorological analysis resulted in a reduced number of articles. In both the meteorology and remote sensing approaches, we excluded articles that mentioned tree mortality in non-forest areas, insects or pests pathogens, fire or beetle grazing or pasture or harvesting and cutting. Lastly, it is worth noting the date of accession of Web of Science, namely 16 October 2023, as this affects the final number of results.

4.2. Discussion of the Review Results

This review represents the first comprehensive examination of forest tree mortality that combines remote sensing and meteorological ground-based approaches, identifying research gaps and highlighting the increasing trend due to the availability of open high-resolution satellite data [129,130]. A noticeable increase in the number of publications addressing tree mortality was observed since 2010 on a global scale. Most of the studies are concentrated in North America, followed by Europe. Notably, South America and Africa have received less attention regarding remote sensing and meteorological monitoring studies. A key observation is that the timeframe length of European tree mortality studies is generally limited (10.3 years). Only six studies in Portugal, Hungary and Spain have utilized a remote sensing approach to investigate tree mortality over a period exceeding 25 years. However, none of them conducted a holistic analysis comparing remotely sensed and meteorological drought indicators. Only one Spanish study combined five remotely sensed indicators with the drought meteorological indicator SPEI, utilizing 30 m Landsat spatial resolution [104,114]. This study concluded that there is no significant relationship between land surface phenology and dieback. Nonetheless, wetness indicators showed greater responses than vegetation indicators, suggesting a potential early warning signal of tree mortality. Among the studies with the longest timeframes (35 years or more) are those in Tanzania (39 years), Canada (36 years), Spain (36 years), China (35 years), North America/California (35 years), and North America/Montana (35 years). However, only one case in California analyzed tree mortality using meteorological drought indicators such as PDSI, SPI, and SPEI, along with only two remotely sensed indicators, namely, NDVI and NDMI [131].
Following this analysis, the discussion turns briefly to the spatial resolution utilized. The most used spatial resolution ranges between 10 m to 100 m and 100 m to 1000 m. Most of the studies with a timeframe of 25 years are conducted on a local scale (18 studies). Long-term studies in Europe did not comprehensively monitor tree mortality, especially in specific species, such as pine and oak. Consecutively, most studies rely on optical sensors, particularly Landsat and MODIS, followed by LiDAR, which is an active sensor.

4.3. Analysis of Tree Mortality Indicators

There is an obvious trend favoring the use of remote sensing approaches, as visualized in Figure 8. The studies show an increasing interest in NDVI, optical imagery/classification and EVI as tools for assessing tree mortality, followed by the NDWI indicator. In 28% of the studies, NDVI is utilized to assess forest resilience and evaluate vegetation activity in response to climatic circumstances [132]. Despite this, the classification technique (used in 9% of the cases) is adopted to detect the presence and severity of tree mortality [68]. Moreover, almost 6% of studies employ the EVI indicator to explore the connection between tree mortality and land surface phenology [104].
Beyond remote sensing, in situ biotic observations can provide accurate measurements (i.e., tree height and biomass) but are generally limited to smaller study areas due to monitoring constraints. As shown in the studies, the most common method is the DBH (15% of studies), which documents smaller diameter trees (stems 0–10 cm diameter) under extreme climatic circumstances [133]. Equally important is the TRW (12% of studies), which investigates the relationship between growth and climate [93], followed by BAI (8% of studies), which helps in understanding the growth and metabolic trend of trees.
Meteorological ground-based abiotic observations often use the SPEI indicator (15% of the cases) as a pivotal tool to understand the causes of tree mortality. Topographic parameters evident with a 4% share provide valuable insights on landscape characteristics. PDSI is another key indicator that estimates relative dryness by considering temperature and precipitation in 4% of the studies. It is important to note that, with a 4% share, VPD appears in research publications, monitoring transpiration and assessing the potential for further tree decline under drought.

4.4. Applicability and Research Gaps in Monitoring Tree Mortality

Regarding the application of tree mortality assessment of the two methods discussed in this review, it was found that remote sensing studies have a clear advantage in the spatiotemporal monitoring of tree mortality through a comparative analysis of satellite image changes, while meteorological studies focus on growth and physiological responses. Still, the applicability of the above approaches is limited, and as a result, the following gaps should be borne in mind:
  • It is evident that some continents have a limited representation in their thematic foci and the application of indicators. Specifically, the analysis of remotely sensed thematic foci in Europe lacks detailed water response. There is a notable lack of European tree mortality research utilizing indicators like NDWI and SAVI despite considerable interest. Furthermore, the LAI indicator is notably absent, except in studies from France and Spain. Additionally, Oceania shows a deficiency in remotely sensed indicators such as NDWI and LAI. Topographic variables are also poorly investigated in remote sensing studies. In the Mediterranean, elevation or slope are not comprehensively utilized.
  • Meteorological drought indicators provide a substantial amount of information on tree mortality time series, which exhibit considerable variation. Specifically, the PDSI drought indicator is not reported in studies on Europe, Oceania, and South America. Furthermore, the most frequently used meteorological indicator, SPEI, has not been analyzed in South America and Oceania. Therefore, any comparison between meteorological and other monitoring methodologies must consider these factors in investigating tree mortality effectively and accurately.
  • There is a significant gap in understanding species-specific responses to hydraulic failure or carbon starvation. Certain regions lack literature investigating the mortality of specific tree species using remotely sensed indicators. It is important to note that due to their endemism, certain species remain beyond the scope of field studies, as evidenced by the lack of remote sensing and meteorological analyses.
  • Lastly, a critical aspect in assessing the risk of drought-induced mortality is clarifying the impact of various global biomes (Figure 10). A notable challenge and research gap remains in the elaboration of the relationship between forest resilience and biome-specific traits [62].

5. Conclusions

In this paper, we present an extensive review of studies utilizing remote sensing and meteorological monitoring for tree mortality. This review offers a global perspective of tree mortality investigations by analyzing a total of 254 publications, focusing on spatial and temporal resolution, timeframe, sensors used, methods/indicators for tree mortality, thematic foci and sensor types. The review findings are briefly summarized below in an attempt to provide answers to the research questions raised in Section 1.3:
  • Several peer-reviewed contributions have been reported since 1993. From 2009 onwards, a gradual increase is evident in tree mortality research activity. The major peak of the research activity was in 2021, with 35 publications.
  • North America is a hotspot of research in tree mortality, with a 39% share, followed by Europe (29%). Specifically, the USA (31%), Spain (7%), China (7%), Canada (4%), and Australia (4%) are the areas most frequently investigated using a remote sensing approach. Furthermore, meteorological monitoring studies are distributed as follows: USA (27%), Spain (15%), Greece, Canada, Switzerland, and Germany (6%). It is evident that certain research areas are addressed using both methods. More publications from additional regions/countries may boost tree mortality research.
  • Optical sensors are predominantly used, with Landsat and MODIS being the most popular ones, accounting for approximately 89% of the studies, followed by active sensors with around 6%. Landsat data was utilized in 31% of the studies, while MODIS data was utilized in 27%. Furthermore, LiDAR has been used in 8% of studies, and UAVs have been used in 6% of studies. Apart from this, hybrid approaches combining optical and active sensors are popular, accounting for roughly 4%.
  • Roughly 72% of the studies focused solely on the local scale, while those relying on the regional scale represent 24.5%. Global studies constituted 3.5% of the cases. Most remote sensing studies investigated tree mortality on the local scale with a timeframe of less than 25 years and with a spatial resolution of less than 100 m. Equally important is the fact that regional scale studies often utilize spatial resolutions ranging between 10 m and 100 m (8%), followed by those with a spatial resolution of 100 m to 1000 m (11.9%). In contrast, local scale studies often utilize resolutions of 0–10 m (26.4%), while resolutions of 10–100 m are evident in merely 29.5% of the studies.
  • Most remote sensing studies utilize NDVI as the primary indicator to identify tree mortality (28.2%). Subsequently, many cases utilize the classification/optical imagery methods or EVI indicator with 9% and 6.2%, respectively. The NDWI (3.6%) and LAI (3.4%) indicators were used in a significant number of studies to depict this situation. In situ biotic methods are frequently used, as well as the DBH method (15%). The TRW method is also commonly used (12%) to evaluate tree mortality. Similarly, studies assessing tree mortality focus on the role of the BAI method and tree water potential, accounting for 8% and 4% of the cases, respectively. Meteorological ground-based abiotic methods were mainly supported by the SPEI drought indicator (15%), while aspect, elevation, slope and PDSI were adopted in 4% of studies. Another crucial aspect of meteorological monitoring is the response of the VPD indicator, providing detailed information on drought events (4%).
  • Lastly, studies are classified according to their thematic foci. remote sensing studies comprise 81.1%, while meteorological studies constitute 18.9%. Within the remote sensing sphere, studies often focus on foliage greenness (27%) due to the frequent use of indicators such as NDVI and EVI. As we mentioned above, analysis of stand density (11%) is also well reported in various studies using classification methods. Additionally, canopy and tree structures are highlighted to provide a comprehensive assessment (11%). Further, the assessment of tree water content has the potential to enhance analyses of tree mortality (9%). Also, meteorological studies often focus on the growth rate and the physiological responses of trees (44%), followed by responses to water content (11%). However, other meteorology-based studies exhibit a preference for analyzing the photosynthetic rate (8%). Several studies analyze the soil water balance (7%) and air humidity (6%). Further studies emphasize precipitation (4%), evapotranspiration (4%) and forecasting (4%).
This comprehensive review provides insights into tree mortality assessment based on remotely sensed and meteorological data, offering a global perspective. The methodologies and applications used in tree mortality studies have been illustrated. The limitations and strengths of the two approaches, namely meteorological-based and remote sensing-based, have been addressed, and research gaps have been noted, encouraging the contemplation of the remaining challenges in the study of tree mortality.

Supplementary Materials

The following are available online at https://www.mdpi.com/article/10.3390/f15081357/s1, Supplementary Materials S1: Overview of reviewed publications on tree mortality; Supplementary Materials S2: Remote sensing and meteorological ground-based searching strings; Supplementary Materials S3: Thematic foci and indicators.

Author Contributions

The authors’ contributions to this paper are as follows: conceptualization, F.E.; review search, F.E.; review analysis, F.E.; methodology, F.E., S.M., F.B. and D.S.; results, F.E., S.M., F.B. and D.S.; discussion, F.E., S.M., F.B. and D.S.; resources, F.E.; data curation, F.E.; writing—original draft preparation, F.E., S.M., F.B. and D.S.; writing—review and editing, F.E., S.M., F.B., D.S. and D.H.; visualization, F.E.; supervision, F.B. and D.H.; project administration, D.H.; funding acquisition, D.H. All authors have read and agreed to the published version of the manuscript.

Funding

This research was funded by the ‘EXCELSIOR’ project (European Union’s Horizon 2020 Research and Innovation Programme), grant number “857510”.

Data Availability Statement

The source of the data used in this study is the Web of Science.

Acknowledgments

The authors acknowledge the “EXCELSIOR”: ERATOSTHENES: Excellence Research Centre for Earth Surveillance and Space-Based Monitoring of the Environment H2020 Widespread Teaming project (www.excelsior2020.eu, accessed on 1 July 2024). The “EXCELSIOR” project has received funding from the European Union’s Horizon 2020 Research and Innovation Programme under Grant Agreement No 857510 from the Government of the Republic of Cyprus through the Directorate General for the European Programmes, Coordination and Development and the Cyprus University of Technology. The authors wish to express their gratitude to the three anonymous reviewers whose comments and recommendations have led to improvements in the article.

Conflicts of Interest

The authors declare no conflicts of interest.

Abbreviations

Acronyms and Abbreviations
AETActual Evapotranspiration
AOIAreas of Interest
AVHRRAdvanced Very High-Resolution Radiometer
BAIBasal Area Increment
CHMCanopy Height Model
CWCCanopy Water Content
CWDCumulative Water Deficit
DBHDiameter at Breast Height
ETEvapotranspiration
EVIEnhanced Vegetation Index
GNDVIGreen Normalized Difference Vegetation Index
GPPGross Primary Production
LAILeaf Area Index
LiDARLight Detection and Ranging
LSTLand Surface Temperature
MODISModerate Resolution Imaging Spectroradiometer
MSAVIModified Soil Adjusted Vegetation Index
NAIPNational Agriculture Imagery Program
NBRNormalized Burn Ratio
NDIINormalized Difference Infrared Index
NDMINormalized Difference Moisture Index
NDVINormalized Difference Vegetation Index
NDWINormalized Difference Water Index
NOAANational Oceanographic and Atmospheric Administration
PARPhotosynthetically Active Radiation
PDSIPalmer Drought Severity Index
PETPotential Evapotranspiration
PLCPercentage Loss of Conductance
PHDIPalmer Hydrological Drought Index
P-PETPrecipitation minus Potential Evapotranspiration
RWCRelative Water Content
SAVISoil Adjusted Vegetation Index
SCIScience Citation Index
scPDSISelf-Calibrated Palmer Drought Severity Index
SMAPSoil Moisture Active and Passive
SPEIStandardized Precipitation-Evapotranspiration Index
SPIStandardized Precipitation Index
SWCSoil volumetric water content
TCWTasseled Cap Wetness
TRWTree Ring Width
UAVUnmanned Aerial Vehicles
VHRVery High Resolution
VODVegetation Optical Depth
VPDVapor Pressure Deficit
WUEWater Use Efficiency

References

  1. World Meteorological Organization. New Climate Predictions Increase Likelihood of Temporarily Reaching 1.5 °C in Next 5 Years. [Cited 27 December 2022]. Available online: https://wmo.int/news/media-centre/new-climate-predictions-increase-likelihood-of-temporarily-reaching-15-degc-next-5-years (accessed on 24 July 2024).
  2. Alisher Mirzabaev, J.W. Desertification. [Cited 27 December 2022]. Available online: https://www.ipcc.ch/site/assets/uploads/sites/4/2019/11/06_Chapter-3.pdf (accessed on 24 July 2024).
  3. Park Williams, A.; Allen, C.D.; Macalady, A.K.; Griffin, D.; Woodhouse, C.A.; Meko, D.M.; Swetnam, T.W.; Rauscher, S.A.; Seager, R.; Grissino-Mayer, H.D.; et al. Temperature as a potent driver of regional forest drought stress and tree mortality. Nat. Clim. Change 2012, 3, 292–297. [Google Scholar] [CrossRef]
  4. Javed, T.; Li, Y.; Feng, K.; Ayantobo, O.O.; Ahmad, S.; Chen, X.; Rashid, S.; Suon, S. Monitoring responses of vegetation phenology and productivity to extreme climatic conditions using remote sensing across different sub-regions of China. Environ. Sci. Pollut. Res. 2021, 28, 3644–3659. [Google Scholar] [CrossRef] [PubMed]
  5. Le Houérou, H.N. Rain use efficiency: A unifying concept in arid-land ecology. J. Arid. Environ. 1984, 7, 213–247. [Google Scholar] [CrossRef]
  6. Kassas, M. Desertification: A general review. J. Arid. Environ. 1995, 30, 115–128. [Google Scholar] [CrossRef]
  7. Siva Kumar, M.V.K.; Ndiang’ui, N. Climate and Land Degradation; Environmental Science and Engineering Environmental Science; Springer: Berlin, Germany; New York, NY, USA, 2007; Volume xxvi, 623p. [Google Scholar]
  8. Alibakhshi, S.; Groen, T.A.; Rautiainen, M.; Naimi, B. Remotely-Sensed Early Warning Signals of a Critical Transition in a Wetland Ecosystem. Remote Sens. 2017, 9, 352. [Google Scholar] [CrossRef]
  9. Scheffer, M.; Carpenter, S.; Foley, J.A.; Folke, C.; Walker, B. Catastrophic shifts in ecosystems. Nature 2001, 413, 591–596. [Google Scholar] [CrossRef]
  10. Allen, C.D.; Macalady, A.K.; Chenchouni, H.; Bachelet, D.; McDowell, N.; Vennetier, M.; Kitzberger, T.; Rigling, A.; Breshears, D.D.; Hogg, E.H.; et al. A global overview of drought and heat-induced tree mortality reveals emerging climate change risks for forests. For. Ecol. Manag. 2010, 259, 660–684. [Google Scholar] [CrossRef]
  11. Ma, X.; Huete, A.; Moran, S.; Ponce-Campos, G.; Eamus, D. Abrupt shifts in phenology and vegetation productivity under climate extremes. J. Geophys. Res. Biogeosci. 2015, 120, 2036–2052. [Google Scholar] [CrossRef]
  12. Workie, T.G.; Debella, H.J. Climate change and its effects on vegetation phenology across ecoregions of Ethiopia. Glob. Ecol. Conserv. 2018, 13, e00366. [Google Scholar] [CrossRef]
  13. Gustafson, E.J.; Sturtevant, B.R. Modeling Forest Mortality Caused by Drought Stress: Implications for Climate Change. Ecosystems 2013, 16, 60–74. [Google Scholar] [CrossRef]
  14. Muller, C.L.; Chapman, L.; Grimmond, C.S.B.; Young, D.T.; Cai, X. Sensors and the city: A review of urban meteorological networks. Int. J. Climatol. 2013, 33, 1585–1600. [Google Scholar] [CrossRef]
  15. Pijl, A.; Quarella, E.; Vogel, T.A.; D’agostino, V.; Tarolli, P. Remote sensing vs. field-based monitoring of agricultural terrace degradation. Int. Soil Water Conserv. Res. 2021, 9, 1–10. [Google Scholar] [CrossRef]
  16. Van Oevelen, P.J. Soil moisture variability: A comparison between detailed field measurements and remote sensing measurement techniques. Hydrol. Sci. J.-J. Des Sci. Hydrol. 1998, 43, 511–520. [Google Scholar] [CrossRef]
  17. Symeonakis, E.; Karathanasis, N.; Koukoulas, S.; Panagopoulos, G. Monitoring Sensitivity to Land Degradation and Desertification with the Environmentally Sensitive Area Index: The Case of Lesvos Island. Land Degrad. Dev. 2016, 27, 1562–1573. [Google Scholar] [CrossRef]
  18. Koehler, J.; Kuenzer, C. Forecasting Spatio-Temporal Dynamics on the Land Surface Using Earth Observation Data—A Review. Remote Sens. 2020, 12, 3513. [Google Scholar] [CrossRef]
  19. Holzwarth, S.; Thonfeld, F.; Abdullahi, S.; Asam, S.; Canova, E.D.P.; Gessner, U.; Huth, J.; Kraus, T.; Leutner, B.; Kuenzer, C. Earth Observation Based Monitoring of Forests in Germany: A Review. Remote Sens. 2020, 12, 3570. [Google Scholar] [CrossRef]
  20. Drusch, M.; Del Bello, U.; Carlier, S.; Colin, O.; Fernandez, V.; Gascon, F.; Hoersch, B.; Isola, C.; Laberinti, P.; Martimort, P.; et al. Sentinel-2: ESA’s Optical High-Resolution Mission for GMES Operational Services. Remote Sens. Environ. 2012, 120, 25–36. [Google Scholar] [CrossRef]
  21. ArchiveUE Advanced Very High Resolution Radiometer—AVHRR. Available online: https://www.usgs.gov/centers/eros/science/usgs-eros-archive-advanced-very-high-resolution-radiometer-avhrr (accessed on 24 July 2024).
  22. NASA. MODIS Moderate Resolution Imaging Spectroradiometer. Available online: https://modis.gsfc.nasa.gov/about/ (accessed on 24 July 2024).
  23. Jiao, W.; Wang, L.; McCabe, M.F. Multi-sensor remote sensing for drought characterization: Current status, opportunities and a roadmap for the future. Remote Sens. Environ. 2021, 256, 112313. [Google Scholar] [CrossRef]
  24. Sazib, N.; Mladenova, I.; Bolten, J. Leveraging the Google Earth Engine for Drought Assessment Using Global Soil Moisture Data. Remote Sens. 2018, 10, 1265. [Google Scholar] [CrossRef]
  25. Venkatappa, M.; Sasaki, N.; Han, P.; Abe, I. Impacts of droughts and floods on croplands and crop production in Southeast Asia—An application of Google Earth Engine. Sci. Total. Environ. 2021, 795, 148829. [Google Scholar] [CrossRef]
  26. Khan, R.; Gilani, H. Global drought monitoring with drought severity index (DSI) using Google Earth Engine. Theor. Appl. Clim. 2021, 146, 411–427. [Google Scholar] [CrossRef]
  27. Fiebrich, C.A.; Martinez, J.E.; Brotzge, J.A.; Basara, J.B. The Oklahoma Mesonet’s skin temperature network. J. Atmos. Ocean. Technol. 2003, 20, 1496–1504. [Google Scholar] [CrossRef]
  28. Bradley, E.; Roberts, D.; Still, C. Design of an image analysis website for phenological and meteorological monitoring. Environ. Model. Softw. 2010, 25, 107–116. [Google Scholar] [CrossRef]
  29. Grey, C.P.; Tarascon, J.M. Sustainability and in situ monitoring in battery development. Nat. Mater. 2016, 16, 45–56. [Google Scholar] [CrossRef] [PubMed]
  30. Hope, A.S.; Stow, D.A. An Analysis of Tree Mortality in Southern California Using High Spatial Resolution Remotely Sensed Spectral Radiances: A Climatic Change Scenario. Landsc. Urban Plan. 1993, 24, 87–94. [Google Scholar] [CrossRef]
  31. Phillips, O.L.; Aragão, L.E.O.C.; Lewis, S.L.; Fisher, J.B.; Lloyd, J.; López-González, G.; Malhi, Y.; Monteagudo, A.; Peacock, J.; Quesada, C.A.; et al. Drought Sensitivity of the Amazon Rainforest. Science 2009, 323, 1344–1347. [Google Scholar] [CrossRef]
  32. Liu, P. A survey of remote-sensing big data. Front. Environ. Sci. 2015, 3, 00045. [Google Scholar] [CrossRef]
  33. Etzold, S.; Ziemińska, K.; Rohner, B.; Bottero, A.; Bose, A.K.; Ruehr, N.K.; Zingg, A.; Rigling, A. One Century of Forest Monitoring Data in Switzerland Reveals Species- and Site-Specific Trends of Climate-Induced Tree Mortality. Front. Plant Sci. 2019, 10, 307. [Google Scholar] [CrossRef]
  34. Zhao, J.; Zhang, Q.; Zhu, X.; Shen, Z.; Yu, H. Drought risk assessment in China: Evaluation framework and influencing factors. Geogr. Sustain. 2020, 1, 220–228. [Google Scholar] [CrossRef]
  35. Jomsrekrayom, N.; Meena, P.; Laosuwan, T. Spatiotemporal Analysis of Vegetation Drought Variability in the Middle of the Northeast Region of Thailand Using Terra/Modis Satellite Data. Geogr. Technol. 2021, 16, 70–81. [Google Scholar] [CrossRef]
  36. Vadrevu, K.P.; Lasko, K.; Giglio, L.; Schroeder, W.; Biswas, S.; Justice, C. Trends in Vegetation fires in South and Southeast Asian Countries. Sci. Rep. 2019, 9, 7422. [Google Scholar] [CrossRef] [PubMed]
  37. Hashim, M.; Reba, N.M.; Nadzri, M.I.; Pour, A.B.; Mahmud, M.R.; Yusoff, A.R.M.; Ali, M.I.; Jaw, S.W.; Hossain, M.S. Satellite-Based Run-Off Model for Monitoring Drought in Peninsular Malaysia. Remote Sens. 2016, 8, 633. [Google Scholar] [CrossRef]
  38. Fok, H.S.; He, Q.; Chun, K.P.; Zhou, Z.; Chu, T. Application of ENSO and Drought Indices for Water Level Reconstruction and Prediction: A Case Study in the Lower Mekong River Estuary. Water 2018, 10, 58. [Google Scholar] [CrossRef]
  39. Rotjanakusol, T.; Laosuwan, T. Drought Evaluation with Ndvi-Based Standardized Vegetation Index in Lower Northeastern Region of Thailand. Geogr. Technol. 2019, 14, 118–130. [Google Scholar] [CrossRef]
  40. Le, M.-H.; Lakshmi, V.; Bolten, J.; Du Bui, D. Adequacy of Satellite-derived Precipitation Estimate for Hydrological Modeling in Vietnam Basins. J. Hydrol. 2020, 586, 124820. [Google Scholar] [CrossRef]
  41. Heine, I.; Francke, T.; Rogass, C.; Medeiros, P.H.; Bronstert, A.; Foerster, S. Monitoring Seasonal Changes in the Water Surface Areas of Reservoirs Using TerraSAR-X Time Series Data in Semiarid Northeastern Brazil. IEEE J. Sel. Top. Appl. Earth Obs. Remote Sens. 2014, 7, 3190–3199. [Google Scholar] [CrossRef]
  42. Collins, J.B.; Woodcock, C.E. Change Detection Using the Gramm-Schmidt Transformation Applied to Mapping Forest Mortality. Remote Sens. Environ. 1994, 50, 267–279. [Google Scholar] [CrossRef]
  43. Rödig, E.; Cuntz, M.; Heinke, J.; Rammig, A.; Huth, A. Spatial heterogeneity of biomass and forest structure of the Amazon rain forest: Linking remote sensing, forest modelling and field inventory. Glob. Ecol. Biogeogr. 2017, 26, 1292–1302. [Google Scholar] [CrossRef]
  44. Espírito-Santo, F.D.; Gloor, M.; Keller, M.; Malhi, Y.; Saatchi, S.; Nelson, B.; Junior, R.C.; Pereira, C.; Lloyd, J.; Frolking, S.; et al. Size and frequency of natural forest disturbances and the Amazon forest carbon balance. Nat. Commun. 2014, 5, 3434. [Google Scholar] [CrossRef]
  45. Huang, C.-Y.; Asner, G.P.; Barger, N.N.; Neff, J.C.; Floyd, M.L. Regional aboveground live carbon losses due to drought-induced tree dieback in piñon–juniper ecosystems. Remote Sens. Environ. 2010, 114, 1471–1479. [Google Scholar] [CrossRef]
  46. Anderson, L.O.; Malhi, Y.; Aragão, L.E.O.C.; Ladle, R.; Arai, E.; Barbier, N.; Phillips, O. Remote sensing detection of droughts in Amazonian forest canopies. New Phytol. 2010, 187, 733–750. [Google Scholar] [CrossRef] [PubMed]
  47. Van Gunst, K.J.; Weisberg, P.J.; Yang, J.; Fan, Y. Do denser forests have greater risk of tree mortality: A remote sensing analysis of density-dependent forest mortality. For. Ecol. Manag. 2016, 359, 19–32. [Google Scholar] [CrossRef]
  48. Longo, M.; Knox, R.G.; Levine, N.M.; Swann, A.L.S.; Medvigy, D.M.; Dietze, M.C.; Kim, Y.; Zhang, K.; Bonal, D.; Burban, B.; et al. The biophysics, ecology, and biogeochemistry of functionally diverse, vertically and horizontally heterogeneous ecosystems: The Ecosystem Demography model, version 2.2—Part 2: Model evaluation for tropical South America. Geosci. Model Dev. 2019, 12, 4347–4374. [Google Scholar] [CrossRef]
  49. Barrett, F.; McRoberts, R.E.; Tomppo, E.; Cienciala, E.; Waser, L.T. A questionnaire-based review of the operational use of remotely sensed data by national forest inventories. Remote Sens. Environ. 2016, 174, 279–289. [Google Scholar] [CrossRef]
  50. Zhou, R.; Wu, D.; Zhou, R.; Fang, L.; Zheng, X.; Lou, X. Estimation of DBH at Forest Stand Level Based on Multi-Parameters and Generalized Regression Neural Network. Forests 2019, 10, 778. [Google Scholar] [CrossRef]
  51. Dorman, M.; Svoray, T.; Perevolotsky, A.; Moshe, Y.; Sarris, D. What determines tree mortality in dry environments? a multi-perspective approach. Ecol. Appl. 2015, 25, 1054–1071. [Google Scholar] [CrossRef] [PubMed]
  52. Choat, B.; Jansen, S.; Brodribb, T.J.; Cochard, H.; Delzon, S.; Bhaskar, R.; Bucci, S.J.; Feild, T.S.; Gleason, S.M.; Hacke, U.G.; et al. Global convergence in the vulnerability of forests to drought. Nature 2012, 491, 752–755. [Google Scholar] [CrossRef] [PubMed]
  53. Tefera, A.S.; Ayoade, J.O.; Bello, N.J. Comparative analyses of SPI and SPEI as drought assessment tools in Tigray Region, Northern Ethiopia. SN Appl. Sci. 2019, 1, 1265. [Google Scholar] [CrossRef]
  54. Vicente-Serrano, S.M.; Beguería, S.; López-Moreno, J.I. A Multiscalar Drought Index Sensitive to Global Warming: The Standardized Precipitation Evapotranspiration Index. J. Clim. 2010, 23, 1696–1718. [Google Scholar] [CrossRef]
  55. Wyckoff, P.H.; Bowers, R. Response of the prairie–forest border to climate change: Impacts of increasing drought may be mitigated by increasing CO2. J. Ecol. 2010, 98, 197–208. [Google Scholar] [CrossRef]
  56. Hashimoto, H.; Dungan, J.L.; White, M.A.; Yang, F.; Michaelis, A.R.; Running, S.W.; Nemani, R.R. Satellite-based estimation of surface vapor pressure deficits using MODIS land surface temperature data. Remote Sens. Environ. 2008, 112, 142–155. [Google Scholar] [CrossRef]
  57. Broz, A.; Retallack, G.J.; Maxwell, T.M.; Silva, L.C.R. A record of vapour pressure deficit preserved in wood and soil across biomes. Sci. Rep. 2021, 11, 662. [Google Scholar] [CrossRef] [PubMed]
  58. RESOLVE Ecoregion. Available online: https://ecoregions.appspot.com/ (accessed on 24 July 2024).
  59. Gao, B.-C. NDWI—A normalized difference water index for remote sensing of vegetation liquid water from space. Remote Sens. Environ. 1996, 58, 257–266. [Google Scholar] [CrossRef]
  60. Ogaya, R.; Peñuelas, J. Tree growth, mortality, and above-ground biomass accumulation in a holm oak forest under a five-year experimental field drought. Plant Ecol. 2007, 189, 291–299. [Google Scholar] [CrossRef]
  61. Anderegg, W.R.L.; Martinez-Vilalta, J.; Cailleret, M.; Camarero, J.J.; Ewers, B.E.; Galbraith, D.; Gessler, A.; Grote, R.; Huang, C.-Y.; Levick, S.R.; et al. When a Tree Dies in the Forest: Scaling Climate-Driven Tree Mortality to Ecosystem Water and Carbon Fluxes. Ecosystems 2016, 19, 1133–1147. [Google Scholar] [CrossRef]
  62. Byer, S.; Jin, Y. Detecting Drought-Induced Tree Mortality in Sierra Nevada Forests with Time Series of Satellite Data. Remote Sens. 2017, 9, 929. [Google Scholar] [CrossRef]
  63. Stark, S.C.; Enquist, B.J.; Saleska, S.R.; Leitold, V.; Schietti, J.; Longo, M.; Alves, L.F.; Camargo, P.B.; Oliveira, R.C. Linking canopy leaf area and light environments with tree size distributions to explain Amazon forest demography. Ecol. Lett. 2015, 18, 636–645. [Google Scholar] [CrossRef] [PubMed]
  64. McDowell, N.G.; Beerling, D.J.; Breshears, D.D.; Fisher, R.A.; Raffa, K.F.; Stitt, M. The interdependence of mechanisms underlying climate-driven vegetation mortality. Trends Ecol. Evol. 2011, 26, 523–532. [Google Scholar] [CrossRef]
  65. Shan, Y.; Izuta, T.; Totsuka, T. Phenological disorder induced by atmospheric nitrogen deposition: Original causes of pine forest decline over Japan. Part I. Phenological disorder, cold death of apical shoots of red pine subjected to combined exposures of simulated acid rain and soil acidification, and implications for forest decline. Water Air. Soil Pollut. 2000, 117, 191–203. [Google Scholar]
  66. Lawrence, D.M.; Slingo, J.M. Weak land–atmosphere coupling strength in HadAM3: The Role of Soil Moisture Variability. J. Hydrometeorol. 2005, 6, 670–680. [Google Scholar] [CrossRef]
  67. Fritts, H.C. Tree Rings and Climate. Sci. Am. 1972, 226, 92. [Google Scholar] [CrossRef]
  68. Anderegg, W.R.L.; Anderegg, L.D.L.; Huang, C. Testing early warning metrics for drought-induced tree physiological stress and mortality. Glob. Chang. Biol. 2019, 25, 2459–2469. [Google Scholar] [CrossRef] [PubMed]
  69. Keen, R.M.; Voelker, S.L.; Wang, S.S.; Bentz, B.J.; Goulden, M.L.; Dangerfield, C.R.; Reed, C.C.; Hood, S.M.; Csank, A.Z.; Dawson, T.E.; et al. Changes in tree drought sensitivity provided early warning signals to the California drought and forest mortality event. Glob. Chang. Biol. 2022, 28, 1119–1132. [Google Scholar] [CrossRef] [PubMed]
  70. Kunstler, G.; Coomes, D.A.; Canham, C.D. Size-dependence of growth and mortality influence the shade tolerance of trees in a lowland temperate rain forest. J. Ecol. 2009, 97, 685–695. [Google Scholar] [CrossRef]
  71. Linares, J.C.; Camarero, J.J. Growth patterns and sensitivity to climate predict silver fir decline in the Spanish Pyrenees. Eur. J. For. Res. 2012, 131, 1001–1012. [Google Scholar] [CrossRef]
  72. McDowell, N.; Pockman, W.T.; Allen, C.D.; Breshears, D.D.; Cobb, N.; Kolb, T.; Plaut, J.; Sperry, J.; West, A.; Williams, D.G.; et al. Mechanisms of plant survival and mortality during drought: Why do some plants survive while others succumb to drought? New Phytol. 2008, 178, 719–739. [Google Scholar] [CrossRef] [PubMed]
  73. Olano, J.M.; Brito, P.; González-Rodríguez, M.; Martín-Esquivel, J.L.; García-Hidalgo, M.; Rozas, V. Thirsty peaks: Drought events drive keystone shrub decline in an oceanic island mountain. Biol. Conserv. 2017, 215, 99–106. [Google Scholar] [CrossRef]
  74. Cherubini, P.; Battipaglia, G.; Innes, J.L. Tree Vitality and Forest Health: Can Tree-Ring Stable Isotopes Be Used as Indicators? Curr. For. Rep. 2021, 7, 69–80. [Google Scholar] [CrossRef]
  75. Zhang, Y.; Zhang, Y.; Lian, X.; Zheng, Z.; Zhao, G.; Zhang, T.; Xu, M.; Huang, K.; Chen, N.; Li, J.; et al. Enhanced dominance of soil moisture stress on vegetation growth in Eurasian drylands. Natl. Sci. Rev. 2023, 10, nwad108. [Google Scholar] [CrossRef]
  76. Kharuk, V.; Im, S.T.; Dvinskaya, M.L.; Golukov, A.S.; Ranson, K.J. Climate-induced mortality of spruce stands in Belarus. Environ. Res. Lett. 2015, 10, 125006. [Google Scholar] [CrossRef]
  77. Szép, I.J.; Mika, J.; Dunkel, Z. Palmer drought severity index as soil moisture indicator:: Physical interpretation, statistical behaviour and relation to global climate. Phys. Chem. Earth 2005, 30, 231–243. [Google Scholar] [CrossRef]
  78. Weisberg, P.J.; Dilts, T.E.; Baughman, O.W.; Meyer, S.E.; Leger, E.A.; Van Gunst, K.J.; Cleeves, L. Development of remote sensing indicators for mapping episodic die-off of an invasive annual grass (Bromus tectorum) from the Landsat archive. Ecol. Indic. 2017, 79, 173–181. [Google Scholar] [CrossRef]
  79. Bat-Enerel, B.; Weigel, R.; Leuschner, C. Changes in the Thermal and Hydrometeorological Forest Growth Climate during 1948–2017 in Northern Germany. Front. For. Glob. Chang. 2022, 5, 830977. [Google Scholar] [CrossRef]
  80. Csilléry, K.; Kunstler, G.; Courbaud, B.; Allard, D.; Lassègues, P.; Haslinger, K.; Gardiner, B. Coupled effects of wind-storms and drought on tree mortality across 115 forest stands from the Western Alps and the Jura mountains. Glob. Chang. Biol. 2017, 23, 5092–5107. [Google Scholar] [CrossRef] [PubMed]
  81. Helama, S.; Läänelaid, A.; Raisio, J.; Mäkelä, H.M.; Hilasvuori, E.; Jungner, H.; Sonninen, E. Oak decline analyzed using intraannual radial growth indices, δ13C series and climate data from a rural hemiboreal landscape in southwesternmost Finland. Environ. Monit. Assess. 2014, 186, 4697–4708. [Google Scholar] [CrossRef]
  82. Helama, S.; Sohar, K.; Läänelaid, A.; Mäkelä, H.M.; Raisio, J. Oak Decline as Illustrated Through Plant–Climate Interactions Near the Northern Edge of Species Range. Bot. Rev. 2016, 82, 1–23. [Google Scholar] [CrossRef]
  83. Merlin, M.; Perot, T.; Perret, S.; Korboulewsky, N.; Vallet, P. Effects of stand composition and tree size on resistance and resilience to drought in sessile oak and Scots pine. For. Ecol. Manag. 2015, 339, 22–33. [Google Scholar] [CrossRef]
  84. Meyer, B.F.; Buras, A.; Rammig, A.; Zang, C.S. Higher susceptibility of beech to drought in comparison to oak. Dendrochronologia 2020, 64, 125780. [Google Scholar] [CrossRef]
  85. Meyer, P.; Spînu, A.P.; Mölder, A.; Bauhus, J. Management alters drought-induced mortality patterns in European beech (Fagus sylvatica L.) forests. Plant Biol. 2022, 24, 1157–1170. [Google Scholar]
  86. Christopoulou, A.; Sazeides, C.; Fyllas, N. Size-mediated effects of climate on tree growth and mortality in Mediterranean Brutia pine forests. Sci. Total. Environ. 2022, 812, 151463. [Google Scholar] [CrossRef]
  87. Proutsos, N.; Tigkas, D. Growth Response of Endemic Black Pine Trees to Meteorological Variations and Drought Episodes in a Mediterranean Region. Atmosphere 2020, 11, 554. [Google Scholar] [CrossRef]
  88. Koulelis, P.; Fassouli, V.; Petrakis, P.; Ioannidis, K.; Alexandris, S. The impact of selected climatic factors on the growth of Greek fir on Mount Giona in mainland Greece based on tree ring analysis. Austrian J. For. Sci. 2022, 139, 9957440. [Google Scholar]
  89. Tognetti, R.; Lasserre, B.; Di Febbraro, M.; Marchetti, M. Modeling regional drought-stress indices for beech forests in Mediterranean mountains based on tree-ring data. Agric. For. Meteorol. 2019, 265, 110–120. [Google Scholar] [CrossRef]
  90. Camarero, J.J.; Gazol, A.; Sánchez-Salguero, R.; Sangüesa-Barreda, G.; Díaz-Delgado, R.; Casals, P. Dieback and mortality of junipers caused by drought: Dissimilar growth and wood isotope patterns preceding shrub death. Agric. For. Meteorol. 2020, 291, 108078. [Google Scholar] [CrossRef]
  91. Madrigal-González, J.; Ballesteros-Cánovas, J.A.; Zavala, M.A.; Morales-Molino, C.; Stoffel, M. Forest stocks control long-term climatic mortality risks in Scots pine dry-edge forests. Ecosphere 2020, 11, e03201. [Google Scholar] [CrossRef]
  92. Hereş, A.-M.; Martínez-Vilalta, J.; López, B.C. Growth patterns in relation to drought-induced mortality at two Scots pine (Pinus sylvestris L.) sites in NE Iberian Peninsula. Trees 2012, 26, 621–630. [Google Scholar] [CrossRef]
  93. Manrique-Alba, À.; Beguería, S.; Molina, A.J.; González-Sanchis, M.; Tomàs-Burguera, M.; del Campo, A.D.; Colangelo, M.; Camarero, J.J. Long-term thinning effects on tree growth, drought response and water use efficiency at two Aleppo pine plantations in Spain. Sci. Total. Environ. 2020, 728, 138536. [Google Scholar] [CrossRef] [PubMed]
  94. Rodriguez, D.R.O.; Sánchez-Salguero, R.; Hevia, A.; Granato-Souza, D.; Assis-Pereira, G.; Roig, F.A.; Tomazello-Filho, M. Long- and short-term impacts of climate and dry-season on wood traits of Cedrela fissilis Vell. in southern Brazilian Amazon. Agric. For. Meteorol. 2023, 333, 109392. [Google Scholar] [CrossRef]
  95. Zheng, W.; Gou, X.; Su, J.; Fan, H.; Yu, A.; Liu, W.; Deng, Y.; Manzanedo, R.D.; Fonti, P. Physiological and Growth Responses to Increasing Drought of an Endangered Tree Species in Southwest China. Forests 2019, 10, 514. [Google Scholar] [CrossRef]
  96. Sun, S.; Zhang, J.; Zhou, J.; Guan, C.; Lei, S.; Meng, P.; Yin, C. Long-Term Effects of Climate and Competition on Radial Growth, Recovery, and Resistance in Mongolian Pines. Front. Plant Sci. 2021, 12, 729935. [Google Scholar] [CrossRef]
  97. D’Orangeville, L.; Maxwell, J.; Kneeshaw, D.; Pederson, N.; Duchesne, L.; Logan, T.; Houle, D.; Arseneault, D.; Beier, C.M.; Bishop, D.A.; et al. Drought timing and local climate determine the sensitivity of eastern temperate forests to drought. Glob. Chang. Biol. 2018, 24, 2339–2351. [Google Scholar] [CrossRef] [PubMed]
  98. Ogaya, R.; Barbeta, A.; Başnou, C.; Peñuelas, J. Satellite data as indicators of tree biomass growth and forest dieback in a Mediterranean holm oak forest. Ann. For. Sci. 2014, 72, 135–144. [Google Scholar] [CrossRef]
  99. Rowland, L.; da Costa, A.C.L.; Galbraith, D.R.; Oliveira, R.S.; Binks, O.J.; Oliveira, A.A.R.; Pullen, A.M.; Doughty, C.E.; Metcalfe, D.B.; Vasconcelos, S.S.; et al. Death from drought in tropical forests is triggered by hydraulics not carbon starvation. Nature 2015, 528, 119–122. [Google Scholar] [CrossRef] [PubMed]
  100. López, R.; Cano, F.J.; Rodríguez-Calcerrada, J.; Sangüesa-Barreda, G.; Gazol, A.; Camarero, J.J.; Rozenberg, P.; Gil, L. Tree-ring density and carbon isotope composition are early-warning signals of drought-induced mortality in the drought tolerant Canary Island pine. Agric. For. Meteorol. 2021, 310, 108634. [Google Scholar] [CrossRef]
  101. Catalão, J.; Navarro, A.; Calvão, J. Mapping Cork Oak Mortality Using Multitemporal High-Resolution Satellite Imagery. Remote Sens. 2022, 14, 2750. [Google Scholar] [CrossRef]
  102. Chang, C.-T.; Wang, H.-C.; Huang, C.-Y. Assessment of MODIS-derived indices (2001–2013) to drought across Taiwan’s forests. Int. J. Biometeorol. 2018, 62, 809–822. [Google Scholar] [CrossRef] [PubMed]
  103. Moreno-Fernández, D.; Viana-Soto, A.; Camarero, J.J.; Zavala, M.A.; Tijerín, J.; García, M. Using spectral indices as early warning signals of forest dieback: The case of drought-prone Pinus pinaster forests. Sci. Total. Environ. 2021, 793, 148578. [Google Scholar] [CrossRef] [PubMed]
  104. Haberstroh, S.; Werner, C.; Grün, M.; Kreuzwieser, J.; Seifert, T.; Schindler, D.; Christen, A. Central European 2018 hot drought shifts scots pine forest to its tipping point. Plant Biol. 2022, 24, 1186–1197. [Google Scholar] [CrossRef]
  105. Castellaneta, M.; Rita, A.; Camarero, J.J.; Colangelo, M.; Ripullone, F. Declines in canopy greenness and tree growth are caused by combined climate extremes during drought-induced dieback. Sci. Total. Environ. 2022, 813, 152666. [Google Scholar] [CrossRef]
  106. Stoyanova, J.S.; Georgiev, C.G.; Neytchev, P.N. Drought Monitoring in Terms of Evapotranspiration Based on Satellite Data from Meteosat in Areas of Strong Land-Atmosphere Coupling. Land 2023, 12, 240. [Google Scholar] [CrossRef]
  107. Móricz, N.; Garamszegi, B.; Rasztovits, E.; Bidló, A.; Horváth, A.; Jagicza, A.; Illés, G.; Vekerdy, Z.; Somogyi, Z.; Gálos, B. Recent Drought-Induced Vitality Decline of Black Pine (Pinus nigra Arn.) in South-West HungaryIs This Drought-Resistant Species under Threat by Climate Change? Forests 2018, 9, 414. [Google Scholar] [CrossRef]
  108. Marusig, D.; Petruzzellis, F.; Tomasella, M.; Napolitano, R.; Altobelli, A.; Nardini, A. Correlation of Field-Measured and Remotely Sensed Plant Water Status as a Tool to Monitor the Risk of Drought-Induced Forest Decline. Forests 2020, 11, 77. [Google Scholar] [CrossRef]
  109. Lewińska, K.E.; Ivits, E.; Schardt, M.; Zebisch, M. Drought Impact on Phenology and Green Biomass Production of Alpine Mountain Forest—Case Study of South Tyrol 2001–2012 Inspected with MODIS Time Series. Forests 2018, 9, 91. [Google Scholar] [CrossRef]
  110. Grabska, E.; Hawryło, P.; Socha, J. Continuous Detection of Small-Scale Changes in Scots Pine Dominated Stands Using Dense Sentinel-2 Time Series. Remote Sens. 2020, 12, 1298. [Google Scholar] [CrossRef]
  111. Kotlarz, J.; Nasiłowska, S.A.; Rotchimmel, K.; Kubiak, K.; Kacprzak, M. Species Diversity of Oak Stands and Its Significance for Drought Resistance. Forests 2018, 9, 126. [Google Scholar] [CrossRef]
  112. Pace, G.; Gutiérrez-Cánovas, C.; Henriques, R.; Boeing, F.; Cássio, F.; Pascoal, C. Remote sensing depicts riparian vegetation responses to water stress in a humid Atlantic region. Sci. Total. Environ. 2021, 772, 145526. [Google Scholar] [CrossRef]
  113. Moreno-Fernández, D.; Camarero, J.J.; García, M.; Lines, E.R.; Sánchez-Dávila, J.; Tijerín, J.; Valeriano, C.; Viana-Soto, A.; Zavala, M.; Ruiz-Benito, P. The Interplay of the Tree and Stand-Level Processes Mediate Drought-Induced Forest Dieback: Evidence from Complementary Remote Sensing and Tree-Ring Approaches. Ecosystems 2022, 25, 1738–1753. [Google Scholar] [CrossRef]
  114. Sturm, J.; Santos, M.J.; Schmid, B.; Damm, A. Satellite data reveal differential responses of Swiss forests to unprecedented 2018 drought. Glob. Chang. Biol. 2022, 28, 2956–2978. [Google Scholar] [CrossRef]
  115. Liu, Y.Y.; van Dijk, A.I.; Miralles, D.G.; McCabe, M.F.; Evans, J.P.; de Jeu, R.A.; Gentine, P.; Huete, A.; Parinussa, R.M.; Wang, L.; et al. Enhanced canopy growth precedes senescence in 2005 and 2010 Amazonian droughts. Remote Sens. Environ. 2018, 211, 26–37. [Google Scholar] [CrossRef]
  116. Dalagnol, R.; Wagner, F.H.; Galvão, L.S.; Streher, A.S.; Phillips, O.L.; Gloor, E.; Pugh, T.A.M.; Ometto, J.P.H.B.; Aragão, L.E.O.C. Large-scale variations in the dynamics of Amazon forest canopy gaps from airborne lidar data and opportunities for tree mortality estimates. Sci. Rep. 2021, 11, 1388. [Google Scholar] [CrossRef]
  117. Saatchi, S.; Asefi-Najafabady, S.; Malhi, Y.; Aragão, L.E.; Anderson, L.O.; Myneni, R.B.; Nemani, R. Persistent effects of a severe drought on Amazonian forest canopy. Proc. Natl. Acad. Sci. USA 2013, 110, 565–570. [Google Scholar] [CrossRef]
  118. Huertas, C.; Sabatier, D.; Derroire, G.; Ferry, B.; Jackson, T.; Pélissier, R.; Vincent, G. Mapping tree mortality rate in a tropical moist forest using multi-temporal LiDAR. Int. J. Appl. Earth Obs. Geoinf. 2022, 109, 102780. [Google Scholar] [CrossRef]
  119. Pascual, A.; Tupinambá-Simões, F.; Guerra-Hernández, J.; Bravo, F. High-resolution planet satellite imagery and multi-temporal surveys to predict risk of tree mortality in tropical eucalypt forestry. J. Environ. Manag. 2022, 310, 114804. [Google Scholar] [CrossRef] [PubMed]
  120. Asbridge, E.; Bartolo, R.; Finlayson, C.; Lucas, R.; Rogers, K.; Woodroffe, C. Assessing the distribution and drivers of mangrove dieback in Kakadu National Park, northern Australia. Estuar. Coast. Shelf Sci. 2019, 228, 106353. [Google Scholar] [CrossRef]
  121. Wentzel, J.J.; Craig, M.D.; Barber, P.A.; Hardy, G.E.S.J.; Fleming, P.A. Tuart (Eucalyptus gomphocephala) decline is not associated with other vegetation structure and composition changes. Australas. Plant Pathol. 2018, 47, 521–530. [Google Scholar] [CrossRef]
  122. Li, X.; Blackman, C.J.; Rymer, P.D.; Quintans, D.; Duursma, R.; Choat, B.; Medlyn, B.; Tissue, D.T. Xylem embolism measured retrospectively is linked to canopy dieback in natural populations of Eucalyptus piperita following drought. Tree Physiol. 2018, 38, 1193–1199. [Google Scholar] [CrossRef]
  123. Brouwers, N.; van Dongen, R.; Matusick, G.; Coops, N.; Strelein, G.; Hardy, G. Inferring drought and heat sensitivity across a Mediterranean forest region in southwest Western Australia: A comparison of approaches. For. Int. J. For. Res. 2015, 88, 454–464. [Google Scholar] [CrossRef]
  124. Evans, B.; Stone, C.; Barber, P. Linking a decade of forest decline in the south-west of Western Australia to bioclimatic change. Aust. For. 2013, 76, 164–172. [Google Scholar] [CrossRef]
  125. Gheitury, M.; Heshmati, M.; Noroozi, A.; Ahmadi, M.; Parvizi, Y. Monitoring mortality in a semiarid forest under the influence of prolonged drought in Zagros region. Int. J. Environ. Sci. Technol. 2020, 17, 4589–4600. [Google Scholar] [CrossRef]
  126. Liu, F.; Liu, H.; Xu, C.; Zhu, X.; He, W.; Qi, Y. Remotely sensed birch forest resilience against climate change in the northern China forest-steppe ecotone. Ecol. Indic. 2021, 125, 107526. [Google Scholar] [CrossRef]
  127. Peng, K.; Peng, J.; Huo, J.; Yang, L. Assessing the adaptability of alien (Larix kaempferi) and native (Pinus armandii) tree species at the Baiyunshan Mountain, central China. Ecol. Indic. 2018, 95, 108–116. [Google Scholar] [CrossRef]
  128. Zang, Z.; Wang, G.; Lin, H.; Luo, P. Developing a spectral angle based vegetation index for detecting the early dying process of Chinese fir trees. ISPRS J. Photogramm. Remote Sens. 2021, 171, 253–265. [Google Scholar] [CrossRef]
  129. Niagara On The Lake. Available online: https://landsat.gsfc.nasa.gov/article/opening-the-landsat-archive/ (accessed on 24 July 2024).
  130. USGS. Opening the Landsat Archive. [Cited 27 December 2022]. Available online: https://pubs.usgs.gov/fs/2008/3091/pdf/fs2008-3091.pdf (accessed on 24 July 2024).
  131. Goulden, M.L.; Bales, R.C. California forest die-off linked to multi-year deep soil drying in 2012–2015 drought. Nat. Geosci. 2019, 12, 632–637. [Google Scholar] [CrossRef]
  132. Tai, X.; Trugman, A.T.; Anderegg, W.R.L. Linking remotely sensed ecosystem resilience with forest mortality across the continental United States. Glob. Chang. Biol. 2022, 29, 1096–1105. [Google Scholar] [CrossRef] [PubMed]
  133. Oswald, B.P.; Dugan, S.C.; Balice, R.G.; Unger, D.R. Overstory Tree Mortality in Ponderosa Pine and Spruce-Fir Ecosystems Following a Drought in Northern New Mexico. Forests 2016, 7, 225. [Google Scholar] [CrossRef]
Figure 1. (a) Flowchart of filtering process of a final count at n = 254. (b) Outline of the initial Web of Science “topic” search using search strings.
Forests 15 01357 g001
Figure 2. Trend of tree mortality papers utilizing remote sensing alone or meteorological ground-based monitoring only (data includes studies published until October 2023).
Forests 15 01357 g002
Figure 3. Global spatial distribution of tree mortality publications applying remote sensing (a) or using meteorological ground-based indicators (b). The color shades indicate the frequency of research publications per investigated country (* French Guiana shown separately from Amazon).
Forests 15 01357 g003
Figure 4. Geographical origin of papers using meteorological ground-based drought indicators to assess tree mortality.
Forests 15 01357 g004
Figure 5. Overview of yearly publications on remote sensing and meteorological-based studies for monitoring and analyzing tree mortality.
Forests 15 01357 g005
Figure 6. The extent of study areas versus spatial resolution for publications utilizing remote sensing. The shades of blue are proportional to the scale (Local scale = dark blue, Regional scale = medium blue, Global scale = light blue).
Forests 15 01357 g006
Figure 7. Remote sensing (a) sensors and (b) sensor types utilized in the studies for tree mortality monitoring.
Forests 15 01357 g007
Figure 8. Remotely sensed biotic and abiotic indicators used for assessing tree mortality during drought events. The remaining remotely sensed indicators are gathered in the «other» category.
Forests 15 01357 g008
Figure 9. Biotic and abiotic forest components were investigated using both meteorological ground-based and in situ indicators for assessing tree mortality during drought events.
Forests 15 01357 g009
Figure 10. Hotspots of drought-induced tree mortality investigations by biomes. Symbol sizes are proportional to the total number of tree species studied per study area [58].
Forests 15 01357 g010
Figure 11. Thematic foci rely on remote sensing (right) or on ground-based (left) measurements. The numbers are rounded up.
Forests 15 01357 g011
Figure 12. Remote sensing (right) and meteorological ground-based (left) monitoring scale.
Forests 15 01357 g012
Table 1. Summary of the extracted and analyzed variables in this study.
Variables Recorded
Article code; Authors; Publication year; Article title; Journals;
Drought event; Study country; Study area; remote sensing Monitoring; Meteorology Monitoring; Starting year of investigation; Ending year of investigation; Spatial scale a; Spatial resolution (m/km); Satellite sensors; Article Focus; remote sensing Indicators; Ground-based indicators; Meteorological indicators; Statistical Analysis.
a local, regional and global.
Table 2. Summary of the number of papers per type of biome.
Type of BiomeNumber of Papers
Mediterranean Forests, Woodlands and Scrub64
Temperate Broadleaf and Mixed Forests59
Temperate Conifer Forests52
Tropical and Subtropical Moist Broadleaf Forests25
Boreal Forests/Taiga20
Temperate Grasslands, Savannas and Shrublands17
Deserts and Xeric Shrublands8
Tropical and Subtropical Grasslands, Savannas and Shrublands6
Tundra2
Tropical and Subtropical Coniferous Forests2
Disclaimer/Publisher’s Note: The statements, opinions and data contained in all publications are solely those of the individual author(s) and contributor(s) and not of MDPI and/or the editor(s). MDPI and/or the editor(s) disclaim responsibility for any injury to people or property resulting from any ideas, methods, instructions or products referred to in the content.

