Article

How Is It Covered?—A Global Perspective on Teaching Themes and Perceived Gaps and Availability of Resources in University Forestry Education

1
Faculty of Agriculture and Forestry, University of Helsinki, P.O. Box 27, FI-00014 Helsinki, Finland
2
Faculty of Educational Sciences, University of Helsinki, P.O. Box 09, FI-00014 Helsinki, Finland
*
Author to whom correspondence should be addressed.
Forests 2024, 15(8), 1360; https://doi.org/10.3390/f15081360
Submission received: 17 June 2024 / Revised: 31 July 2024 / Accepted: 1 August 2024 / Published: 3 August 2024

Abstract

:
Forest education has evolved significantly in recent decades due to global phenomena such as climate change and globalization, which are transforming the skill sets and competencies that should be provided by university-level education on forests. This evolution has placed pressure on educational institutions to adapt and meet these emerging needs. Previous research has identified gaps in the coverage of specific teaching topics within forest education, yet assessing the global state of education has been challenging because of the absence of comparable data. To address this gap, the Global Forest Education Project was initiated in 2020. The project developed a survey aimed at evaluating the state of forest education across all levels worldwide. In this study, we used data from this survey and conducted an analysis focusing on the perceived adequacy of teaching content and the availability of educational resources at the university level. The study revealed global concerns regarding the comprehensive coverage of the various teaching themes. Although there was some variation in coverage across different regions, the trends appeared to be consistent globally. The perceived availability of resources for education varied significantly by region, including factors that likely impede the ability of educational programs to modernize and meet new educational requirements. These findings indicate that there is a need to reevaluate and improve the coverage of many of the teaching themes in forest education. Moreover, it is evident that education providers in certain regions require increased funding to ensure sufficient resources to address these needs efficiently.

1. Introduction

University-level forest education has evolved significantly in recent decades as a response to climate change and globalization. These factors have affected the dynamics of how forests and other forest ecosystems function [1,2]. Changing conditions and the increasing frequency of extreme weather events are influencing what activities should be carried out in forests and how they should be managed [1,2]. This suggests a pivotal need to restructure educational programs to address these evolving challenges. Recent developments in forestry, such as the Paris Climate agreement and 2023 UN report on sustainable development goals, have underscored the growing significance of forest education as a vital element supporting numerous national and international development goals [1,2,3].
The importance of forest management for achieving the United Nations Sustainable Development Goals (SDGs) is widely recognized in many countries. Forests yield vital commodities and ecosystem services, playing a pivotal role in both society and the environment [4]. Moreover, sustainable forest management is a key strategy in countering climate change and the loss of biodiversity [5]. Forest use and management also have important social dimensions that should be recognized [3,6,7,8].
An adequate and well-trained workforce is an important component for achieving these goals [4,9,10]. In general, the level of education of forestry professionals has increased in recent times, with advanced degrees such as master’s and doctoral-level degrees becoming increasingly prevalent [11].
Forest education has traditionally had a strong link with the forest sector but has also focused on forest-related environmental issues [12]. However, the lack of emphasis on the social aspects associated with forest management is a frequent point of criticism: this can mean, for example, cultural aspects or issues involving indigenous communities or livelihoods [13,14,15,16,17]. Today, the demands on education are evolving and education systems are facing challenges to provide the necessary skills and competencies to new professionals [9,17,18]. As the amount of knowledge and skills required increases, so will the need for the training of new professionals in the sector. As a result, new professionals will increasingly have to seek university-level education [13].
Thus, forest management as a field has evolved significantly in recent decades and the knowledge and skill requirements that graduating students should master have also changed. As a result, forest education programs have been challenged to adapt to this new situation, with previous studies finding that the knowledge and skills of graduating students do not always match the needs of the workplace [9,19,20,21,22]. There are some recognized inadequacies in university-level forest education, particularly regarding the integration of social dimensions, for example, how local people use forest resources and how they would want the area to be developed. The inadequacies also include issues involving gender and ethnicity [14,23,24]. As it stands, factors like ethnicity and gender have been shown to influence the likelihood of individuals pursuing higher education in forest-related fields [6,25]. In some regions, forest education has seen substantial development to accommodate these needs, and the concept of gap analysis has been quite common in past studies. However, in this study, we mainly focused on coverage based on data collected during the global assessment [14,26].
The educational background of people working in forest-related jobs has also been shifting [27]. Trends in the number of applicants for training programs have been mixed, with some regions suffering from low applicant numbers. Globally, the number of applicants is on the rise [1,19,23,28,29]. However, disparity in educational funding is causing a lack of educational resources in certain areas, which is likely to affect the quality of the education provided [23]. In some cases, additional themes are crammed into the current curriculum. There is a pressing need to place more emphasis on curriculum development to ensure that the coursework remains relevant and adaptive to changing needs [20].
To address the aforementioned issues, the Global Forest Education Project was launched in 2020. The main objective of the project was to collect comparable global data on the state of forest education [23]. The data from this survey provide a unique opportunity to examine the state of forest education globally and across regions. The present study draws upon data from a comprehensive survey that spanned all educational levels offering forest-related training. This dataset presents a singular chance to investigate global trends in forest education [23]. This analysis continues that of Rekola and Sharik (2022) and deepens the analysis regarding teaching theme coverage and the availability of teaching resources in university-level education.
The main objective of the current study is to evaluate the perceived coverage of educational themes and the availability of educational resources in university- and college-level forest education; for simplicity, the term ‘university-level’ is used. In a similar fashion, we use the term ‘perceived coverage’, as the results are based on respondents’ perception. By coverage, we mean the extent to which the university-level education addresses sufficient skills and competences for the different educational themes and topics. The study seeks to determine if different groups of respondents, such as teachers, professionals, and students, hold differing views on the state of education across different regions, and to discuss the implications of such views and perceived differences. The research questions for this study were as follows:
  • How does the perceived coverage of educational themes vary globally and across regions?
  • Are there sufficient resources in university-level education institutions to support educational needs?
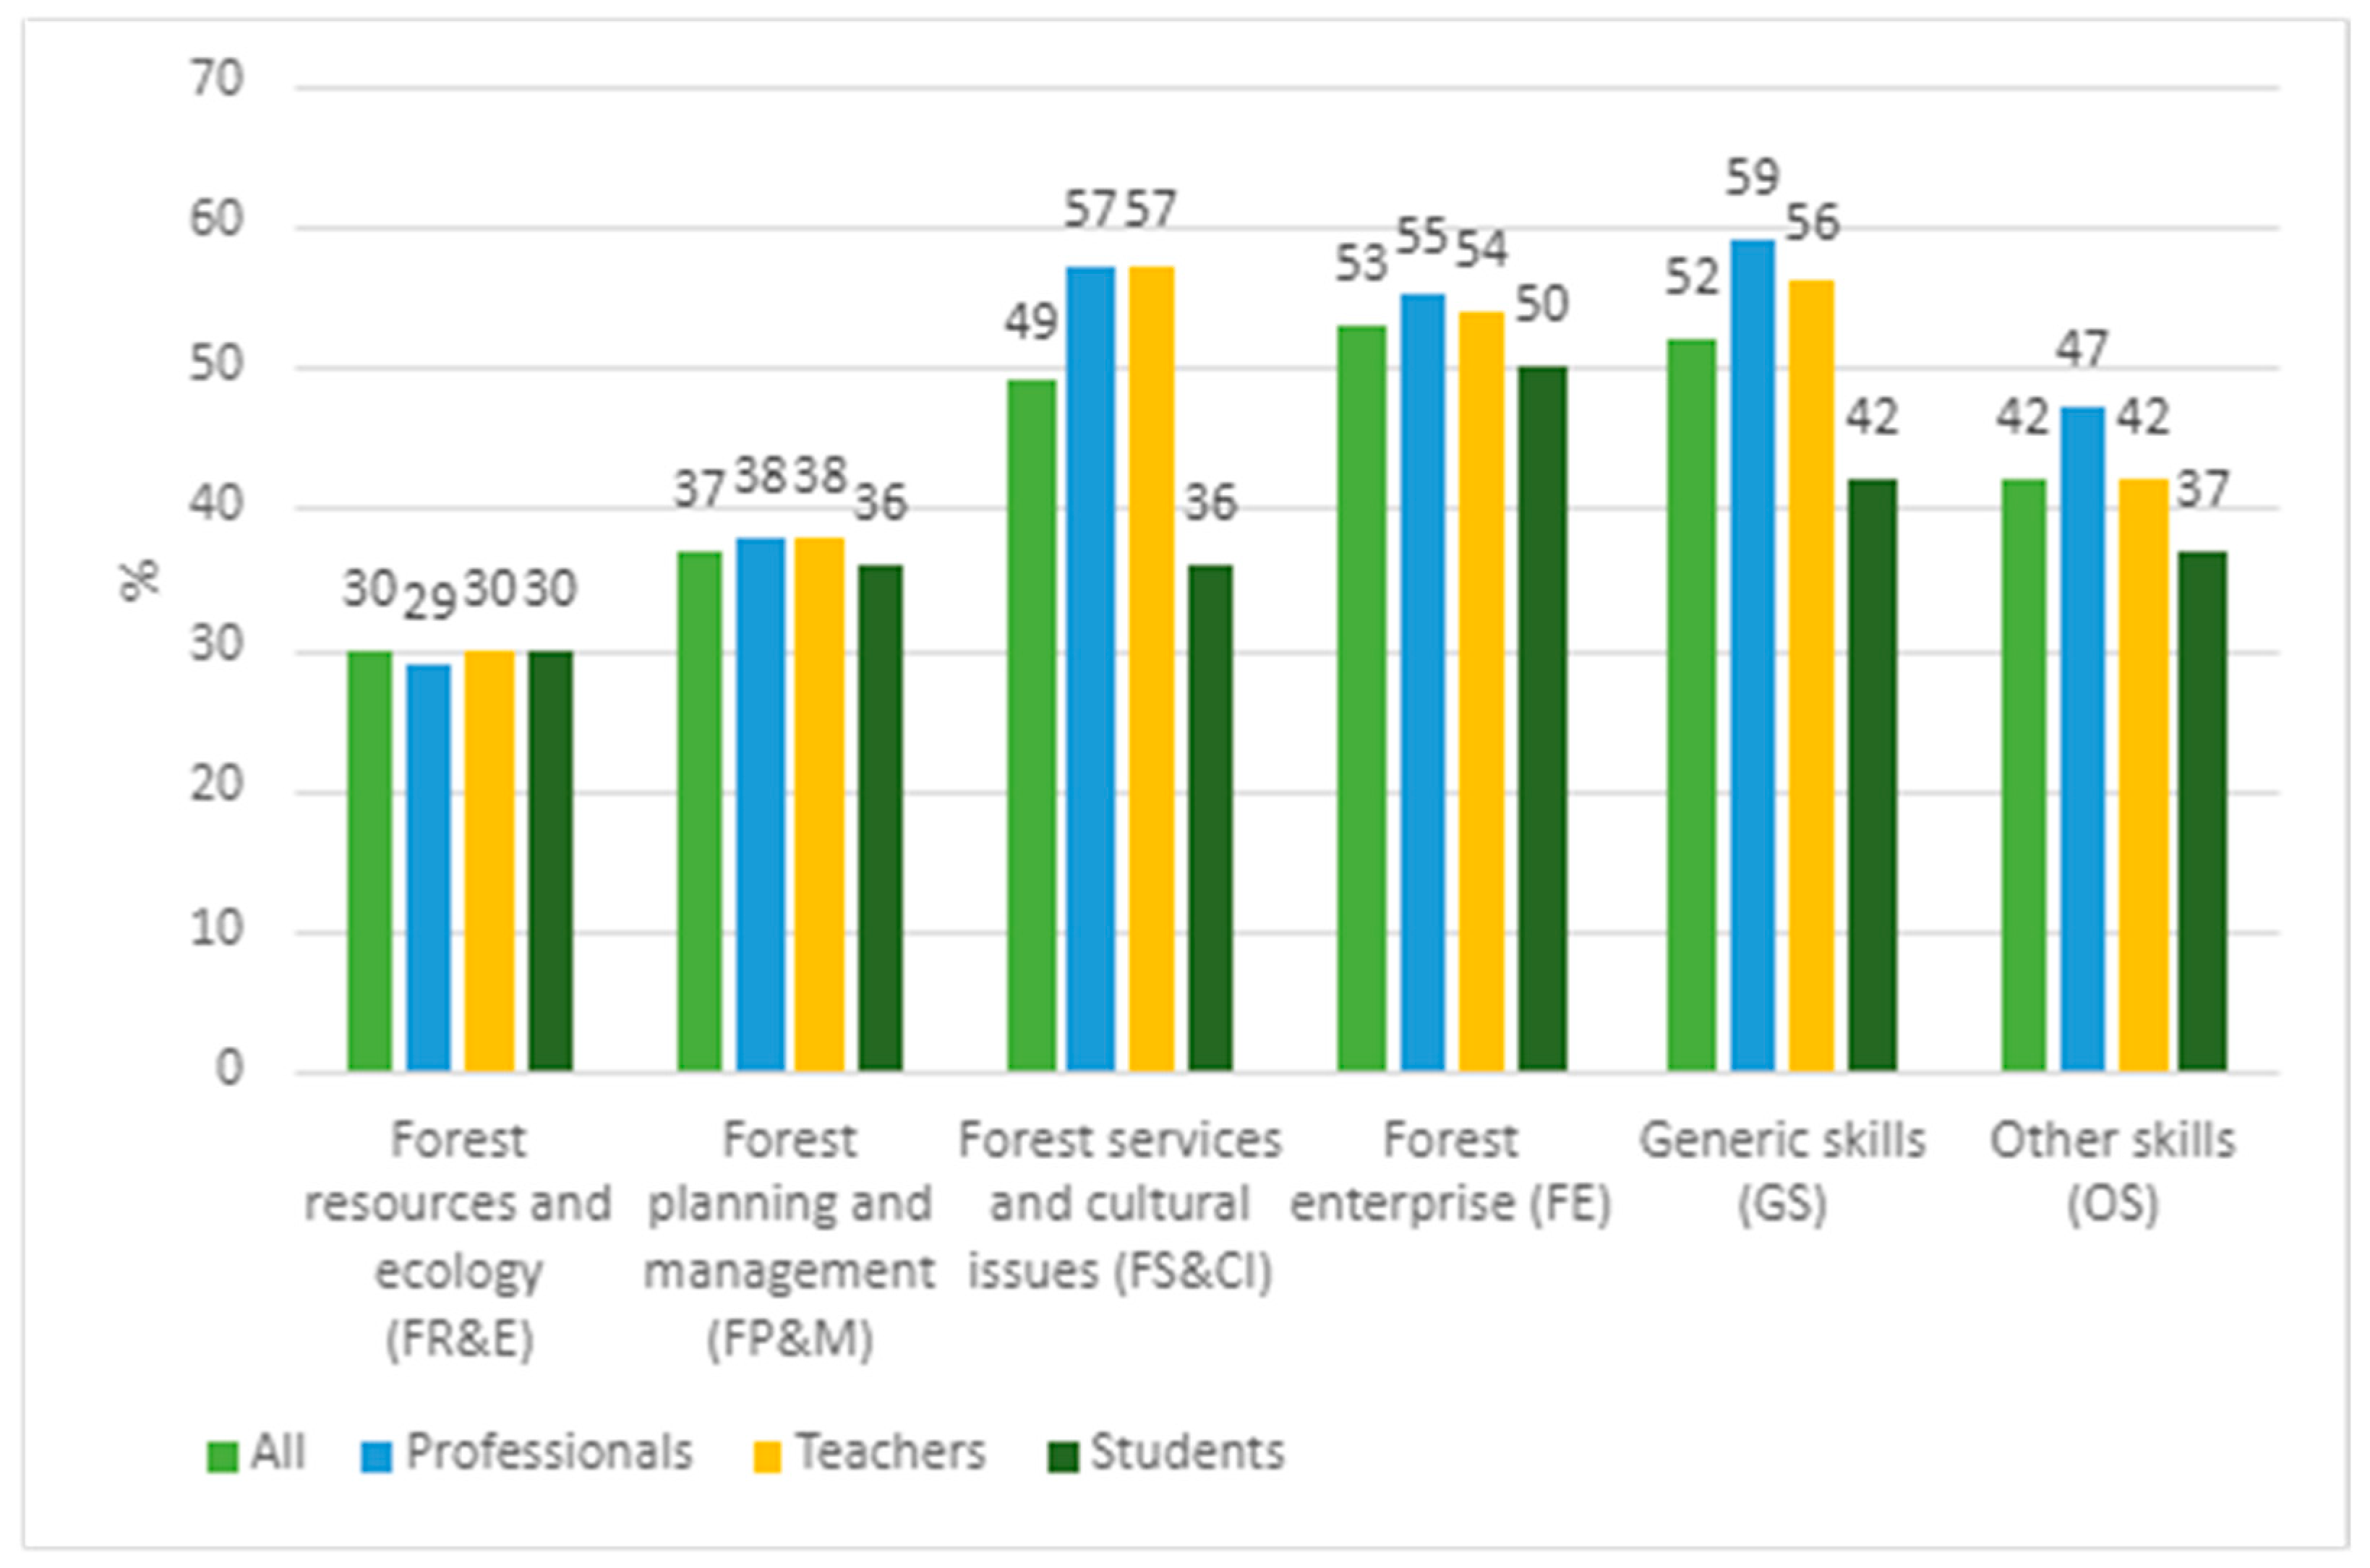
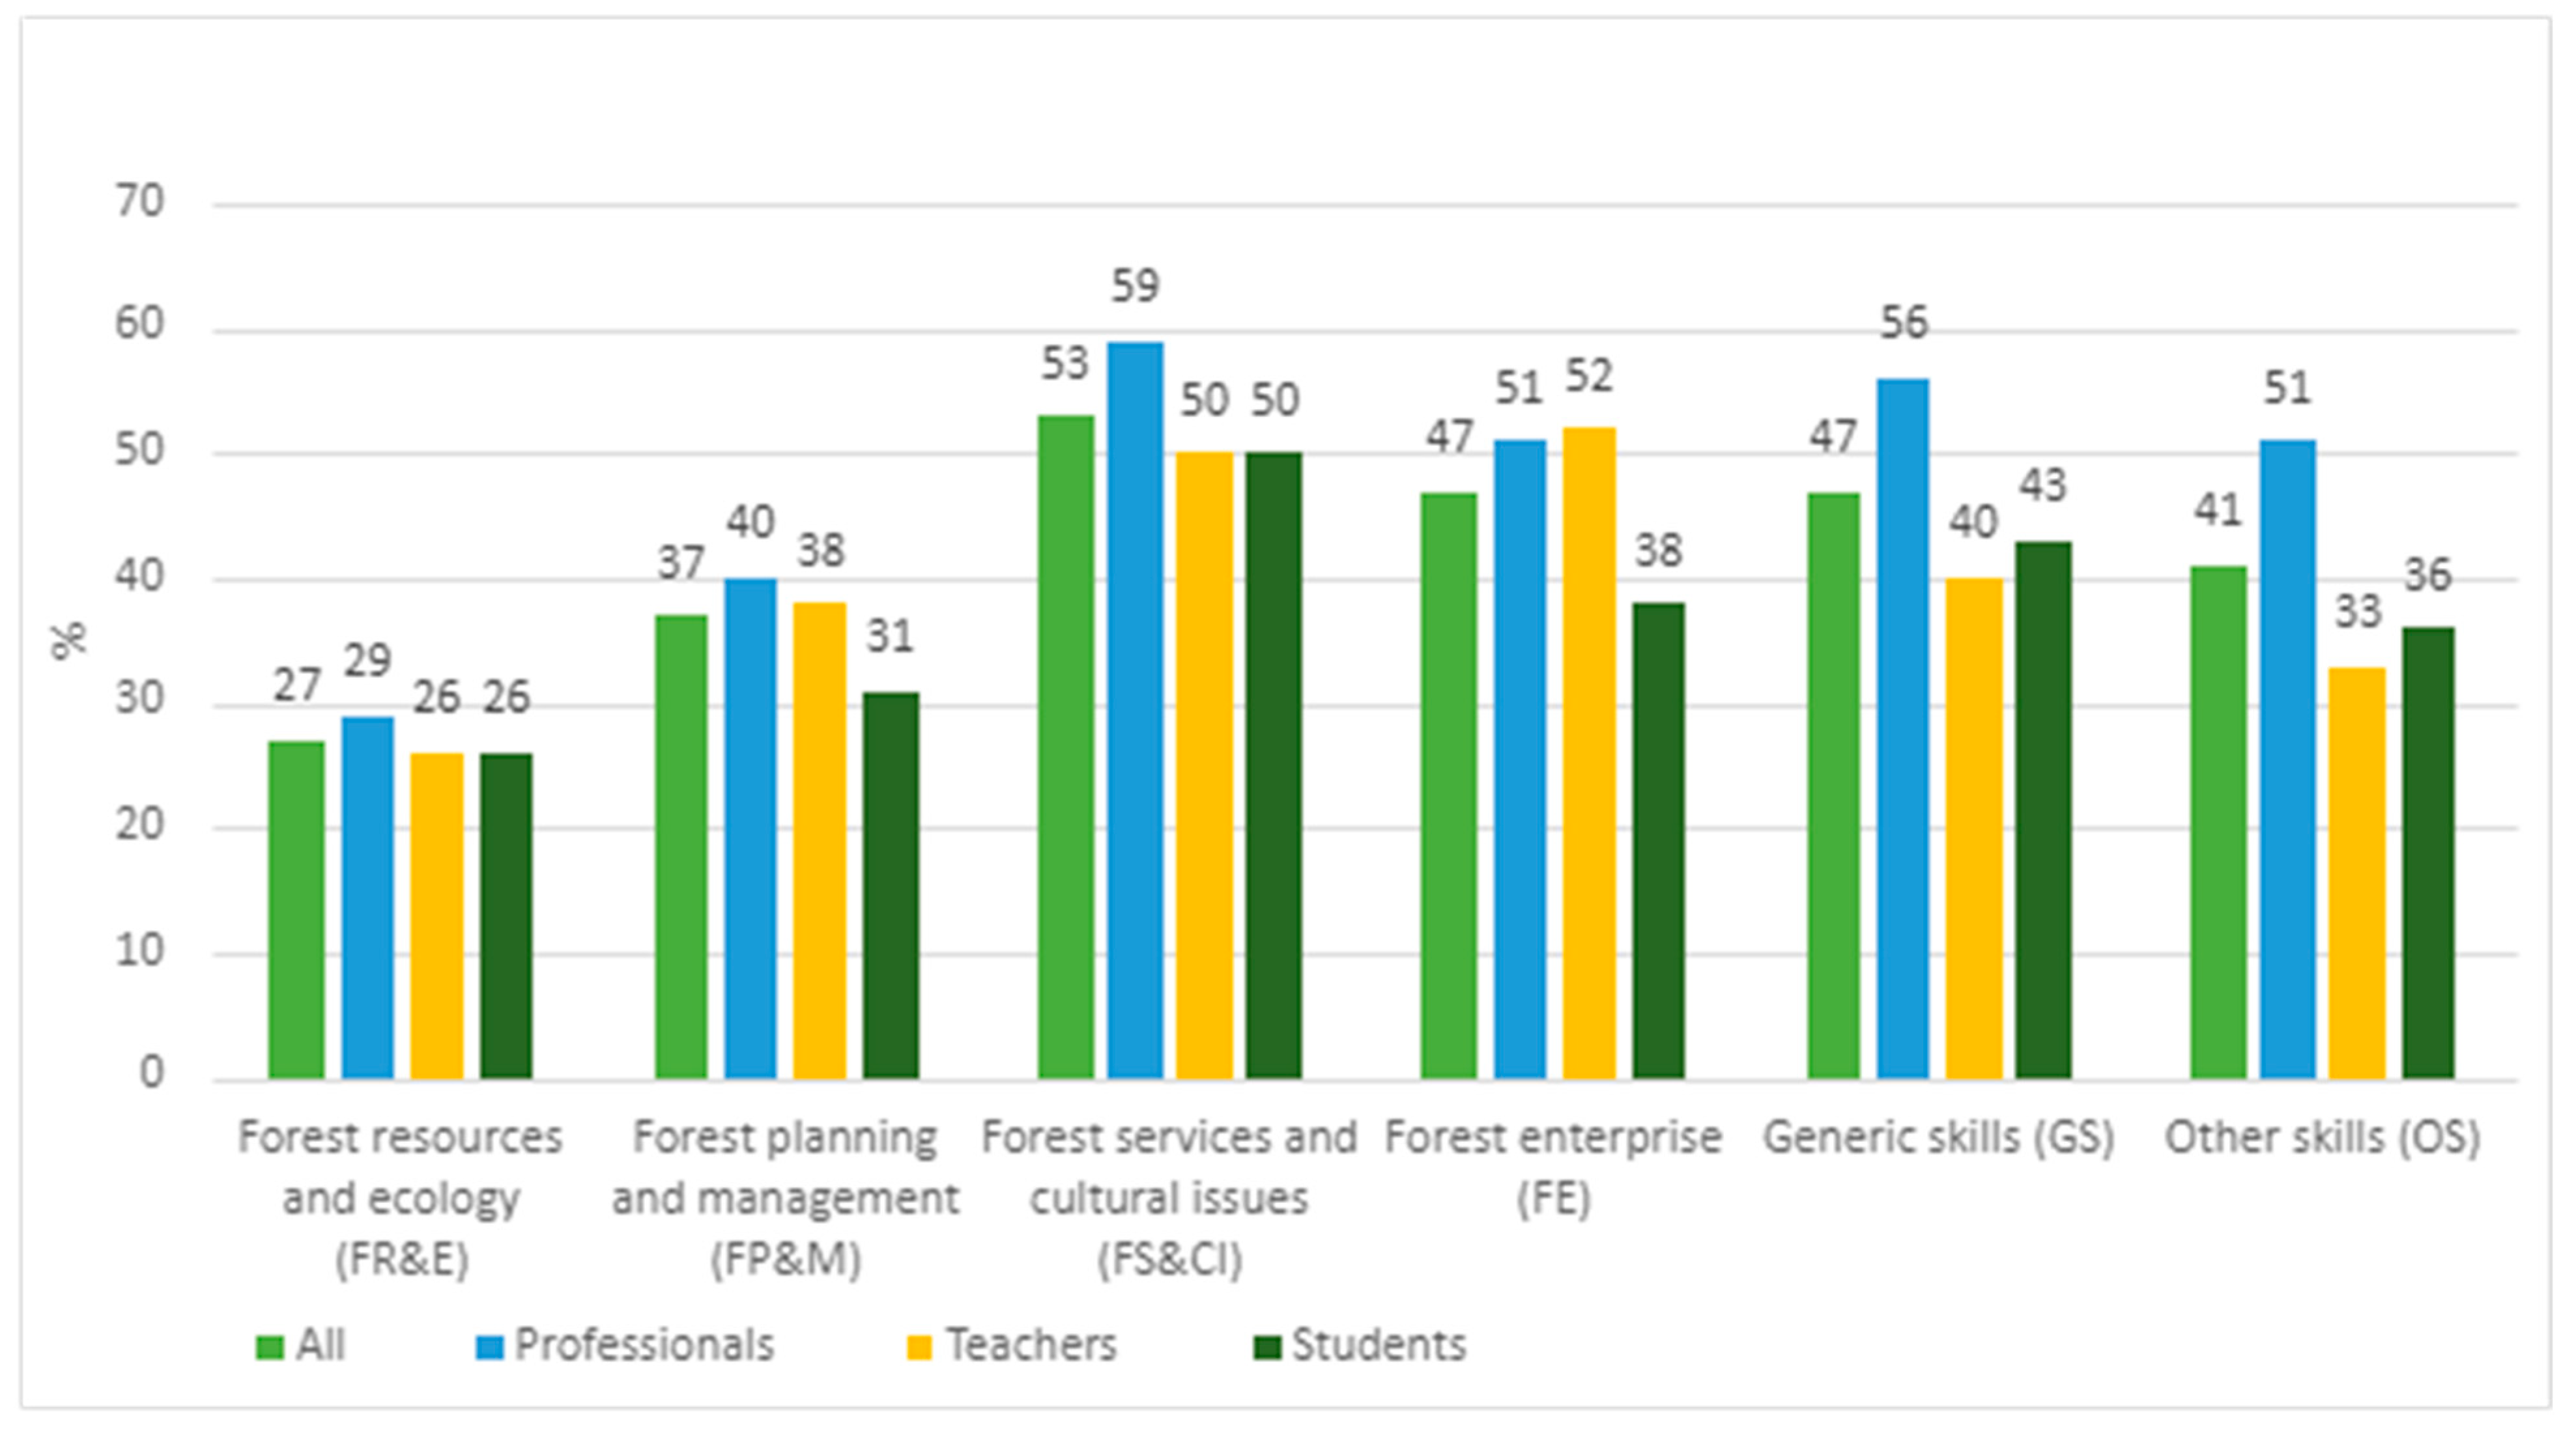
  • How does the perceived coverage vary across the respondent groups?

2. Materials and Methods

2.1. Data Collection and Survey Framework

The survey on which this study is based was conducted in 2020, funded by the German Ministry of Agriculture and Forestry and conducted under the supervision of FAO [23]. The survey covered all educational levels of education, from primary school to doctoral programs. An outline of the findings from the original survey was published by Rekola and Sharik in 2022 [23]. The survey divided the world into six different regions (Africa, Asia and the Pacific, Europe and Central Asia, Latin America and the Caribbean, Near East and North Africa and North America). This study uses the same geographical distribution and focuses solely on university-level respondents in line with its objectives; therefore, responses that did not target university-level education were excluded from the data.
The analytical framework used for the initial global survey (Figure 1) is based on initial discussions of frameworks and models related to the evaluation and effectiveness of training programs [30]. This analysis is structured around four principal categories, which are essential in examining the various facets of forest education: Needs and Demands, Teaching and Learning Activities, Resources & Supply, and Learning Experiences. This same framework informed the design of the survey questions [23].
The ‘Needs & Demands’ category defines the foundational prerequisites for education. Within this, ‘Demands’ denotes the specifics that the workplace and industry expect from educational programs. Conversely, ‘Needs’ pertains to the societal expectations and requirements of the education sector.
‘Teaching and Learning Activities’ encompasses the actual educational methods and is further divided into two subcategories: Practical Training and Theoretical Learning.
There are a variety of factors that may have an impact on the ‘Resources & Supply’ category. These include the institutions and organizations that oversee universities, programs focused on education and curriculum development, the available learning environments, teaching materials, overall funding, and the quality and availability of teaching staff. The resources are also shaped by educational needs and demands. Additionally, learning experiences are shaped by how well the teaching and learning activities meet and fulfill these educational needs and demands.

2.2. Respondents and Study Regions

In total, the part on university-level education received 3110 responses. As very few responses (n = 36) were recorded from the Near East and North Africa region, the region was excluded from the analysis. For the remaining regions, the number of responses for university-level education was 3074, and after filtering out incomplete answers, the number of responses in the data of this analysis was 2815 (Table 1). The respondents were divided into three main groups [23]. The first group is called “Professionals”. This group consists of people who worked in the private sector, government agencies and various types of organizations. The second main group of respondents was “Teachers” and the third was “Students”, which included also recent graduates. Students were asked to attribute their responses to the type of degree they were currently studying for or had already completed. Teachers, on the other hand, were primarily asked to respond to the level of degree that their own teaching was mainly focused on, and professionals were asked to respond to the degree that had the most relevance for them. Moreover, participants had the option to offer insights on multiple qualification levels when applicable.

2.3. Curriculum Themes, Topics and Educational Resources

This study examined six different teaching themes related to university-level forest education. Each of these themes had 4–14 topics and skills (Table 2). Respondents were asked to evaluate all topics and skills using the following semantic scale: 1 = inadequately covered, 2 = sufficiently covered, and 3 = excessively covered. Resources for education in the survey were split into four main categories: Teachers (quality and quantity of educators), Learning materials (e.g., textbooks, online learning materials, tools or applications), Educational environment (e.g., laboratory access, class sizes) and Practical opportunities (e.g., experiential learning, practical training, field visits). Respondents rated the availability of resources for each category using the following scale: 1 = not at all, 2 = to a limited extent, 3 = moderately, 4 = very much.

2.4. Data Analysis

The data analysis was conducted utilizing SPSS (v.29.0.2.0 (20)), Microsoft Office Excel (v. 2308), R-Studio (4.3.2 (2023-10-31 ucrt)) and R (4.4.1) software, focusing on information gathered under the Global Forest Education Project.
The teaching theme coverages and teaching resources were analyzed both on a regional and global scale. In the teaching resource comparison and when analyzing the regional results for teaching themes, different respondent groups were also utilized. To analyze regional differences, for each teaching theme, the percentage of inadequately covered responses was computed for each study region. This was performed to highlight topics that had low perceived coverage.
The original global survey used a three-point scale ({inadequately = 1, sufficiently = 2 and adequately = 3} covered) to assess the coverage of each topic. Our analysis focused on identifying which educational topics and themes were most inadequately covered. Since the scale is an ordinal scale and the responses differ in rank order, while the categories differ qualitatively, it was not meaningful to calculate averages to find which topics are less covered.
For instance, let us consider a scenario where half of the respondents perceive topic X as being insufficiently covered, while the other half view it as excessively covered. If the average response on a scale of 1 to 3 is 2, this would be interpreted as indicating that the topic is adequately covered. However, such an interpretation is misleading, as it disregards the fact that 50% of respondents felt that topic X was inadequately addressed. Therefore, the analysis focused exclusively on the responses indicating that the topic was “insufficiently covered”. This analysis was conducted by calculating the proportion of responses marked as “insufficiently covered” relative to the total number of responses for each topic.
If a respondent had not provided a rating for any topic or skill within a particular theme, they were excluded from the analysis of that theme. This approach was employed because the survey did not mandate respondents to rate all topics or skills within each theme, and it was deemed the most effective way to preserve as much information as possible.
As none of the variables satisfied the criteria for a normal distribution, non-parametric tests were employed. The significance level for the analysis was established at 0.95. Statistical differences between themes were calculated using Wilcoxon’s signed-rank test, as the theme variables were interdependent. In contrast, differences between regions were evaluated using the Mann–Whitney U test, due to the regional variables being independent and unrelated.
Comparative analysis required the calculation of the response rates for each option within each survey region. For the intra-regional analysis, we also determined the percentage of responses where the option “inadequately covered” was selected among different groups of respondents, such as professionals, teachers and students.
Participants were asked to assess four distinct teaching resources using a four-tiered scale: ‘not at all’, ‘to a limited extent’, ‘moderately’, and ‘very much’. To gain a deeper understanding, a comparison was made by calculating the proportion of responses in which respondents selected ‘not at all’ and ‘to a limited extent’. Subsequently, the Mann–Whitney U test was performed to determine whether there were statistically significant differences between regions.
As a result, statistical analyses were conducted to determine whether the negative feedback regarding Practical Opportunities differed significantly from the average rate of negative responses for other teaching resources. Given that the data set consisted of responses from the same individuals, it was treated as correlated. Consequently, the Wilcoxon signed-rank test was used to assess whether a significant disparity was present.

3. Results

In this assessment, the Latin America and the Caribbean region exhibited the highest proportion of responses indicating inadequate coverage, with an average rate of 45% across all teaching themes. The Asia and the Pacific region followed with 42%, while Europe and Central Asia reported a 39% share. North America had the lowest proportion of responses indicating inadequate coverage, at 29%.
Conversely, the rate of adequate responses inversely mirrored these findings. North America had the highest average, at 60%, followed by Europe and Central Asia at 54%. In Latin America and the Caribbean, this figure was 50%. The lowest proportions of adequately covered responses were found in Asia and the Pacific, and Africa, with these regions reporting 49% and 46%, respectively.
For all the themes, the highest proportion of extensively covered responses was found in North America, at 11%, followed by Africa at 10%. Asia and the Pacific reported 9%, while Europe and Central Asia had 7%. Latin America and the Caribbean had the lowest percentage of extensively covered responses, accounting for only 5% of the total. In evaluating teaching resources, Practical Opportunities were identified as having the poorest availability compared to global averages.
The acronyms used for the teaching themes were as follows: FR&E = Forest resources and ecology, FP&M = Forest planning and management, FS&CI = Forest services and cultural issues, FE = Forest enterprise, GE = Generic Skills, OS = Other skills

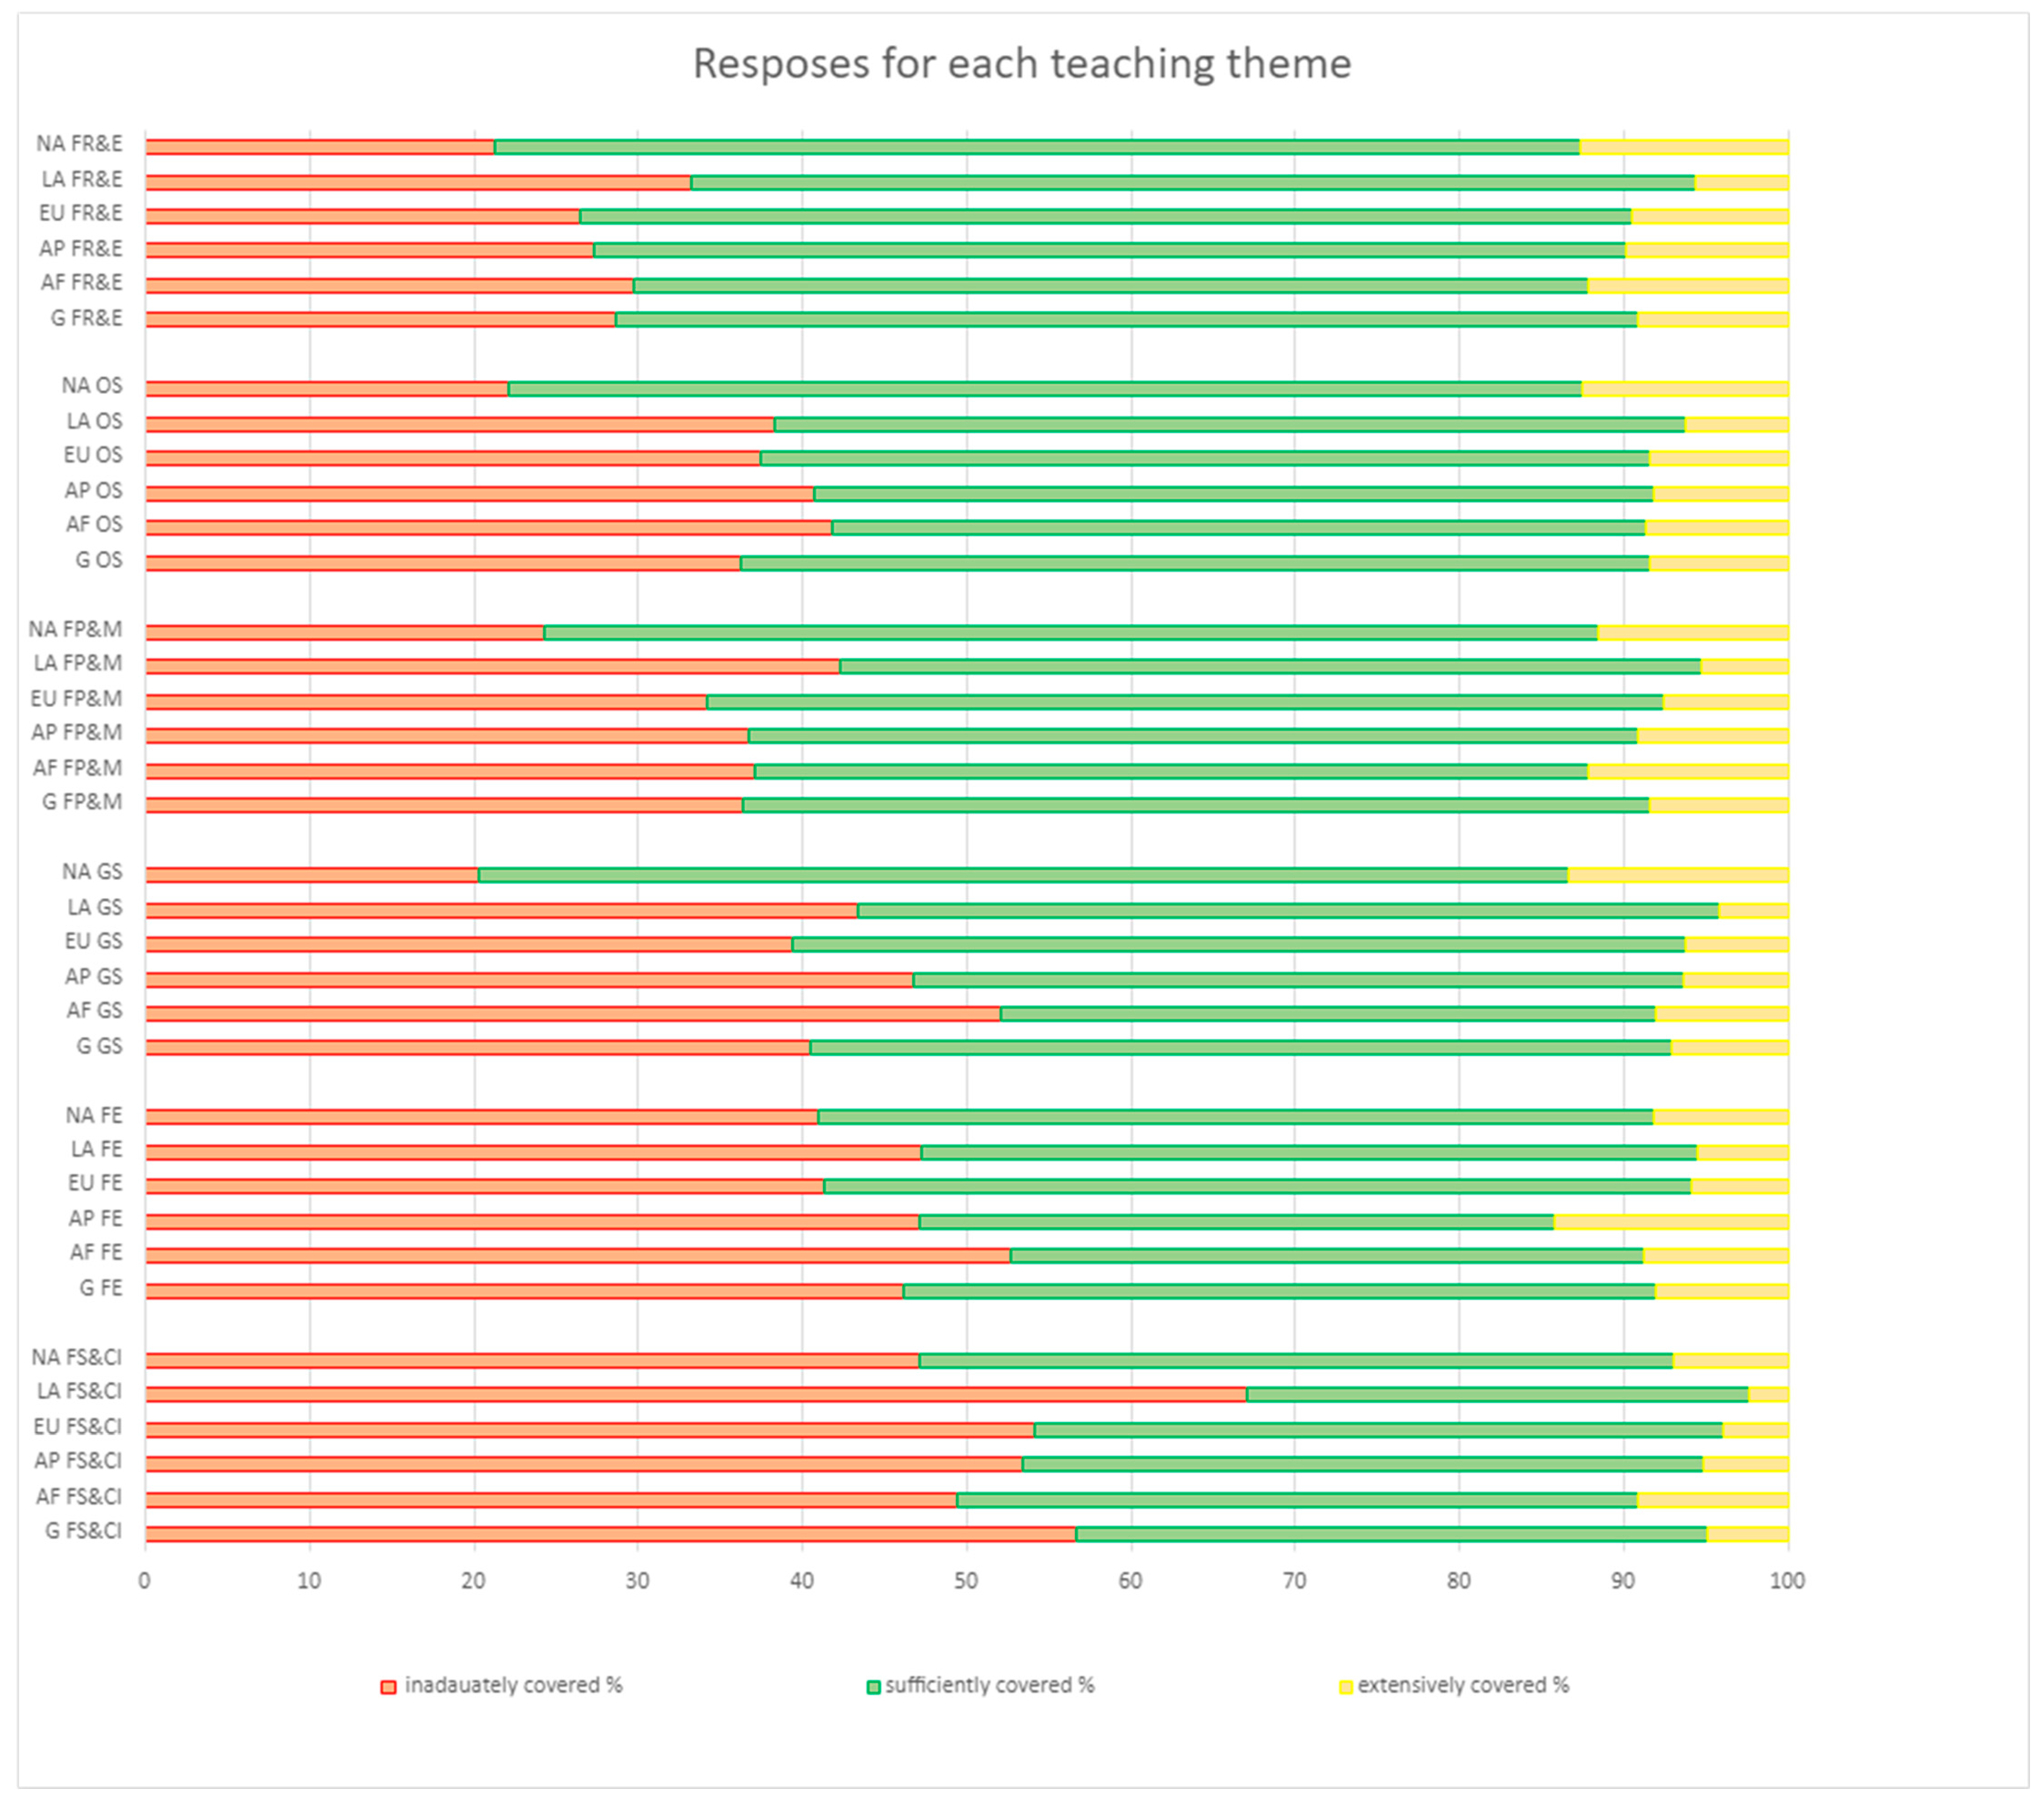
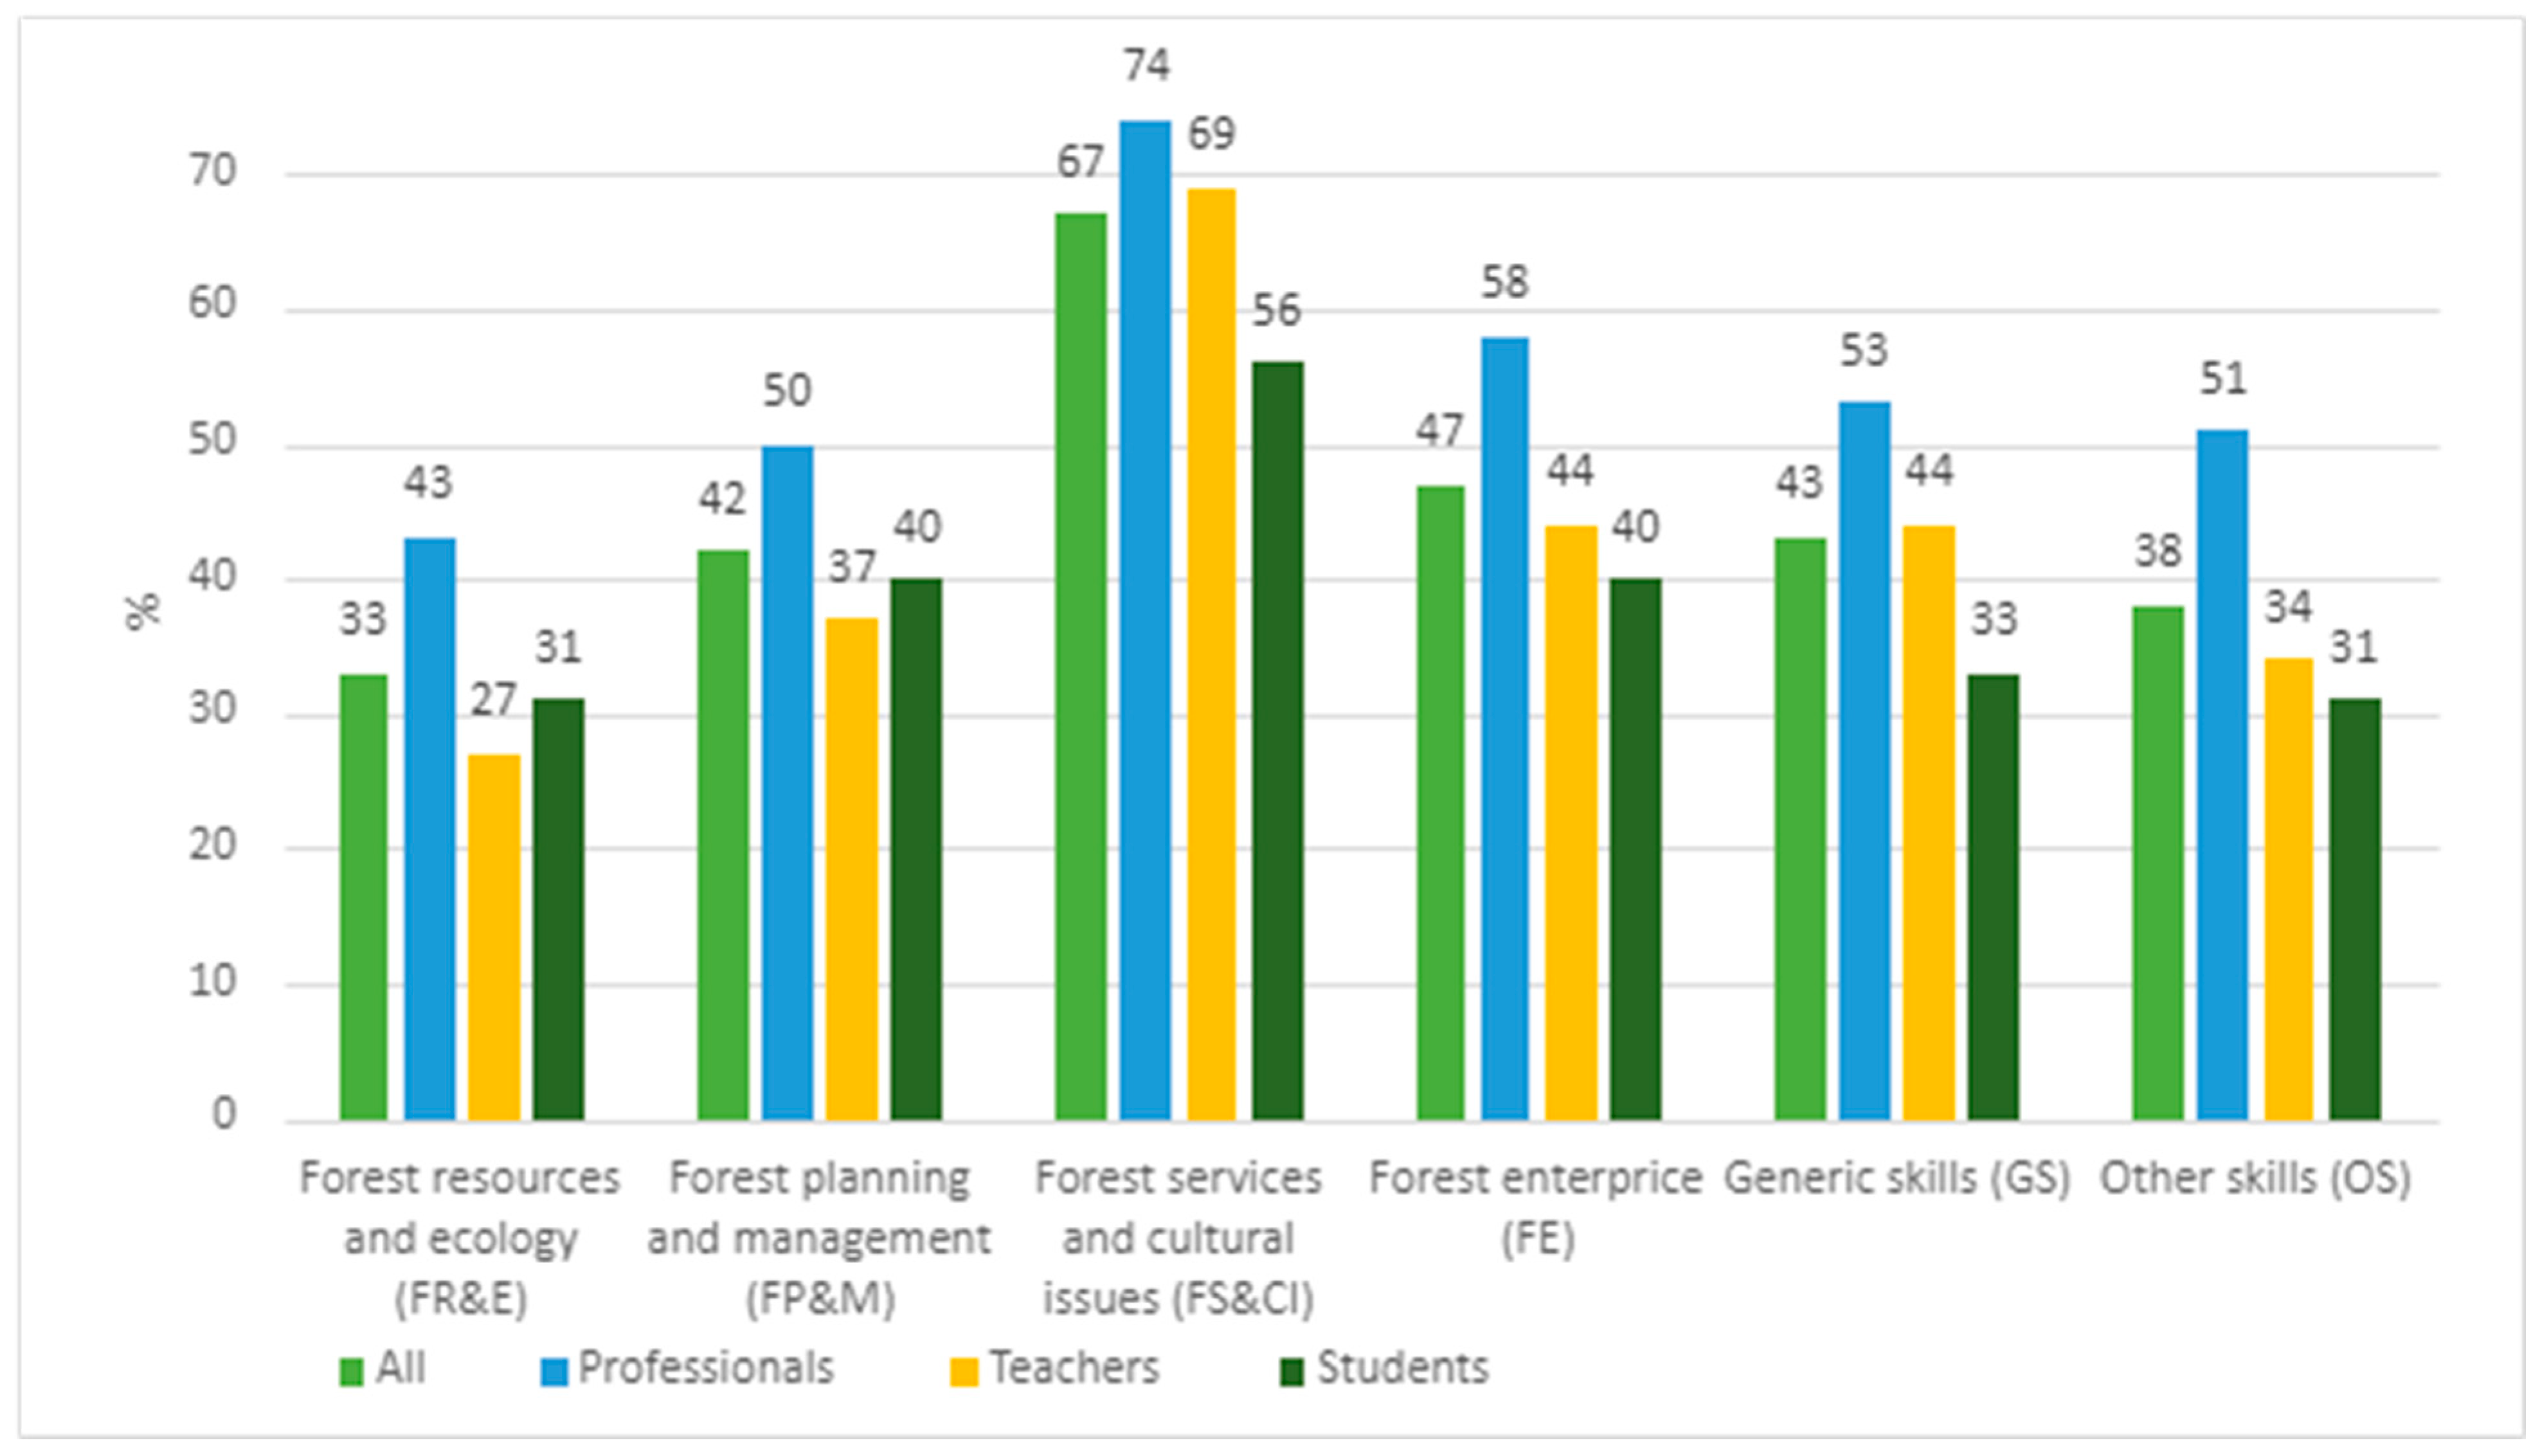
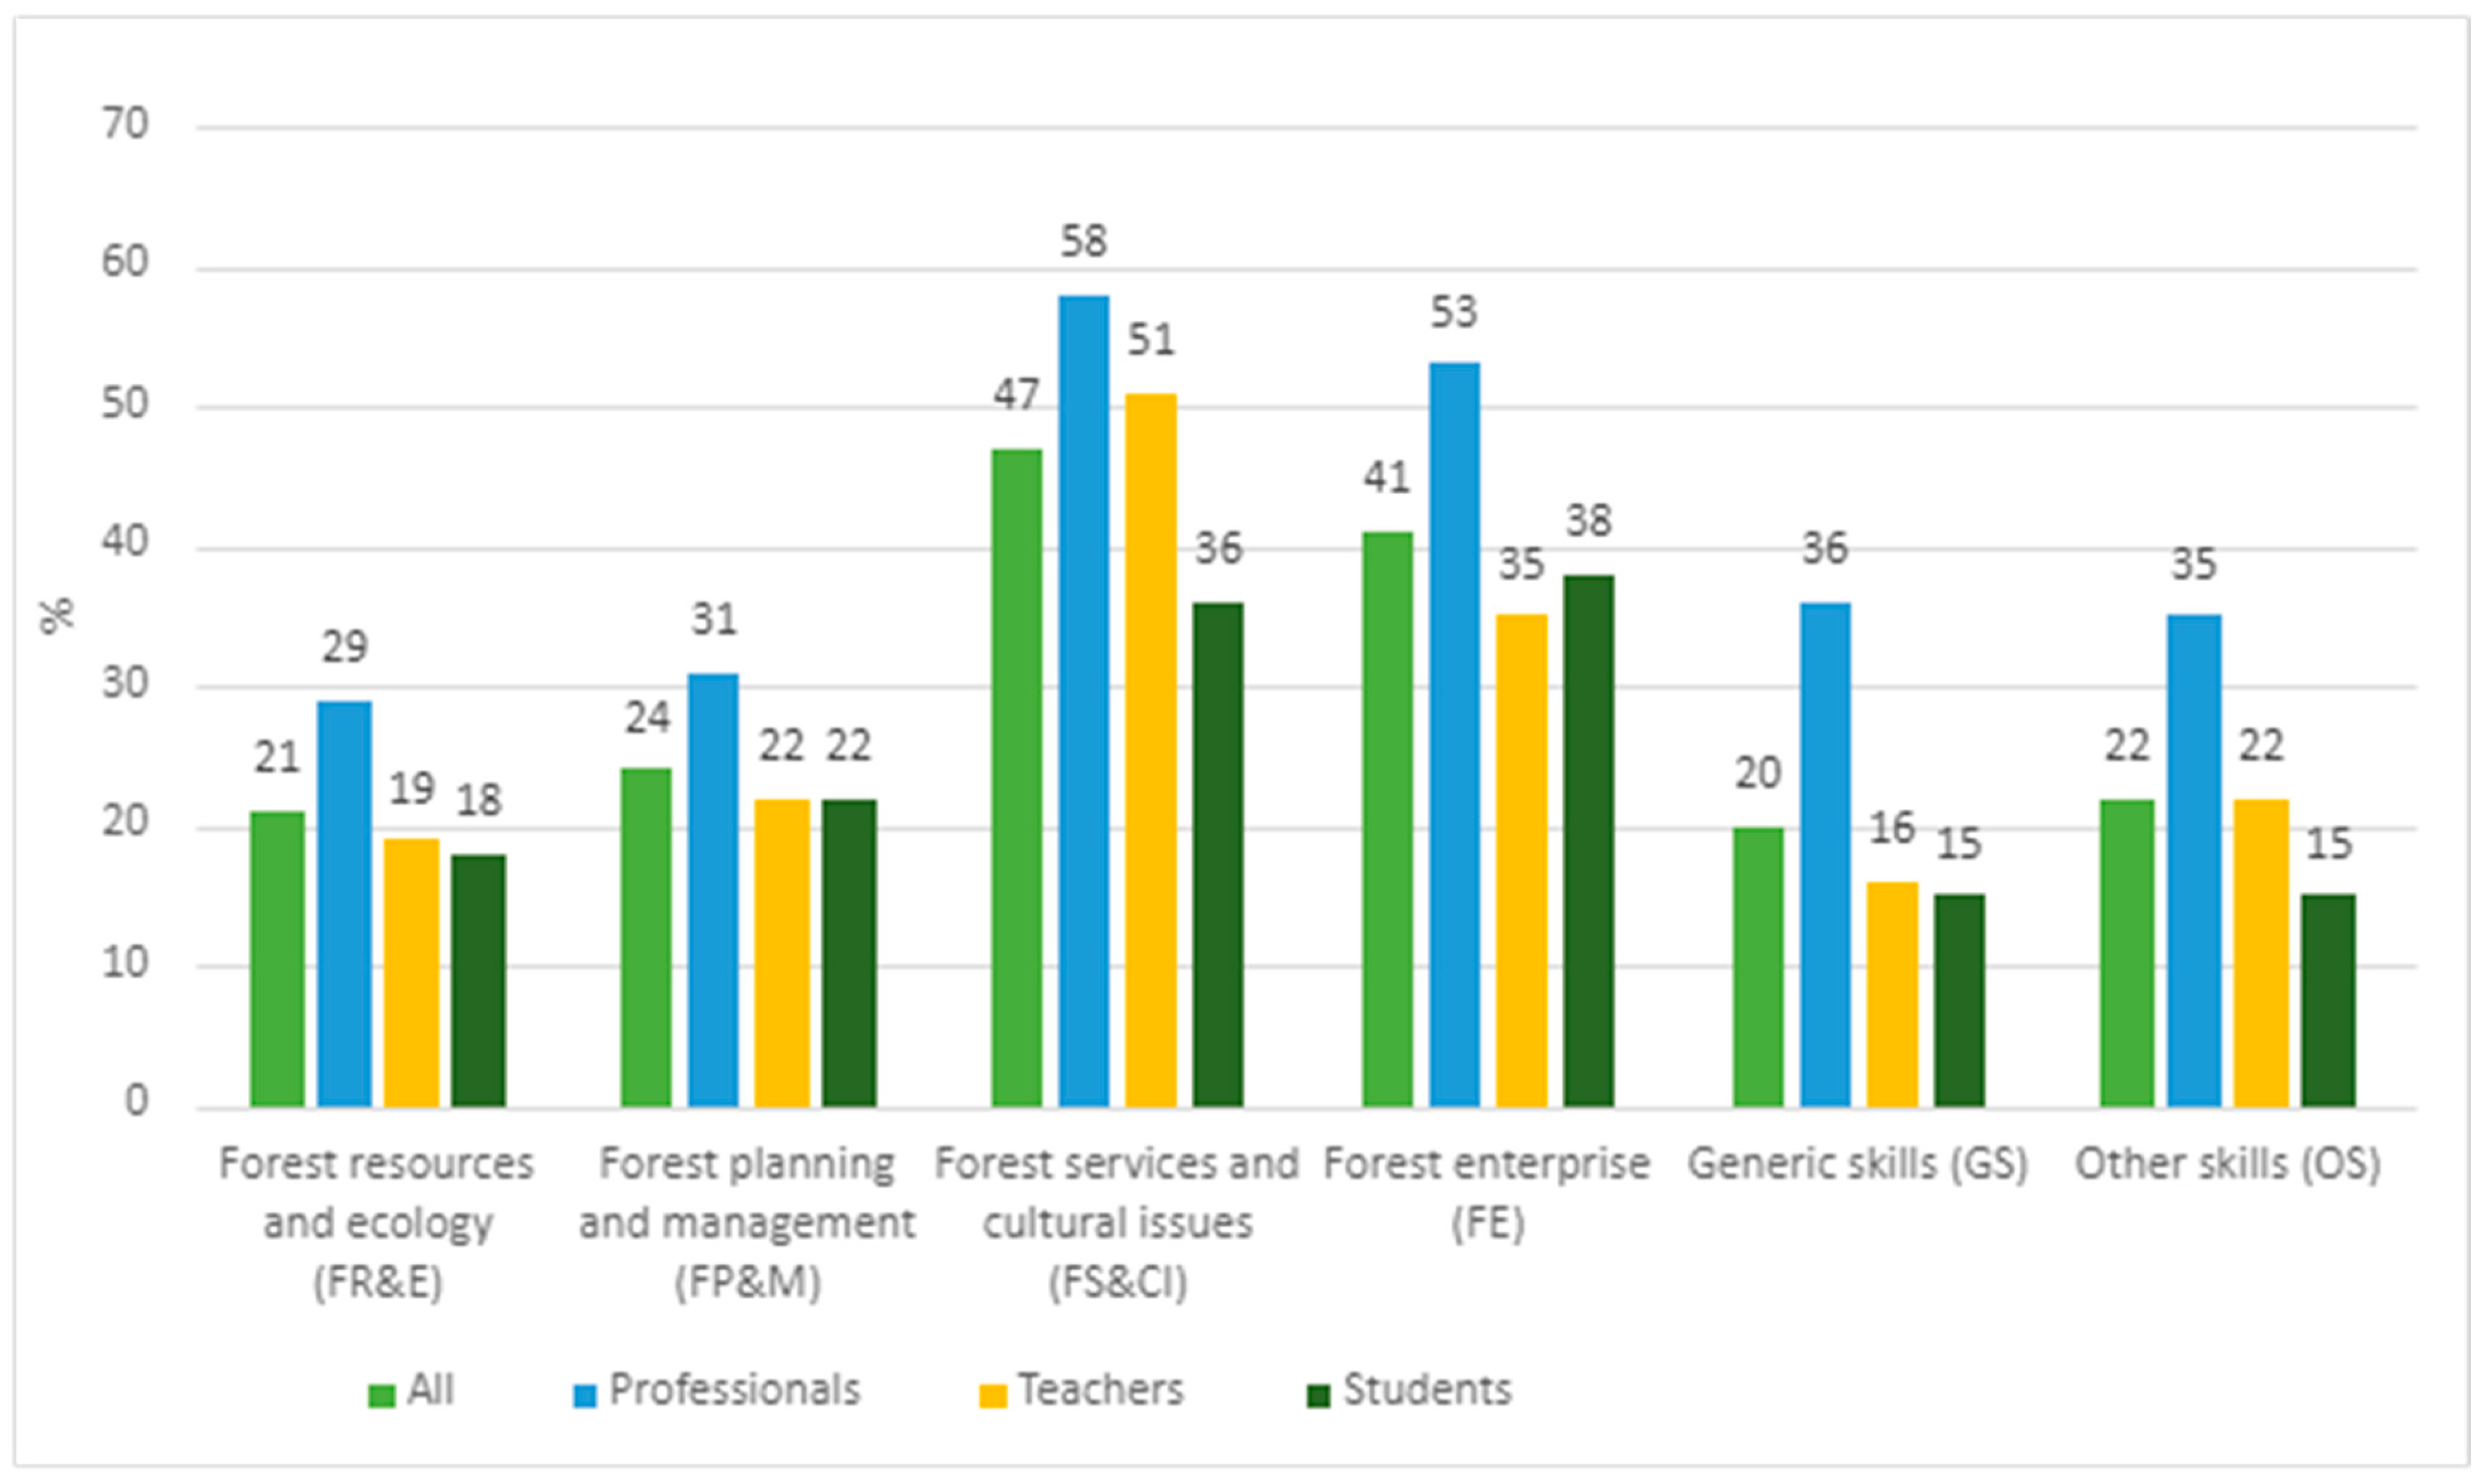
3.1. Global Comparison in the Perception of the Coverage of Different Teaching Themes

Globally, the theme of forest resources and forest ecology had the lowest frequency of inadequate coverage, with 29% of respondents indicating as such for this theme (Figure 2). The themes of OS and FP&M followed closely, each averaging a 36% inadequately covered response rate. GS, on the other hand, had a 40% average of inadequately covered responses. The theme with the second worst ratio of inadequately covered responses was FE, with 46%. The theme indicating the highest rate of ‘inadequately covered’ globally was FS&CI, with 57% of responses indicating inadequate coverage worldwide (see Figure 2, bottom-most bar).
There are regional similarities in the inadequately covered response proportions across curriculum themes. For instance, the North America region had the lowest rate in all curriculum themes, while Asia and the Pacific and Latin America and the Caribbean had the worst coverage in most themes. Interestingly, when it comes to the perceived coverage of these themes, the trend remains consistent across all surveyed regions.
In the four different teaching themes—FR&E, FP&M, GS, and OS—the proportion of sufficiently covered responses globally clearly exceeded that of inadequately covered responses. In the theme of FE, these responses were proportionally equal globally. A clear exception to this comparison was FS&CI, which was the only teaching theme that received more inadequately covered responses than sufficiently covered responses across the regions. In the themes of FE and GS, the proportions of inadequately covered and sufficiently covered responses varied. In the GS theme, only Africa had a higher proportion of inadequately covered responses than sufficiently covered responses. In the FE theme, only in Europe and Central Asia and North America was the proportion of sufficiently covered responses higher than inadequately covered. In Latin America and the Caribbean, the proportions of these responses were equal. In Africa, Asia and the Pacific, Latin America and the Caribbean, the proportion of inadequately covered responses was higher than sufficiently covered.
There was no significant variation in the proportion of extensively covered responses globally (see Figure 2). The largest share globally was in the FR&E theme, where the share was 9%. The lowest share of 5% was in the FS&CI theme. There was more variation between regions, but the variation in the proportion of extensively covered responses between regions for all themes was less than 10%.
The highest single proportion of extensively covered responses originated from Asia and the Pacific in the Forest Enterprise theme, with a proportion of 14%. The next highest rates were observed for North America, where the themes of Forest Resources and Ecology, Generic Skills, and Other Skills each had a proportion of 13%. The lowest corresponding shares were found in the Forest Services and Cultural Issues and Generic Skills themes. The Forest Services and Cultural Issues theme received shares of 2%, 4% and 5% from Latin America and the Caribbean, Europe and Central Asia and Asia and the Pacific, respectively. The Generic Skills theme in Latin America and the Caribbean’s extensively covered option covered 4% of the responses. Otherwise, the extensively covered option in the responses for all themes and for all regions ranged between 6% and 12%.
In the teaching theme of FR&E, North America achieved statistically significantly more extensively covered responses than most other regions, with the exceptions of Asia and the Pacific and Europe and Central Asia (Table 3). Europe and Central Asia had significantly better rates when compared to Latin America and the Caribbean. Moreover, Asia and the Pacific scored statistically significantly better than Latin America and the Caribbean. These were the only significant differences within this theme.
For FP&M, North America stood out, scoring significantly higher than all other regions. In contrast, Latin America and the Caribbean scored statistically significantly worse than all other regions. No other statistically significant differences were found for this theme.
In the theme of FS&CI, Latin America and the Caribbean performed significantly worse than all other regions. Furthermore, North America had a significantly better perception of coverage compared to both Asia and the Pacific, and Europe and Central Asia. These were the only significant differences recorded for this theme.
Regarding the FE theme, North America and Europe and Central Asia had significantly differed scores, outperforming all other regions statistically.
In the FE theme, North America and Europe and Central Asia had statistically significantly different scores compared to all other study regions. Moreover, for Africa, the perceived coverage of the topic was lower than Latin America and the Caribbean’s, while no other notable differences were detected within this theme.
North America again stood out in the themes of GS and OS, where it scored significantly better than all other study regions, while the only other significant difference was between Europe and Central Asia and Africa for GS.

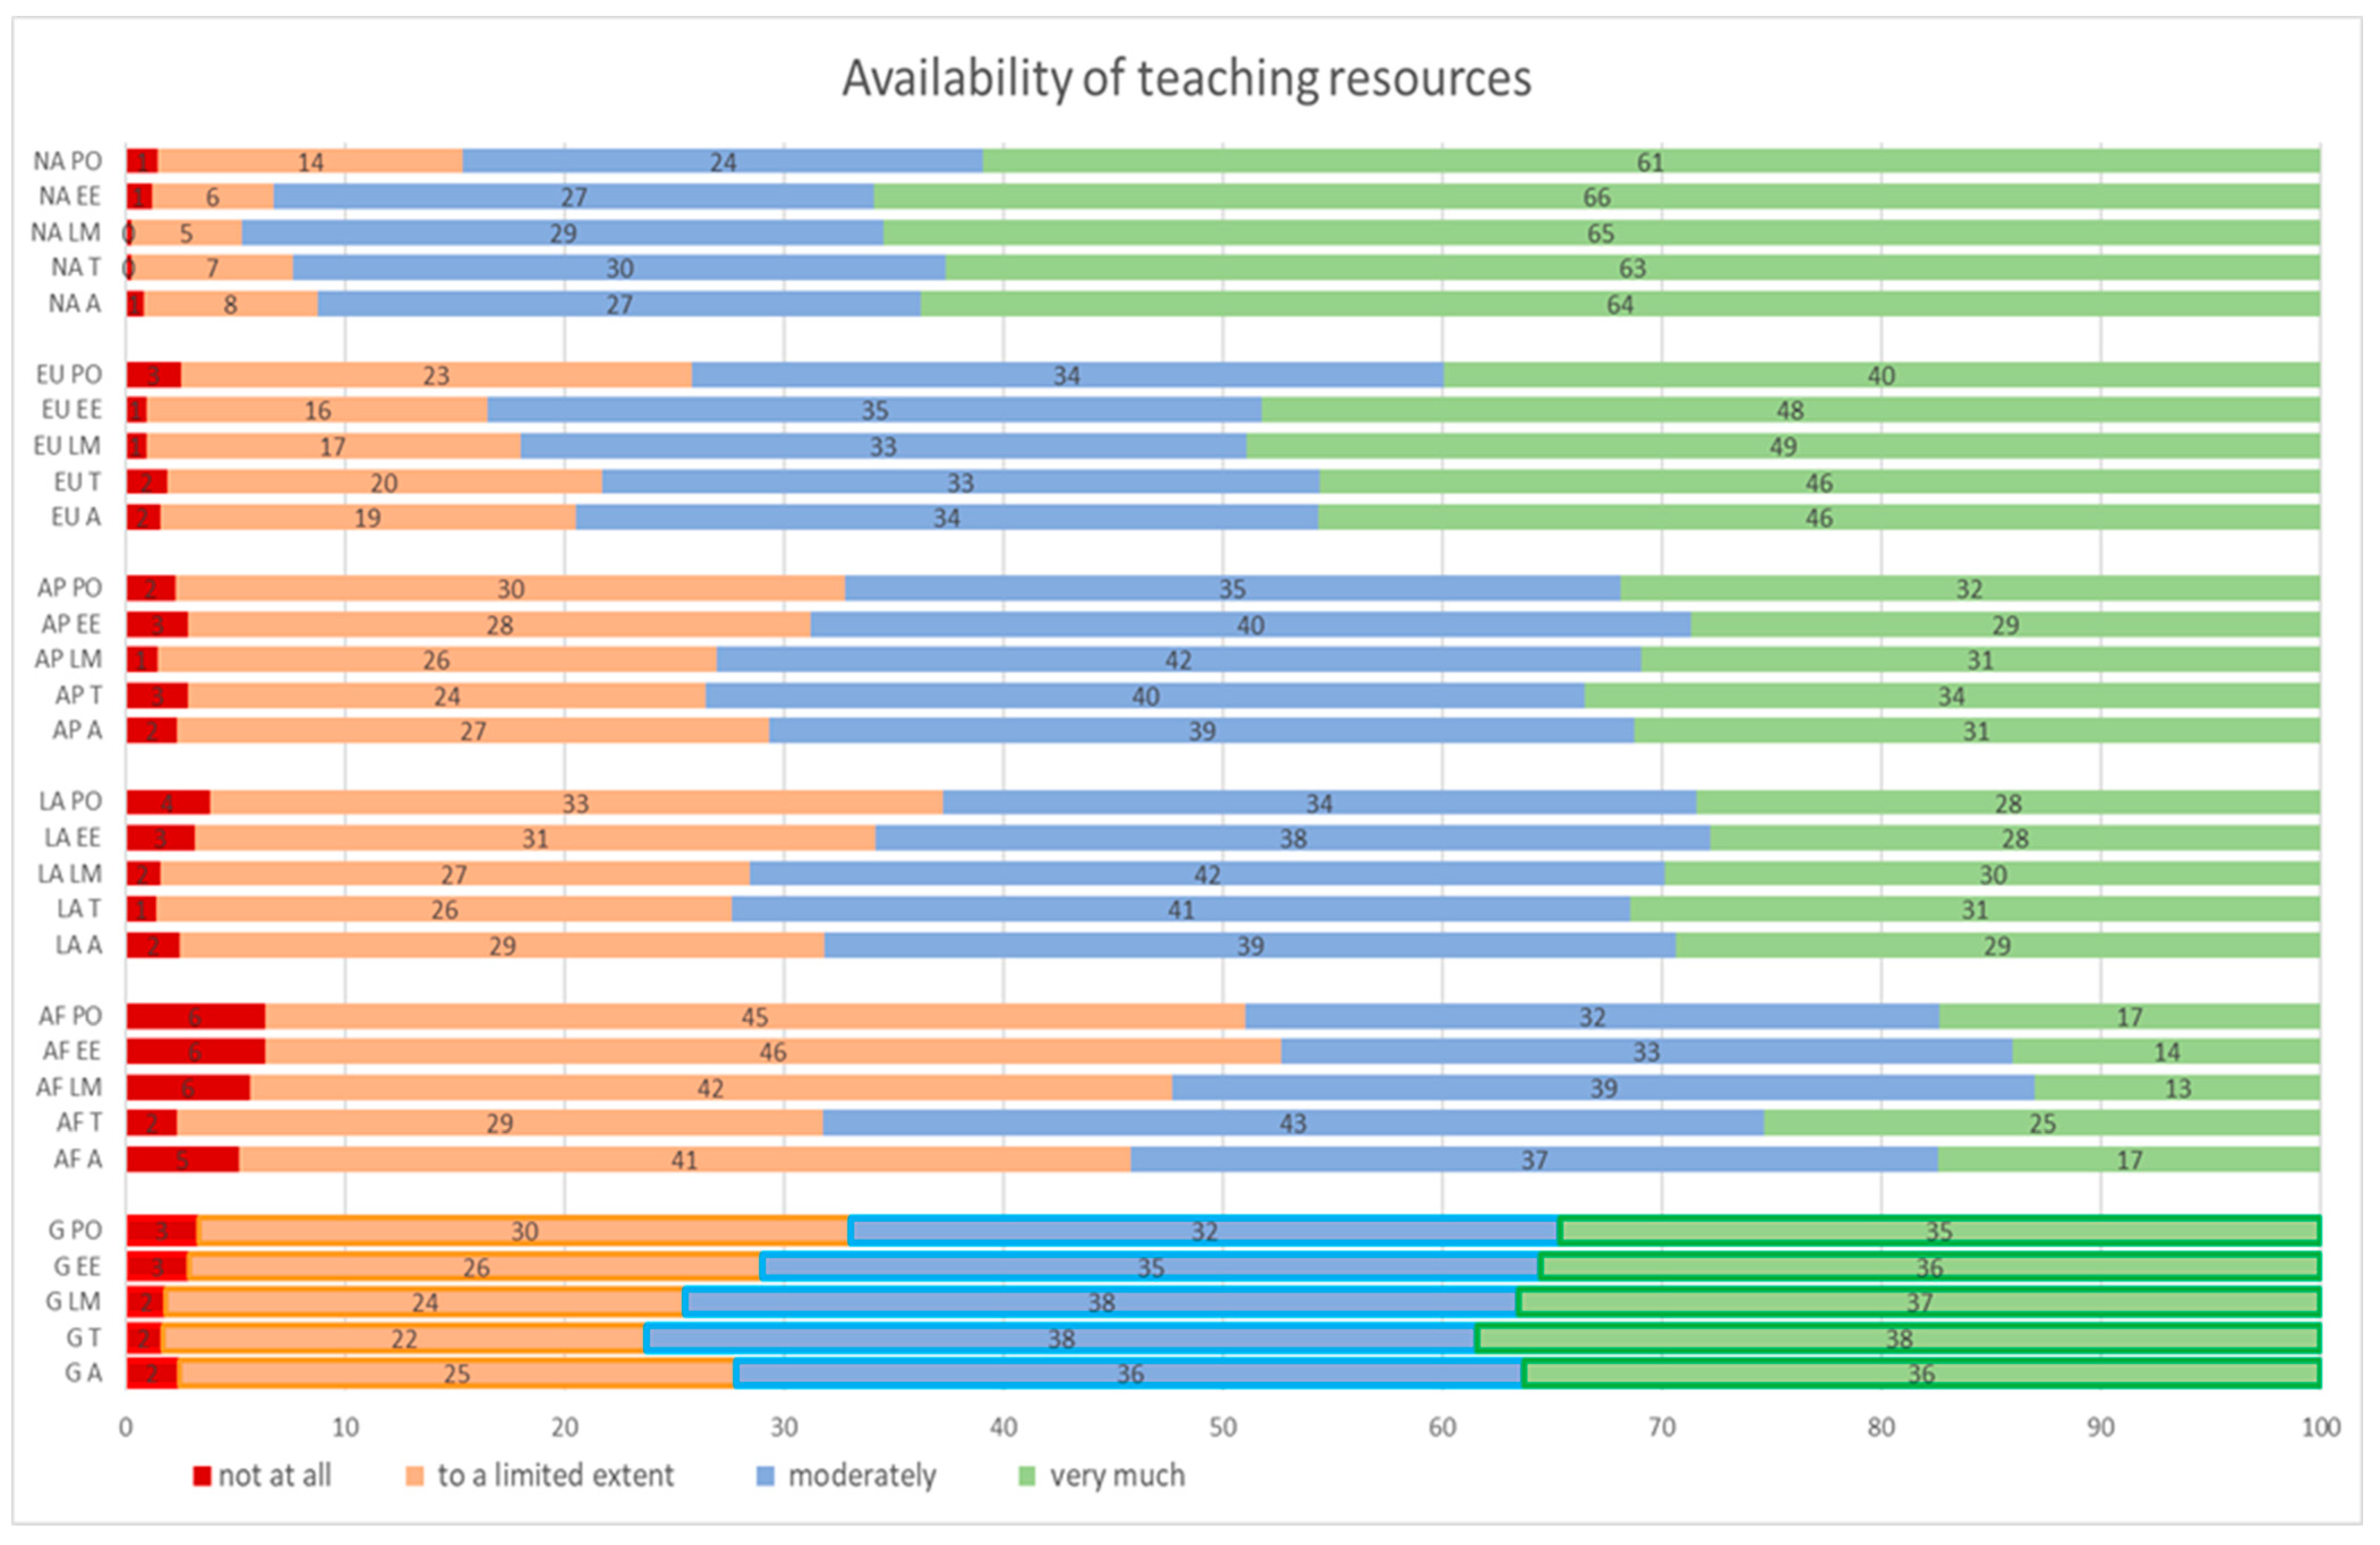
3.2. Global Comparison in Perceived Availability of Teaching Resources

In this subsection, we analyze how study regions perceived the availability of four different teaching resource categories.
Although the availability of teaching resources had high regional differences and the overall availability of teaching was different for every study region, some similar patterns do emerge from the data. In most study regions, the category of practical opportunities (e.g., experiential learning, practical training, field visits) had the lowest perceived availability (Figure 3).
North America and Europe and Central Asia had the lowest percentage of perceived shortages of resources overall. On average, students’ perceptions were the most positive and professionals’ the most negative. In North America, 64% of all respondents felt that resources were “very much” available and 27% thought that they were “moderately” available. Of these respondents, 8% in the region felt that the availability was “to a limited extent” and only 1% reported that the availability was “not at all”.
In Europe and Central Asia, access to educational resources was regarded as the second best. Professionals had the most negative perception of all respondent groups, while teachers had a slightly more negative perception than students. In Europe and Central Asia, 46% of respondents perceived the availability of teaching resources to be “very much” and 34% said it was “moderately” available. In total, 19% said “to a limited extent” and 2% “not at all”. Teachers’ perceptions in these two regions aligned more closely with those of students, though still with a slight inclination towards a negative view.
Asia and the Pacific and Latin America and the Caribbean were perceived to have similar levels of access to educational resources. Approximately one third of respondents, 31% in Asia-Pacific and 29% in Latin America and the Caribbean, reported a high availability of resources, reporting a very high level of access. Additionally, both regions had 39% of participants rating the access level as moderate. However, those who felt resources were available to a limited extent comprised 27% in Asia-Pacific and 29% in Latin America and the Caribbean. Those reporting “not at all” were few, tallying at 2% and 4%, respectively. In both regions, it was observed that professionals generally had the most pessimistic view of resource accessibility, in contrast to students and teachers who exhibited a more optimistic outlook. Notably, however, in both areas, teachers reported a somewhat grimmer view compared to students.
In Africa, access to educational resources was perceived to be more concerning than in other regions. The proportions of “very much” and “moderately” responses were 26% and 37%, respectively. The “to a limited extent” and “not at all” responses were 41% and 5%, respectively. In Africa, too, professionals’ perception of the situation was the most negative of all, while students had a slightly more negative perception about the availability of educational resources than teachers.
Respondents assessing the availability of educational resources were given four options (‘not at all’, ‘to a limited extent’, ‘moderately’ and ‘very much’). The statistical test aimed to determine whether there were significant differences in the frequency of “not at all” and “to a limited extent” responses between study regions (Table 4).
In the Teachers (quality and quantity of educators) category, there were only a few regions that did not have statistically significant differences between them. These were Asia and the Pacific in comparison to Africa, Europe and Central Asia and Latin America and the Caribbean. Furthermore, there was no statistically significant difference between Latin America and the Caribbean compared to Africa. This means that North America outperformed other regions.
In the Learning materials (e.g., textbooks, online learning materials, tools or applications) category, the only regions without statistically significant differences were Latin America and the Caribbean compared to Asia and the Pacific. There was only one pair that showed no statistically significant difference in the number of responses indicating negative resource availability: Latin America and the Caribbean compared to Africa. This pattern was also consistent in the categories Educational environment (e.g., laboratory access, class sizes) and Practical opportunities (e.g., experiential learning, practical training, field visits; see Table 4).

3.3. Perceived Availability of Teaching Resources and Perceived Coverage of Teaching Themes, Regional Analysis

In the following, we present an analysis of how the different respondent groups viewed the content of the education across all five study regions.
Beyond global comparisons, we conducted an in-depth analysis of the perceived coverage of various teaching themes within each study region. The aim was to uncover and examine the unique characteristics and needs of each region in greater detail. We conducted statistical analyses to determine whether this was a significant deviation from the average perceived availability of other educational resources. The statistical results are reported after the percentages for each region.
In Africa, the themes FR&E and FP&M received the lowest ratio of inadequately covered responses across all groups of respondents (Figure 4). FR&E received the lowest number of inadequately covered responses of all the themes, but even there the share was around 1/3 of the total responses. The share of inadequately covered responses in the OS theme ranged from 37% to 47%. In the FS&CI and the GS themes, more than 50% of responding teachers and professionals perceived that these themes were inadequately covered. The student group was slightly more positive in these themes, with no more than 36 and 42% of responses being inadequately covered.
The FE theme was the only one where all respondent groups had an inadequately covered responses rate of at least 50%. Comparing the respondent groups, professionals were generally the most critical regarding the breadth of the themes covered, although their perspectives were not drastically different from the teachers’. On average, students had the most favorable opinion concerning the adequacy of education on these themes. Overall, the themes of FS&CI, FE, and GS emerged as the themes perceived to have the most substantial deficiencies in educational content across Africa.
When testing for statistically significant differences in the amount of inadequately covered responses received between teaching themes, significant relationships were observed between FS&CI and FE, FS&CI and GS, and GS and FE.
In Africa, a statistically significant disparity was observed in the frequency of inadequate responses directed at the Practical Opportunities category (Table 4, Figure 3) compared to the average number of negative responses for the other categories of teaching resources. The statistical analysis yielded a p-value of 0.047 and a standardized test statistic of 1.983, indicating that the difference in the negative feedback for Practical Opportunities is not due to chance and is indeed noteworthy.
In Asia and the Pacific, the FS&CI theme was the only one where all respondent groups reported an inadequate coverage of at least 50% (Figure 5). The next most poorly covered themes were FE and GS. In FE, the teachers and professionals groups had the most negative perception of the coverage of teaching, with both groups reporting an inadequate coverage of more than 50%. For GS coverage, the professionals group had by far the most negative perception, with 56% of respondents giving an inadequately covered response. For students and teachers, on the other hand, 43 and 40% felt that the theme was inadequately covered.
In the OS theme, the responses were similarly divided. The professionals group was clearly the most dissatisfied, with 51% of respondents recording inadequate coverage. Teachers and students had a more positive view of the situation than professionals. In total, 36% of students and 33% of teachers deemed the coverage to be inadequate. FP&M generally fared better, though 31%–40% of responses identified the coverage to be inadequate. Here again, the professionals group had the most negative view, with 40% giving inadequate answers, while students (31%) were more positive than teachers (38%). The most positively perceived theme was Forest Resources and Ecology, with only 26%–29% of respondents from all groups considering it inadequately covered, also reflecting the smallest disparity among the respondent groups. Overall, professionals tended to have more negative perceptions than teachers and students. Students, on the other hand, had a more positive perception than teachers for most themes, except in the Generic Skills and other skills themes.
Only a few teaching themes did not show statistically significant differences between them in the amount of inadequately covered responses received. The themes that received a similar amount of inadequately covered responses were FP&M and OS, FS&CI and FE.
In the Asia–Pacific region, a significant variation was detected regarding the negative responses to the Practical Opportunities category in contrast to the mean number of negative responses for other teaching resource categories. The statistical analysis resulted in a p-value of 0.05 and a standardized test statistic of 1.961, which substantiates the presence of a statistically significant difference in the feedback for Practical Opportunities.
In Europe and Central Asia, the FS&CI theme was perceived as the most inadequately covered of all themes, with 54% of students, 52% of teachers, and 63% of professionals responding as such (Figure 6). Professionals had the most negative perception of coverage, with an inadequately covered response rate of 54%. Teachers, on the other hand, had a slightly more positive perception of coverage than students. The GS and OS themes had a very similar number of inadequately covered responses compared to each other. In the professionals group, the inadequately covered rate was between 52% and 54%, for teachers it was between 34% and 36%, and for students between 36% and 37%.
In the FP&M theme, professionals again had the most negative perception of the coverage of teaching, with 41% deeming the coverage to be inadequate. For teachers, this rate was 29%, which was slightly lower than for students with 34%. The lowest proportions of inadequately covered responses were recorded in the FR&E theme, with professionals at 29%, students at 28% and teachers at 22%. The professionals group had the most negative perception across all themes. In all themes, students had a slightly more negative view when compared to teachers.
Here again, when testing for statistical significance between teaching themes, only a few themes did not have significant differences between each other, namely, FP&M and OS; FE and GS; and FE and OS.
In Europe and Central Asia, the data indicated a statistically significant difference in the level of negative responses attributed to the Practical Opportunities category compared with the average number of negative responses for other teaching resource categories. The statistical analysis reported a p-value of <0.001 and a standardized test statistic of 3.496, highlighting a substantial divergence in negative feedback concerning Practical Opportunities.
In Latin America and the Caribbean, FS&CI was the theme with by far the highest proportion of inadequately covered responses (56%–74%) across all respondent groups (Figure 7). FE was perceived as the second most inadequately covered theme in the region, with 58% of professionals, 44% of teachers, and 40% of students expressing this view.
In GS and OS, the proportions of inadequate responses followed a similar pattern. Professionals had the highest percentage of inadequately covered responses with 53% and 51%, respectively, teachers had 44% and 34%, and students had the lowest percentage, with 33% and 31%. For FP&M, the proportion of inadequately covered responses was slightly higher for students (40%) than for teachers (37%). The professionals’ group had the most negative view, with 50%.
FR&E was perceived as the best covered theme in the region. The proportion of inadequately covered responses ranged between 43% and 27%. Students perceived the education on these themes as somewhat lacking compared to the perception of teachers. Notably, professionals consistently harbored the most critical view across all educational themes, underscoring a trend of heightened expectations or awareness within this group. FR&E and FP&M were perceived as less covered by students than by teachers, while in the other themes, teachers’ perception was more negative than that of students.
In Latin America and the Caribbean, only FE and OS did not have statistically significant differences in the amount of inadequately covered responses gained.
In Latin America and the Caribbean, the negative responses provided to the Practical Opportunities category were statistically different from the average number of negative responses to other teaching resource categories. The statistical test yielded a p-value of <0.001 and a standardized test statistic of 4.115, demonstrating a significant disparity in the assessment of Practical Opportunities relative to other teaching resources within the region.
North America stood out from other survey regions due to its notably lower percentage of responses indicating the inadequate coverage of themes (Figure 8). Two themes had a significantly higher proportion of responses with “inadequately covered” selected than the other themes: FS&CI and FE. For these, the combined average of the respondent groups was 47% and 41%, respectively. Professionals identified more inadequacies in educational themes than other respondent groups. From the professionals’ group, between 53% and 58% responded that these themes were inadequately covered, while for teachers, these rates were between 51% and 35%, which was an unusually large magnitude. For students, the proportions were 36% and 38%.
In other themes, the proportions of inadequately covered responses were clearly lower in all respondent groups, with combined proportions of inadequate responses ranging from 20% to 24%. In North America, professionals had the highest percentage of “inadequate coverage” responses for the themes of FR&P, FP&M, GS, and OS. Teachers’ and students’ views were very close in FR&P, FP&M, and GS, with students a little more critical of coverage in the FR&P and GS categories. In FS&CI and OS, students had a more clearly positive perception of the coverage of teaching than teachers. FE was the only theme where students had a less positive perception of teaching coverage than teachers.
Similar to the other study regions, in North America, only a few teaching themes did not have statistically significant differences between them in the amount of inadequately covered responses on average. These themes were FR&E and GS; FR&E and OS; FP&M and OS, GS and OS.
In the North American region, there was a pronounced statistical deviation in the negative feedback regarding Practical Opportunities when contrasted with the average negative feedback for other categories of teaching resources. The conducted statistical test revealed a p-value of <0.001 and a standardized test statistic of 5.017, confirming that the difference in negative responses to the Practical Opportunities category is highly significant in the region.

3.4. Study Limitations

There are several factors that affect the reliability of the data. The reliability is challenged by the variation that may take place internally and across regions. The internal variation of five large survey regions is most likely significant. For instance, the region “Europe and Central Asia” covered countries from UK to Russia and from Portugal to Kyrgyzstan. It is likely that the coverage of educational themes varies a lot from country to country in this region. However, only regional averages were reported, which masks variations within regions.
It is worth noting that the findings of this study are based on respondents’ perceptions, which can be influenced by various factors. Cross-cultural response biases may exist internally but especially across survey regions [31]. Several standardization methodologies do exist for the adjustment of cultural response tendencies [32]. However, they are not easy to apply as such. Moreover, because of the global scale with heterogeneous regions, these methods were not applied in this study.
The survey instrument for coverage itself, an easy-to-respond-to format with a three- point scale, is itself prone to measurement errors. This scale was used for teaching topics/themes. Such a narrow scale reduces the variance in data and certainly may mask real differences in thematical coverages. However, coverage measure as a semantic differential might create such a response style that diminishes the problematic effects of culturally based, extreme response styles [33].
Generally speaking, the number of responses (n = 2815) was supposedly reasonable when regional (n = 5) instead of country-level analysis was performed. Typically, global surveys at the country level, such as Pew surveys or World Values Surveys, have had around 1000 respondents per country [34,35]. This clustering of countries into five large regions enabled us to interpret the state of forest education at universities at a global level. The similarity of several results across the regions may speak in favor of relevant and real phenomena related to university education and thus provided evidence for reliability.

4. Discussion and Conclusions

This study aimed to analyze the perceived coverage of teaching themes and the availability of teaching resources both at the regional and global scale in university-level forest education. In our study, all teaching themes in all study regions received at least 20% inadequate coverage responses. A closer examination of the data showed that, on average, between one-third and over half of all respondents perceived the coverage of all teaching themes to be inadequately covered. This clearly indicates that action is necessary to enhance the comprehensiveness of all themes evaluated in this study. Previous studies have highlighted the need for curricula development in higher forest education and the need to improve the quality of education [7,13,14,22,36,37,38,39,40,41]. Significantly, the areas of Forest Services and Cultural Issues, along with Forest enterprise, emerged as the most neglected topics in educational programs across all surveyed regions; previous studies have also highlighted the inadequate coverage of these topics [4,6,14,16,17,39,42,43,44,45]. Addressing the gaps in these specific themes should clearly be an immediate global priority. The findings of this study also reveal that the challenges in forest education are strikingly similar across different regions and over time [46]. Contrary to expectations, the perceptions of coverage in North America were significantly more favorable than in Europe and Central Asia.
The availability of educational resources was uneven across different regions, as highlighted by this study. Africa, along with Latin America and the Caribbean, faced the most significant deficits. These are the same regions that reported the lowest perceived coverage in teaching themes. In contrast, North America demonstrated the best resource availability, with less than one-tenth of respondents giving negative views about the resource availability. Meanwhile, in Africa, almost half of respondents had a negative view of resource availability. These figures suggest that the capacity for teaching and curricular development may be hindered in certain regions more than others due to pure resource constraints. There are previous studies that have reported a lack of resources for forest education, most often coming from Africa and Asia and the Pacific regions [20,40,41,47,48,49,50]. Frugal innovation might be one way forward also for forestry education, especially in rural areas [51].
The field of forest professions, traditionally fairly local, has seen a major shift towards globalization in recent years [9,50]. As the industry grows its global presence, forestry education programs must also adapt, requiring greater flexibility on a curriculum level to prepare students with the necessary skills to be adept and adaptable in the ever-evolving circumstances. The findings of this study align with this trend, revealing gaps in current curricula where topic coverage is insufficient. These shortcomings reflect issues noted in earlier research, with several studies highlighting deficiencies in various areas of forest education. Addressing these findings allows educators and policymakers to pinpoint curriculum content that calls for more resources and focus to provide more consistent educational standards worldwide.
Many forest-related challenges are such in nature that they require cooperation between many different research disciplines [16,40]. This in turn requires better cooperation between the social and natural sciences. Many challenges also cannot be tackled at the local level alone but require global cooperation. Essentially, these are questions of the efficient sharing of education resources [52,53]. Innovative new technologies and methods, such as open educational resources (OER), could turn out to be relevant and accessible. It is promising that teachers have indicated that OER has yielded learning outcomes comparable to traditional course materials [54].
Certain forest services and cultural topics, such as Indigenous knowledge and ethnicity, are highly context-dependent and culturally specific, making them less accessible on a global scale [55]. However, other topics within this theme can be more easily applied internationally. For example, the open online course “Gender Equality, Diversity & Inclusion in Forestry-related Sectors (ForGEDI)” was recently developed by an international team of 40 experts from 30 organizations. This ForGEDI MOOC is available on the FutureLearn platform (futurelearn.com). It is expected that online platforms, enhanced by AI assistants for sharing educational materials, will significantly enhance educational efforts in the near future. Also, well-tutored field work and engaging students in the real-life challenges and possibilities of forests should be seen as more essential components for quality forest education at the university level.
The basis for the data used in this study, the Global Forest Education Project producing a global assessment, was a one-off effort. However, the strong institution and capacity of UN-FAO to produce Forest Resources Assessment (FRA) at a continuous pace may provide an essential means of gathering systematic information about forest education. Based on data from 119 countries, FRA 2020 reported statistics on education, such as the number of graduates disaggregated by gender and the level of education [1]. For those countries providing a time series of gender-disaggregated data, the proportion of women graduating in forest programs increased between 2000 and 2015. We propose that in the future, FRA should also assess the content of education, such as the topics covered in curricula.
The data and methods used made it difficult to draw any significant conclusions about the reasons for the different results across regions and respondents. Despite this, the findings are indicative of the general state of education within these regions and can help identify particular issues, such as in Africa, where the availability of teachers ap-pears to be relatively better than that of other educational resources.
Future surveys should prioritize conducting more in-depth analyses to explore the factors and backgrounds influencing the differing views and perceptions among respondent groups. In particular, there is a need for a closer examination of professionals, as they are key stakeholders who reflect societal needs and labor market demands. A deeper understanding of these perceptions could play a pivotal role in shaping the objectives, curricula, and teaching resources of forest education, thereby aiding in addressing global sustainability challenges.

Author Contributions

Conceptualization, K.W., M.R., A.N. and N.S.; methodology K.W., M.R., A.N. and N.S.; software, K.W. and A.N.; validation, K.W., M.R. and A.N.; formal analysis, K.W. and A.N.; investigation, K.W., M.R., A.N. and N.S.; resources, M.R.; data curation, K.W.; writing—original draft preparation, K.W.; writing—review and editing, K.W., M.R., A.N. and N.S.; visualization, K.W. and N.S.; supervision, M.R.; project administration, M.R.; funding acquisition, M.R. All authors have read and agreed to the published version of the manuscript.

Funding

This research received external funding from the University of Helsinki, Faculty of Agriculture and Forestry.

Data Availability Statement

The data presented in this study are available on request from the corresponding author due to privacy and ethical reasons.

Acknowledgments

Open access funding provided by University of Helsinki.

Conflicts of Interest

The authors declare no conflicts of interest.

References

  1. FAO. Global Forest Resources Assessment 2020: Main Report; FAO: Rome, Italy, 2020. [Google Scholar] [CrossRef]
  2. FAO. The State of the World’s Forest 2018: Forest Pathways to Sustainable Development; FAO: Rome, Italy, 2018. [Google Scholar]
  3. Baumgartner, R.J. Sustainable development goals and the forest sector—A complex relationship. Forests 2019, 10, 152. [Google Scholar] [CrossRef]
  4. Villarraga-Flórez, L.F.; Rodríguez-Piñeros, S.; Martínez-Cortés, O.G. Social science in forestry curricula: A case study of Colombia forestry programs. Sustainability 2015, 8, 36. [Google Scholar] [CrossRef]
  5. Sadowska, B.; Lulek, A. The importance of environmental-forest education in managing information on natural resources. WSEAS Trans. Bus. Econ. 2020, 17, 775–785. [Google Scholar] [CrossRef]
  6. Gabay, M.; Rekola, M. Forests, Peaceful and Inclusive Societies, Reduced Inequality, Education, and Inclusive Institutions at All Levels. UNFF14 Background Paper. 2019. Available online: https://www.un.org/esa/forests/wp-content/uploads/2019/03/UNFF14-BkgdStudy-SDG4-10-16-March2019.pdf (accessed on 20 March 2024).
  7. Bullard, S.H.; Williams, P.S.; Coble, T.; Coble, D.W.; Darville, R.; Rogers, L. Producing “society-ready” foresters: A research-based process to revise the Bachelor of Science in forestry curriculum at Stephen F. Austin State University. J. For. 2014, 112, 354–360. [Google Scholar] [CrossRef]
  8. Brack, C.L. Forestry education that goes beyond the standard and unoriginal. Aust. For. 2019, 82, 163–165. [Google Scholar] [CrossRef]
  9. Jegatheswaran, R.; Florin, I.; Hazirah, A.L.; Shukri, M.; Abdul Latib, S. Transforming forest education to meet the changing demands for professionals. J. Trop. For. Sci. 2018, 30, 431–438. [Google Scholar] [CrossRef]
  10. Bernasconi, A.; Schroff, U. Professions and Training in Forestry. Results of An Inquiry in Europe and Northern America; Federal Office for the Environment: Bern, Switzerland, 2011. [Google Scholar]
  11. de Jong, W.; Huang, K.; Zhuo, Y.; Kleine, M.; Wang, G.; Liu, W.; Xu, G. A Comparison of Forestry Continuing Education Academic Degree Programs. Forests 2021, 12, 824. [Google Scholar] [CrossRef]
  12. Sharik, T.; Saracina, R. Regional Assessment of Forest Education in North America (Canada and the United States); UBC Faculty of Forestry, FAO: Rome, Italy, 2021. [Google Scholar]
  13. O’Hara, K.L.; Salwasser, H. Forest science education in research universities. J. For. 2015, 113, 581–584. [Google Scholar] [CrossRef]
  14. Sample, V.A.; Bixler, R.P.; McDonough, M.H.; Bullard, S.H.; Snieckus, M.M. The promise and performance of forestry education in the United States: Results of a survey of forestry employers, graduates, and educators. J. For. 2015, 113, 528–537. [Google Scholar] [CrossRef]
  15. Gabay, M.; Oldekop, J.; Humphreys, D.; Kamoto, J.; Mutta, D.; Rai, N.; Conghe, S.; Timko, J.; Vang Rasmussen, L.; Zavaleta, J. Contextual Factor Shaping Forest-Poverty Dynamics. In Forests, Trees and the Eradication of Poverty: Potential and Limitations—A Global Assessment Report; Miller, D.C., Mansourian, S., Wildburger, C., Eds.; IUFRO World Series; IUFRO: Vienna, Austria, 2020; Volume 39, pp. 95–122. Available online: https://www.iufro.org/fileadmin/material/publications/iufro-series/ws39/ws39.pdf (accessed on 4 June 2024).
  16. Lee, D.K.; Koch, N.E.; Innes, J.; Mayer, P. Emerging issues in forest science. Folia For. Pol. Ser. A 2011, 53, 52–63. [Google Scholar] [CrossRef]
  17. Sharik, T.L.; Storer, A.J.; Bal, T.L.; Abbas, D.; Dockry, M.J.; Bengston, D.N.; Westphal, L.M. Education as a driver of change in US forests and the forest sector. In Drivers of Change in US Forests and Forestry Over the Next 20 Years; U.S. Department of Agriculture, Forest Service, Northern Research Station: Madison, WI, USA, 2020; Volume 20, pp. 84–99. [Google Scholar] [CrossRef]
  18. Rodriguez-Pineros, S.; Walji, K.; Rekola, M.; Owuor, J.A.; Lehto, A.; Tutu, S.A.; Giessen, L. Innovations in forest education: Insights from the best practices global competition. For. Policy Econ. 2020, 118, 102260. [Google Scholar] [CrossRef]
  19. Innes, J.L. Master’s degrees and other postgraduate education options for foresters. J. For. 2015, 113, 561–565. [Google Scholar] [CrossRef]
  20. Temu, A.B.; Rudebjer, P.G.; Kiyiapi, J.; van Lierop, P. Forestry Education in Sub-Saharan Africa and Southeast Asia: Trends, Myths and Realities. Forestry Policy and Institutions Working Paper. 2005. 3. Available online: https://www.researchgate.net/publication/301696250_Forestry_education_in_Sub-Saharan_Africa_and_Southeast_Asia_Trends_myths_and_realities (accessed on 17 June 2024).
  21. Ketlhoilwe, M.J.; Jeremiah, K. Mainstreaming environment and sustainability issues in institutions of higher education: The case of the University of Botswana. Int. J. Sci. Res. Educ. 2010, 3, 1–9. [Google Scholar]
  22. Bullard, S.H. Forestry curricula for the 21st century—Maintaining rigor, communicating relevance, building relationships. J. For. 2015, 113, 552–556. [Google Scholar] [CrossRef]
  23. Rekola, M.; Sharik, T.L. Global Assessment of Forest Education: Creation of a Global Forest Education Platform and Launch of a Joint Initiative under the Aegis of the Collaborative Partnership on Forests (FAO-ITTO-IUFRO Project GCP/GLO/044/GER); Food and Agriculture Organization of the United Nations (FAO): Rome, Italy, 2022. [Google Scholar] [CrossRef]
  24. Grubbström, A.; Powell, S. Persistent norms and the# MeToo effect in Swedish forestry education. Scand. J. For. Res. 2020, 35, 308–318. [Google Scholar] [CrossRef]
  25. Bal, T.L.; Rouleau, M.D.; Sharik, T.L.; Wellstead, A.M. Enrollment decision-making by students in forestry and related natural resource degree programmes globally. Int. For. Rev. 2020, 22, 287–305. [Google Scholar] [CrossRef]
  26. Arevalo, J.; Pitknen, S.; Gritten, D.; Tahvanainen, L. Market-relevant competencies for professional foresters in European graduate education. Int. For. Rev. 2010, 12, 200–208. [Google Scholar] [CrossRef]
  27. Innes, J.L.; Ward, D. Professional education in forestry. Commonw. For. 2010, 5, 76–93. Available online: https://www.cfa-international.org/docs/Commonwealth%20Forests%202010/cfa_layout_web_chapter5.pdf (accessed on 1 August 2024).
  28. Ratnasingam, J.; IoRAS, F.; Vacalie, C.C.; Wenming, L. The future of professional forestry education: Trends and challenges from the Malaysian perspective. Not. Bot. Horti Agrobot. Cluj-Napoca 2013, 41, 12–20. [Google Scholar] [CrossRef]
  29. Innes, J.L. Challenges facing forest educators in North America. For. Sci. Technol. 2005, 1, 127–134. [Google Scholar] [CrossRef]
  30. Praslova, L. Adaptation of Kirkpatrick’s four level model of training criteria to assessment of learning outcomes and program evaluation in higher education. Educ. Assess. Eval. Account. 2010, 22, 215–225. [Google Scholar] [CrossRef]
  31. Van Herk, H.; Poortinga, Y.H.; Verhallen, T.M. Response styles in rating scales: Evidence of method bias in data from six EU countries. J. Cross-Cult. Psychol. 2004, 35, 346–360. [Google Scholar] [CrossRef]
  32. Fischer, R. Standardization to account for cross-cultural response bias: A classification of score adjustment procedures and review of research in JCCP. J. Cross-Cult. Psychol. 2004, 35, 263–282. [Google Scholar] [CrossRef]
  33. Rocereto, J.F.; Puzakova, M.; Anderson, R.E.; Kwak, H. The role of response formats on extreme response style: A case of Likert-type vs. semantic differential scales. In Measurement and Research Methods in International Marketing; Emerald Group Publishing Limited: Bingley, UK, 2011; pp. 53–71. [Google Scholar] [CrossRef]
  34. Funk, C.; Tyson, A.; Kennedy, B.; Johnson, C. Science and Scientists Held in High Esteem across Global Publics. Pew Research Center, 29 September 2020. Available online: https://www.pewresearch.org/science/2020/09/29/science-and-scientists-held-in-high-esteem-across-global-publics/ (accessed on 1 August 2024).
  35. Koshy, P.; Cabalu, H.; Valencia, V. Higher education and the importance of values: Evidence from the World Values Survey. High. Educ. 2023, 85, 1401–1426. [Google Scholar] [CrossRef]
  36. Kostilainena, A. A perspective of the students of higher forestry education. For. Sci. Technol. 2005, 1, 224–227. [Google Scholar] [CrossRef]
  37. Parrotta, J.A.; Agnoletti, M. Traditional forest knowledge: Challenges and opportunities. For. Ecol. Manag. 2007, 249, 1–4. [Google Scholar] [CrossRef]
  38. Andersen, F.; Konijnendijk, C.C.; Randrup, T.B.; Thomas, B. Higher education on urban forestry in Europe: An over-view. Forestry 2002, 75, 501–511. [Google Scholar] [CrossRef]
  39. Leslie, A.D.; Wilson, E.R.; Starr, C.B. The current state of professional forestry education in the United Kingdom. Int. For. Rev. 2006, 8, 339–349. [Google Scholar] [CrossRef]
  40. Li, S.; Yuan, F. (Eds.) Growing Higher Forestry Education in a Changing World: Analysis of Higher Forestry Education in the Asia-Pacific Region; University of British Columbia-APFNet: Vancouver, BC, Canada, 2017. [Google Scholar]
  41. RECOFTC & ASEAN Working Group for Social Forestry (AWG-SF). Social Forestry Education in ASEAN: An As-Sessment of Current Practices and Recommendations for the Future; RECOFTC: Bangkok, Thailand, 2020; Volume 5, p. 27. Available online: www.recoftc.org/publications/0000366 (accessed on 5 February 2024).
  42. Varblane, U.; Mets, T. Entrepreneurship education in the higher education institutions (HEIs) of post-communist European countries. J. Enterprising Communities People Places Glob. Econ. 2010, 4, 204–219. [Google Scholar] [CrossRef]
  43. Follo, G. A hero’s journey: Young women among males in forestry education. J. Rural Stud. 2002, 18, 293–306. [Google Scholar] [CrossRef]
  44. Cogos, S.; Östlund, L.; Roturier, S. Forest fire and indigenous Sami land use: Place names, fire dynamics, and eco-system change in Northern Scandinavia. Hum. Ecol. 2019, 47, 51–64. [Google Scholar] [CrossRef]
  45. Razak, M.A.; Norini, H.; Krishnapillay, B. Forestry research and education in Malaysia. For. Sci. Technol. 2005, 1, 176–184. [Google Scholar] [CrossRef]
  46. Arevalo, J.; Mola-Yudego, B.; Pelkonen, P.; Qu, M. Students’ views on forestry education: A cross-national comparison across three universities in Brazil, China and Finland. For. Policy Econ. 2012, 25, 123–131. [Google Scholar] [CrossRef]
  47. Dyer, C.; Wingfield, M.J. Challenges and strategies facing forest research and education for the 21st century: A case study from South Africa. For. Sci. Technol. 2005, 1, 135–141. [Google Scholar] [CrossRef]
  48. Temu, A.B.; Okali, D.; Bishaw, B. Forestry education, training and professional development in Africa. Int. For. Rev. 2006, 8, 118–125. [Google Scholar] [CrossRef]
  49. Temu, A.B. Future Forestry Education: Responding to Expanding Societal Needs; World Agroforestry Centre: Nairobi, Kenya, 2008; Volume 44. [Google Scholar]
  50. Kanowski, P.J. Internationalizing forestry education. J. For. 2015, 113, 574–578. [Google Scholar] [CrossRef]
  51. Hossain, M.; Park, S.; Shahid, S. Frugal innovation for sustainable rural development. Technol. Forecast. Soc. Chang. 2023, 193, 122662. [Google Scholar] [CrossRef]
  52. Wiley, D.; Bliss, T.J.; McEwen, M. Open educational resources: A review of the literature. In Handbook of Re-Search on Educational Communications and Technology; Springer: Berlin/Heidelberg, Germany, 2014; pp. 781–789. [Google Scholar] [CrossRef]
  53. Otto, D.; Schroeder, N.; Diekmann, D.; Sander, P. Trends and gaps in empirical research on open educational resources (OER): A systematic mapping of the literature from 2015 to 2019. Contemp. Educ. Technol. 2021, 13, ep325. [Google Scholar] [CrossRef]
  54. Luo, T.; Hostetler, K.; Freeman, C.; Stefaniak, J. The power of open: Benefits, barriers, and strategies for integration of open educational resources. Open Learn. J. Open Distance e-Learn. 2019, 35, 140–158. [Google Scholar] [CrossRef]
  55. Verma, P.; Vaughan, K.; Martin, K.; Pulitano, E.; Garrett, J.; Piirto, D.D. Integrating indigenous knowledge and western science into forestry, natural resources, and environmental programs. J. For. 2016, 114, 648–655. [Google Scholar] [CrossRef]
Figure 1. Theoretical framework of the study.
Forests 15 01360 g001
Figure 2. The teaching themes are presented in descending order, starting from the theme with the highest proportion of inadequately covered responses. Abbreviations: G = global, AF = Africa, AP = Asia and the Pacific, EU = Europe and Central Asia, LA = Latin America and the Caribbean, NA = North America. FR&E = Forest resources and ecology, FP&M = Forest planning and management, FS&CI = Forest services and cultural issues, FE = Forest enterprise, GE = Generic Skills, OS = Other skills.
Forests 15 01360 g002
Figure 3. The regions are ordered so that the average of all regions (global) is at the bottom of the table with bolded edges, followed by the regions in descending order of ‘very much’ responses. Abbreviations: G = global, AF = Africa, AP = Asia and the Pacific, EU = Europe and Central Asia, LA = Latin America and the Caribbean, NA = North America, T = Teachers (quality and quantity of educators), LM = Learning materials (e.g., textbooks, online learning materials, tools or applications), EE = Educational environment (e.g., laboratory access, class sizes), PO = Practical opportunities (e.g., experiential learning, practical training, field visits), A = All teaching resources combined.
Forests 15 01360 g003
Figure 4. Responses containing the option ‘inadequately covered’ (%). The figure shows the proportion of responses containing the option ‘inadequately covered’ for each topic area analyzed, by respondent group (professionals, teachers and students) in Africa.
Forests 15 01360 g004
Figure 5. Responses containing the option ‘inadequately covered’ (%). The figure shows the proportions of responses containing the option ‘inadequately covered’ for each topic area analyzed, by respondent group (professionals, teachers and students) in Asia and the Pacific.
Forests 15 01360 g005
Figure 6. Responses containing the option ‘inadequately covered’ (%). The figure shows the proportions of responses containing the option ‘inadequately covered’ for each topic area analyzed, by respondent group (professionals, teachers and students) in Europe and Central Asia.
Forests 15 01360 g006
Figure 7. Responses containing the option ‘inadequately covered’ (%). The figure shows the proportions of responses containing the option ‘inadequately covered’ for each topic area analyzed, by respondent group (professionals, teachers and students) in Latin America and the Caribbean.
Forests 15 01360 g007
Figure 8. Responses containing the option ‘inadequately covered’ (%). The figure shows the proportions of responses containing the option ‘inadequately covered’ for each topic area analyzed, by respondent group (professionals, teachers and students) in North America.
Forests 15 01360 g008
Table 1. Number of respondents and responses for each study region. AF = Africa, AP = Asia and the Pacific, EC = Europe and Central Asia, LA = Latin America and the Caribbean, NA = North America.
Responses Respondents
RegionsBachelor’s Master’sPhd Professionals Teachers Students All Respondents *
AF 33716537137129130396
AP 24022248336146113595
EC 15326454171173119463
LA 59332197255339276870
NA 22418827145159187491
All 1547116026310449468252815
* The differences in the totals for the different levels of education and respondent groups are explained by the technical implementation of the survey. Each respondent had to choose which respondent group he or she belonged to, and was able to respond to as many levels of qualification as he or she wanted. As a result, there are more responses per level of education in the data than there are respondents in the total.
Table 2. Curriculum themes and topics and skills.
Theme Topics and Skills
Forest resources and ecology (FE) Forest biodiversity (plants, animals, ecosystems), Forest soils, Forest ecology, Wood and non-wood forest products, Forest genetic resources
Forest/tree planning and management (FP&M) Forests and climate change, “Forest mapping, inventory, remote sensing, GIS”, Forest planning, Silviculture, Forest landscape restoration, Range management, Sustainable harvesting systems, Agroforestry, Watershed management, Wildlife management, Forest health (pests and diseases), Forest fire management, Forest conservation, Urban forestry
Forest services and cultural issues (FS&CI) Wood as renewable energy, Forest-based recreation, traditional and/or indigenous forest-related knowledge, Cultural values of forests and trees, Forests and human health, Forests, trees and gender issues, Forest, trees and race/ethnicity issues
Forest enterprise (FE) Entrepreneurship, “Forest industry, marketing and management”, Wood technology, Small-scale forest enterprise (wood and non-wood)
Generic skills (GS) STEM (science, technology, engineering, math), Critical thinking and analytical skills, Creative thinking, Information management skills, Collaboration and teamwork, Leadership and management, Communication (e.g., writing, oral, digital communication)
Other skills (OS) Research skills, Scientific writing, Practical field skills, Professional ethics
Table 3. Results of the statistical test for the rate of inadequately covered responses to different teaching themes.
p-ValueForest Resources and Forest EcologyForest/Tree Planning and ManagementForest Services and Cultural and Social IssuesForest EnterpriseGeneric SkillsOther Skills
NA-EC1.85.2 *2.4 ***0.16.7 *5.3 *
NA-LA5.5 *10.4 *8.9 *2.6 **9.8 *7.0 *
NA-AP1.55.6 *2.4 ***3.3 **7.7 *5.9 *
NA-AF2.9 ***5.1 *1.23.8 *8.5 *6.5 *
EC-LA3.4 *4.8 *6.2 *2.8 **1.70.5
EC-AP−0.21.00.13.5 *1.30.7
EC-AF1.30.81.04 *2.4 ***1.4
LA-AP−3.5 *−3.4 **−5.9 *1.6−0.10.4
LA-AF−1.6−3.1 *−6.8 *2.2 ***1.31.3
AP-AF1.40.0−1.10.61.10.7
p-value classes: * ≤ 0.001, ** ≤ 0.01–0.001, *** ≥ 0.01–0.05. Abbreviations: AF = Africa, AP = Asia and the Pacific, EC = Europe and Central Asia, LA = Latin America and the Caribbean, NA = North America.
Table 4. Results of the statistical test in negative responses to teaching resource availability.
Regions TeachersLearning MaterialsEducational EnvironmentPractical Opportunities
NA-EC5.2 *5.2 *3.8 *3.6 *
NA-LA6.8 *7.9 *8.3 *5.7 *
NA-AP7.7 *8.9 *9.8 *7.7 *
NA-AF8.0 *12.7 *13.2 *10.2 *
EC-LA1.62.9 **4.6 *1.9 ***
EC-AP2.2 ***3.8 *6.0 *3.6 *
EC-AF3.0 **8.1 *9.7 *6.6 *
LA-AP−0.4−0.6−1.0−1.5
LA-AF1.25.9 *5.5 *4.2 *
AP-AF1.45.6*5.5 *4.8 *
p-value classes: * ≤ 0.001, ** ≤ 0.01–0.001, *** ≥ 0.01–0.05. Abbreviations: AF = Africa, AP = Asia and the Pacific, EC = Europe and Central Asia, LA = Latin America and the Caribbean, NA = North America.
Disclaimer/Publisher’s Note: The statements, opinions and data contained in all publications are solely those of the individual author(s) and contributor(s) and not of MDPI and/or the editor(s). MDPI and/or the editor(s) disclaim responsibility for any injury to people or property resulting from any ideas, methods, instructions or products referred to in the content.

