Article

Seasonal Variations in Hydraulic Regulation of Whole-Tree Transpiration in Mongolian Pine Plantations: Insights from Semiarid Deserts in Northern China

1
College of Forestry, Shenyang Agricultural University, Shenyang 110866, China
2
Key Laboratory of Forest Tree Genetics and Breeding of Liaoning Province, Shenyang 110866, China
3
Liaoning Fengyu Ecological Technology Co., Ltd., Shenyang 110167, China
4
Land Consolidation and Rehabilitation Center, Ministry of Natural Resources, Beijing 100035, China
5
Yanchi Research Station, School of Soil and Water Conservation, Beijing Forestry University, Beijing 100083, China
6
Key Laboratory of State Forestry and Grassland Administration on Soil and Water Conservation, Beijing Forestry University, Beijing 100083, China
7
Jilin Provincial Academy of Forestry Science, Changchun 130033, China
*
Authors to whom correspondence should be addressed.
Forests 2024, 15(8), 1367; https://doi.org/10.3390/f15081367
Submission received: 7 June 2024 / Revised: 25 July 2024 / Accepted: 3 August 2024 / Published: 6 August 2024
(This article belongs to the Special Issue Pathways to “Carbon Neutralization” in Forest Ecosystems)

Abstract

:
Seasonal precipitation variance significantly alters soil water content, potentially inducing water stress and affecting plant transpiration in semiarid deserts. This study explored the effects of environmental variables and hydraulic conductance on whole-tree transpiration (ET) in Mongolian pines (Pinus sylvestris var. mongolica) across different forest stages in the semiarid deserts of Northern China. We measured ET using sap flow in mature (MMP), half-mature (HMP), and young (YMP) Mongolian pine plantations. Measurements included soil-leaf water potential difference (ΔΨ), atmospheric conditions, and soil moisture contents on sunny days, both in dry and wet periods. Seasonally variable rainfall distinctly affected soil moisture; during the dry periods, both stomatal and hydraulic conductance influenced ET, whereas stomatal conductance primarily regulated it during the wet periods. Discrepancies between predicted and measured ET were noticed: compared to the predicted ET, the measured ET was lower during dry periods while higher during wet periods. Hydraulic conductance (KT) increased with tree height (H) and ΔΨ. The KT values in the dry period were lower than those in the wet period, indicating that the hydraulic resistance in the dry period was higher. The hydraulic compensation occurred and was observed between 11:00 and 13:00, aligned with increased hydraulic resistance during dry periods. Decreasing hydraulic conductance intensified leaf water stress in dry periods, especially when photosynthetically active radiation (PAR) and vapor pressure deficit (VPD) were heightened, potentially increasing stomatal sensitivity to drought, promoting water conservation and plant survival. A linear relationship between predawn and midday leaf water potentials was noticed, indicating extreme anisohydric behavior across forest stages during dry and wet periods. Although stomatal and hydraulic conductance influenced ET during the dry period, MMP and YMP were more susceptible to drought conditions. Understanding these dynamics could help evaluate semiarid desert ecological functions for water conservation amidst uneven seasonal precipitation in Northern China.

1. Introduction

Drought significantly affects the distribution of tree species in semiarid deserts [1,2,3]. Climate projections for the next decade indicate increased dryness in this region [4,5], potentially impacting global forest ecosystems and ecosystem services [6], reducing terrestrial net productivity [7], and altering carbon dynamics [8]. China grapples with desertification in vast areas (approximately 2.61 billion ha) due to high human population density and limited natural resources [9,10]. Mu Us (107°20–111°30 E, 37°30–39°20 N) and Horqin (118°35–123°30 E, 42°21–42°21 N) deserts in Northern China face soil erosion and sand drift issues [10,11,12]. In recent decades, soil restoration and sand transformation methods, including mechanical sand barriers [13], biological soil crusts [14], and afforestation [15], have been implemented. These artificial plantations have been successfully established as a feasible method of environmental management for desertification control in the Mu Us and Horqin Deserts [16,17,18].
Scots pine, widely distributed globally, thrives primarily in boreal regions. It also occupies large areas in relatively dry regions within the Mediterranean basin, from the Iberian Peninsula to Turkey and North China, in Europe, including Spain, Italy, Netherlands, Scotland, France, Poland, and countries like Finland at higher latitudes [16,19]. Mongolian pine (Pinus sylvestris var. mongolica) is a major shelterbelt tree species in the desert that has been largely introduced to Northern China (121°11–127°10 E, 50°10–53°33 N) [20]. The planted forest cover in the desert currently spans 7.0 × 10⁵ ha in Northern China [21]. This wide range offers an ideal opportunity to study the geographic variabilities in the hydraulic properties of Mongolian pine [19]. Beyond its economic and landscape importance, Mongolian pine inevitably encounters diverse environmental conditions within its habitat [17]. Under drought conditions, P. mongolica adjusts its leaf-to-sapwood area ratio, hydraulic conductivity, total leaf area, etc. [19]. Although the artificial plantations have adapted well, signs of slowed growth and dieback have been observed in Mongolian pine growth [22]. Projected climate change may push the semiarid area beyond the species’ ecological niche [23]. These concerns have led researchers to attribute the massive degeneration of P. mongolica to a high transpiration rate, uneven precipitation distribution, and the limitations posed by the natural rainfall patterns in the region [21,24].
Plants inevitably lose water through their stomata during carbon assimilation, which must be compensated for by water uptake from the roots to the leaves against negative hydrostatic pressure [25]. Prolonged and severe water scarcity causes the collapse of the plant hydraulic system, leading to tree mortality [26]. However, plants can partly cope with water limitations by applying physiological adaptation across the soil-plant-atmosphere continuum [27]. These physiological adaptations include adjustments in whole-tree hydraulic conductance (KT), increased water storage, nocturnal sap flow refilling, and regulation of transpiration (e.g., decreasing the leaf-sapwood area ratio or increasing the sensitivity of stomata to vapor pressure deficit (VPD)) [19]. This concept can also be defined as isohydric/anisohydric behavior [28,29,30]. Only a few studies have focused on assessing the variability of these hydraulic traits, plant water regulation, or water-use strategies, especially in Mongolian pine tree species [17,31,32,33,34,35,36,37,38,39].
The uneven distribution of precipitation (P) over time significantly alters forest soil moisture between dry and wet periods and likely causes water stress during the dry period [21,40,41]. According to the dynamic resistance-potential hypothesis, in moist soils, plant resistance is initially slightly greater than soil resistance, plant hydraulic resistance is a function of leaf water potential, and stomata operate to maximize sap flow. Thus, plant resistance varies hourly, whereas soil resistance is strongly linked to soil water status and varies seasonally [42]. Larger trees are increasingly vulnerable to cavitation as vessel/tracheid sizes increase; however, there is no difference in vulnerability for leaves at different heights within a single tree [42]. However, by adjusting hydraulic conductivity, trees regulate excessive stomatal closure under available light resources [43,44,45]. This ensures adequate CO2 absorption and moderate growth, and this compensatory effect of hydraulic conductivity on transpiration serves as an important ecological strategy for forest tree species to adapt to soil water stress in the dry season while optimizing light resources [46,47,48,49]. However, the effectiveness and safety of the water transport structures cannot be achieved for most tree species [19,50].
Although it is hypothesized that plants can adjust hydraulic conductivity to offset transpiration, few studies have explored the link between hydraulic characteristics and water transport compensation in arid environments. Most studies focus on hydraulic compensation under specific conditions like tree height (H) and leaf loss [51,52,53]. For example, research on coniferous forests in the Rocky Mountains indicates that the rise in H completed during the late succession period offsets the increasing hydraulic constraints. In contrast, species in the early succession period can only partially counteract the impact of H [54]. The hurricane caused a 41% decrease in the leaf area of Taxodium distichum and only an 18% decrease in sap flow density and tree transpiration, and plants properly adjusted their hydraulic conductivity to compensate for the transpiration [54]. The leaf area of 8-year-old loblolly pine (Pinus taeda L.) trees, a shade-intolerant pioneer species common in the Southeastern USA, was reduced by 55%, whereas transpiration was still fully compensated [55].
Two key questions regarding this species remain unanswered: (1) How does hydraulic compensation impact Mongolian pine plantations in arid regions? (2) If the phenomenon of hydraulic compensation exists, what are the mechanisms for regulating plant water relations under seasonal changes (i.e., isohydric vs. anisohydric)? During these experiments, three different stands (mature (MMP), half-mature (HMP), and young (YMP) forest) were assessed. We measured sap fluxes (Section 2.1) in dry and wet seasons based on regional precipitation characteristics. The stands varied in age and climate; thus, comparing the results across stands becomes difficult. These stands conformed to the reasonable afforestation densities of P. sylvestris, potentially impacting sap fluxes beyond forest management based on the forest water balance, forest age, and the main meteorological factors according to previous studies [56,57]. Moreover, in our experimental sites, soil nutrient statuses were at normal levels (organic content in MMP, HMP, and YMP: 2.50 ± 0.32%, 2.81 ± 0.41%, and 3.00 ± 0.23%; total nitrogen content: 0.093 ± 0.016%, 1.06 ± 0.021%, and 1.12 ± 0.019%, respectively) [17]. Therefore, environmental variables did not restrict plant transpiration, and thus, the sap fluxes of P. sylvestris may not be restricted to the forest management and confounding age effects. In this study, we hypothesized that: (1) P. sylvestris should demonstrate higher transpiration rates in the wet period than in the dry period, especially in MMP and YMP, whereas HMP maintains a certain level of transpiration due to more uniformly distributed precipitation throughout the growing season. Even during the dry period, MMP, with its larger tree size, should retain substantial transpiration through nocturnal transpiration. Similarly, YMP should maintain a consistent transpiration rate due to the higher air temperature (Ta) and evaporative demand in its introduction region. (2) During the wet period, P. sylvestris faces stomatal limitation, while in the dry period, transpiration is co-regulated by hydraulic and stomatal factors. This means that P. sylvestris can adjust its hydraulic conductivity to manage water stress under certain stomatal controls. The compensatory effect of KT on stomatal-limited transpiration is notable. Considering recent studies indicate that P. sylvestris exhibits stomatal conductance highly sensitive to VPD, the canopy and atmosphere are highly coupled, and stomata exhibit more control over transpiration [17], we hypothesized that (3) P. sylvestris is an anisohydric plant during the wet period. In contrast, isohydric behavior should be observed during the dry period.

2. Materials and Methods

2.1. Study Sites

The Magu Forest Ecosystem Research Station (123°32′ E–124°26′ E, 42°33′ N–43°29′ N), the Rare Psammophytes Protection Botanical Base (109°42′54″ E, 38°20′11″ N) and the Ningxia Yanchi Research Station of State Forestry Administration (106°300′ E–107°410′ E, 37°04′ N–38°10′ N) were surveyed separately in this research (Figure 1). Three observation stations represented the three different stand ages of Mongolian pine plantations, with a mature forest (MMP; stand age, 45 y; stand density, 275 trees ha−1), half-mature forest (HMP; stand age, 30 y; stand density, 1475 trees ha−1), and young forest (YMP; stand age, 11 y; stand density, 850 trees ha−1). The plot area of the MMP is 10,000 m2, the HMP is 900 m2, and the YMP is 900 m2. Mongolian pine is a geographical variety of Scots pine (Pinus sylvestris L.) distributed in Northeast Asia. It is classified into two ecotypes according to preferred habitat: an ecotype adapted to mountain habitats and another adapted to fixed dunes; the latter ecotype, known as Sandy Land Mongolian Pine, is restricted to a forest belt of ca. 200 km in length and 14–20 km in width in the fixed dunes of NE China [1]. This Sandy Land Mongolian Pine tree species was first introduced for sand fixation in the 1950s in the Horqin sandy land of China because of its strong adaptation to deep sandy soils [20,22]; its seedlings were widely cultivated in the Zhanggutai region, Liaoning Province of the southeastern Horqin Sandy Region, at that time. These saplings were then widely distributed to research centers, related enterprises, local authorities, and tree growers in NE China, including the Rare Psammophytes Protection Botanical Base in the southern Mu Us Desert region. Thus, in this study, the seed source originated from the same region of provenance for the MMP, HMP, and YMP. The area of MMP is dominated by a continental, monsoon-influenced semi-arid climate where mean P is 420 mm, mean Ta is 7.9 °C, the annual evaporation is 1078 mm, and the landscape is characterized by fixed dunes, which consist of areas with dark brown forest soil and eolian sandy soil; the area of HMP has a semi-arid continental climate, mean P is 400 mm, mean Ta is 8.7 °C, and the landscape is characterized by fixed desert, with eolian sandy soil; the area of YMP has a semi-arid continental monsoonal climate of the mid-temperate zone, mean P is 300 mm, annual potential evaporation averages 1273 mm, and the landscape is characterized by dark loessial, eolian sandy, and sierozem soils [17].

2.2. Sap Flow and Leaf Area/Sapwood Area

Sap flow observations were conducted from 1 May to 20 October at the study sites (MMP in 2018, HMP in 2014, and YMP in 2012). Nine, nine, and three tree samples were selected, and the minimum, maximum, and mean diameter at breast height (DBH) values of the selected sampled tree traits in the MMP, HMP, and YMP are shown in Table 1.
The sap flux densities (Js, g cm−2 s−1) were measured using Granier-type thermal dissipation probes [58] in the MMP and HMP. Each sensor consisted of a pair of probes, 20 mm long and 2 mm in diameter, and a copper-constantan thermocouple, which was inserted into the sapwood (on the north-facing side of the sampled trees, into the tree trunk at the height of 1.3 m above the ground) [59]. The upper probe included a heater with a constant power of 0.15 W, and the lower probe was unheated as a reference [60]. The temperature difference between the upper and lower probes (ΔTa, °C) was measured every 10 s, and 15-min averages were recorded on a data logger (CR1000; Campbell Scientific Inc., Logan, UT, USA) with a multiplexer (AM16/32A; Campbell Scientific). Js was calculated in the following Equation (1):
J s = 0.0119 × ( Δ T a max Δ T a Δ T a ) 1.231
where ΔTa max (°C) is the maximum temperature difference between the sensors when Js is close to 0 [58,61].
Model SGB25 gauges (Flow32 m; Dynamax Inc., Houston, TX, USA) were applied to the stems of the YMP. Data were recorded at 10 s intervals and stored as 15-min averages using a CR1000 data logger (Campbell Scientific) [11]. Js was calculated as in the following Equation (2):
J s = Q f c p × ( Δ T )
where Qf is the energy of the sap flow and cp is the specific heat of water (4.168 J g °C−1) [62]. Total tree water consumption (ET, kg d−1) was estimated directly by multiplying Js by the sapwood area (SA, cm2) [17]. The DBH was measured 1.3 m above the ground using a DBH ruler, and the tree core samples were obtained using an increment borer. The total SA for the MMP, HMP, and YMP plots were calculated as 99,000, 27,141, and 1338 cm2, respectively. The LAI (m2 m−2) was determined to be 1.42, 1.54, and 0.96 m2 m−2 in the MMP, HMP, and YMP, respectively. Whole-tree leaf area/sapwood area ratio (AL:AS; m2 cm−2) was obtained from five or six trees per site, and mean AL:AS was 0.14, 0.095, 0.23 m2 cm−2 in the MMP, HMP, and YMP, respectively.

2.3. Leaf and Soil Water Potentials

Leaf water potential measurements were taken under sunny days for the MMP plot on 20 and 21 May, 2 and 3 June, 25 July, 23 August, 6 and 7 September, and 12 and 13 October. For the HMP plot on 19 and 20 May, 2 and 13 June, 15 and 17 August, 6 and 12 September, and 13 and 14 October. For the YMP plot on 5 and 13 May, 5 and 8 June, 24 and 28 August, 4 and 8 September, and 11 and 12 October. We harvested sun-exposed branches using a pruning hook and immediately picked leaves from the branches. Leaf water potential (ΨL, MPa) was measured using a PMS pressure chamber (PMS Instruments, Albany, OR, USA) immediately after leaf removal. Soil water potentials (ΨS, MPa) were investigated using five multi-voltmeter sensors (HR33T, Wescor, Inc., South Logan, UT, USA). The ΨL and ΨS were measured between 05:00 h and 20:00 h at 1 h intervals.

2.4. Hydraulic Conductance

The hydraulic conductance of the soil/root/leaf pathway was determined as in the following Equation (3):
K T = E T S A × ( Δ ψ h × ρ w × g )
where ΔΨ is the difference between soil water potential and plant water potential and ET is the amount of water lost through transpiration at the time when plant water potential was determined, g represents the acceleration of gravity (N kg−1), h represents the xylem length from root to tree canopy, ρw represents water density (kg m3), KT was normalized to whole-plant stem-specific hydraulic conductance (kg m−2 s−1 MPa) [63,64,65]. This equation is useful for exploring the significance of the interrelationships among stomatal conductance, soil and leaf water potentials, and plant hydraulic conductance [66,67].

2.5. Environmental Variables

In the MMP plot, an automatic weather station was located approximately 85 m from the studied plot. The mean Ta (°C), P (mm), RH (%), and PAR (µmol s−2 m−2) were measured by the automatic weather station at a height of 15 m. In the HMP plot, meteorological data were collected using a water vapor flux tower, which was 30.0 m high and located 75.0 m away from the surveyed plot. The water vapor flux tower measured PAR, Ta, RH, barometric pressure, and P (Campbell Scientific). P was collected at a height of 25 m, whereas other meteorological data were collected at 14 m above the ground. At the MMP and HMP study sites, 0–100 cm soil profile samples were collected every 15 d, and additional measurements were taken after each P event. For the YMP plot, meteorological data were obtained using a meteorological monitoring station (Campbell Scientific) that measured the PAR, RH, P, and Ta. The soil volumetric content (cm3 cm−3) was measured using a soil volumetric moisture detector (HH2 Soil Moisture Probe type ML2x and Meter type HH2; Dynamax Inc., Burwell, Cambridge, UK).
VPD was calculated by combining Ta and RH as follows:
V P D = a × exp [ b × T a ( T a + c ) ] × ( 1 R H )
where a is 0.611 KPa, b is 17.502, and c is 240.97 °C [17,68].

2.6. Hydraulic Compensation

The theoretical basis for hydraulic compensation is presented in Equation (5): A similar derivation of Darcy’s Law for stomatal conductance (gs, m s−1) can be written in which the soil-to-leaf water potential difference (∆Ψ, MPa) is explicit [69].
g s = K T × A S × Ψ H × η × A L × V P D
where the effect of gravity at a given tree height (H, m), η (kg m−1 s−1) is the dynamic viscosity. Notably, the leaf area does not have to be correlated 1:1 with sap flow or transpiration; the transpiration rates are not uniform throughout the crown as part of it is shaded [54]; therefore, the decrease in leaf area could also increase the penetrating irradiance and the turbulent wind speed throughout the crown, thus disturbing the boundary layer of leaves and increasing transpiration. Moreover, the scholars concluded that the compensation was due to increased stomatal conductance and not hydraulic conductivity [54]. Thus, in this study, the stomatal conductance derived from gas-exchange measurements is not equal to the hydraulic conductance derived from the following equation:
J s = T r = Ω E e q + ( 1 Ω ) E i m p = g s × V P D
In a previous study, researchers stated that under steady-state conditions characterized by negligible boundary-layer resistance and low hydraulic capacitance, Js may be equated to the leaf-level transpiration rate (Tr, g cm−2 s−1), which is further linked to gs [70] (see in Equation (6)). Eeq is the transpiration rate obtained in equilibrium with an extensive, homogeneous wet surface and a good energy balance, which is dominated by the airflow on the canopy, and Eimp is the transpiration rate affected by the VPD [67]: The extent of canopy decoupling from the atmosphere can be described by a dimensionless coefficient (Ω) that expresses the relative sensitivity of canopy transpiration to marginal changes in gs [71]. In the previous study mentioned above, P. sylvestris was coupled with atmospheric conditions [17], Ω values were too little to be neglected, and Js is directly linked to the gs. The formula was modified to the following Equation (7):
J s V P D ~ E T V P D ~ g s = K T × A S × Ψ H × η × A L × V P D
In this case, the denominator from Equation (7) is expressed as ∆Ψ/H, the soil-to-leaf water potential gradient, and all other variables are defined as above. This derivation shows that similar to KT, Js, and ET are inversely related to height if all other variables remain constant. However, if the other variables do not remain constant, compensation for H may occur. Increasing KT may balance the effect of H on KT; additionally, increasing ∆Ψ may balance the effect of H on gs/Js/ET-limited transpiration [46].
To further quantify the hydraulic compensation values, the relationships of measured ET(M-ET) with ΔΨ and AL, AS were established as functional relationship models (ET = f(∆Ψ, AL, AS)) for both the dry and wet periods separately. The estimated transpiration values (P-ET) at the corresponding time were obtained by substituting ∆Ψ and AL, AS into the former functional relationship models. Hydraulic compensation usually occurs from early noon to late afternoon when PAR and VPD values reach their maximum. Plants can avoid excessive stomatal closure by adjusting hydraulic conductivity, which may compensate for transpiration. Therefore, changes in whole-tree transpiration, since the maximum PAR and VPD values were obtained (the time interval was 1.0 h), reflect the response sensitivity of whole-tree transpiration to hydraulic conductivity and may represent the transpiration amount due to the hydraulic compensation effect. Specifically, if ΔET does not have a significant relationship with KT, transpiration is mainly limited by gs; in contrast, if they have a 1:1 linear relationship, transpiration is primarily controlled by KT. Otherwise, if they have a non-linear relationship, transpiration is co-regulated by gs and KT; that is, KT has a compensatory effect on gs-limited transpiration.

2.7. Plant Water Transport Regulation: Isohydric/Anisohydric Behaviors

Plants require effective mechanisms to regulate water transport at a variety of scales. Here, we adopted a theoretical framework describing plant responses to drying soil based on the relationship between midday (12:00 h) and pre-dawn (05:00–06:00 h) soil water potential. The intercept of the relationship (Λ) characterizes the maximum transpiration rate per unit of hydraulic transport capacity, whereas the slope (δ) measures the relative sensitivity of the transpiration rate and plant hydraulic conductance to declining water availability [27].
According to the theoretical model above, the relationship between the pre-dawn soil and midday water potentials is linear. Four different behaviors are depicted, all sharing the same intercept (Λ): strict isohydric (δ = 0), partial isohydric (0 < δ < 1), strict anisohydric (δ = 1), and extreme anisohydric (δ > 1). For isohydric behaviors, Ψpre-dawn = Ψmidday, while for anisohydric relationships, Ψmidday represents the point at which plant hydraulic conductance is completely lost [27]. Importantly, Isohydric species are characterized by tighter stomatal closure, whereas anisohydric species are characterized by avoidance of complete stomatal closure [72].
Statistical analyses were conducted using SPSS software version 22.0 (SPSS Inc., Chicago, IL, USA). SciDAVis (DHI Group, Inc., New York, NY, USA) was used to draw all figures.

3. Results

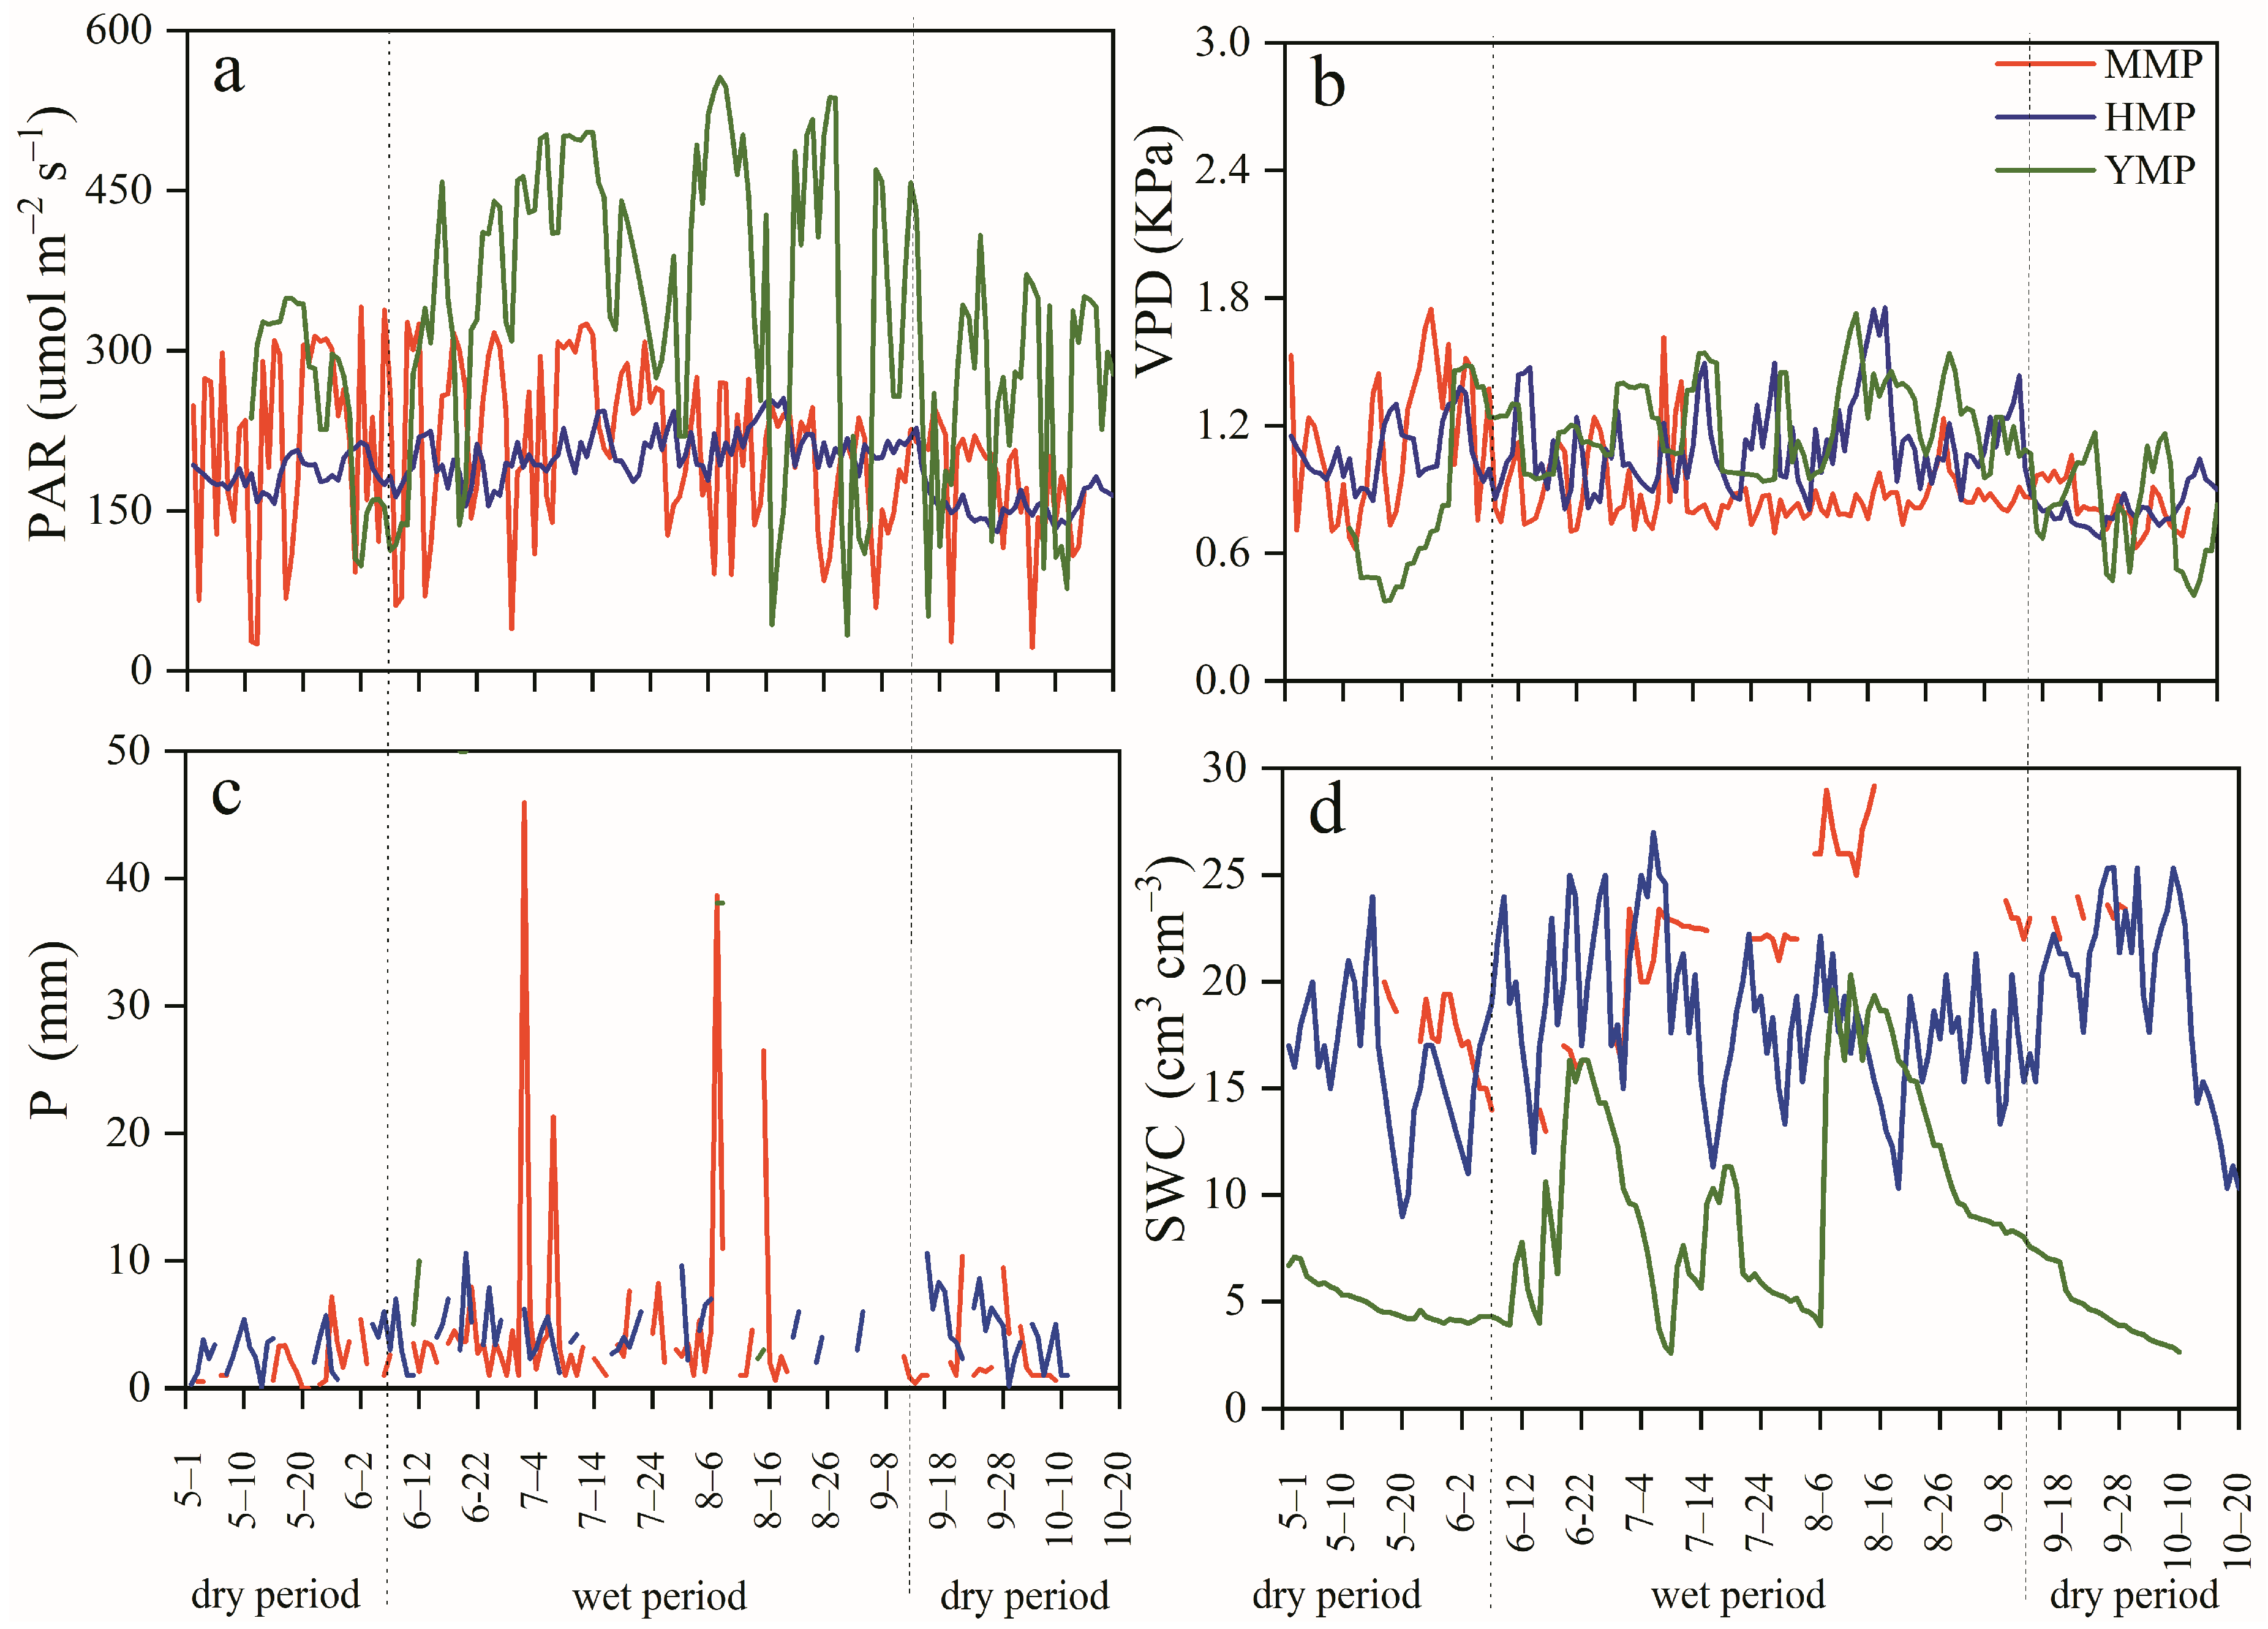
3.1. Atmospheric and Soil Moisture Changes

All environmental factors indicated distinct but similar seasonal changes in the MMP, HMP, and YMP. According to the precipitation characteristics, the growing season (from 1 May to 20 October) was divided into dry (1 May to 10 June and 15 September to 20 October) and wet (11 June to 14 September) periods. Over the whole growing season, the daily PAR averaged 207.09, 190.45, and 322.17 μmol m s−1 for the MMP, HMP, and YMP, respectively (Figure 2a). The daily mean VPD averaged 0.93, 1.04, and 1.05 kPa for MMP, HMP, and YMP, respectively (Figure 2b). The accumulated P over the entire study period was 274.8, 387.1, and 402.5 mm in MMP, HMP, and YMP, respectively (Figure 2c). SWC ranged from 2.60 to 20.33 cm3 cm−3 for MMP, 9.00 to 27.00 cm3 cm−3 for HMP, and 12.00 to 29.20 cm3 cm−3 for YMP (Figure 2d). In the dry period, the daily PAR ranged from 22.14 to 341.14 μmol m s−1 in MMP, 130.55 to 214.35 μmol m s−1 in HMP, and 51.63 to 408.20 μmol m s−1 in YMP, with mean values of 195.57, 170.61, and 248.84 μmol m s−1, respectively (Figure 2a). The daily mean VPD ranged from 0.62 to 1.75 KPa in MMP, 0.67 to 1.38 KPa in HMP, and 0.38 to 1.48 KPa in YMP, with mean values of 0.99, 0.95, and 0.83 KPa, respectively (Figure 2b). The accumulated P over the entire study period was 4.0, 160.5, and 50.1 mm in the MMP, HMP, and YMP treatments, respectively (Figure 2c). SWC ranged from 9.00 to 25.35 cm3 cm−3 with a mean value of 17.00 cm3 cm−3 for the MMP, 12.00 to 24.00 cm3 cm−3 with the mean value of 16.01 cm3 cm−3 for the HMP, and 2.63 to 7.23 cm3 cm−3 with the mean value of 4.69 cm3 cm−3 for the YMP (Figure 2d). In the wet period, the daily PAR ranged from 39.80 to 325.42 μmol m s−1 in the MMP, 154.76 to 255.55 μmol m s−1 in the HMP, and 33.56 to 556.29 μmol m s−1 in the YMP, with mean values of 215.86, 206.68, and 373.84 μmol m s−1, respectively (Figure 2a). The daily mean VPD ranged from 0.69 to 1.61 KPa in the MMP, 0.80 to 1.75 KPa in the HMP, and 0.94 to 1.73 KPa in the YMP, with mean values of 0.88, 1.12, and 1.21 KPa, respectively (Figure 2b). The accumulated P over the entire study period was 270.8, 226.6, and 270.3 mm in the MMP, HMP, and YMP, respectively (Figure 2c). SWC ranged from 13.00 to 29.20 cm3 cm−3 with the mean value of 22.53 cm3 cm−3 for MMP, 10.32 to 27.00 cm3 cm−3 with the mean value of 18.30 cm3 cm−3 for HMP, and 2.60 to 20.33 cm3 cm−3 with the mean value of 10.56 cm3 cm−3 for YMP (Figure 2d). During the wet period, the daily PAR ranged from 39.80 to 325.42 μmol m s−1 in MMP, 154.76 to 255.55 μmol m s−1 in HMP, and 33.56 to 556.29 μmol m s−1 in YMP, with mean values of 215.86, 206.68, and 373.84 μmol m s−1, respectively (Figure 2a). The daily mean VPD ranged from 0.69 to 1.61 KPa in MMP, 0.80 to 1.75 KPa in HMP, and 0.94 to 1.73 KPa in YMP, with mean values of 0.88, 1.12, and 1.21 KPa, respectively (Figure 2b). The cumulative precipitation over the entire study period was 270.8, 226.6, and 270.3 mm in MMP, HMP, and YMP, respectively (Figure 2c). SWC ranged from 13.00 to 29.20 cm3 cm−3, with a mean value of 22.53 cm3 cm−3 for MMP; 10.32 to 27.00 cm3 cm−3, with a mean value of 18.30 cm3 cm−3 for HMP; and 2.60 to 20.33 cm3 cm−3, with a mean value of 10.56 cm3 cm−3 for YMP (Figure 2d).

3.2. Tree Water Consumption

The diurnal courses of ET showed similar patterns for the MMP, HMP, and YMP. Generally, Js increased in the morning as PAR and VPD increased and reached a maximum, then decreased in the afternoon and reached a minimum late at night (Figure 3a,c). The time when the variables started to grow differed by 0.5–1.5 h. However, the time they started to decrease differed by 1.0–6.0 h. During the dry period, ET peaked at 12:00 with a maximum value of 2.62 g s−1 in the MMP. For the HMP, ET peaked at 12:00, 13:30, and 14:30 with values of 1.02 g s−1, 1.00 g s−1, and 1.04 g s−1, respectively; while for the YMP, ET peaked at 11:30 with a value of 0.600 g s−1 in YMP (Figure 3a). In the wet period, ET peaked at 15:30 with 3.45 g s−1 in the MMP. It then peaked at 12:30 and 14:30 with 1.65 g s−1 and 1.60 g s−1 in the HMP, respectively, and at 13:00 with 0.90 g s−1 in the YMP (Figure 3c). During this study, Js occurred at night. In the dry period, the total daytime ET averaged 72.00, 25.63, and 6.55 kg d−1 for the MMP, HMP, and YMP. The total nocturnal ET averaged 6.00, 1.96, and 0.60 kg d−1 for the MMP, HMP, and YMP, respectively. The total nocturnal ET was 8.3%, 7.7%, and 9.2% of the daytime ET in the wet period, and the total nocturnal ET was 7.7%, 7.1%, and 8.4% of the diurnal ET in the dry period, respectively (Figure 3b-1). In the wet period, the total daytime ET averaged 84.32, 39.00, and 18.33 kg d−1, and the total nocturnal ET averaged 8.32, 3.26, and 1.86 kg d−1 for MMP, HMP, and YMP, respectively. Additionally, the total nocturnal ET was 9.9%, 8.4%, and 10.1% of the daytime ET, and the total nocturnal ET was 9.0%, 7.7%, and 9.2% of the diurnal ET, respectively (Figure 3d-1).

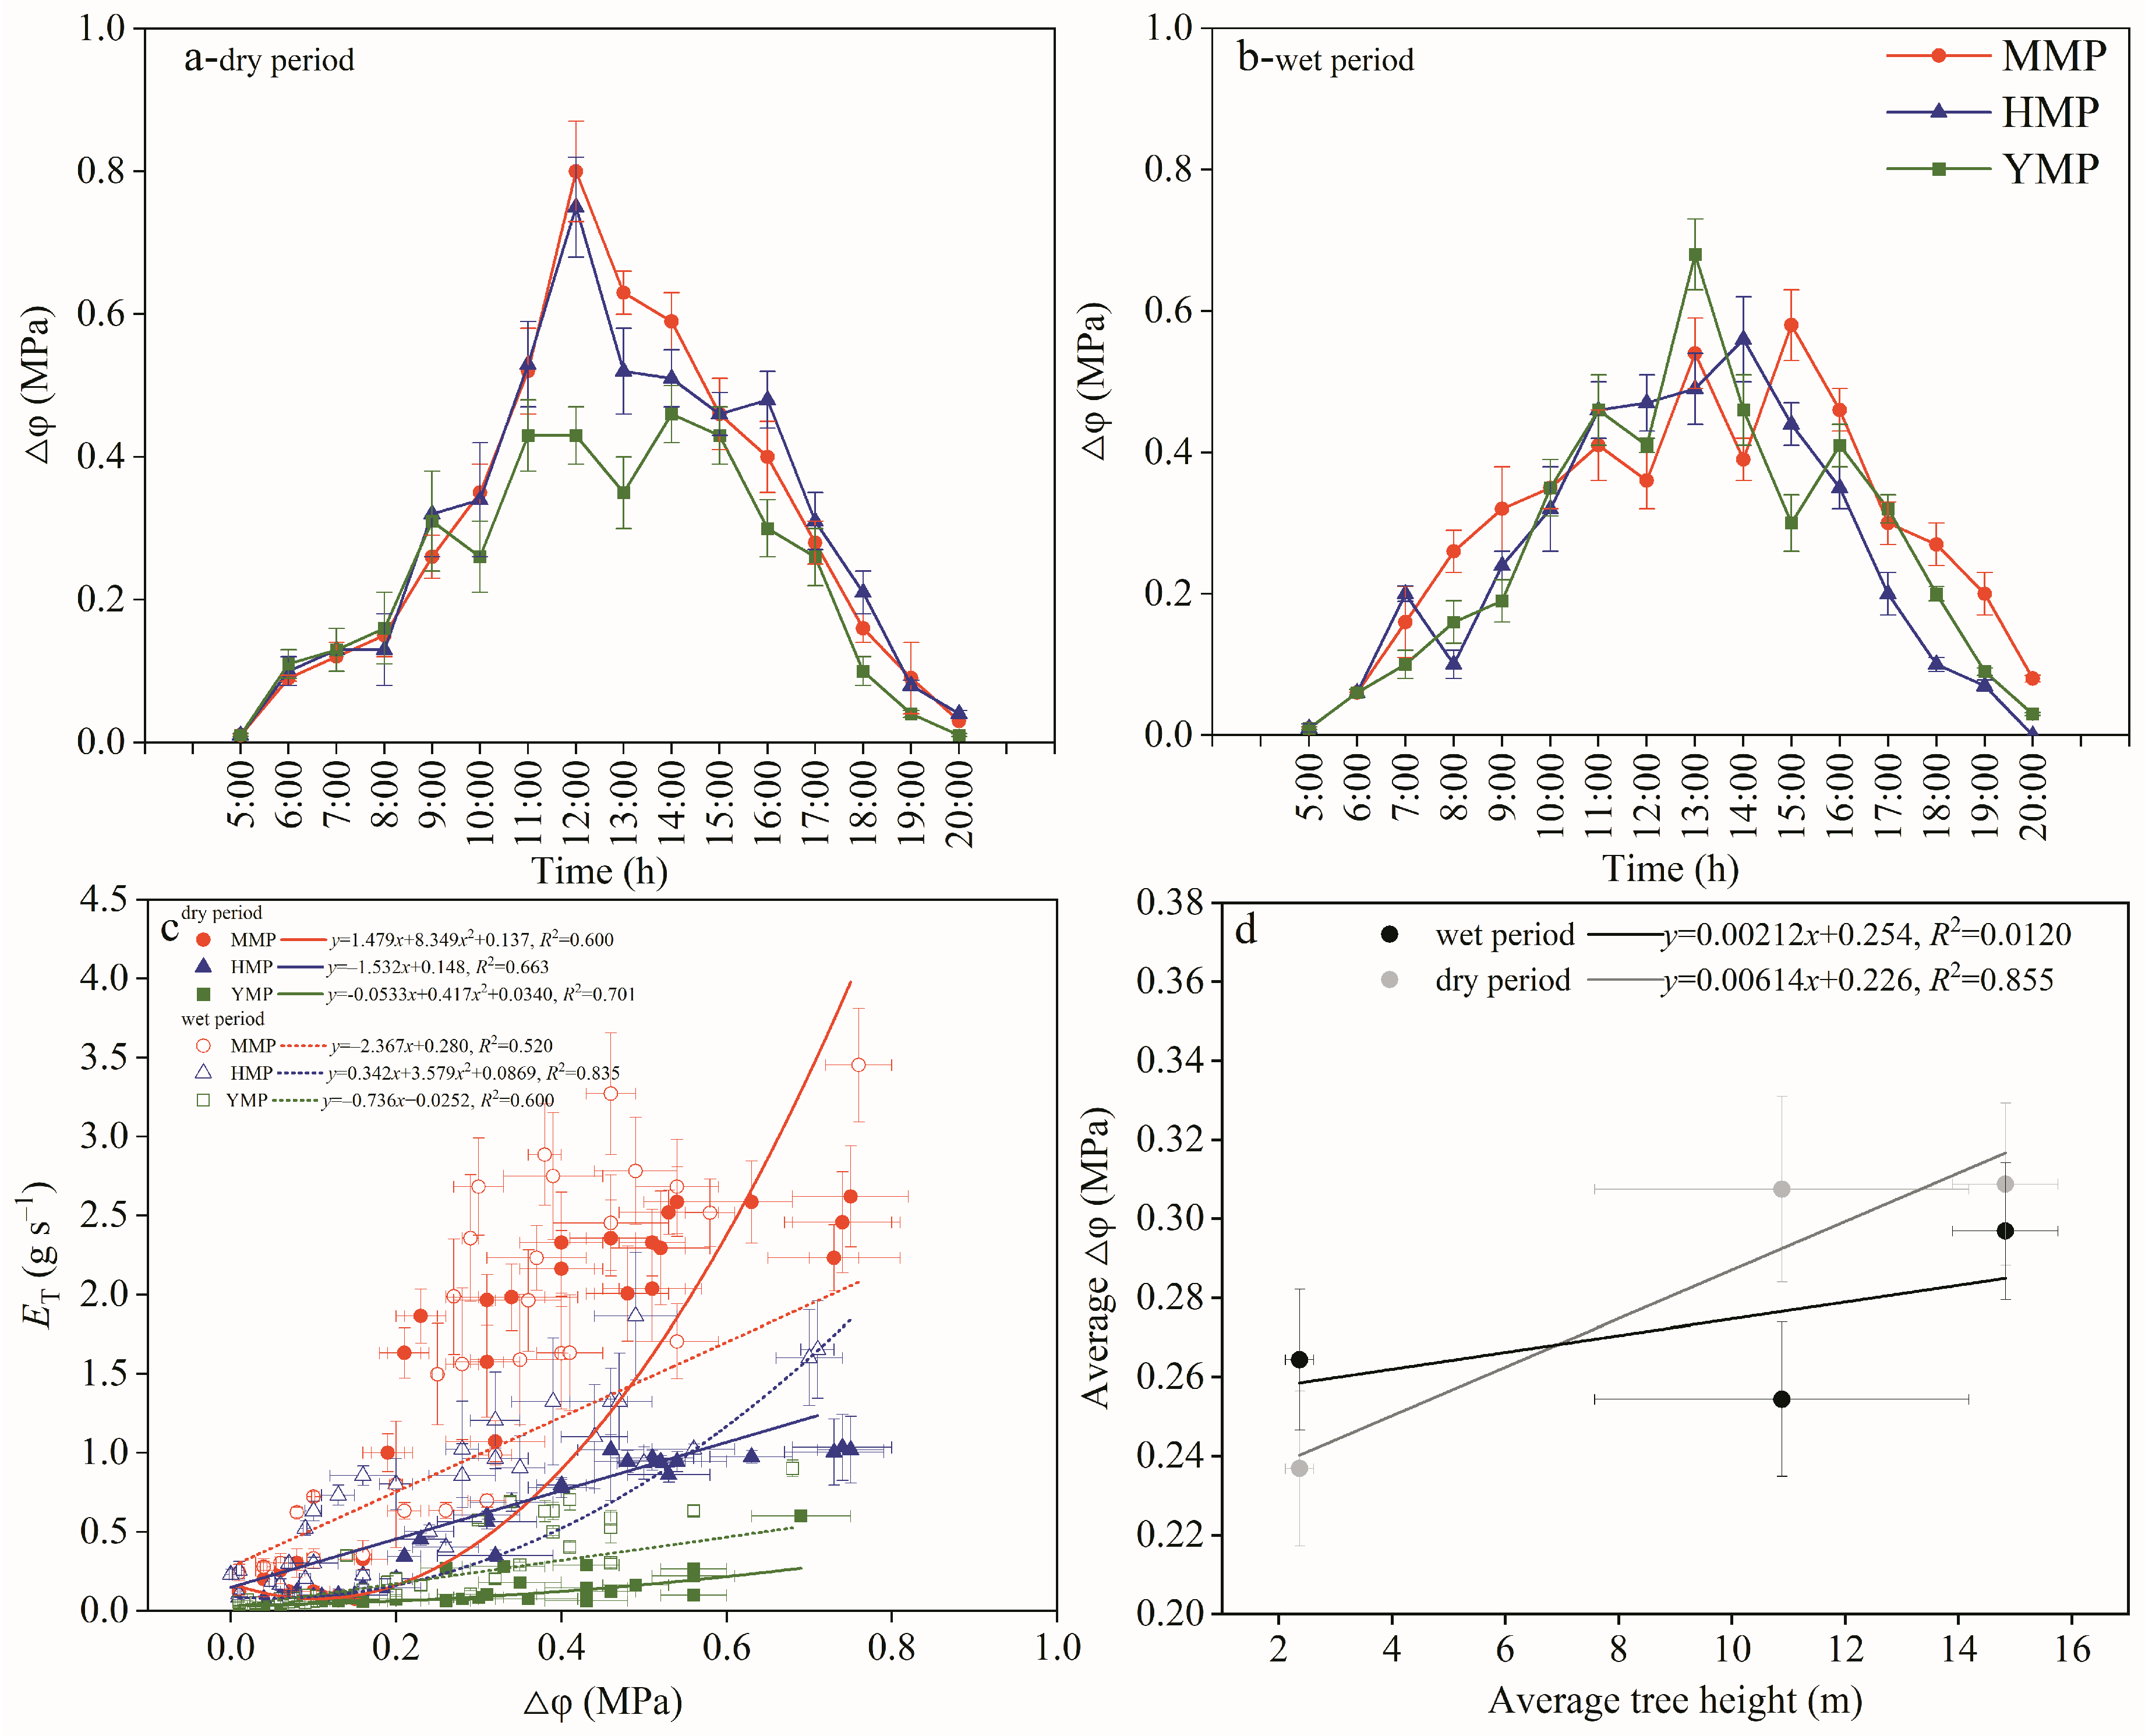
3.3. Relations between Tree Water Consumption and Soil-to-Leaf Water Potential Difference

The leaf has the lowest water potential for the whole tree, and the plant needs to overcome the pressure caused by the water potential difference in absorbing water. With the opening of leaf stomata, transpiration begins to consume water in the leaves, resulting in a gradual decrease in water potential. The diurnal courses of △Ψ had similar patterns for the three forest types. In the dry period, △Ψ averaged 0.32, 0.33, and 0.27 MPa for the MMP, HMP, and YMP, respectively (Figure 4a). In the dry period, △Ψ averaged 0.31, 0.26, and 0.26 MPa for the MMP, HMP, and YMP, respectively (Figure 4b). In the dry period, the functions of ET and △Ψ followed a non-linear relationship, where the functions of ET and △Ψ equated to y = 1.479x + 8.349x2 + 0.173, R2 = 0.600, y = −1.532x + 0.148, R2 = 0.663, y = −0.0533x + 0.417x2 + 0.0340, R2 = 0.701 for the MMP, HMP, and YMP, respectively. In the wet period, the functions of ET and △Ψ demonstrated linear relationships, which equated to y = −2.367x + 0.280, R2 = 0.520, y = 0.342x + 3.579x2 + 0.0869, R2 = 0.835, and y = −0.736x−0.0252, R2 = 0.600 for the MMP, HMP, and YMP, respectively (Figure 4c). Additionally, with H rising, ∆Ψ values were elevated, especially in the dry period, when y = 0.00614x + 0.226, and the determination coefficient was 0.855.

3.4. Whole Tree Hydraulic Conductance Changes

Whole-tree hydraulic conductivity is an indirect expression of the effect of tree hydraulic structure on water transport efficiency. Figure 5 shows that KT was higher in the morning and gradually decreased. The change in KT in the morning was gentle but drastic in the afternoon, and the dry period differed from the wet period. The KT values in the dry period were lower than those in the wet period, indicating that the hydraulic resistance in the dry period was higher (Figure 5a,b). A comparison of KT during the dry and wet periods is shown in Figure 5c. The KT was higher during the dry period. Adjusting a tree’s hydraulic structure, water storage, and other biological characteristics may affect hydraulic resistance. Drought increased the hydraulic resistance between the soil and roots and decreased the hydraulic conductivity of sapwood. In addition, since transpiration increases the water column tension of the xylem conduit, water transport resistance depending on the hydraulic structure and soil water condition will restrict excessive transpiration and avoid the joint action of transpiration pull and water column gravity to cause the water column to fracture or induce cavitation. Stomata are appropriately closed to maintain water balance. Therefore, the hydraulic resistance during the dry period can increase further. The functions of KT and H showed a non-linear relationship, where the functions of KT and H equated to y = −0.218x + 0.0246x2 + 1.136, R2 = 0.899, y = −0.111x + 0.0143x2 + 0.676, R2 = 0.777 for the three forest types, respectively (Figure 5d). The reduction rates in KT from wet to dry periods in MMP, HMPP, and YMP were 12%, 36%, and 22%, respectively (Figure 5d-1).

3.5. Hydraulic Compensation

Since the estimated value of transpiration is calculated by substituting the actual ∆Ψ measured at each moment of the wet and dry season test day into the transpiration and water potential difference equation of the corresponding period, the estimated value of transpiration is highly correlated with the measured value. In the dry period, the functions of the measured ET and estimated ET were y = 0.545x + 0.0118, R2 = 0.559; y = 0.961x + 0.173, R2 = 0.948; and y = 0.785x − 0.0233, R2 = 0.930 for MMP, HMP, and YMP, respectively (Figure 6a). During the wet period, the functions of the measured ET and estimated ET were y = 1.172x + 0.0712, R2 = 0.820, y = 0.722x + 0.00249, R2 = 0.718, and y = 0.973x + 0.173, R2 = 0.508 for MMP, HMP, and YMP, respectively (Figure 6b). However, the dry and wet periods were different; that is, a distinct discrepancy between the predicted and measured ET was apparent: the measured ET were 0.90, 0.72, and 0.92 times the predicted ET for MMP, HMP, and YMP in the dry period, respectively, while in the wet period, the measured ET values were 1.10, 1.36, and 1.50 times the predicted values, respectively (Figure 6a,b). Compared with the wet period, the soil water supply was lower during the dry period (see Figure 2). When the VPD was high, the stomata were partially closed to prevent excessive water loss, while the temperature was suitable for growth. Therefore, plants balance the relationship between preventing excessive water loss and effectively utilizing light and heat resources by adjusting their hydraulic conductivity. During the wet period, the water supply is sufficient, solar radiation is also high, and suitable water and heat conditions are available to meet the vigorous growth of plants. Plant transpiration is not restricted by water and heat resources; consequently, the measured value was less than and greater than the predicted value in the dry and wet periods. The results demonstrated that gs and KT controlled tree transpiration during the dry season.
The KT in the dry season had an apparent compensation effect on ET. The hydraulic compensation effect appeared from 12:00 to 14:00 when the PAR and VPD reached their highest values (means were 1024.54 μmol m s−1 and 2.10 KPa, respectively), and the average compensation value was 0.097 g s−1 in the MMP. Further, the hydraulic compensation effect appeared from 12:00 to 13:00; mean PAR and VPD were 956.31 μmol m s−1 and 2.03 KPa, and the mean compensation value was 0.12 g s−1 in the HMP. Additionally, the hydraulic compensation effect appeared at 11:00, mean PAR and VPD were 986.31 μmol m s−1 and 2.08 KPa, and the average compensation value was 0.022 g s−1 in the YMP. Meanwhile, during the wet period, no compensating effect was found (Figure 7). The pattern of hydraulic compensation changes was the same as that of transpiration variations.

3.6. Water Transport Regulation in Plants

According to Equation (7), the theoretical model assumes a linear relationship between predawn and midday leaf water potentials. From Figure 7, we can see that in the dry period, mean σ was 1.314, 1.749, and 1.033 in the MMP, HMP, and YMP, respectively (Figure 8a–c). However, in the wet period, mean σ was 2.105, 1.931, and 2.046 in the MMP, HMP, and YMP, respectively (Figure 8d–f). Moreover, there were significant differences between mean σ values in the MMP, HMP, and YMP in the dry season (p < 0.05), while there was no apparent difference between mean σ values in the MMP, HMP, and YMP in the wet season. These results indicated that in both the dry and wet periods, MMP, HMP, and YMP all showed extreme anisohydric behavior (Figure 8g). Even from wet to dry periods, the reduction rates of σ in the MMP, HMPP, and YMP showed that MMP, HMP, and YMP all showed extreme anisohydric behavior (Figure 8h).

4. Discussion

4.1. Seasonal Transpiration Dynamics

The study area experienced marked seasonal variations in precipitation, PARs, VPDs, and SWCs. During the dry period, the transpiration rates of Mongolian pine plantations were higher in the morning than in the afternoon. They declined during the wet period in response to increasing PARs and VPDs. Notably, such patterns were not evident in HMP compared to MMP and YMP. The primary reason for this transpiration rate difference in the plantation stage between dry and wet periods appears to be caused by a less distinct contrast between dry and wet periods in HMP in the study area. For example, the total rainfall was evenly spread throughout the growing season, with 160.5 and 266.6 mm for dry and wet periods, respectively. SWC averaged 16.01 and 18.30 cm3 cm−3, respectively, resulting in consistent transpiration rates in HMP across both periods.
Transpiration rates surged in the morning with increasing PAR and VPD, peaked in the early afternoon, and declined toward dusk [73]. A slight midday dip indicated stomatal control, corresponding with the declining leaf water potential earlier in the morning [74]. This result is consistent with expectations in this region, given the extended seasonal drought, where many species exhibited decreased leaf stomatal conductance and predawn leaf water potential [74,75]. However, the relatively high transpiration rates during the dry period suggest that soil water availability was not a limiting factor. Larger tree sizes enabled greater water storage, or nocturnal transpiration may have replenished daytime water loss during the extended dry period [11,76,77]. In addition, the increased evaporative demand over the dry period exceeded the decline in gs resulting from the increased VPD and PAR and reduced predawn leaf water potential [75]. Elevated air and leaf temperatures increased vapor pressure within the leaves, driving transpiration rates [78]. These findings mirror patterns in P. sylvestris forests in other regions, and this study [78,79] corroborates our first hypothesis. This finding further highlights the challenges in extrapolating leaf scale findings to larger scales, such as whole-tree or stand responses. Factors like internal water storage, nighttime transpiration, and fluctuating PAR and VPDs contribute to diverse tree transpiration rates, resulting in species-specific variations.

4.2. Hydraulic Compensation Effect

Our study assessed the complex issue of the regulation of forest transpiration, an area of research that, despite making some progress, still lacks a clear consensus. For example, Pataki et al. [80] assessed transpiration sensitivity in different plant species and found that Populus tremuloides exhibited high sensitivity to VPD, whereas Pinus fexilis demonstrated the lowest sensitivity. Similarly, Granier et al. [81] reported a stronger correlation between Js and VPD than between PAR and Ta in 21-year-old Norwegian spruce (Picea abies). The sap flow of Hedysarum scoparium in large plants was more sensitive to environmental factors, exhibiting daily Js variation that correlated with Ta, VPD, wind speed, relative humidity, soil temperature, and soil surface heat flux. Moreover, substantial nocturnal transpiration was detected, exhibiting seasonal variations similar to daytime transpiration patterns [11]. Notably, nocturnal transpiration in smaller plants was more sensitive to meteorological factors. Studies on Tamarix elongata and Juniperus scopulorum in semiarid regions suggested that nighttime sap flow remained elevated at relatively high Ta and VPD (1.5 KPa and 2.5 KPa, respectively) [82,83]. Studies on Carya tomentosa and Quercus alba indicated that drought does not alter transpiration but accelerates leaf aging and decay after the growing season [84]. Previous research has primarily focused on the external environmental influences on plant transpiration [85]. However, the impact of environmental factors on plant physiology should not be overlooked, especially since specific combinations of environmental factors likely influence plant respiration. For example, the semiarid regions of Northern China experience prolonged water-deficit periods alongside high PAR and VPD values. These variables are correlated, potentially with a compensatory effect that influences plant growth under adverse environmental conditions. Plants in this region may have acquired genetic characteristics (physiology), enabling them to dynamically respond to varying environmental factors [11]. As the predominant shelterbelt tree species, P. sylvestris has adapted to harsh environmental conditions by adjusting transpiration [22,24,57]. Our study findings revealed that PAR and VPD strongly controlled the transpiration rates in P. sylvestri forests during dry and wet periods. However, the degree of control varied over time. It has been speculated that the internal regulation of trees might contribute to these varying degrees of control. Therefore, the synergistic effects of meteorological factors and internal hydraulic characteristics on P. sylvestris transpiration rates are crucial. Understanding water transport in plants is based on the cohesive tension theory. Soil water deficits caused by an imbalance of water input (rainfall) and output (transpiration + evaporation) change the cohesion and tension of plant water, resulting in changes in hydraulic characteristics [86,87]. The cohesion tension theory is widely supported as an effective theory, consistent with the preponderance of data on plant water transport [86]. Studies have shown that continuous tracheid/catheter cavitation caused by a long-term soil water deficit weakens the water transport capacity of the xylem, disrupts water transport from the xylem to the leaves in plants, and disrupts xylem function, leading to canopy drying, top dieback, and telome withering [86]. However, after long-term adaptive evolution, plants maintain a safe distance between their hydraulic tension and limit threshold by continuously adjusting their hydraulic conductivity to avoid hydraulic imbalances and disasters [88]. Thus, there is not always a linear relationship between transpiration and the direct driving force (i.e., soil/leaf water potential difference, PAR, VPD), especially when soil water deficit (in dry period), PAR, and VPD are high. Trees are trying to reduce water loss and prevent leaf water potential from falling below the minimum threshold, resulting in excessive hydraulic tension and functional imbalance of xylem disaster degeneration; gs tends to non-linearly decline with the increase of VPD, e.g., the response pattern of H. scoparium transpiration to VPD showed two distinct stages: the minimum threshold of VPD driving force was 1.5 KPa and the optimal Ta was about 20 °C, when VPD < 1.5 kPa, canopy transpiration increased linearly; When VPD is greater than this value, the change of transpiration is non-linear and decreases somewhat, indicating that stomatal conductivity is limited by hydraulic conductivity at this time [11]. Pinus pinaster, Pinus nigra, and P. sylvestris displayed higher water use efficiency, which is the result of their high sensitivity to VPD and stomatal closure [89,90].
The trade-off between hydraulic safety and efficiency is crucial for drought tolerance in tree species under water-limited conditions. Lower hydraulic conductance (KT) limits water movement from the roots to the leaves, promoting conservative water use and thus aiding plant survival [50,90]. However, our research findings contrast with previous intraspecific and interspecific studies that suggested lower KT (more KT reduction rates in taller trees) maintained higher xylem water potential gradients and embolism. This relationship was observed across P. sylvestris populations [19], Pinus sp. [19,90], and Abies sp. [91], where hydraulic conductance strongly correlated with gs and photosynthetic capacity in the conifers [92]. Like other studies, our study showed that the KT declined from the wet to dry periods, potentially due to greater investment in photosynthetic capacity, especially notable in YMP. This investment helps plant survival but might lead to xylem cavitation due to reduced short-term transpiration and water potential in the dry season [88,93,94]. However, Leyre et al. [50] found no evidence of a trade-off between hydraulic conductivity and resistance to xylem embolism in P. sylvestris populations, and it is unclear whether the loss of hydraulic conductivity in response to drought is related to tree survival under field conditions [88,93,95]. Therefore, the link between stomatal function and plant hydraulics needs to be further explored in the future [27].
In summary, based on the hydraulic compensation theory by McDowell et al. [46], when variables like AL: AS, ∆Ψ, and VPDs fluctuate, an increase in KT and ∆Ψ along with the H (or less KT reduction rates in taller trees from wet to dry period) may balance the effect of H on gs, potentially resulting in compensation for H-induced hydraulic changes. Moreover, we estimated ET based on AL: AS and ∆Ψ. Interestingly, ET was underestimated during the wet period but overestimated in the dry period. This finding indicates that during the dry period, transportation is co-controlled by gs and KT when PAR and VPD values peaked. This adjustment ensured adequate CO2 absorption and maintained moderate tree growth, confirming our second hypothesis.

4.3. Quantification of the Mechanisms of Plant Water Transport Regulation

Plant functions require effective mechanisms to regulate water transport on various scales. In this study, we adopted the equation developed by Martínez-Vilalta et al. [27] based on the relationship between midday and predawn leaf water potentials. The intercept of this relationship measures the relative sensitivity of transpiration rate and plant hydraulic conductance to declining water availability. This method helps normalize differences in rooting systems across species [96]. We noticed a σ > 1 during dry and wet periods, suggesting extreme anisohydric behavior in Mongolian pine plantations. This behavior implies an increased pressure drop within the plant as ΨS declines. While a reduction in σ values from the wet to dry period indicates a tendency for P. sylvestris forests to moderately close their stomata and adjust the whole tree hydraulic conductance, the σ values remain >1 in this study. This observation suggests that stomata are insensitive to environmental changes. Although increased gs could enhance CO2 uptake and subsequent photosynthesis and growth [72,78], the current precipitation levels in these regions cannot meet the water needs of P. sylvestris. Canopy interception accounted for about 36.0% of P [9,21], making this phenomenon much harsher. Surprisingly, the transpiration rate remained consistent in mature and young forests, contrary to the hydraulic limitation hypothesis and our third hypothesis. This finding challenges the hydraulic limitation hypothesis as an explanatory mechanism for tree size and transpiration characteristics in Mongolian pine plantations, aligning with previous research [17]. Ryan and Yoder [97] proposed that hydraulic conductance and transpiration decrease as trees grow taller, affecting carbon assimilation. However, our study, akin to the frequently observed parabolic mortality pattern with plant DBH [98,99], notes the highest dieback and decline rates in the smallest and largest trees. Meanwhile, additional studies on canopy transpiration combined with different tree densities and tree ages in the same study site would provide further insights into this region’s eco-hydrological processes, reforestation, and forest management.

5. Conclusions

This study assessed the hydraulic responses governing whole-tree transpiration (ET) in mature, half-mature, and young Mongolian pine plantations in China’s Mu Us and Horqin Deserts. Our investigation revealed during the dry period, ET was co-regulated by both stomatal and hydraulic conductance (KT). In contrast, stomatal conductance primarily regulated ET in the wet season due to adequate water supply and favorable atmospheric conditions. A critical observation was the occurrence of hydraulic compensation for ET, occurring from midday to early afternoon during the dry period. Further, our study established a linear relationship between predawn and midday leaf water potentials, exhibiting extreme anisohydric behavior across plantation stages during the growing season. Although stomatal and hydraulic conductance regulated ET during the dry period, environmental conditions likely led to variations among plantation stages. These findings promise to inform forest management practices in semiarid regions, offering valuable insights into the complex dynamics of water transportation regulation in Mongolian pine plantations.

Author Contributions

Formal analysis, J.D. and Y.B.; Investigation, J.D., L.W. and Q.J.; Methodology, L.W., Y.B. and M.Y.; Project administration, Y.B.; Resources, Y.B., M.Y. and Q.J.; Software, J.D. and L.W.; Supervision, J.D. and Y.B.; Validation, Q.J.; Visualization, M.Y.; Writing–original draft, J.D. and L.W. All authors have read and agreed to the published version of the manuscript.

Funding

The work was supported by the National Natural Science Foundation of China Special Project “Research on Intelligent Control of Seabuckthorn Fruit in Naiman Banner Based on Multi-Platform Remote Sensing and IoT Perception” (grant number M2242005) and the National Natural Science Foundation of China “Isohydric versus anisohydric behavior characteristics and adaptive mechanisms of Pinus sylvestris var. mongolica in typical Sandy land in Northern China” (grant number 31800609).

Data Availability Statement

Data are contained within the article.

Acknowledgments

Many thanks to Xinxing Wang, Daiqing Gele, Yihan Wang, Congcong Zhang, Xiaobo Liu, Yang Liu, Jiaqi Yao, Changyuan Liu, and Miao Yu for their support in preparing the experiments, collecting data, and analyzing data.

Conflicts of Interest

Author Jifeng Deng was employed by the company Liaoning Fengyu Ecological Technology Co., Ltd. The remaining authors declare that the research was conducted in the absence of any commercial or financial relationships that could be construed as a potential conflict of interest.

References

  1. DeKauwe, M.G.; Medlyn, B.E.; Zaehle, S.; Walker, A.P.; Dietze, M.C.; Hickler, T.; Jain, A.K.; Luo, Y. Forest water use and water use efficiency at elevated CO2: A model-data intercomparison at two contrasting temperate forest FACE sites. Glob. Chang. Biol. 2013, 19, 1759–1779. [Google Scholar] [CrossRef] [PubMed]
  2. Gordo, O.; Sanz, J.J. Impact of climate change on plant phenology in Mediterranean ecosystems. Glob. Chang. Biol. 2010, 16, 1082–1106. [Google Scholar] [CrossRef]
  3. Xu, C.; McDowell, N.G.; Sevanto, S.; Fisher, R.A. Our limited ability to predict vegetation dynamics under water stress. New Phytol. 2013, 200, 298–300. [Google Scholar] [CrossRef]
  4. Huang, J.; Ji, M.; Xie, Y.; Wang, S.; He, Y.; Ran, J. Global semi-arid climate change over last 60 years. Clim. Dyn. 2015, 46, 1131–1150. [Google Scholar] [CrossRef]
  5. Huang, J.; Yu, H.; Guan, X.; Wang, G.; Guo, R. Accelerated dryland expansion under climate change. Nat. Clim. Chang. 2016, 6, 166–171. [Google Scholar] [CrossRef]
  6. Anderegg, W.R.L.; Kane, J.M.; Anderegg, L.D.L. Consequences of wide spread tree mortality triggered by drought and temperature stress. Nat. Clim. Chang. 2013, 3, 30–36. [Google Scholar] [CrossRef]
  7. Zhao, M.; Running, S.W. Drought-induced reduction in global terrestrial net primary production from 2000 through 2009. Science 2010, 329, 940–943. [Google Scholar] [CrossRef] [PubMed]
  8. Jones, C.; Lowe, J.; Liddicoat, S.; Betts, R. Committed terrestrial ecosystem changes due to climate change. Nat. Geosci. 2009, 2, 484–487. [Google Scholar] [CrossRef]
  9. Deng, J.; Yu, Y.; Shao, J.; Lu, S.; Liu, F.; Li, Z.; Shi, X. Rainfall interception using the revised Gash analytical model for Pinus sylvestris var. mongolica in a semi-humid region of NE China. Ecol. Indic. 2022, 143, 109399. [Google Scholar] [CrossRef]
  10. Zheng, X.; Zhu, J.J.; Yan, Q.L.; Song, L.N. Effects of land use changes on the groundwater table and the decline of Pinus sylvestris var. mongolica plantations in southern Horqin Sandy Land, Northeast China. Agric. Water Manag. 2012, 109, 94–106. [Google Scholar] [CrossRef]
  11. Deng, J.F.; Ding, G.D.; Gao, G.L.; Wu, B.; Zhang, Y.Q.; Gao, S.; Fan, W.H. The sap flow dynamics and response of Hedysarum scoparium to environmental factors in semiarid Northwestern China. PLoS ONE 2015, 10, e0131683. [Google Scholar] [CrossRef] [PubMed]
  12. Wu, B.; Ci, L.J. Landscape change and desertification development in the Mu Us Sandy land, Northern China. J. Arid. Environ. 2002, 50, 429–444. [Google Scholar] [CrossRef]
  13. Bo, T.L.; Ma, P.; Zheng, X.J. Numerical study on the effect of semi-buried straw checkerboard sand barriers belt on the wind speed. Aeolian Res. 2015, 16, 101–107. [Google Scholar] [CrossRef]
  14. Li, X.R.; Ji, R.L.; Chen, Y.W.; Huang, L.; Zhang, P. Association of ant nests with successional stages of biological soil crusts in the Tengger Desert, Northern China. Appl. Soil Ecol. 2011, 47, 59–66. [Google Scholar] [CrossRef]
  15. Tang, Y.; Li, X. Simulating effects of precipitation and initial planting density on population size of Mongolian pine in the Horqin Sandy Land, China. Agrofor. Syst. 2018, 92, 1–9. [Google Scholar] [CrossRef]
  16. Chen, F.S.; Zeng, D.H.; Zhou, B.; Singh, A.N.; Fan, Z.P. Seasonal variation in soil nitrogen availability under Mongolian pine plantations at the Keerqin Sand Lands, China. J. Arid. Environ. 2006, 67, 226–239. [Google Scholar] [CrossRef]
  17. Deng, J.F.; Yao, J.Q.; Zheng, X.; Gao, G.L. Transpiration and canopy stomatal conductance dynamics of Mongolian pine plantations in semiarid deserts, Northern China. Agric. Water Manag. 2021, 249, 106806. [Google Scholar] [CrossRef]
  18. Zeng, D.H.; Hu, Y.L.; Chang, S.X.; Fan, Z.P. Land cover change effects on soil chemical and biological properties after planting Mongolian pine (Pinus sylvestris var. mongolica) in sandy lands in Keerqin, northeastern China. Plant Soil 2009, 317, 121–133. [Google Scholar] [CrossRef]
  19. Martínez-Vilalta, J.; Cochard, H.; Mencuccini, M.; Sterck, F.; Herrero, A.; Korhonen, J.F.J.; Llorens, P.; Nikinmaa, E.; Nolc, A.; Poyatos, R.; et al. Hydraulic adjustment of Scots pine across Europe. New Phytol. 2009, 184, 353–364. [Google Scholar] [CrossRef]
  20. Song, L.N.; Zhu, J.J.; Li, M.C.; Zhang, J.X.; Zheng, X.; Wang, K. Canopy transpiration of Pinus sylvestris var. mongolica in a sparse wood grassland in the semiarid sandy region of Northeast China. Agric. For. Meteorol. 2018, 250–251, 192–201. [Google Scholar] [CrossRef]
  21. Deng, J. Fitting the revised Gash analytical model of rainfall interception to Mongolian Scots pines in Mu Us Sandy Land, China. Trees For. People 2020, 1, 100007. [Google Scholar] [CrossRef]
  22. Song, L.; Zhu, J.; Li, M.; Zhang, J.; Lv, L. Sources of water used by Pinus sylvestris var. mongolica trees based on stable isotope measurements in a semiarid sandy region of Northeast China. Agric. Water Manag. 2016, 164, 281–290. [Google Scholar] [CrossRef]
  23. Lenoir, J.; Gegout, J.C.; Marquet, P.A.; Ruffray, P.D.; Brisse, H. A significant upwards hift in plant species optimum elevation during the 20th century. Science 2008, 320, 1768–1771. [Google Scholar] [CrossRef]
  24. Song, L.N.; Li, M.C.; Zhu, J.J.; Zhang, J.X. Comparisons of radial growth and tree ring cellulose δ13C for Pinus sylvestris var. mongolica in natural and plantation forests on sandy lands. J. For. Res. 2017, 22, 160–168. [Google Scholar] [CrossRef]
  25. Pockman, W.T.; Sperry, J.S.; O’Leary, J.W. Sustained and significant negative water pressure in xylem. Nature 1995, 378, 715–716. [Google Scholar] [CrossRef]
  26. McDowell, N.G.; Ryan, M.G.; Zeppel, M.J.B.; Tissue, D.T. Improving our knowledge of drought-induced forest mortality through experiments, observations, and modeling. New Phytol. 2013, 200, 289–293. [Google Scholar] [CrossRef]
  27. Martínez-Vilalta, J.M.; Poyatos, R.; Aguadé, D.; Retana, J.; Mencuccini, M. A new look at water transport regulation in plants. New Phytol. 2014, 204, 105–115. [Google Scholar] [CrossRef] [PubMed]
  28. Martínez-Sancho, E.; Dorado-Liñán, I.; Hacke, U.G.; Seidel, H.; Annette, M. Contrasting hydraulic architectures of Scots Pine and Sessile Oak at their southernmost distribution limits. Front. Plant Sci. 2017, 8, 598. [Google Scholar] [CrossRef]
  29. Martínez-Vilalta, J.; Sala, A.; Piñol, J. The hydraulic architecture of Pinaceae—A review. Plant Ecol. 2004, 171, 3–13. [Google Scholar] [CrossRef]
  30. Poyatos, R.; Martínez-Vilalta, J.; Cěrmák, J.; Ceulemans, R.; Granier, A.; Irvine, J.; Köstner, B.; Lagergren, F.; Meiresonne, L.; Nadezhdina, N.; et al. Plasticity in hydraulic architecture of Scots pine across Eurasia. Oecologia 2007, 153, 245–259. [Google Scholar] [CrossRef]
  31. Anderegg, L.D.L.; Hillerislambers, J. Drought stress limits the geographic ranges of two tree species via different physiological mechanisms. Glob. Chang. Biol. 2016, 22, 1029–1045. [Google Scholar] [CrossRef]
  32. Bao, Y.Z.; Liu, T.X.; Duan, L.M.; Tong, X.; Ji, H.; Zhang, L.; Singh, V.P. A comparative study of three stomatal conductance models for estimating evapotranspiration in a dune ecosystem in a semi-arid region. Sci. Total Environ. 2022, 802, 149937. [Google Scholar] [CrossRef] [PubMed]
  33. Kang, J.; Shen, H.H.; Zhang, S.Y.; Xu, L.C.; Tang, Z.Y.; Tang, Y.H.; Fang, J.Y. Contrasting growth responses to drought in three tree species widely distributed in northern China. Sci. Total Environ. 2024, 908, 168331. [Google Scholar] [CrossRef] [PubMed]
  34. Thompson, R.A.; Adams, H.D.; Breshears, D.D.; Collins, A.D.; Dickman, L.T.; Grossiord, C.; Manrique-Alba, À.; Peltier, D.M.; Ryan, M.G.; Trowbrige, A.M.; et al. No carbon storage in growth-limited trees in a semi-arid woodland. Nat. Commun. 2023, 14, 1959. [Google Scholar] [CrossRef] [PubMed]
  35. Tong, Y.; Liu, J.; Han, X.; Zhang, T.; Dong, Y.; Wu, M.; Qin, S.; Wei, Y.; Chen, Z.; Zhou, Y. Radial and seasonal variation of sap flow and its response to meteorological factors in sandy Pinus sylvestris var. mongolica plantations in the Three North Shelterbelt of China. Agric. For. Meteorol. 2023, 328, 109239. [Google Scholar] [CrossRef]
  36. Chen, Y.; Maenpuen, P.; Zhang, Y.J.; Kallol, B.; Masatosh, K.; Hui, G.; Sasiwimol, K.; Tao, L.B.; Zhang, J.L. Quantifying vulnerability to embolism in tropical trees and lianas using five methods: Can discrepancies be explained by xylem structural traits? New Phytol. 2021, 229, 805–819. [Google Scholar] [CrossRef]
  37. Carter, K.R.; Dickman, L.T. Recovery of seedling carbon balance despite hydraulic impairment following hot drought. Tree Physiol. 2022, 42, 1527–1531. [Google Scholar] [CrossRef]
  38. Beikircher, B.; Sack, L.; Ganthaler, A.; Losso, A.; Mayr, S. Hydraulic-stomatal coordination in tree seedlings: Tight correlation across environments and ontogeny in Acer pseudoplatanus. New Phytol. 2021, 232, 1297–1310. [Google Scholar] [CrossRef] [PubMed]
  39. O’Keefe, K.; Smith, D.D.; McCulloh, K.A. Linking stem rehydration kinetics to hydraulic traits using a novel method and mechanistic model. Ann. Bot. 2023, 131, 1121–1132. [Google Scholar] [CrossRef]
  40. Naithani, K.J.; Ewers, B.E.; Pendall, E. Sap flux-scaled transpiration and stomatal conductance response to soil and atmospheric drought in a semi-arid sagebrush ecosystem. J. Hydrol. 2012, 464–465, 176–185. [Google Scholar] [CrossRef]
  41. Martre, P.; North, G.B.; Nobel, P.S. Hydraulic conductance and mercury-sensitive water transport for roots of Opuntia acanthocarpa in relation to soil drying and rewetting. Plant Physiol. 2001, 126, 352–362. [Google Scholar] [CrossRef] [PubMed]
  42. Williams, M.; Bond, B.J.; Ryan, M.G. Evaluating different soil and plant hydraulic constraints on tree function using a model and sap flow data from ponderosa pine. Plant Cell Environ. 2010, 24, 679–690. [Google Scholar] [CrossRef]
  43. Hu, Y.; Sun, Z.; Zeng, Y.; Ouyang, S.; Chen, L.; Lei, P.; Deng, X.; Zhao, Z.; Fang, X.; Xiang, W. Tree-level stomatal regulation is more closely related to xylem hydraulic traits than to leaf photosynthetic traits across diverse tree species. Agric. For. Meteorol. 2023, 329, 109291. [Google Scholar] [CrossRef]
  44. Sánchez-Pinillos, M.; D’Orangeville, L.; Boulanger, Y.; Comeau, P.; Wang, J.; Taylor, A.R.; Kneeshaw, D. Sequential droughts: A silent trigger of boreal forest mortality. Glob. Chang. Biol. 2022, 28, 542–556. [Google Scholar] [CrossRef]
  45. Denissen, J.M.C.; Teuling, A.J.; Pitman, A.J.; Koirala, S.; Migliavacca, M.; Li, W.; Reichstein, M.; Winkler, A.J.; Zhan, C.; Orth, R. Widespread shift from ecosystem energy to water limitation with climate change. Nat. Clim. Chang. 2022, 12, 677–684. [Google Scholar] [CrossRef]
  46. McDowell, N.G.; Phillips, N.; Lunch, C.; Bond, B.J.; Ryan, M.G. An investigation of hydraulic limitation and compensation in large, old Douglas-fir trees. Tree Physiol. 2002, 22, 763–774. [Google Scholar] [CrossRef] [PubMed]
  47. Sala, A. Hydraulic compensation in northern Rocky Mountain conifers: Does successional position and life history matter? Oecologia 2006, 149, 1–11. [Google Scholar] [CrossRef]
  48. Li, M.Y.; Leng, Q.N.; Hao, G.Y. Contrasting patterns of radial growth rate between Larix principis-rupprechtii and Pinus sylvestris var. mongolica along an elevational gradient are mediated by differences in xylem hydraulics. For. Ecol. Manag. 2021, 497, 119524. [Google Scholar] [CrossRef]
  49. Li, J.; Pei, J.; Fang, C.; Li, B.; Nie, M. Drought may exacerbate dryland soil inorganic carbon loss under warming climate conditions. Nat. Commun. 2024, 15, 617. [Google Scholar] [CrossRef]
  50. Leyre, C.; Eustaquio, G.P.; Eduardo, N. Differences in hydraulic architecture between mesic and xeric Pinus pinaster populations at the seedling stage. Tree Physiol. 2012, 32, 1442–1457. [Google Scholar] [CrossRef]
  51. Wullschleger, S.D.; Wilson, K.B.; Hanson, P.J. Environmental control of whole-plant transpiration, canopy conductance and estimates of the decoupling coefficient for large red maple trees. Agric. For. Meteorol. 2000, 104, 157–168. [Google Scholar] [CrossRef]
  52. Chen, S.; Zhang, Z.; Chen, Z.; Xu, H.; Li, J. Responses of canopy transpiration and conductance to different drought levels in Mongolian pine plantations in a semiarid urban environment of China. Agric. For. Meteorol. 2024, 347, 109897. [Google Scholar] [CrossRef]
  53. Wang, F.; Zhang, F.; Guo, X.H.; Fonti, P.; Xia, J.; Cao, Z.; Liu, J.; Wang, Y.; Zhang, J. Seasonal variations in leaf-level photosynthesis and water use efficiency of three isohydric to anisohydric conifers on the Tibetan Plateau. Agric. For. Meteorol. 2021, 308–309, 108581. [Google Scholar] [CrossRef]
  54. Oren, R.; Phillips, N.; Ewers, B.E.; Pataki, D.E. Sap-flux-scaled transpiration responses to light, vapor pressure deficit, and leaf area reduction in a flooded Taxodium distichum forest. Tree Physiol. 1999, 19, 337–347. [Google Scholar] [CrossRef] [PubMed]
  55. Pataki, D.E.; Oren, R.; Phillips, N. Responses of sap flux and stomatal conductance of Pinus taeda L. trees to stepwise reductions in leaf area. J. Exp. Bot. 1998, 49, 871–878. [Google Scholar] [CrossRef]
  56. Deng, J.; Ma, C.; Yu, H. Different soil particle-size classification systems for calculating volume fractal dimension-A case study of Pinus sylvestris var. Mongolica in Mu Us Sandy Land, China. Appl. Sci. 2018, 8, 1872. [Google Scholar] [CrossRef]
  57. Deng, J.F.; Li, J.H.; Deng, G.; Zhu, H.Y.; Zhang, R.H. Fractal scaling of particlesize distribution and associations with soil properties of Mongolian pine plantations in the Mu Us Desert, China. Sci. Rep. 2017, 7, 6742. [Google Scholar] [CrossRef]
  58. Granier, A. A new method of sap flow measurement in tree stems. Ann. Sci. For. 1985, 42, 193–200. [Google Scholar] [CrossRef]
  59. Du, S.; Wang, Y.L.; Kume, T.; Zhang, J.G.; Otsuki, K.; Yamanaka, N.; Liu, G.B. Sapflow characteristics and climatic responses in three forest species in the semiarid Loess Plateau region of China. Agric. For. Meteorol. 2011, 151, 1–10. [Google Scholar] [CrossRef]
  60. James, S.A.; Clearwater, M.J.; Meinzer, F.C.; Goldstein, G. Heat dissipation sensors of variable length for the measurement of sap flow in trees with deep sapwood. Tree Physiol. 2002, 22, 277–283. [Google Scholar] [CrossRef]
  61. Zhu, J.J.; Fan, Z.P.; Zeng, D.H.; Jiang, F.Q.; Matsuzaki, T. Comparison of stand structure and growth between artificial and natural forests of Pinus sylvestiris var. mongolica on sandy land. J. For. Res. 2003, 14, 103–111. [Google Scholar] [CrossRef]
  62. Steinberg, S.L.; Mcfarland, M.J.; Worthington, J.W. Comparison of trunk and branch sap flow with canopy transpiration in Pecan. J. Exp. Bot. 1990, 41, 635–659. [Google Scholar] [CrossRef]
  63. Comstock, J. Variation in hydraulic architecture and gas exchange in two desert sub-shrubs, Hymenoclea salsola (T. & G.) and Ambrosia dumosa. Oecologia 2000, 125, 1–10. [Google Scholar] [CrossRef] [PubMed]
  64. Mencuccini, M.; Comstock, J. Variability in hydraulicarchitecture and gas exchange of common bean (Phaseolus vulgaris) cultivars under well–watered conditions: Interactionswith leaf size. Aust. J. Plant Physiol. 1999, 26, 115–124. [Google Scholar] [CrossRef]
  65. Qiu, R.; Kang, S.; Du, T.; Tong, L.; Hao, X.; Chen, R.; Chen, J.; Li, F. Effect of convection on the Penman–Monteith model estimates of transpiration of hot pepper grown in solar greenhouse. Sci. Hortic. 2013, 160, 163–171. [Google Scholar] [CrossRef]
  66. Shelburne, V.B.; Hedden, R.L.; Allen, R.M. The effectsof site, stand density, and sapwood permeability on the relationship between leaf area and sapwood area in loblolly pine (Pinus taeda L.). For. Ecol. Manag. 1993, 58, 193–209. [Google Scholar] [CrossRef]
  67. Zhang, Z.Z.; Zhao, P.; McCarthy, H.R.; Zhao, X.H.; Niu, J.F.; Zhu, L.W.; Ni, G.Y.; Ouyang, L.; Huang, Y.Q. Influence of the decoupling degree on the estimation of canopy stomatal conductance for two broadleaf tree species. Agric. For. Meteorol. 2016, 221, 230–241. [Google Scholar] [CrossRef]
  68. Khamzina, A.; Sommer, R.; Lamers, J.P.A.; Vlek, P.L.G. Transpiration and early growth of tree plantations established on degraded cropland over shallow saline groundwater table in northwest Uzbekistan. Agric. For. Meteorol. 2009, 149, 1865–1874. [Google Scholar] [CrossRef]
  69. Whitehead, D.; Hinckley, T.M. Models of water flux through forest stands: Critical leaf and stand parameters. Tree Physiol. 1991, 9, 35–57. [Google Scholar] [CrossRef]
  70. Köstner, B.M.M.; Schulze, E.-D.; Kelliher, F.M.; Hollinger, D.Y.; Byers, J.N.; Hunt, J.E.; McSeveny, T.M.; Meserth, R.; Weir, P.L. Transpiration and canopy conductance in a pristine broad-leaved forest of Nothofagus: An analysis of xylem sap flow and eddy correlation measurements. Oecologia 1992, 91, 350–359. [Google Scholar] [CrossRef]
  71. Jarvis, P.G.; McNaughton, K.G. Stomatal control of transpiration: Scaling up from leaf to region. Adv. Ecol. Res. 1986, 15, 1–49. [Google Scholar] [CrossRef]
  72. Hochberg, U.; Rockwell, F.E.; Holbrook, N.M.; Cochard, H. Iso/Anisohydry: A plant-environment interaction rather than a simple hydraulic trait. Trends Plant Sci. 2018, 23, 112–120. [Google Scholar] [CrossRef] [PubMed]
  73. O’Grady, A.P.; Eamus, D.; Hutley, L.B. Transpiration increases during the dry season: Patterns of tree water use in eucalypt open-forests of northern Australia. Tree Physiol. 1999, 19, 591–597. [Google Scholar] [CrossRef]
  74. Myers, B.A.; Duff, G.A.; Eamus, D.; Fordyce, I.R.; O’Grady, A.; Williams, R.J. Seasonal variation in water relations of trees of differing leaf phenology in a wet-dry tropical savanna near Darwin, northern Australia. Aust. J. Bot. 1997, 45, 225–240. [Google Scholar] [CrossRef]
  75. Prior, L.D.; Eamus, D.; Duff, G.A. Seasonal and diurnal patterns of carbon assimilation, stomatal conductance and leaf water potential in Eucalyptus tetrodonta saplings in a wet-dry savanna in northern Australia. Aust. J. Bot. 1997, 45, 241–258. [Google Scholar] [CrossRef]
  76. Cook, P.G.; Hatton, T.J.; Pidsley, D.; Herczeg, A.L.; Held, A.A.; O’Grady, A.; Eamus, D. Water balance of a tropical woodland ecosysytem, northern Australia: A combination of micrometeorological, soil physical and groundwater chemical approaches. J. Hydrol. 1998, 210, 161–177. [Google Scholar] [CrossRef]
  77. Liu, X.; Zhang, B.; Zhuang, J.Y.; Han, C.; Zhai, L.; Zhao, W.Z.; Zhang, J.C. The relationship between sap flow density and environmental factors in the Yangtze River Delta region of China. Forests 2017, 8, 74. [Google Scholar] [CrossRef]
  78. Song, L.; Zhu, J.; Zheng, X.; Wang, K.; Lü, L.; Zhang, X.; Hao, G. Transpiration and canopy conductance dynamics of Pinus sylvestris var. mongolica in its natural range and in an introduced region in the sandy plains of Northern China. Agric. For. Meteorol. 2020, 281, 107830. [Google Scholar] [CrossRef]
  79. Urban, J.; Rubtsov, A.V.; Urban, A.V.; Shashkin, A.V.; Benkova, V.E. Canopy transpiration of a Larix sibirica and Pinus sylvestris forest in Central Siberia. Agric. For. Meteorol. 2019, 271, 64–72. [Google Scholar] [CrossRef]
  80. Pataki, D.E.; Oren, R.; Smith, A.W. Sap flux of co-occurring species in a western subalpine forest during seasonal soil drought. Ecology 2000, 81, 2557–2566. [Google Scholar] [CrossRef]
  81. Granier, A.; Huc, R.; Barigah, S.T. Transpiration of natural rainforest and its dependence on climatic factors. Agric. For. Meteorol. 1996, 78, 19–29. [Google Scholar] [CrossRef]
  82. Moore, G.W.; Cleverly, J.R.; Owens, M.K. Nocturnal transpiration in riparian Tamarix thickets authenticated by sap flux, eddy covariance and leaf gas exchange measurements. Tree Physiol. 2008, 28, 521–528. [Google Scholar] [CrossRef] [PubMed]
  83. Sellin, A.; Lubenets, K. Variation of transpiration within a canopy of silver birch: Effect of canopy position and daily versus nightly water loss. Ecohydrology 2010, 3, 467–477. [Google Scholar] [CrossRef]
  84. Pataki, D.E.; Oren, R. Species differences in stomatal control of water loss at the canopy scale in amature bottom land deciduous forest. Adv. Water Resour. 2003, 26, 1267–1278. [Google Scholar] [CrossRef]
  85. Liu, B.; Zhao, W.Z.; Jin, B.W. The response of sap flow in desert shrubs to environmental variables in an arid region of China. Ecohydrology 2011, 4, 448–457. [Google Scholar] [CrossRef]
  86. Brown, H.R. The theory of the rise of sap in trees: Some historical and conceptual remarks. Phys. Perspect. 2013, 15, 320–358. [Google Scholar] [CrossRef]
  87. Lu, P.; Biron, P.; Granier, A.; Cochard, H. Water relations of adult Norway spruce (Picea abies (L) Karst) under soil drought in the Vosges mountains: Water potential, stomatal conductance and transpiration. Ann. For. Sci. 1996, 53, 113–121. [Google Scholar] [CrossRef]
  88. Sperry, J.S. Hydraulic constraints on plant gas exchange. Agric. For. Meteorol. 2000, 104, 13–23. [Google Scholar] [CrossRef]
  89. Loustau, D.; Berbigier, P.; Roumagnac, P.; Arruda-Pacheco, C.; David, J.S.; Ferreira, M.I.; Pereira, J.S.; Tavares, R. Transpiration of a 64 year old maritime pine stand in Portugal. 1. Seasonal course of water flux through maritime pine. Oecologia 1996, 107, 33–42. [Google Scholar] [CrossRef]
  90. Martínez-Vilalta, J.; Prat, E.; Oliveras, I.; Piñol, J. Hydraulic properties of roots and stems of nine woody species. Oecologia 2002, 133, 19–29. [Google Scholar] [CrossRef]
  91. Peguero-Pina, J.J.; Sancho-Knapik, D.; Cochard, H.; Barredo, G.; Villarroya, D.; Gil-Pelegrín, E. Hydraulic traits limit the distribution range of two closely related Mediterranean firs, Abies alba Mill. and Abies pinsapo Boiss. Tree Physiol. 2011, 31, 1067–1075. [Google Scholar] [CrossRef] [PubMed]
  92. Brodribb, T.J.; Holbrook, N.M.; Zwieniecki, M.A.; Palma, B. Leaf hydraulic capacity in ferns, conifers and angiosperms: Impacts on photosynthetic maxima. New Phytol. 2005, 165, 839–846. [Google Scholar] [CrossRef] [PubMed]
  93. Tsuda, M.; Tyree, M.T. Plant hydraulic conductance measured by the high pressure flow meter in crop plants. J. Exp. Bot. 2000, 51, 823–828. [Google Scholar] [CrossRef] [PubMed]
  94. Tyree, M.T.; Ewers, F.W. The hydraulic architecture of trees and other woody plants. New Phytol. 1991, 119, 345–360. [Google Scholar] [CrossRef]
  95. Vilagrosa, A.; Bellot, J.; Vallejo, R.; Gil-Pelegrín, E. Cavitation, stomatal conductance, and leaf dieback in seedlings of two co-occurring Mediterranean shrubs during an intense drought. J. Exp. Bot. 2003, 54, 2015–2024. [Google Scholar] [CrossRef] [PubMed]
  96. Martínez-Vilalta, J.; Garcia-Forner, N. Water potential regulation, stomatal behaviour and hydraulic transport under drought: Deconstructing the iso/anisohydric concept. Plant Cell Environ. 2017, 40, 962–976. [Google Scholar] [CrossRef]
  97. Ryan, M.G.; Yoder, B.J. Hydraulic limits to tree height and tree growth. BioScience 1997, 47, 235–242. [Google Scholar] [CrossRef]
  98. Liu, H.; Williams, A.P.; Allen, C.D.; Guo, D.; Wu, X.; Anenkhonov, O.A.; Liang, E.; Sandanov, D.; Yin, Y.; Qi, Z.; et al. Rapid warming accelerates tree growth decline in semi-arid forests of Inner Asia. Glob. Chang. Biol. 2013, 19, 2500–2510. [Google Scholar] [CrossRef]
  99. McDowell, N.; Pockman, W.T.; Allen, C.D.; Breshears, D.D.; Cobb, N.; Kolb, T.; Plaut, J.; Sperry, J.; West, A.; Williams, D.G.; et al. Mechanisms of plant survival and mortality during drought: Why do some plants survive while others succumb to drought? New Phytol. 2008, 178, 719–739. [Google Scholar] [CrossRef]
Figure 1. Geographical research site description.
Forests 15 01367 g001
Figure 2. Variations in daily photosynthetically active radiation (PAR, a), vapor pressure deficit (VPD, b), precipitation (P, c), and soil volumetric water content (SWC, d) during the growing season (the growing season is divided into dry and wet periods according to the characteristics of precipitation, split by dot lines) for the mature (MMP), half-mature (HMP), and young (YMP) forests.
Forests 15 01367 g002
Figure 3. Diurnal course of tree water consumption (ET, a,c), total tree water transpiration in the daytime and nocturnal during the dry and wet periods (b,d), and the proportion of nocturnal tree water consumption to the daytime consumption and diurnal tree water consumption during the dry and wet periods (b-1, d-1) for the mature (MMP), half-mature (HMP), and young (YMP) forests.
Forests 15 01367 g003
Figure 4. Diurnal course of leaf-to-soil water potential difference in the dry and wet seasons (a,b) and the relationship between diurnal course of tree water consumption and leaf-to-soil water potential difference in the dry and wet periods (c,d) for the mature (MMP), half-mature (HMP), and young (YMP) forests.
Forests 15 01367 g004
Figure 5. Daily variation of whole tree hydraulic conductance of the MMP, HMP, and YMP forests in dry and wet periods (a,b), and comparison of whole tree hydraulic conductance in dry and wet periods (c), whole tree hydraulic conductance versus tree height of the MMP, HMP, and YMP forests (d), and reduction rates in whole tree hydraulic conductance from wet to dry periods in the mature (MMP), half-mature (HMP), and young (YMP) forests (d-1).
Forests 15 01367 g005
Figure 6. The deviation between measured and predicted transpiration for the mature (MMP), half-mature (HMP), and young (YMP) forests in dry (a) and wet (b) periods.
Forests 15 01367 g006
Figure 7. Hydraulic compensation for transpiration during the period of 11:00–16:00 for the mature (MMP, (a)), half-mature (HMP, (b)), and young (YMP, (c)) forests in dry and wet periods.
Forests 15 01367 g007
Figure 8. Relationship between predawn and midday leaf water potentials in the mature (MMP; (a),(d)), half-mature (HMP; (b),(e)), and young (YMP; (c),(f)) forests in dry and wet periods. Further, to determine the isohydric and anisohydric tree water transport regulation based on the slope value σ in the MMP, HMP, and YMP forests in dry and wet periods (g), and reduction rates σ from wet to dry season in the MMP, HMP, and YMP forests (h). ANOVA with an LSD test was used; means with different letters in the same row are significantly different at the 0.05 level. Means with a different letter in the same layers are significantly different at p = 0.05 (LSD test).
Forests 15 01367 g008
Table 1. Minimum, maximum, and mean values of selected sampling tree traits in the mature, half-mature, and young Mongolian pine plantation forests (MMP, HMP, and YMP, respectively).
Tree NumberHeight
(m)
DBH
(cm)
Height under Branch (m)Crown Diameter (m)SA
(cm2)
Max (MMP)16.533.07.13.8 × 3.8460.3
Mean (MMP)14.830.96.43.2 × 3.2410.6
Min (MMP)13.826.05.82.6 × 2.7375.3
Max (HMP)16.2281.72.6 × 2.8380.6
Mean (HMP)10.918.71.51.7 × 2.0215.6
Min (HMP)6.5101.31.1 × 1467.2
Max (YMP)2.62.80.41.0 × 1.011.3
Mean (YMP)2.42.80.31.0 × 1.010.1
Min (YMP)2.12.70.30.9 × 1.09.5
DBH: diameter at breast height, SA: sapwood area.
Disclaimer/Publisher’s Note: The statements, opinions and data contained in all publications are solely those of the individual author(s) and contributor(s) and not of MDPI and/or the editor(s). MDPI and/or the editor(s) disclaim responsibility for any injury to people or property resulting from any ideas, methods, instructions or products referred to in the content.

