Abstract
The environment in which people live is a complex system influenced by multiple factors interacting with each other, and therefore, it is crucial to deeply explore the influences of various factors on environmental perception. Among the numerous factors affecting the experience of urban forests visits, the thermal–acoustic environment stands out prominently. This study focuses on urban forests located in subtropical regions, with specific research conducted in the Xihu Park in Fuzhou, China. The study explores the thermal–acoustic interaction in urban forest environments. A total of 150 participants evaluated the perception of sound, thermal sensation, and overall perception through laboratory experiments, with 36 of them having their objective physiological indicators monitored. Different levels of sound and temperature were selected for the experiments, with three levels for each type of sound. Our results show that increasing temperature enhanced the perceived loudness of sound, especially when the environment was quiet. Sound type and loudness had a significant impact on thermal sensation, but no interaction was observed with temperature. Moreover, we found that certain sounds could improve overall comfort, and the effect was most evident at moderate loudness. Temperature had a significant influence on both comfort and annoyance, with increasing temperature leading to higher annoyance. These findings provide important insights into how the interplay between sound and heat affects human perception and emotional state, providing scientific guidance for the design of more human-centered environments.
1. Introduction
The relentless march of urbanization in the 21st century has birthed a plethora of environmental dilemmas, encompassing the dearth of water resources, burgeoning waste accumulation [1,2], pervasive soil degradation [3,4], burgeoning population densities [5], auditory pollution [6,7], and the looming shadow of climate change [8]. A matter of acute concern is the insidious influence of ambient noise on human wellbeing. Empirical studies lend credence to the notion that persistent immersion in discordant soundscapes can beget auditory decline, disrupted circadian rhythms, and an escalated propensity for cardiovascular and psychological maladies. In addition, the tangible effects of climatic shifts, coupled with the burgeoning Urban Heat Island phenomenon [9], have engendered a milieu of thermal unease within city confines [10,11,12]. Amidst this backdrop, urban forests have emerged as a quintessential facet of the holistic urban ecological matrix, bestowing a cornucopia of advantages upon metropolitan inhabitants [13]. The verdant expanses nestled within these parks serve to fortify both corporeal and mental health, efficaciously attenuating the impacts of air and sound pollution, as well as excessive urban heat. Additionally, these spaces serve as a sanctuary for mental decompression and the alleviation of tension, as indicated by studies [14,15].
Furthermore, urban forests stand as the pivotal foundation for the sustenance, functionality, and proliferation of urban landscapes [16]. A tapestry of diverse sensory stimuli incessantly molds the lifestyle patterns of urban dwellers. In this context, the sensory orchestration of municipal verdure has become an increasingly focal point of interest. Nevertheless, a prevailing challenge emerges in the form of an imbalanced emphasis on visual aesthetics, overshadowing other sensory dimensions. This often leads to the fulfillment of mere aesthetic desires at the expense of a comprehensive sensory and psychological enrichment for park-goers [17].
Moreover, the human faculty of perceiving assorted facets of the external milieu plays a pivotal role in the intricacies of cognitive functioning, with perception forming the bedrock of myriad psychological phenomena [18]. Our entire comprehension of the cosmos originates from this sensory engagement. Furthermore, the integration of multiple sensory inputs can yield a more enriched and holistic compilation of data. Current endeavors in multi-sensory research have predominantly concentrated on the interplay between auditory–visual [19,20] and visual–olfactory [21] elements. However, explorations into the synergistic interactions within the thermal–acoustic environmental spectrum remain conspicuously sparse. Pellerin (2010) [22] posits that the initial interplay of thermal and acoustic conditions exerts a significant influence on the subjective perception of sound and heat. In environments rife with noise, auditory disturbances emerge as the primary factor influencing perception. Temperature becomes a critical factor only when it significantly strays from the optimal range for comfort. Zadeh (2022) delves into the intricate connections between the acoustic environment of historical sites and key environmental factors, including visual aesthetics and overall impressions. Focusing on El-Goli Park in Tabriz, he employed a case study approach that incorporated both on-site sound level measurements and subjective assessments gathered through surveys. His findings underscore the pivotal role that natural and human-made sounds play in enriching the sensory experience and shaping the environmental perceptions of visitors [23]. Furthermore, within specific thermal contexts, the presence of noise modulates the sensation of thermal comfort-heightened auditory stimuli, exacerbating thermal discomfort under conditions of elevated ambient temperatures [22,24]. Conversely, when the environmental temperature substantially diverges from one’s personal thermal perception threshold, the acuity of auditory perception diminishes. These empirical findings corroborate that diverse thermal–acoustic amalgamations can markedly affect psychological parameters and subjective assessments.
This study aims to explore the influence of the interaction between sound and temperature in urban forest environments on perceptual effects. In order to study the interaction of the senses, both field surveys and laboratory studies are necessary. Field surveys have higher authenticity and can take into account various factors, but they are not as precise in controlling variables as laboratory studies. Therefore, using only one research method has certain limitations, so it is necessary to comprehensively use both methods. In domestic and foreign research, a commonly used method for studying sensory interactions in the laboratory is to record fragments of sensory elements in real environments (such as recording sound elements with a recorder, as well as recording visual elements with a camera) and then simulating these scenes in the laboratory and conducting a survey to collect data on people’s real perceptions. Due to the relatively one-sided nature of previous studies, only the reactions of a single sense to a single stimulus were explored, and only two situations (with or without) were involved. The purpose was to optimize the experimental methods and study the extent to which sound and temperature affect each other’s perception through the control of laboratory variables. In order to make the research results more systematic and specific, it is necessary to control and adjust the sound and temperature under different conditions. At the same time, subjective questionnaires and physiological indicators monitoring were conducted on the subjects in the laboratory under different combinations of sound and temperature factors in order to obtain more accurate research results.
Specifically, in the urban forest context, we hope to address the following three research questions: (1) Will sound perception and physiological indicators be affected by different temperatures, and what is the trend of their effects? (2) Will thermal perception and physiological indicators be affected by different sounds, and what is the trend of their effects? (3) Will overall perception be affected by different combinations of sound and temperature, and what is the trend of their effects?
2. Materials and Methods
2.1. Study Site Overview
Fuzhou Xihu Park’s forest ecosystem, characterized by its rich evergreen broad-leaved tree species and diverse bird population, provides an ideal setting for soundscape research. In Xihu Park, soundscape collection can reveal the complexity and diversity of natural sounds in the area.
Dominant tree species, such as Ficus microcarpa, Cinnamomum camphora, and Zelkova schneideriana, not only provide habitats for birds but also generate essential natural sound elements for the soundscape through rustling leaves and falling fruits. Additionally, flowering plants like Rhododendron simsii and Lagerstroemia indica attract insects like bees and butterflies during their blooming periods, adding subtle yet rich layers to the soundscape with their buzzing.
Birdsong is one of the most prominent natural sounds in the soundscape. The calls of species such as Chinese bulbul (Pycnonotus sinensis), red-whiskered bulbul (Pycnonotus jocosus), magpie (Pica pica), and turtledove (Streptopelia spp.) reflect not only their respective behavioral patterns but also reveal their adaptations to the environment. By recording these sounds, researchers can monitor and assess changes in biodiversity, as well as the impacts of human activities on the natural soundscape [25].
Furthermore, in Figure 1, five sampling sites within Xihu Park offer distinct acoustic environments, enabling researchers to compare and analyze sound characteristics across different habitats. A panoramic view of these sampling sites is provided in the accompanying Figure 1. Long-term sound monitoring and data collection contribute to understanding the transformation of natural soundscapes amidst urbanization, informing urban planning and environmental management.
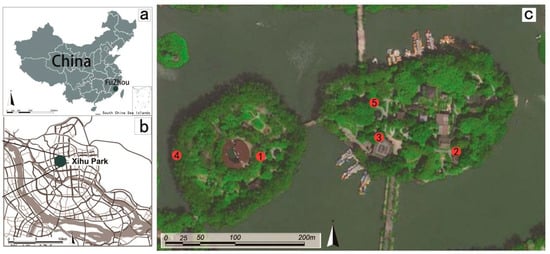
Figure 1.
(a) Location of Fuzhou City in the map of China. (b) Xihu Park in Fuzhou City. (c) Five sound collection sites within Xihu Park.
Thus, Fuzhou Xihu Park serves not only as a recreational destination for urban dwellers but also as a valuable resource for soundscape research. By collecting soundscape data at these sampling points, researchers can gain insights into the contribution of urban forests to environmental acoustics and how sound can be employed to assess and conserve natural spaces within cities.
2.2. Selection of the Thermal–Acoustic Environment
2.2.1. Thermal Environment
In synthesizing preceding research, it has been discerned that a spectrum of temperature conditions, encompassing cool, neutral, and hot, can be established by selecting specific thermal ranges during the summer season. Mindful of the experimental environmental conditions and the participants’ physiological and psychological well-being, the study delineated three operational temperatures: 20 °C, 25 °C, and 30 °C [17]. This selection is grounded in the constraints of prior research and the unique climatic attributes of Fuzhou’s urban forests. These temperatures aptly mirror the stable thermal levels characteristic of Fuzhou’s urban forests’ transitional season and the diurnal outdoor temperatures in summer.
2.2.2. Acoustical Environment
The urban forests acoustical environment is a mix of natural sounds, human-made sounds, and artificial sounds. However, due to different functional settings and ways of crowd activities, certain areas may have one or several dominant sound sources. Therefore, the main consideration is the natural-sound-dominated, human-made-sound-dominated, and artificial-sound-dominated acoustical environments. After comparing the sounds, the final choices were natural composite sounds dominated by birdcall and the sound of flowing water; human-made composite sounds dominated by conversation; and artificial composite sounds dominated by light music, traffic noise, and the sound of cutting grass. Birdcall, the sound of flowing water, and light music represent more positive sounds, while conversation represents a neutral sound, and traffic noise and the sound of cutting grass represent negative sounds [26].
2.3. Instruments and Materials
2.3.1. Experiment Instruments
Table 1 lists the equipment and instruments required for the laboratory research. It includes devices for collecting sound materials in the early stages of the experiment, equipment for adjusting the materials during the midterm, and devices for playing audio during the experiment process.

Table 1.
Measuring instruments and uses.
2.3.2. Recording and Processing of Audio Materials
The recording of audio mainly considers the dominant sound source. Since natural, artificial, and human-made sounds as dominant sources belong to different types, birdcall, water flow, conversations, light music, traffic noise, and cutting grass were chosen as the recording objects. Using recording equipment, we went to the urban forests to record the sound. Locations with clearly dominant sound sources and good recording effects were selected to collect sound files, in order to avoid the interference of uncertain factors. The collection locations were from different areas of Xihu Park in Fuzhou City, with a total of six sound sources. During recording, the recording equipment was placed in a vertical position 1.5 m above the ground, and each audio recorded 5 min of content. Concurrently, to facilitate future comparative analysis regarding the timing and spatial distribution of both target and intrusive sounds, visual documentation was also captured using cameras to record the immediate surroundings.
Subsequently, 40 s recordings with typical characteristics were selected from each location as experimental audio materials. The study found that due to environmental differences, the background sound levels at the scene and in the simulated warehouse were different, causing subjects to feel subjectively louder and even uncomfortable when simulating the volume in the indoor field. Consequently, the actual sound pressure levels observed in the laboratory were attenuated and fine-tuned utilizing the capabilities of Adobe Audition CS6 software. The volume of the experiment was divided into three levels, with a 10 dB interval between each level. After the adjustment, a subjective loudness pre-test was conducted, inviting subjects to rate the volume on a scale of 1 to 5, corresponding to very quiet and very noisy. Finally, 30 subjects were randomly selected to rate the samples, and the sound pressure level corresponding to the samples rated as low, medium, and high was used as the experimental audio materials, as shown in Table 2.
Table 2.
Audio file parameters.
2.3.3. Selection and Control of Temperature Environment
The research was conducted in a controllable simulated environment chamber, free from the constraints of natural conditions such as geographical location and season. The simulated room was soundproofed to avoid the influence of other sounds on the experiment. By simulating the outdoor climate, it can effectively shorten the research period and improve research accuracy. Adjustable parameters include temperature, humidity, and wind speed. The experimental operating temperature can accurately reflect the outdoor environment at different temperature levels in Fuzhou. Although simulating outdoor temperature levels only in the environmental chamber cannot fully represent the real outdoor heat environment, it has the advantages of controlling variables to eliminate interference factors and facilitating the analysis of experimental results. Additionally, during the experiment, we maintained the wind speed in the chamber at less than 0.5 m/s to avoid the influence of variable and louder wind noise on the experimental results. At the same time, a fixed monitoring point was set up in the chamber, using a small meteorological station for measurement to monitor the indoor heat environment. The heat environment in the chamber was kept relatively stable during the experiment, with the operating temperature fluctuating within 1.0 °C.
2.3.4. Selection and Monitoring of Physiological Indicators
The objective indicators of this experiment mainly reflect the heart rate parameters of autonomic nervous activity. The physiological data were collected using the ErgoLAB physiological multi-lead instrument manufactured by Beijing Jinfa Technology Co., Ltd (Beijing, China). The measured indicators included heart rate (HR) and electrodermal activity (EDA), as shown in Table 3. The ErgoLAB 3.0 software was used to monitor and analyze the physiological data.
Table 3.
Basic significance of physiological indexes.
2.4. Questionnaire Survey and Analysis
2.4.1. Questionnaire Setting
This study investigated environmental perception using a targeted questionnaire. Supplementary to basic personal information (age, gender, height, weight, attire), informed by previous studies [22,27,28], the questionnaire explored subjective evaluations across three domains: auditory, thermal, and holistic. The precise questionnaire items and their motivations are delineated in Table 4.
Table 4.
Questions and the purposes of the questionnaire in the laboratory.
In the auditory domain, participants evaluated subjective loudness, comfort level, and preference of sounds heard. Subjective loudness and comfort level were chosen as they are fundamental indicators in sound environment assessment, whereas sound preference reflects individuals’ liking for the sounds, irrespective of their comfort implications [26].
The thermal perception section assessed warmth sensation, thermal comfort, and thermal acceptability.
Overall perception encompassed participants’ comfort and annoyance levels, integrating various factors such as physical, psychological, and physiological states, alongside environmental influences like thermal and acoustic environments [29,30,31,32].
2.4.2. Scale Construction
In the realm of subjective assessment, researchers [33] frequently employ a Likert scale ranging from 5 to 7 points. To enhance the precision of evaluative outcomes and to more faithfully capture nuances in subjective experience, a 7-point Likert scale was adopted. Furthermore, to accurately delineate the spectrum of thermal sensations across various climatic conditions, the evaluative framework was expanded to include the extremities of ‘very hot’ and ‘very cold’. Therefore, the thermal sensation evaluation used 9 Likert options, as detailed in Table 5.
Table 5.
The scales of subjective evaluation in the laboratory.
2.4.3. Reliability and Validity of the Questionnaire
The empirical findings were subjected to a rigorous examination of their reliability and validity. This was accomplished through the application of Cronbach’s alpha, a widely recognized measure for assessing internal consistency, and the Kaiser–Meyer–Olkin (KMO) test, which serves as an indicator of sampling adequacy. These procedures were undertaken to affirm the veracity and dependability of the experimental outcomes. In the construction of the questionnaire, an emphasis was placed on employing language that was straightforward and comprehensible. Additionally, the quantity and extent of the survey items were meticulously managed to bolster the instrument’s construct validity.
2.5. Subjects
This study selected young adults aged 18–30 as research subjects to minimize the impact of auditory and thermal sensitivity on the experiment across different age groups. In order to ensure that the sample size meets the requirements of the experiment, a power analysis of the required sample size for the experiment was conducted using G*Power 3.1.9.7. The selection of the statistical approach was anchored in the Repeated Measures Analysis of Variance (ANOVA), a method renowned for its efficacy in analyzing data with correlated observations. The methodological parameters were meticulously calibrated to the following specifications: a within-subjects design was employed, with the effect size (f) set to 0.25, the significance level (α) at 0.05, and the power of the test (1 − β) at 0.95. The experimental design involved three distinct groups, with each group undergoing six measurements. The correlation between these repeated measures was assumed to be 0.50. Based on these parameters, the calculated requisite sample size was determined to be 36 participants [34]. Considering individual differences in sample loss and the need for more accurate research results as well as the issue of data exclusion, 50 participants were recruited for each temperature level, for a total of 150 participants in the experiment. By recruiting participants based on the principle of voluntary participation, prior to the start of the experiment, participants were required to sign an informed consent form to acknowledge the temperature settings inside the environmental chamber. All participants self-reported normal perception ability, absence of any physical discomfort, or other factors that could potentially affect the experimental results. During the experiment, the average resting metabolic rate for participants was 1.11.2 met. Additionally, the average clothing insulation was 0.88 clo at 20 °C, and 0.45 clo at 25 °C and 30 °C [35].
2.6. Experimental Process
2.6.1. Subjective Investigation
The subjective survey was conducted in September (summer) and October (transitional season), as the heat experience and heat expectations can influence perceived evaluations. The temperature in the environmental simulation chamber was simulated to match the actual season to avoid errors. The chamber was equipped with two seats to accommodate two participants at the same time. The chamber environment was soundproof and enclosed, with the door closed during the experiment to maintain a quiet environment. Apart from necessary experimental equipment, no items that could distract the participants’ attention were provided [36].
The study consisted of two stages: heat adaptation and experiment. During the heat adaptation stage, the participants waited for the environmental temperature inside the chamber to stabilize before entering. To ensure accurate experimental results, the participants were instructed to avoid eating and engaging in physical exercise before the experiment, and to select appropriate clothing according to the dressing standards for different seasons. After entering the simulation chamber, the participants needed to sit quietly for 30 min to adapt to the environmental temperature, and then they completed a set of questionnaires under no audio conditions [37]. The experiment was divided into three stages, with the volume gradually increasing. Each stage consisted of 6 audio segments, each lasting 40 s. Participants were required to fill out a set of questionnaires while each audio segment was played (which was calculated in advance to ensure that participants were able to complete the questionnaires while the audio was playing). Within the same stage, there was a 10 s interval between the audio segments, and a 60 s interval between the three stages. To ensure that the results were not affected by the order of play, the order of audio playback for each stage was randomized. All participants at each temperature needed to experience 19 different conditions, including 6 different sound sources, 3 different volumes, and 1 condition with no sound source.
Although the participants showed a stronger perception and attention to sound in the simulated cabin compared to the outdoors, they consistently filled out the questionnaires based on their own feelings, showing a greater focus on answering the questionnaires rather than listening to the sound. Based on this observation, the main purpose of playing audio in the simulated cabin was consistent with the actual goal of the outdoor environment, which is to provide background noise. Therefore, the simulated acoustic environment in the cabin was highly similar to the real outdoor situation, and the survey results obtained are reliable.
2.6.2. Objective Examination
A subjective survey experiment was conducted in three temperature environments, and 12 participants were randomly selected for the physiological indicator experiment. Firstly, the participants were placed in comfortable chairs, and electrodes were attached to their earlobes and fingertips to measure physiological signals. We ensured that the electrodes were inserted correctly, were firmly secured, and that we paid attention to safety to eliminate any abnormal signals. We confirmed that all electrode connections were secure and free of looseness or short circuits. We connected the multimeter host to the laptop and opened the ErgoLAB 3.0 software, selecting appropriate parameters, including sampling frequency and start time, etc. We then conducted a baseline scan and recorded the baseline indicators for subsequent data preprocessing. Before starting the experiment, we conducted a check on the test subject to ensure they were in a good state. Then, we started the multi-sensor host to record physiological signals. We allowed the subject to begin experiencing the environment, and we monitored physiological signals in a timely manner. We also made relevant adjustments to the subject’s state based on real-time data feedback. After the experiment was completed, we recorded physiological data such as HR and EDA, as well as information such as experiment time and experimental procedures.
2.7. Analysis Method
The experimental data were checked for completeness, with outliers either corrected or removed to ensure accuracy and reliability. Post-collection, the objective variables were standardized to calculate their mean and standard deviation.
In this study, Spearman’s correlation analysis was applied to assess relationships between ordinal variables, while ANOVA was utilized to test the impact of varying factors on outcomes. Data analysis was conducted using SPSS 27.0, with ANOVA examining the effects of thermal elements on subjective and physiological responses. Mauchly’s sphericity test was performed, and corrections were applied when necessary—Greenhouse–Geisser for epsilon values under 0.75, and Huynh–Feldt for other cases. The data were validated prior to analysis.
3. Results
3.1. Reliability and Validity of the Questionnaire
The study employed a laboratory simulation approach, collecting data via questionnaires and physiological recorders under varying temperature conditions. Participants, aged 18 to 30, included 56.67% males and 43.33% females. Questionnaire analysis revealed a total reliability of 0.718, suggesting the questionnaire’s reliability was adequate for credible research findings. The KMO measure for the laboratory section was 0.833 (p = 0.000 < 0.01), exceeding the standard for acceptability.
3.2. Effect of Temperature on Acoustic Perception
In this section, the study examines how temperature affects the perception of sound, with experiments conducted at 20 °C, 25 °C, and 30 °C. The analysis centers on the interplay between temperature and the subjects’ auditory experiences. The research delves into the perception of various sound types—natural (e.g., birdcall, water flowing sounds), human-made (e.g., conversations), and artificial (e.g., light music, traffic, mowing sounds)—at different temperatures. The emphasis is on tracking changes in subjective evaluations like loudness, comfort, and preference, alongside physiological responses.
3.2.1. Effect of Temperature on the Acoustic Subjective Loudness
Effect of Different Temperatures on Subjective Loudness
The influence of different temperatures on subjective loudness was studied. The results showed that when the subjects were used as the baseline in a silent environment, regardless of the temperature, the subjective loudness values tended to be in the quiet range and were close to each other.
In response to birdcall stimuli at varying temperatures, Figure 2 illustrates a biphasic effect on subjective loudness. Low- and high-volume sounds showed the most pronounced changes, with low-volume sounds peaking at 25 °C (+0.34 from 20 °C) and dipping at 30 °C (−0.24 from 25 °C). High-volume sounds experienced a slight gain at 25 °C (+0.08 from 20 °C) but a more significant drop at 30 °C (−0.34 from 25 °C).
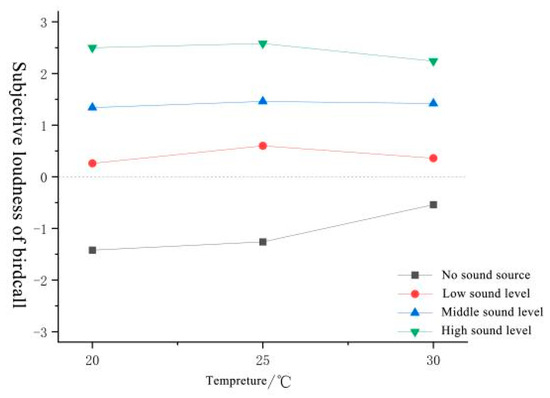
Figure 2.
Subjective loudness of birdcall under the influence of different temperatures.
Figure 3 demonstrates that as temperature rose, the subjective loudness of water flow sounds for low and mid-volumes initially increased before declining, with high-volume sounds remaining largely constant. Notably, low-volume sounds exhibited a more significant fluctuation, increasing by 0.50 at 25 °C and decreasing by 0.24 at 30 °C.
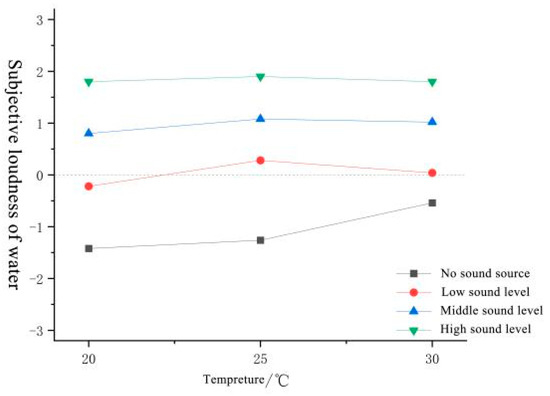
Figure 3.
Subjective loudness of water under the influence of different temperatures.
As depicted in Figure 4, the subjective loudness of conversation sounds exhibited a pattern of increase followed by decrease with rising temperature. The most notable shifts occurred in the low volume, which increased by 0.14 at 25 °C and subsequently dropped by 0.56 at 30 °C.
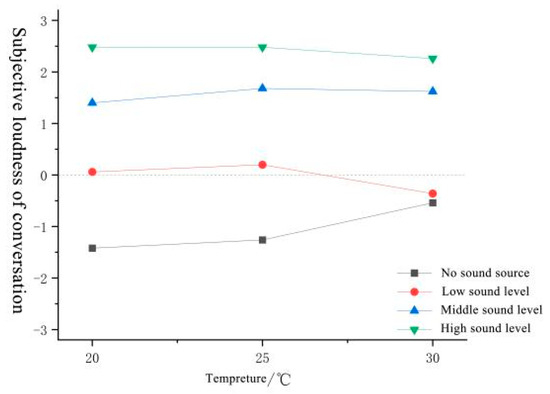
Figure 4.
Subjective loudness of conversation under the influence of different temperatures.
In the case of light music, Figure 5 indicates that subjective loudness for low and high volumes remained relatively stable with temperature increases. In contrast, mid-volume loudness peaked at 25 °C with an increase of 0.24 from 20 °C, only to decline by 0.34 at 30 °C.
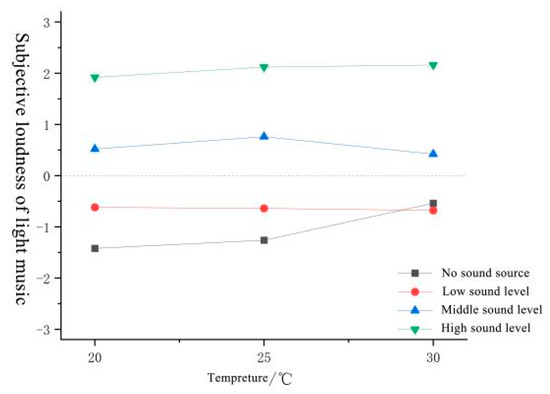
Figure 5.
Subjective loudness of light music under the influence of different temperatures.
Figure 6 illustrates the varying impact of temperature on the perceived loudness of traffic noise. Low-volume sounds exhibited an initial increase of 0.42 at 25 °C over 20 °C, followed by a significant decrease of 0.96 at 30° C. Mid-volume sounds, however, displayed a consistent rise, with an increase of 0.14 at 25 °C and an additional 0.34 at 30 °C. High-volume sounds remained largely unaffected by temperature changes.

Figure 6.
Subjective loudness of traffic under the influence of different temperatures.
Figure 7 shows that for the sound of cutting grass, the subjective loudness of low and mid-volumes followed an ascending then descending trend with temperature increase, whereas high-volumes remained relatively constant. Specifically, low-volumes rose by 0.22 at 25 °C and fell by 0.12 at 30 °C, while mid-volumes increased by 0.30 at 25 °C and by 0.16 at 30 °C compared to 20 °C.
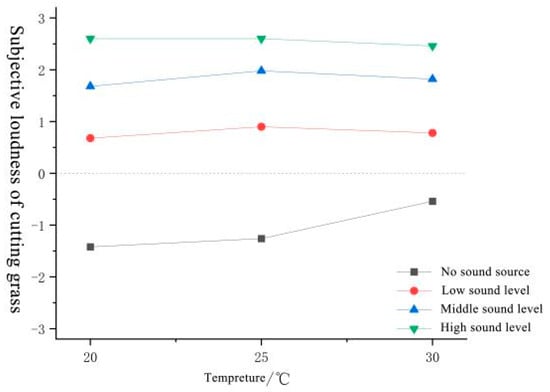
Figure 7.
Subjective loudness of cutting grass under the influence of different temperatures.
Subjective Loudness Analysis under Thermal–Acoustic Interaction
Multiple factor analysis of variance was used to compare the differences in the influence of temperature on subjective loudness, with sound type (referred to as sound for short) and volume temperature level as independent variables. As shown in the multiple factor analysis of variance of subjective loudness in Table 6, sound type (p = 0.000 < 0.01), volume (p = 0.000 < 0.01), and temperature level (p = 0.001 < 0.01) had a significant impact on subjective loudness. The interaction effect of sound type and volume (p = 0.000 < 0.01), as well as volume and temperature level (p = 0.035 < 0.05), was significant, indicating that temperature will have an impact on the evaluation of subjective loudness. For main effects that are significant, if there is a significant interaction with other factors, the impact of the interaction will be specifically analyzed. Considering that the focus of this study is the perception effect of sound–heat interaction, the influence of sound–heat interaction factors is the main focus in this paper among factors with significant interaction, and the discussion does not focus on the independent impact differences of sound on itself, such as sound type and volume both belonging to the sound variable.
Table 6.
ANOVAs of subjective loudness.
The model was refined by eliminating non-significant factors and further analyzing significant interactions through single main effect tests. Table 7 details multiple comparisons between volume levels and temperature conditions.
Table 7.
Multiple comparisons of subjective loudness under the influence of volume and temperature type.
Without sound sources, low and medium heat were grouped and significantly differ from high heat (p < 0.001), suggesting subjective loudness escalates with temperature. For low-volume sounds, subjective loudness was lowest in high heat and peaked in medium heat, with no significant difference between high and low heat.
In the case of medium-volume sounds, subjective loudness was lowest in low heat and highest in medium heat, with significant differences only between these two levels. High-volume sounds showed no significant variation in subjective loudness across temperature conditions, although medium heat tended to have the highest perceived loudness, and high heat had the lowest.
As per Table 8, which details the interaction effects of temperature and volume, the mean subjective loudness was compared across conditions. The findings indicate that subjective loudness consistently increased with higher volume levels across all temperatures, forming distinct homogeneous subsets. This pattern suggests a graded evaluation trend, implying that temperature does not influence the subjective loudness that results from volume adjustments.
Table 8.
Multiple comparisons of subjective loudness under the influence of temperature type and volume.
3.2.2. Effect of Temperature on Acoustic Comfort
Effect of Different Temperatures on Acoustic Comfort
This study examined how varying temperatures affect sound comfort. As a baseline, participants in a silent environment reported comfort values that were generally comfortable and similar across temperatures. Figure 8 illustrates that with birdcall as the stimulus, low-volume sound comfort showed a decrease at 25 °C, followed by an increase at 30 °C, while medium-volume sound comfort followed an opposite pattern. Specifically, low-volume comfort was 0.04 lower at 25 °C but rose by 0.22 at 30 °C. High-volume comfort decreased by 0.16 at 25 °C and then increased by 0.10 at 30 °C. Medium-volume comfort peaked at 25 °C with an increase of 0.16 but dropped significantly by 0.44 at 30 °C.
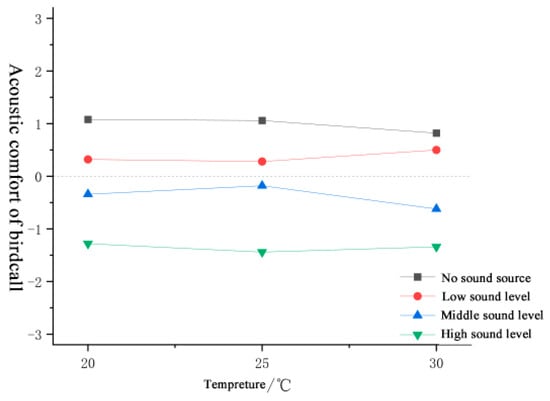
Figure 8.
Acoustic comfort of birdcall under the influence of different temperatures.
Figure 9 demonstrates that as temperature rose with water flow sounds, comfort values across all volume levels declined. At 25 °C, low-volume comfort decreased by 0.30 from 20 °C, and a further slight reduction of 0.12 was observed at 30 °C. Medium-volume comfort experienced a 0.16 drop at 25 °C and a more substantial 0.42 decrease at 30 °C. High-volume comfort also saw a consistent reduction of 0.20 at both temperature increments.
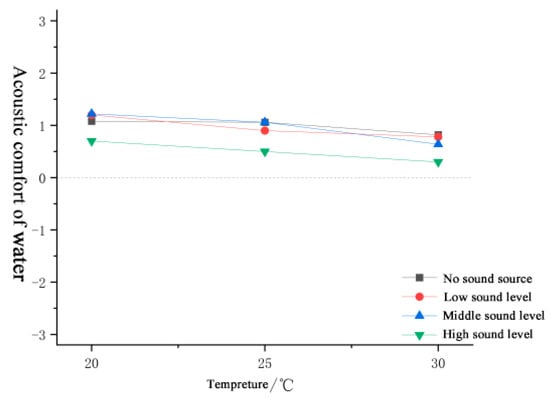
Figure 9.
Acoustic comfort of water under the influence of different temperatures.
Figure 10 indicates that temperature influences on comfort value for conversation sounds varied by volume level. Low volume showed a subtle trend of decreasing and then increasing, with a 0.16 drop at 25 °C and a subsequent 0.22 rise at 30 °C. Medium volume consistently decreased, with a 0.20 reduction at 25 °C and an additional 0.08 drop at 30 °C. High volume, conversely, exhibited a gradual increase, dipping slightly by 0.04 at 25 °C but soaring by 0.54 at 30 °C.
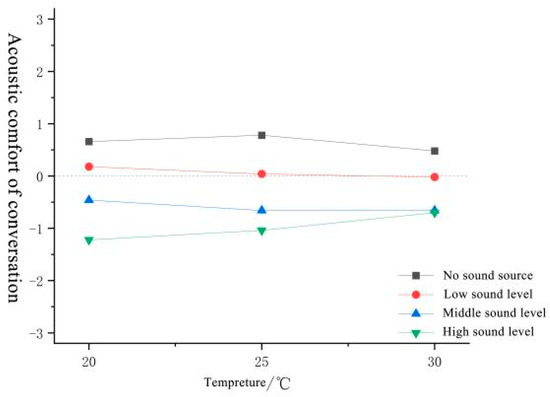
Figure 10.
Acoustic comfort of conversation under the influence of different temperatures.
Figure 11 illustrates the varying comfort levels of light music across different volume levels in response to temperature changes. Low and medium volumes exhibited an initial rise followed by a decline: low volume rose by 0.08 at 25 °C then fell by 0.20 at 30 °C, while medium volume peaked by 0.22 at 25 °C and dipped by 0.16 at 30 °C. In contrast, high volume demonstrated a decrease of 0.38 at 25 °C, rebounding with an increase of 0.32 at 30 °C.
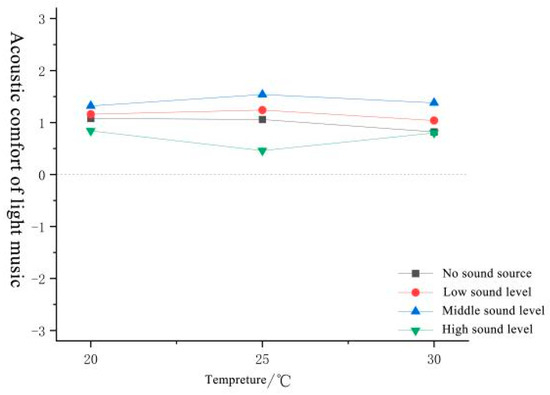
Figure 11.
Acoustic comfort of light music under the influence of different temperatures.
Figure 12 displays the impact of temperature on comfort levels for traffic noise across volume categories. Low-volume comfort fluctuated, dropping by 0.16 at 25 °C and rising by 0.06 at 30 °C. Medium-volume comfort steadily declined, with a 0.40 reduction at 25 °C and a further 0.08 decrease at 30 °C. High-volume comfort consistently improved, gaining 0.04 at 25 °C and significantly increasing by 0.54 at 30 °C.
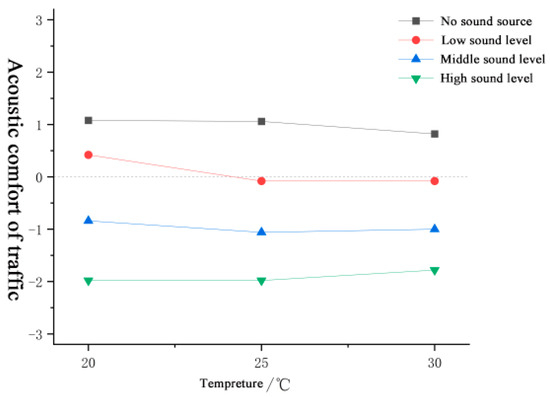
Figure 12.
Acoustic comfort of traffic under the influence of different temperatures.
Figure 13 indicates that the comfort levels of grass cutting sounds varied with temperature, showing distinct patterns for different volume levels. Low-volume comfort steadily declined, with a 0.02 reduction at both 25 °C and 30 °C intervals. Medium-volume comfort initially dropped by 0.20 at 25 °C but recovered partially with a 0.10 increase at 30 °C. High volume comfort exhibited a consistent upward trend, edging up by 0.02 at 25 °C and by 0.16 at 30 °C.
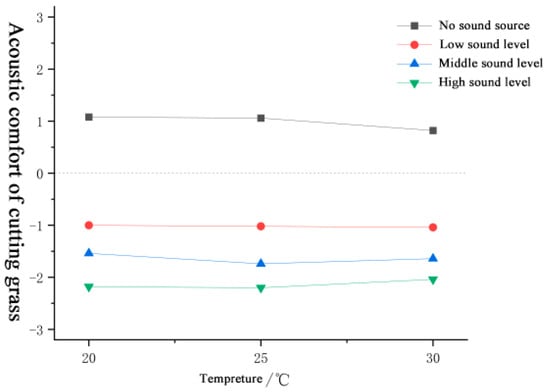
Figure 13.
Acoustic comfort of cutting grass under the influence of different temperatures.
Analysis of Acoustic Comfort under Thermal–Acoustic Interaction
A multifactor analysis of variance (MANOVA) was employed to discern the temperature’s differential impact on sound comfort, with the findings detailed in Table 9. The analysis revealed significant effects of sound type (p < 0.01), volume (p < 0.01), and a marginal effect of temperature level (p = 0.074) on comfort perception. Additionally, significant interactions were observed between sound type and volume (p < 0.01), and between volume and temperature level (p = 0.089), underscoring the influence of temperature on sound comfort evaluations.
Table 9.
ANOVAs of acoustic comfort.
Table 10 presents the results of multiple comparisons for mean acoustic comfort values under the interaction of volume and temperature. The findings indicate no significant differences in acoustic comfort across varying temperatures at constant volume levels.
Table 10.
Multiple comparisons of acoustic comfort under the influence of volume and temperature type.
Multiple comparisons were conducted on temperature and volume levels, as shown in Table 11. For the three temperature conditions, high, medium, and low volumes were divided into three homogeneous subsets, indicating significant differences in sound comfort for different volume levels at different temperature levels (p = 0.000 < 0.01). Additionally, as the volume increased, sound comfort gradually decreased. For the medium-high temperature condition, the volume was divided into three homogeneous subsets, indicating lower sound comfort when sound was present compared to when it was absent.
Table 11.
Multiple comparisons of acoustic comfort under the influence of temperature type and volume.
3.2.3. Effect of Temperature on Acoustic Preference
Effect of Different Temperatures on Acoustic Preference
This study assessed the influence of temperature on sound preference, using a silent environment as a neutral baseline. Across temperatures, sound preference ratings were uniformly positive. With birdcall stimuli, as shown in Figure 14, sound preference exhibited a temperature-dependent dynamic: low-volume preferences increased by 0.24 at 25 °C and peaked at 30 °C with an additional 0.06; medium-volume preferences rose by 0.12 at 25 °C but declined by 0.38 at 30 °C; high-volume preferences showed an initial decrease of 0.04 at 25 °C, followed by a 0.16 increase at 30 °C.
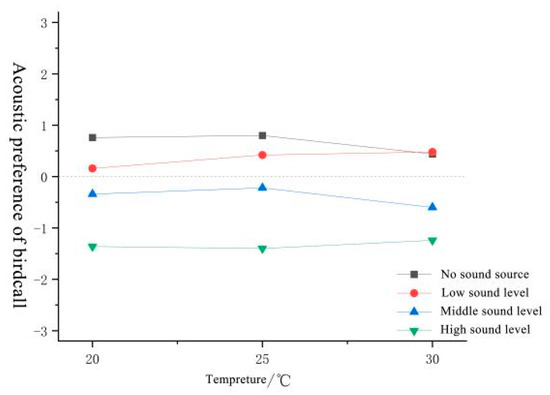
Figure 14.
Acoustic preference of birdcall under the influence of different temperatures.
Figure 15 presents the impact of temperature elevation on comfort values for water flow sounds across varying volume levels, indicating an overall decline. For low volume, the comfort value diminished by 0.14 at 25 °C and further by 0.16 at 30 °C. Medium volume experienced a 0.08 reduction at 25 °C, with a more pronounced 0.46 decrease at 30 °C. High volume showed a 0.24 decline at 25 °C, followed by an additional 0.14 reduction at 30 °C.
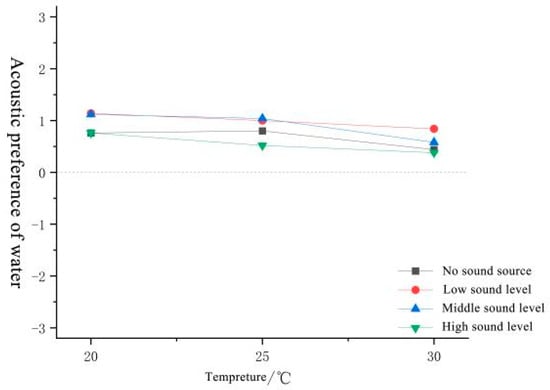
Figure 15.
Acoustic preference of water under the influence of different temperatures.
Figure 16 delineates the temperature-induced variations in comfort values associated with conversational sounds. Low- to medium-volume sounds exhibited a subtle biphasic trend, with comfort values initially declining and then marginally rising. In contrast, high-volume sounds demonstrated a clear and progressive increase in comfort. Specifically, low-volume comfort values decreased by 0.36 at 25 °C and subsequently rose by 0.08 at 30 °C. Medium-volume comfort values followed a similar initial decline by 0.14 at 25 °C, with a minor increase of 0.02 at 30 °C. High-volume comfort values consistently improved, increasing by 0.28 at 25 °C and further by 0.26 at 30 °C.
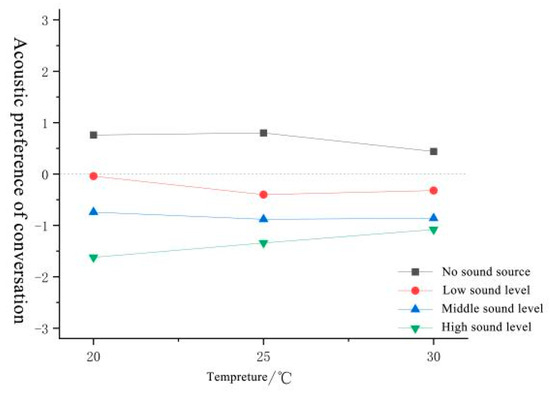
Figure 16.
Acoustic preference of conversation under the influence of different temperatures.
Figure 17 illustrates the nuanced response of comfort levels to temperature changes for light music across volume categories. Low-volume sound comfort exhibited a modest initial increase, followed by a pronounced decrease as temperature rose; it increased by 0.04 from 20 °C to 25 °C and then decreased by 0.46 from 25 °C to 30 °C. Medium-volume sound comfort followed a similar pattern, with an increase of 0.22 from 20 °C to 25 °C and a subsequent decrease of 0.20 from 25 °C to 30 °C. High-volume sound comfort, in contrast, displayed an inverse trend, decreasing by 0.26 from 20 °C to 25 °C and rebounding with an increase of 0.42 from 25 °C to 30 °C.
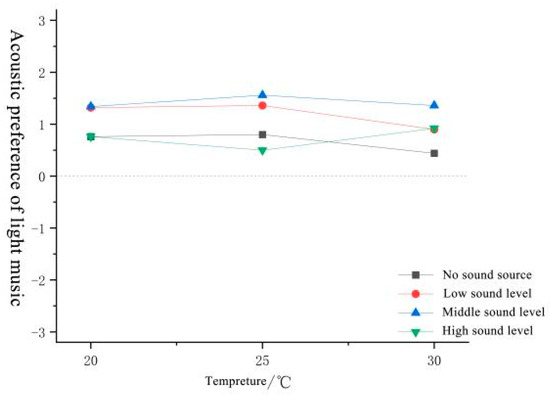
Figure 17.
Acoustic preference of light music under the influence of different temperatures.
Figure 18 demonstrates the impact of temperature on comfort levels associated with traffic noise, revealing a non-monotonic relationship for low and medium volumes, in contrast to the relative stability of high-volume preferences. For low-volume sound, comfort diminished by 0.54 units at the transition from 20 °C to 25 °C, followed by a mild recovery of 0.08 units upon further temperature elevation to 30 °C. Medium-volume sound experienced a more consistent decline, with a 0.28 unit decrease from 20 °C to 25 °C and an additional 0.20 unit reduction from 25 °C to 30 °C. High-volume sound comfort remained largely invariant across the temperature gradient.
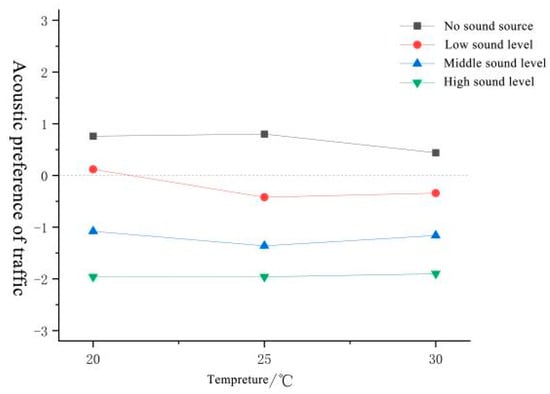
Figure 18.
Acoustic preference of traffic under the influence of different temperatures.
Figure 19 illustrates the temperature-dependent comfort dynamics for the sound of grass cutting, with low-volume sound exhibiting a fluctuating pattern and medium-volume sound displaying a gradual decline, albeit with non-significant changes. Specifically, low-volume comfort experienced an initial decrease of 0.18 units at 25 °C, then an equivalent increase at 30 °C. High-volume comfort underwent a slight reduction of 0.04 units at 25 °C, counterbalanced by a subsequent rise of 0.18 units at 30 °C. In contrast, the comfort of medium-volume sound demonstrated a more moderate decline, with decrements of 0.08 units at 25 °C and an additional 0.04 units at 30 °C.
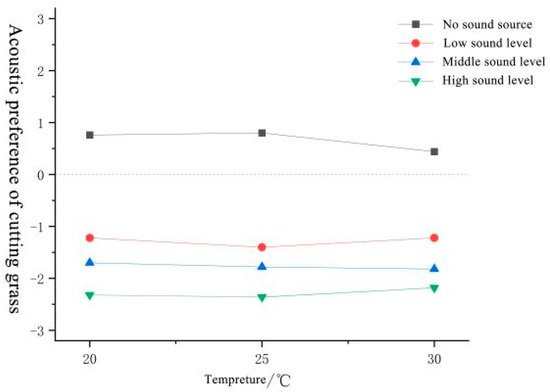
Figure 19.
Acoustic preference of cutting grass under the influence of different temperatures.
Analysis of Acoustic Preference under Thermal–Acoustic Interaction
Using multiple factor analysis of variance, the impact of sound type and volume on sound preference at different temperatures was examined. As shown in Table 12, both sound type and volume had a significant impact on sound preference (p = 0.000 < 0.01). Additionally, the interaction effects of sound type and volume (p = 0.000 < 0.01) as well as volume and temperature level (p = 0.096 < 0.1) reached significant levels, indicating that temperature can affect sound preference assessment.
Table 12.
ANOVAs of acoustic preference.
After removing factors that had no significant statistical significance, multiple comparisons were made on the volume and temperature, as shown in Table 13. The study found that the three different temperatures had no significant impact on the preference for sound at different volume levels.
Table 13.
Multiple comparisons of acoustic preference under the influence of volume and temperature type.
Table 14 presents the outcomes of a multiple comparison analysis of mean sound preference under varying conditions of temperature and volume. The data delineated three homogeneous subsets for volume at three distinct temperature points, revealing that sound preference was consistently lower than that for silence.
Table 14.
Multiple comparisons of acoustic preference under the influence of temperature type and volume.
3.2.4. Effect of Temperature on Physiological Indicators
Analysis of the HR Impact
After analyzing Table 15, it was found that under medium-heat conditions, the average HR value was the highest at 70.24, followed by high heat temperature at 67.56, and finally low-heat temperature at 63.80, all within the normal HR range. The HR variation was highest under high-heat conditions, followed by medium-heat conditions, and finally low-heat conditions. The results of one-way ANOVA showed a significant difference between the HR variation values at different temperatures (p = 0.000 < 0.01). The post hoc LSD test revealed significant differences in HR variation values between low heat and medium heat, as well as between low heat and high heat (p = 0.000 < 0.01). This indicates that different temperatures can cause changes in HR. Under low-heat conditions, the subjects felt comfortable, their heartbeats were steady, and their heart rates slightly decreased.
Table 15.
Mean and variability of HR under the three temperature conditions.
- (1)
- Low-heat condition
In states of low heat, the study’s findings shown in Figure 20a demonstrate a consistent downward trend in HR with low-intensity auditory stimuli. This suggests that the lower volume sounds did not sufficiently trigger strong emotional arousal. Figure 20b indicates that at moderate volumes, the HR was positively influenced by light music, traffic, and lawn mowing sounds, contrasting with the negative impact of birdcall and water flow, likely due to the emotional responses they provoke. At high volumes, as depicted in Figure 20c, birdcall, conversation, traffic, and lawn mowing sounds were linked to an increase in HR, while the sound of water and light music had the opposite effect, highlighting the varying impacts of sound intensity and rhythm. Although the study did not reveal significant physiological effects based on sound type and volume under low heat, the heightened stress perception from high-volume conversation was evident in the corresponding HR increase.
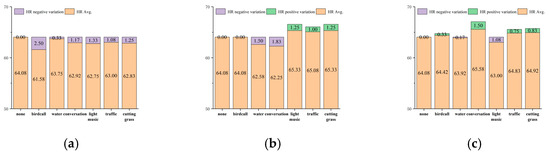
Figure 20.
Mean and variability of HR of different volumes under the low-heat condition. (a) Low volume. (b) Medium volume. (c) High volume.
- (2)
- Medium-heat condition
In the medium-heat condition, Figure 21a indicates that low-volume sounds of birds, water, conversation, and traffic positively influenced participants’ HR, suggesting a stimulating effect. In contrast, light music and mowing sounds negatively affected HR, hinting at a calming effect at lower volumes. At medium volume, Figure 21b shows that birdcall, conversations, light music, and lawn mowing sounds led to increased HR, indicating heightened excitement, while the sound of water and traffic had a calming effect. High-volume conditions, as seen in Figure 21c, uniquely affected HR, with light music having a relaxing impact, while other sounds were more stimulating. The study’s LSD multiple comparisons did not reveal significant physiological differences based on sound type and volume.
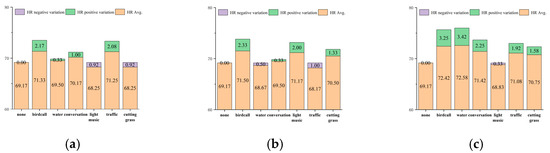
Figure 21.
Mean and variability of HR of different volumes under the medium-heat condition. (a) Low volume. (b) Medium volume. (c) High volume.
- (3)
- High-heat condition
Under high-temperature conditions, Figure 22a shows that at a low volume, environmental sounds like bird calls, flowing water, conversations, traffic, and lawn mowing positively affected subjects’ HR, while light music uniquely decreased it. This highlights the amplified influence of ambient sounds in a hot environment and the varying effects of different sound types. At medium volume, as seen in Figure 22b, all sound types uniformly increased HR, indicating a more significant impact of sound volume. High volume, according to Figure 22c, uniformly led to an increase in HR across all sound types, suggesting that volume had a more substantial effect than sound type. The study’s LSD multiple comparisons did not find significant differences in the physiological responses to different sound types and volumes.
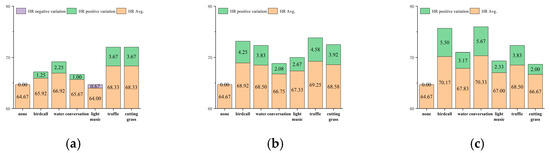
Figure 22.
Mean and variability of HR of different volumes under the high-heat condition. (a) Low volume. (b) Medium volume. (c) High volume.
Analysis of EDA Influence
Table 16 delineates a gradient in the EDA value fluctuations of subjects subjected to three temperature settings, with high-heat conditions yielding the most pronounced changes, followed by medium-heat and low-heat conditions. The one-way ANOVA confirms a significant difference in EDA values across the temperature conditions (p = 0.000 < 0.01). Post hoc LSD tests further identified significant differences in EDA values between the low-heat and medium-heat conditions, as well as between the medium-heat and high-heat conditions (p = 0.000 < 0.01). These findings suggest that temperature significantly modulates the human autonomic nervous system, with effects that are not only measurable but also statistically significant, thereby providing a solid foundation for future research on the physiological effects of temperature on the human body.
Table 16.
Mean and variability of EDA under the three temperature conditions.
- (1)
- Low-heat condition
Under low-heat conditions, Figure 23a demonstrates that at a low volume, all sound types elicited a positive shift in subjects’ EDA values, with the intensity of change descending from grass cutting to light music. At medium volume, as shown in Figure 23b, the positive trend in EDA values persisted, with water flow now at the top and light music at the bottom. High volume, depicted in Figure 23c, maintained this pattern, with traffic sounds causing the greatest change and conversation the least. Consequently, EDA values consistently rose in response to sound types at all volume levels, and the influence of these sound types on EDA values was volume dependent.
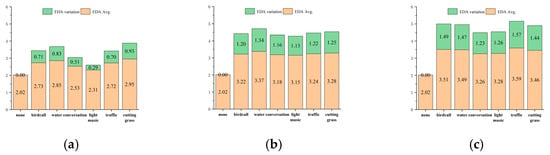
Figure 23.
Mean and variability of EDA of different volumes under the low-heat condition. (a) Low volume. (b) Medium volume. (c) High volume.
- (2)
- Medium-heat condition
In the condition of medium heat, as depicted in Figure 24a, low-volume sounds uniformly triggered a positive shift in EDA values, with no significant difference among the types of sounds. Figure 24b illustrates that at a medium volume, the positive EDA changes persisted, with mowing and birdcall showing similar effects to traffic, conversation, and light music. At a high volume, as shown in Figure 24c, all sound types continued to elicit a positive EDA response, indicating a consistent impact across different auditory stimuli. These outcomes underscore that volume levels of environmental sounds can significantly affect an individual’s physiological responses.

Figure 24.
Mean and variability of EDA of different volumes under the medium-heat condition. (a) Low volume. (b) Medium volume. (c) High volume.
- (3)
- High-heat condition
Under high-heat conditions, Figure 25a indicates that all sound types, including water flow, lawn mowers, bird calls, traffic noise, conversation, and light music, uniformly induced a positive change in subjects’ EDA values at low volume. The pattern persisted at medium volume, as shown in Figure 25b, where the EDA values remained positively altered. Similarly, high volume, as shown in Figure 25c, continued to elicit a positive response in EDA values across all sound types. These findings imply that the volume of auditory stimuli uniformly influences physiological responses, irrespective of the specific sound in high-arousal environments.
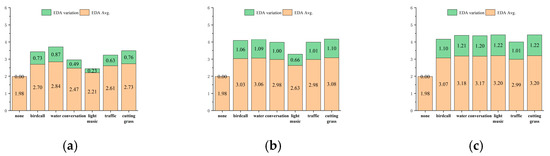
Figure 25.
Mean and variability of EDA of different volumes under the high-heat condition. (a) Low volume. (b) Medium volume. (c) High volume.
3.3. Effect of Sound on Thermal Perception
This section investigates the effects of auditory stimuli from natural, human-made, and artificial sources on temperature perception. It provides a detailed analysis of how these sounds, varying in type and volume, influence thermal perception dimensions such as sensation, comfort, acceptance, and physiological responses.
3.3.1. Effect of Sound on Thermal Sensation
Effect of Natural Sound on Thermal Sensation
This study investigated the impact of sound on thermal sensation, using the thermal sensation of subjects in a silent environment as a baseline. Figure 26 shows the thermal sensation under the influence of birdcall. When birdcall was introduced and the volume increased, the thermal sensation ratings during high heat showed a decreasing trend, reaching the lowest values under low-volume conditions, with a decrease of 0.52 compared to the silent environment. However, the thermal sensation remained relatively unchanged during low to medium heat.
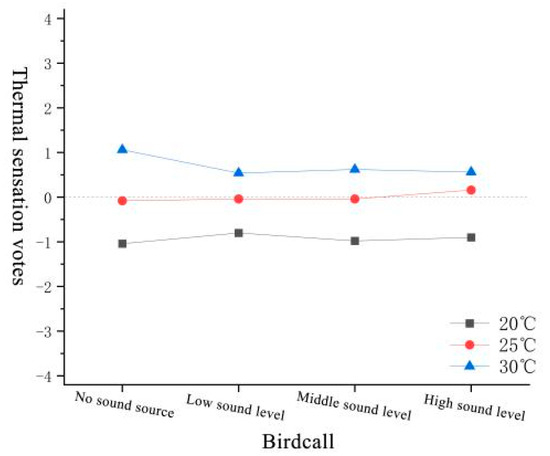
Figure 26.
Thermal sensation votes under the influence of birdcall.
The impact of water flow sound on thermal sensation is shown in Figure 27. The results indicated that with the introduction of water flow sound and an increase in volume, the thermal sensation ratings showed a decreasing trend under high-heat conditions, reaching the lowest values at high volume, with a decrease of 0.74. However, the thermal sensation remained relatively unchanged during low to medium heat conditions.
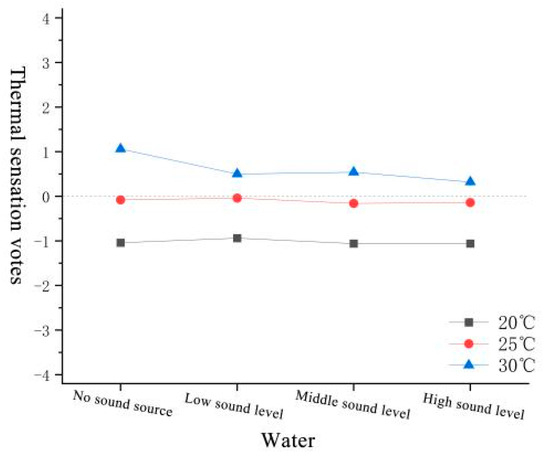
Figure 27.
Thermal sensation votes under the influence of water.
Effect of Human-Made Sound on Thermal Sensation
Figure 28 illustrates the nuanced influence of conversation on thermal sensation. Under low-heat conditions, the thermal sensation evaluation value initially increased with the introduction of conversation, then decreased as the volume rose, and finally increased again at higher volumes. In moderate-temperature settings, the evaluation value showed a linear increase with conversation volume. High-heat conditions revealed an inverse U-shaped trend, with an initial decrease in sensation followed by an increase.
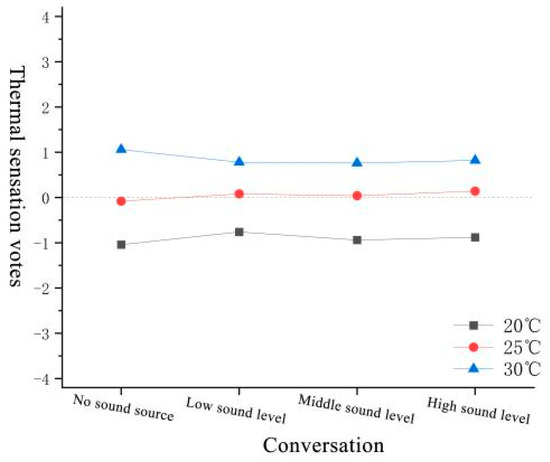
Figure 28.
Thermal sensation votes under the influence of conversation.
Specific numerical changes were as follows: At low heat, the evaluation value increased by 0.28 at low volume, decreased by 0.18 at medium volume, and increased by 0.06 at high volume relative to the previous conditions. At moderate heat, the evaluation value increased by 0.16 at low volume, by 0.14 at medium volume, and by 0.22 at high volume compared to the silent baseline. At high heat, the evaluation value decreased by 0.28 at low volume, decreased slightly by 0.02 at medium volume, and increased by 0.06 at high volume relative to the medium-volume condition.
Effects of Artificial Sound on Thermal Sensation
The impact of light music on thermal sensation is shown in Figure 29. With the introduction of light music and an increase in volume, the thermal sensation evaluation values show a trend of first increasing and then decreasing in low heat, almost no impact in moderate heat, and a trend of first decreasing and then increasing in high heat. In low heat, the evaluation value increased by 0.22 when the sound was at a low volume compared to no sound source, showed no significant change when the sound was at a medium volume compared to low volume, and then decreased by 0.14 when the sound was at a high volume compared to medium volume. In high heat, the evaluation value decreased by 0.26 when the sound was at a low volume compared to no sound source, decreased by 0.46 when the sound was at a medium volume compared to low volume, but then increased by 0.18 when the sound was at a high volume compared to medium volume.
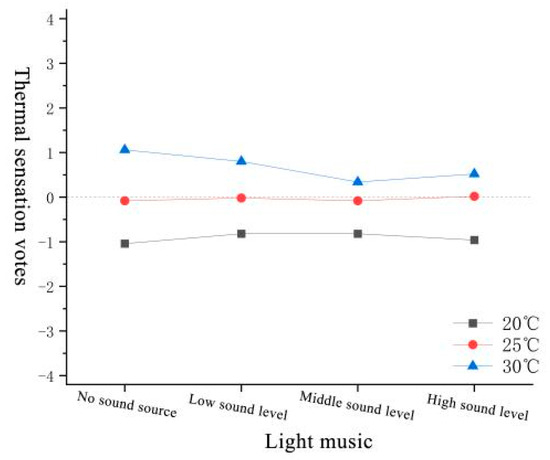
Figure 29.
Thermal sensation votes under the influence of light music.
Figure 30 demonstrates the fluctuating effect of traffic sounds on thermal sensation evaluation across varying temperature conditions. In low-heat scenarios, the values initially climbed, then dipped, and ultimately rose again with the introduction and escalation of traffic sound volume. Medium-heat conditions showed a consistent increase in thermal sensation evaluation values, while high-heat conditions displayed an inverse trend, starting with a decrease and ending with an increase. Specifically, at low heat, the evaluation value experienced a 0.22 increase at low volume, a 0.18 decrease at medium volume, and an 0.08 increase at high volume. At medium heat, the value increased by 0.22 at low volume and by 0.08 at high volume, with minimal change at medium volume. High-heat conditions saw a 0.40 decrease at low volume, a 0.04 decrease at medium volume, and a notable 0.28 increase at high volume.

Figure 30.
Thermal sensation votes under the influence of traffic.
Figure 31 captures the dynamic impact of mowing sound on thermal sensation across a spectrum of heat conditions. In low-heat scenarios, the evaluation value for thermal sensation peaked with the introduction of sound at low volume, then receded as volume increased. The medium heat condition witnessed a continuous rise in evaluation values. High heat, however, presented a biphasic response, with an initial decline followed by an increase. Specifically, at low heat, the evaluation value jumped by 0.26 at low volume, receded by 0.14 at medium volume, and further decreased by 0.10 at high volume. At medium heat, the value gently climbed by 0.14 at low volume, advanced by 0.06 at medium volume, and escalated by 0.12 at high volume. Under high heat, the evaluation value initially dropped by 0.26 at low volume, stabilized at medium volume, and then rose by 0.04 at high volume.
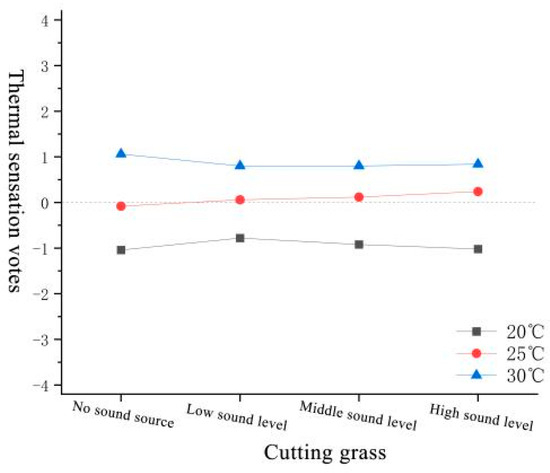
Figure 31.
Thermal sensation votes under the influence of cutting grass.
Thermal Sensation Analysis under Thermal–Acoustic Interaction
Utilizing a multifactorial analysis of variance, we analyzed the impact of sound on thermal sensation. Table 17 indicates that the type of sound (p = 0.001 < 0.01) and the temperature level (p = 0.001 < 0.01) significantly affected thermal sensation. Importantly, the absence of a significant interaction between sound type and temperature (p > 0.1) implies that the influence of sound on thermal sensation is independent of temperature conditions.
Table 17.
ANOVAs of thermal sensation.
3.3.2. Effect of Sound on Thermal Comfort
Effect of Natural Sound on Thermal Comfort
The research explored the effects of birdcall sounds on thermal comfort, with thermal comfort in a silent environment serving as the reference point. Figure 32 demonstrates the nuanced impact of birdcall on thermal comfort across varying heat levels. Under low heat, the evaluation value for thermal comfort peaked at low volumes of birdcall and then declined. Medium heat showed a more intricate pattern of initial increase, decrease, and a final increase. High heat conditions were characterized by a steady decrease in thermal comfort as birdcall volume rose. Specifically, under low heat, the evaluation value improved by 0.16 at low volume, declined by 0.30 at medium volume, and remained relatively stable at high volume. Under medium heat, the value increased by 0.12 at low volume, decreased by 0.32 at medium volume, and slightly rebounded by 0.04 at high volume. High heat saw a 0.06 decrease at low volume, a further 0.30 decrease at medium volume, and an additional 0.30 decrease at high volume.
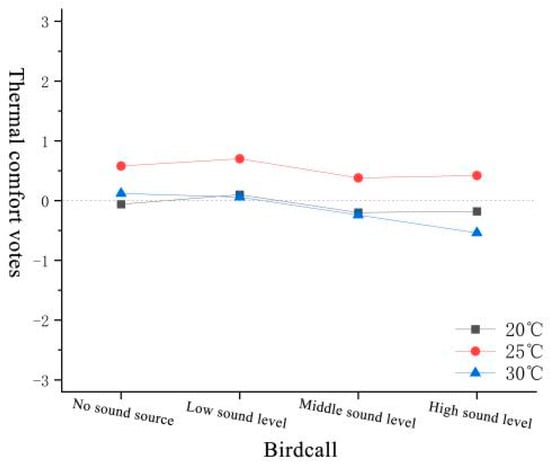
Figure 32.
Thermal comfort votes under the influence of birdcall.
Figure 33 illustrates the influence of water flow sounds on thermal comfort across varying heat conditions. Under low heat, thermal comfort evaluation followed an initial increase and subsequent decrease with the introduction of water flow sounds. Medium heat showed a similar pattern, while high-heat conditions exhibited a steady increase in thermal comfort as the volume of water flow sounds grew. Specifically, under low heat, the evaluation value rose by 0.08 at low volume, declined by 0.14 at medium volume, and decreased further by 0.06 at high volume. Under medium heat, the value was relatively stable at low volume, increased by 0.14 at medium volume, and then declined by 0.04 at high volume. High heat conditions revealed no significant change at low volume, a modest increase of 0.02 at medium volume, and a significant rise of 0.24 at high volume.
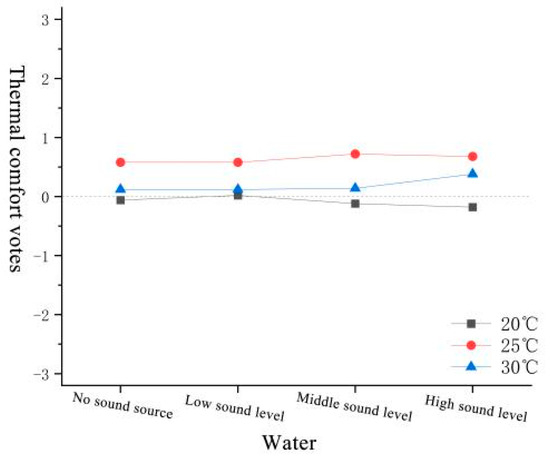
Figure 33.
Thermal comfort votes under the influence of water.
Effect of Human-Made Sound on Thermal Comfort
Figure 34 illustrates the varying influence of conversational sounds on thermal comfort across different heat conditions. In low- and medium-heat scenarios, thermal comfort evaluation values rose with the introduction of sounds at low volume and subsequently fell as the volume increased. In contrast, high-heat conditions were characterized by a steady decrease in thermal comfort evaluation values as the volume of conversational sounds grew. Specifically, for low heat, the evaluation value peaked with a 0.28 increase at low volume, declined by 0.26 at medium volume, and reduced further by 0.10 at high volume. For medium heat, the value marginally increased by 0.04 at low volume, decreased by 0.10 at medium volume, and dropped by 0.12 at high volume. High-heat conditions revealed an initial decrease of 0.24 at low volume, a subsequent decrease of 0.06 at medium volume, and a further decline of 0.14 at high volume.
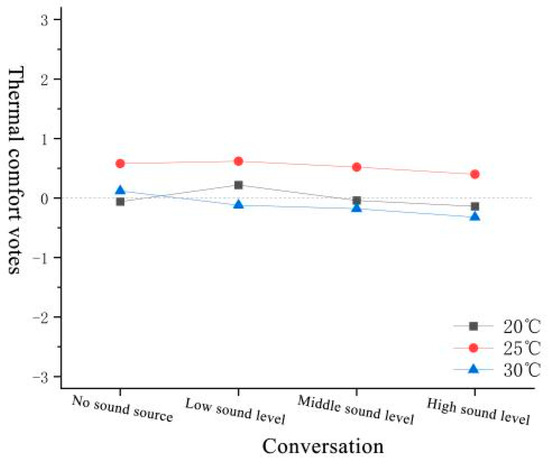
Figure 34.
Thermal comfort votes under the influence of conversation.
Effect of Artificial Sound on Thermal Comfort
Figure 35 illustrates the nuanced impact of light music on thermal comfort across different thermal environments. In low and medium thermal conditions, the subjects’ thermal sensation evaluations exhibited an initial increase followed by a decrease as the volume of light music rose. However, in high thermal conditions, the evaluations traced a more complex trajectory, starting with a decrease, followed by an increase, and concluding with a decrease. In the low thermal environment, the thermal sensation assessment climbed by 0.32 at low volume, edged up by 0.04 at medium volume, and then plummeted by 0.40 at high volume. In the medium thermal environment, the assessment increased by 0.18 at low volume, rose by 0.08 at medium volume, and then dipped by 0.16 at high volume. High thermal conditions revealed an initial decline of 0.08 at low volume, a notable increase of 0.32 at medium volume, and a subsequent decrease of 0.24 at high volume.
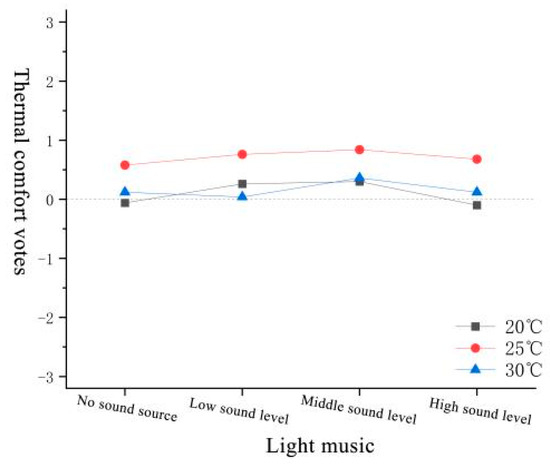
Figure 35.
Thermal comfort votes under the influence of light music.
Figure 36 illustrates the varying influence of traffic noise on thermal comfort across different thermal environments. In low-heat conditions, thermal comfort evaluation values rose with the introduction of low-volume traffic noise and then fell as the volume increased. During medium- and high-heat conditions, the evaluation values demonstrated a steady decrease with increasing noise volume. Specifically, under low heat, the evaluation value improved by 0.12 at low volume, declined by 0.26 at medium volume, and showed no significant change at high volume. Under medium heat, the value decreased by 0.12 at low volume, by 0.08 at medium volume, and by 0.12 at high volume. High-heat conditions revealed an initial decrease of 0.40 at low volume, a slight decrease of 0.04 at medium volume, and a substantial decrease of 0.24 at high volume.
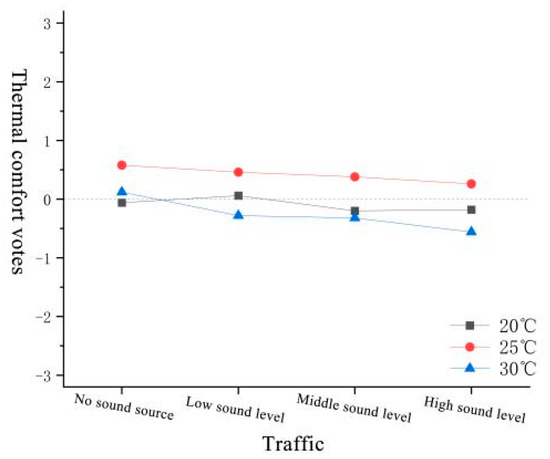
Figure 36.
Thermal comfort votes under the influence of traffic.
Figure 37 illustrates the nuanced influence of lawn mowing noise on thermal comfort across varying heat conditions. Under low heat, thermal comfort evaluation values initially increased with the introduction of lawn mowing noise at low volume and then decreased as the volume rose. Medium-heat conditions showed a steady decline in evaluation values. High-heat conditions exhibited a more complex pattern, with an initial decrease followed by an increase in evaluation values. Specifically, under low heat, the evaluation value improved by 0.10 at low volume, declined by 0.24 at medium volume, and reduced further by 0.36 at high volume. Under medium heat, the value decreased by 0.10 at low volume, by 0.16 at medium volume, and by 0.04 at high volume. High-heat conditions revealed an initial decrease of 0.22 at low volume, a significant decrease of 0.44 at medium volume, and a subsequent increase of 0.16 at high volume.
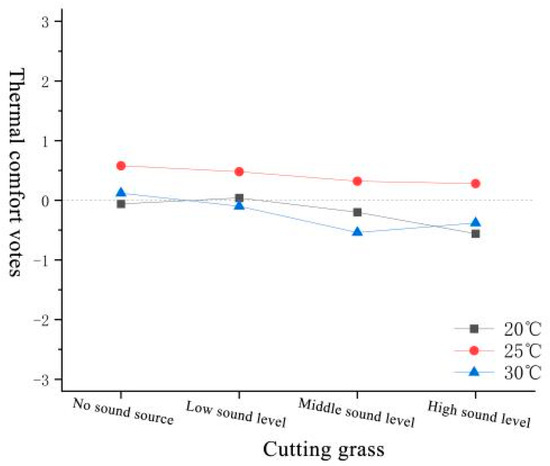
Figure 37.
Thermal comfort votes under the influence of cutting grass.
Analysis of Thermal Comfort under Thermal–Acoustic Interaction
The differences in thermal comfort due to sound were analyzed using a multi-factor analysis of variance, as shown in Table 18. It was found that both the type and volume of sound, as well as the temperature level, had a significant impact on thermal comfort (p = 0.000 < 0.01). There was an absence of a significant interaction between these factors (p > 0.05), indicating that the influence of sound on thermal comfort was not significant.
Table 18.
ANOVAs of thermal comfort.
3.3.3. Effect of Sound on Thermal Acceptance
Effect of Natural Sound on Thermal Acceptance
The study’s exploration of the impact of natural sounds, exemplified by birdcall, on thermal comfort is captured in Figure 38. Using the baseline of participants’ comfort in silence, the research observed how the introduction and escalation of birdcall volume affected heat perception across low-, medium-, and high-heat conditions. Under low heat, the perception of heat initially rose by 0.22 with low-volume birdcall but declined by 0.48 at medium volume and by 0.18 at high volume. Medium heat showed a consistent decrease in heat perception with birdcall, dropping by 0.14 at low volume, by 0.14 at medium volume, and by 0.20 at high volume. High heat conditions revealed an initial decrease in heat perception by 0.30 at low volume, a substantial decrease by 0.66 at medium volume, followed by a notable increase of 0.20 at high volume.
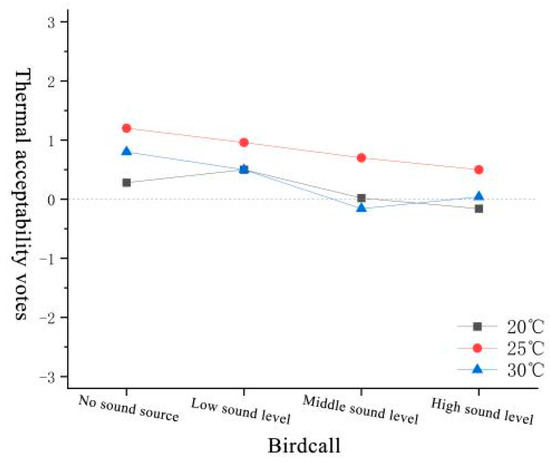
Figure 38.
Thermal acceptability votes under the influence of birdcall.
Figure 39 illustrates the dynamic impact of water flow sound on thermal comfort across different heat conditions. Under low heat, thermal comfort evaluation values exhibited an initial increase followed by a decrease as the volume of water flow sound rose. Medium heat was characterized by a gradual decline in evaluation values, while high heat showed an initial decrease followed by an increase. Specifically, under low heat, the evaluation value improved by 0.14 at low volume, declined by 0.24 at medium volume, and reduced further by 0.10 at high volume. Under medium heat, the value decreased by 0.12 at low volume, by 0.14 at medium volume, and by 0.12 at high volume. High-heat conditions revealed an initial decrease of 0.36 at low volume, a slight decrease of 0.14 at medium volume, and a subsequent increase of 0.20 at high volume.
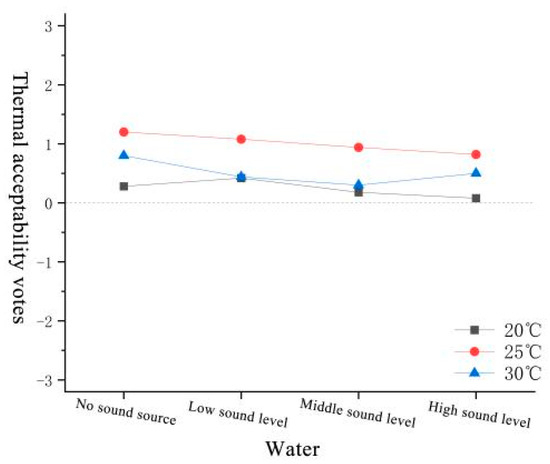
Figure 39.
Thermal acceptability votes under the influence of water.
Effect of Human-Made Sound on Thermal Acceptance
Figure 40 illustrates the impact of artificial sounds, specifically speech, on thermal acceptance. The study observed that as conversation was introduced and its volume increased, thermal acceptance followed an initial increase followed by a decrease at low temperatures, as well as a steady decline at medium and high temperatures. Specifically, at low temperatures, the evaluation of thermal acceptance improved by 0.28 at low volume but declined by 0.44 at medium volume and by 0.14 at high volume. At medium temperatures, the acceptance value decreased by 0.38 at low volume, by 0.20 at medium volume, and by 0.14 at high volume. High temperatures showed a substantial decrease in thermal acceptance, with a drop of 0.50 at low volume, a further decrease of 0.36 at medium volume, and an additional decrease of 0.20 at high volume.
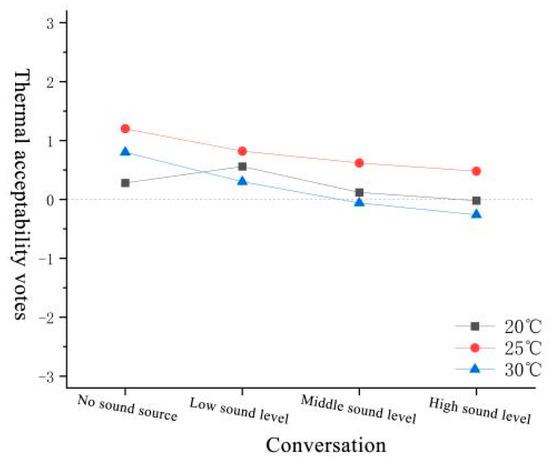
Figure 40.
Thermal acceptability votes under the influence of conversation.
Effect of Artificial Sound on Thermal Acceptance
Figure 41 in the study captures the nuanced influence of light music on thermal comfort across varying heat conditions. Under low and medium heat, thermal comfort evaluations followed an initial increase with the introduction of light music at low volume, followed by a decrease as the volume increased. High-heat conditions revealed a more intricate pattern, with an initial decrease, a subsequent increase at medium volume, and a final decrease at high volume. Specifically, under low heat, the evaluation rose by 0.50 at low volume, declined by 0.18 at medium volume, and further decreased by 0.32 at high volume. Under medium heat, the evaluation increased by 0.12 at low volume, decreased by 0.22 at medium volume, and decreased by 0.12 at high volume. High heat showed an initial decrease of 0.20 at low volume, a notable increase of 0.46 at medium volume, and a subsequent decrease of 0.40 at high volume.
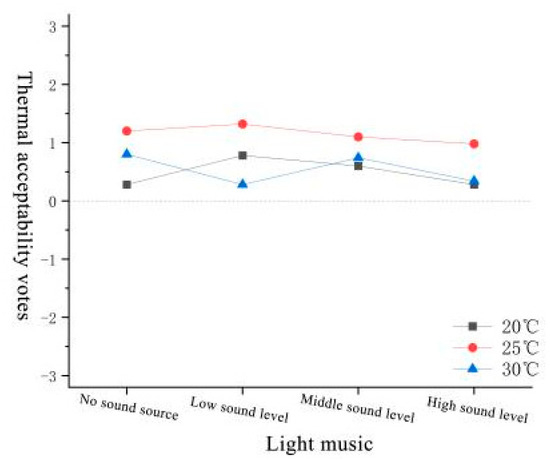
Figure 41.
Thermal acceptability votes under the influence of light music.
Figure 42 illustrates the varying influence of traffic noise on thermal comfort across different heat conditions. Under low-heat conditions, thermal comfort evaluation values initially increased with the introduction of low-volume traffic noise but decreased as the volume rose. Medium- to high-heat conditions displayed a steady decline in evaluation values with increasing noise volume. Specifically, under low heat, the evaluation value improved by 0.14 at low volume, declined by 0.30 at medium volume, and reduced further by 0.24 at high volume. Under medium heat, the value decreased by 0.44 at low volume, by 0.24 at medium volume, and by 0.16 at high volume. High heat conditions revealed an initial decrease of 0.72 at low volume, a slight decrease of 0.22 at medium volume, and a substantial decrease of 0.26 at high volume.
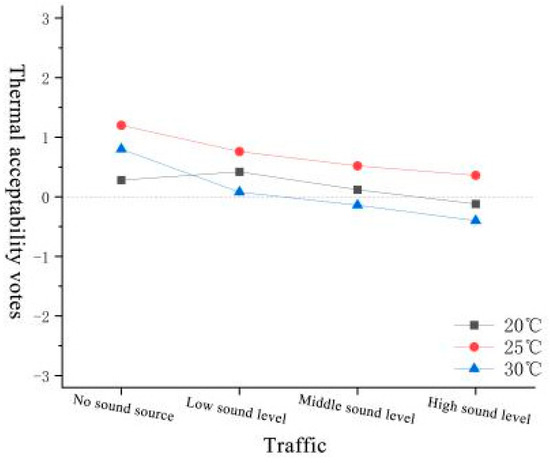
Figure 42.
Thermal acceptability votes under the influence of traffic.
Figure 43 illustrates the impact of lawn mowing noise on thermal acceptability across different heat conditions. The introduction of lawn mowing noise at low volume initially enhanced acceptability in low-heat conditions but led to a significant decrease as volume increased. Medium- and high-heat conditions demonstrated a steady decline in acceptability with increasing noise volume. Specifically, under low heat, the acceptability rating rose by 0.16 at low volume, decreased by 0.60 at medium volume, and decreased slightly by 0.18 at high volume. Under medium heat, the rating decreased by 0.62 at low volume, by 0.10 at medium volume, and by 0.04 at high volume. High-heat conditions showed a substantial decrease in acceptability, with a drop of 0.88 at low volume, a decrease of 0.30 at medium volume, and a slight decrease of 0.14 at high volume.
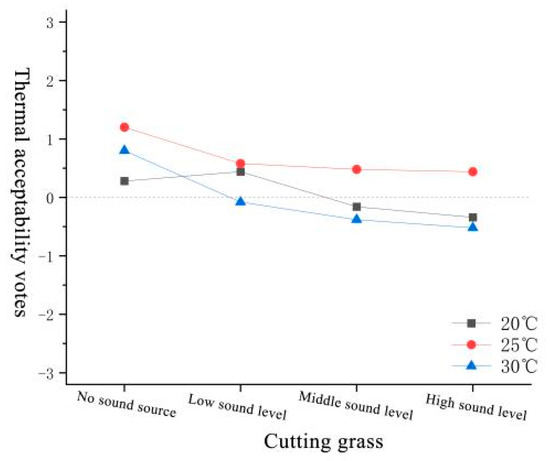
Figure 43.
Thermal acceptability votes under the influence of cutting grass.
Analysis of Thermal Acceptance under Thermal–Acoustic Interaction
A multifactorial analysis of variance was utilized to scrutinize the impact of sound on thermal comfort, with the results presented in Table 19. The study reveals that the main effects of sound type, volume, and temperature level all significantly affected thermal comfort, as denoted by the p-values of 0.000, which were less than the 0.01 threshold. Importantly, the lack of a significant interaction among the three factors suggests that their individual impacts on thermal comfort can be assessed separately, without the need to account for interdependencies.
Table 19.
ANOVAs of thermal acceptance.
3.3.4. Effect of Sound on Physiological Indicators
Analysis of HR Influence
Upon examining Table 20, it was determined that the highest average heart rate (HR) of 67.82 bpm was observed in the presence of bird chirping, with traffic noise at a slightly lower average of 67.72 bpm, and lawn mowing sounds ranking next in line. The HR values during conversation, water flow, and light music conditions were all deemed to be within the normal range. The heart rate variations were noted to be uniform across the six different auditory conditions. The one-way ANOVA results indicate no significant differences in heart rate variations among the sound types (p = 0.542), suggesting that the HR responses of individuals to a variety of sounds exhibited a comparable trend.
Table 20.
Mean and variability of HR under different sound types.
Table 21 presents data indicating that the maximum average heart rate (HR) of 68.01 bpm was observed at high volume levels. The average HR at medium volume was the next highest, with the lowest average occurring at low-volume levels. All recorded HR values were within a normal physiological range, showing a uniform response to varying sound volumes. The one-way ANOVA analysis confirms a significant difference in HR variation across the different volume levels (p = 0.012 < 0.05), which underscores the importance of volume on HR. The LSD post hoc test substantiates this, identifying a significant HR variation between low- and high-volume levels (p = 0.003 < 0.01). This emphasizes the impact of volume level on HR and the necessity of controlling sound volume to protect health.
Table 21.
Mean and variability of HR at different volumes.
- (1)
- No sound source
The average HR of the medium-heat situation was high heat and low heat, all within the normal HR range, as shown in Figure 44.
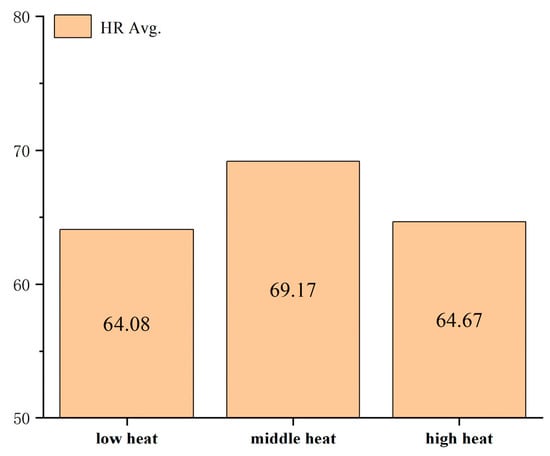
Figure 44.
Mean HR at different temperatures in the absence of sound.
- (2)
- Birdcall
The research results from Figure 45a show that under low-volume conditions, the HR values of the subjects increased with medium and high temperatures, and they decreased with low temperature. In Figure 45b, it can be observed that under medium-volume conditions, the HR values of the subjects increased with medium and high temperatures, and they remained unchanged with low temperature. Figure 45c shows that under high volume, the HR values of the subjects increased with low, medium, and high temperatures. This indicates that the influence of temperature on human physiological responses is significant when the sound type is birdcall, and that volume of the sound type is one of the biggest factors affecting human physiological responses.
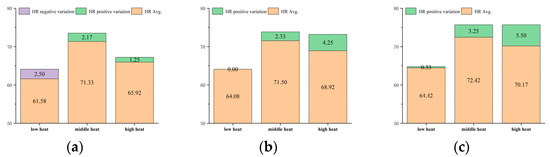
Figure 45.
Mean and variability of HR at different temperatures under birdcall. (a) Low volume. (b) Medium volume. (c) High volume.
- (3)
- Water
Figure 46a from the study indicates that at a low volume, subjects’ heart rates (HR) experienced a positive alteration with medium and high heat, but not with low heat. Figure 46b reveals that at a medium volume, HR values only increased under high heat, while they decreased under low and medium heat conditions. Figure 46c shows that at a high volume, HR values rose with medium and high heat, but fell with low heat.
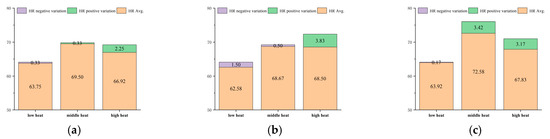
Figure 46.
Mean and variability of HR at different temperatures under water. (a) Low volume. (b) Medium volume. (c) High volume.
- (4)
- Conversation
The research results from Figure 47a indicate that at low volume, the HR values of the subjects increased in medium- and high-heat conditions, and they decreased in low-heat conditions. In Figure 47b, it can be seen that at medium volume, the HR values of the subjects increased in medium- and high-heat conditions, and they decreased in low-heat conditions. In Figure 47c, it can be seen that at high volume, the HR values of the subjects increased in low-, medium-, and high-heat conditions.
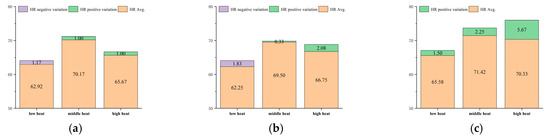
Figure 47.
Mean and variability of HR at different temperatures under conversation. (a) Low volume. (b) Medium volume. (c) High volume.
- (5)
- Light music
The research results from Figure 48a indicate that, under the low-volume condition, the HR values of the participants decreased in both the low- and high-heat conditions, while in Figure 48b, it can be seen that, in the medium-volume condition, the HR values of the participants increased in both the low- and high-heat conditions. In Figure 48c, it can be observed that, in the high-volume condition, the HR values of the participants increased in the high-heat condition, while they decreased in the low- and medium-heat conditions.
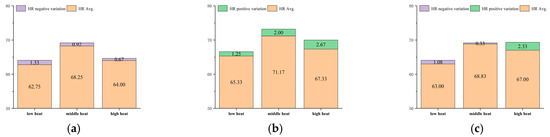
Figure 48.
Mean and variability of HR at different temperatures under light music. (a) Low volume. (b) Medium volume. (c) High volume.
- (6)
- Traffic
Figure 49a illustrates that at a low-volume setting, subjects’ HR positively changed with moderate and high heat, but negatively changed with low heat. Figure 49b shows that at a medium volume, HR values positively changed with low and high heat, but negatively changed with medium heat. Figure 49c indicates that at a high volume, HR values consistently increased, regardless of the heat condition—low, medium, or high.
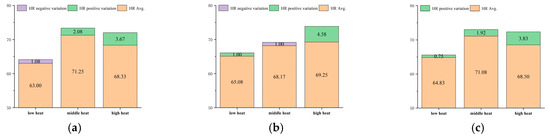
Figure 49.
Mean and variability of HR at different temperatures under traffic. (a) Low volume. (b) Medium volume. (c) High volume.
- (7)
- Cutting grass
The research results from Figure 50a indicate that, under low-volume conditions, the HR values of the subjects increased during high heat, and they decreased during low and medium heat. As shown in Figure 50b, under medium-volume conditions, the HR values of the subjects increased during low, medium, and high heat. Figure 50c illustrates that, under high-volume conditions, the HR values of the subjects increased during low, medium, and high heat.
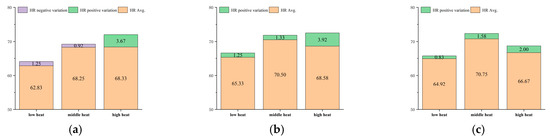
Figure 50.
Mean and variability of HR at different temperatures under cutting grass. (a) Low volume. (b) Medium volume. (c) High volume.
Analysis of EDA Influence
Table 22 presents the EDA change values for subjects exposed to various sound types, with the highest values associated with grass cutting sounds, followed by water flow, bird chirping, traffic, conversation, and light music in descending order. The one-way ANOVA revealed no significant differences in EDA changes across these sound types (p = 0.245 > 0.01), suggesting that emotional responses to the different auditory stimuli were comparable, with no discernible variation in the emotional shifts triggered by the distinct sound environments.
Table 22.
Mean and variability of EDA under different sound types.
Table 23 illustrates that the EDA change values of subjects decreased as the sound volume decreased, with high volume showing the greatest changes, followed by medium and low volumes. The one-way ANOVA confirms a significant difference in EDA change values across the different volume levels (p = 0.000 < 0.01). LSD post hoc tests highlight significant differences between the EDA change values at low versus medium volumes (p = 0.000 < 0.01) and low versus high volumes (p = 0.000 < 0.01). This implies that the intensity of sound stimuli, with its varying volumes, can have distinct impacts on human physiological reactions and emotional states, where louder volumes tend to have a more pronounced effect.
Table 23.
Mean and variability of EDA at different volumes.
- (1)
- No sound source
From Figure 51, it can be seen that the average EDA values were lower in the neutral- and high-warmth conditions. This is because under the neutral-warmth condition, the subjects were in a warm, relaxed, and pleasant state, which led to the activation of the autonomic nervous system and subsequently increased skin conductance.

Figure 51.
Mean EDA at different temperatures in the absence of sound.
- (2)
- Birdcall
The research results from Figure 52a indicate that under low-volume conditions, the subjects’ EDA values showed a positive correlation with increasing temperature, with the greatest change occurring at the medium temperature, followed by the low temperature, and lastly the high temperature. As shown in Figure 52b,c, under medium- and high-volume conditions, the EDA values of the subjects at all three temperature levels exhibited a positive correlation, with the greatest change occurring at the medium temperature, followed by the low temperature, and lastly the high temperature.
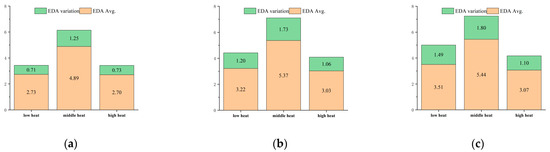
Figure 52.
Mean and variability of EDA at different temperatures under birdcall. (a) Low volume. (b) Medium volume. (c) High volume.
- (3)
- Water
According to Figure 53a, the observation results show that under low-volume conditions, the EDA values of the subjects exhibited a positive change under low heat, medium heat, and high heat, with the largest change occurring under medium heat, followed by high heat, and finally low heat. In Figure 53b,c, it can be observed that under medium- and high-volume conditions, the EDA values of the subjects at all three temperature levels exhibited a positive change, with the largest change occurring under medium heat, followed by low heat, and finally high heat.
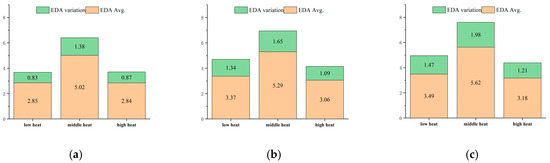
Figure 53.
Mean and variability of EDA at different temperatures under water. (a) Low volume. (b) Medium volume. (c) High volume.
- (4)
- Conversation
According to the research results shown in Figure 54a, it can be observed that under low-sound-volume conditions, the EDA values of the subjects showed a positive change for low, medium, and high temperatures, with the largest change occurring for medium temperatures, followed by high temperatures, and then low temperatures. Meanwhile, Figure 54b,c indicates that under medium- and high-sound-volume conditions, the EDA values of the subjects showed a positive change for all three temperature levels, with the largest change occurring for medium temperatures, followed by low temperatures, and then high temperatures.
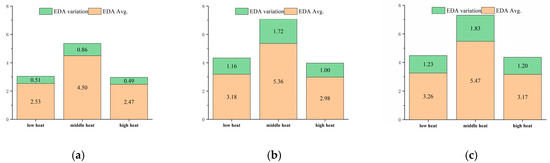
Figure 54.
Mean and variability of EDA at different temperatures under conversation. (a) Low volume. (b) Medium volume. (c) High volume.
- (5)
- Light music
The research results from Figure 55a show that in low-volume situations, the EDA values of the subjects increased positively under low-, medium-, and high-heat conditions, with the largest change occurring in the medium-heat condition, followed by high heat, and then low heat. In Figure 55b,c, it can be observed that under medium- and high-volume conditions, the EDA values of the subjects increased positively at all three temperature levels, with the largest change occurring in the medium-heat condition, followed by low heat, and then high heat.
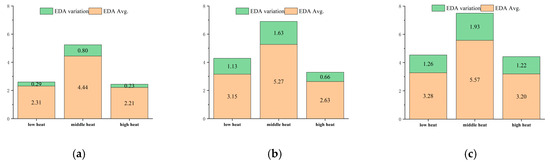
Figure 55.
Mean and variability of EDA at different temperatures under light music. (a) Low volume. (b) Medium volume. (c) High volume.
- (6)
- Traffic
The research results from Figure 56a indicate that under low-volume conditions, the EDA values of the subjects showed a positive change for low heat, medium heat, and high heat, with the largest change occurring for medium heat, followed by high heat, and the lowest for low heat. In Figure 56b,c, it can be seen that under medium- and high-volume conditions, the EDA values of the subjects showed a positive change for all three temperature levels, with the largest change occurring for medium heat, followed by low heat, and lastly high heat.
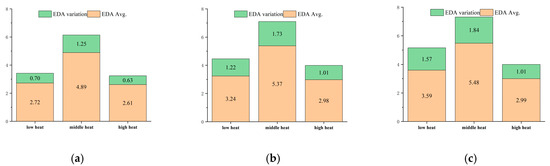
Figure 56.
Mean and variability of EDA at different temperatures under traffic. (a) Low volume. (b) Medium volume. (c) High volume.
- (7)
- Cutting grass
The results of the study in Figure 57a indicate that, under low volume, the EDA values of the participants showed a positive trend for low heat, medium heat, and high heat, with the largest change occurring at medium heat, followed by high heat, and lastly low heat. In Figure 57b,c, it can be observed that under medium and high volume, the EDA values of the participants showed a positive trend for all three temperature levels, with the largest change occurring at medium heat, followed by low heat, and lastly high heat.
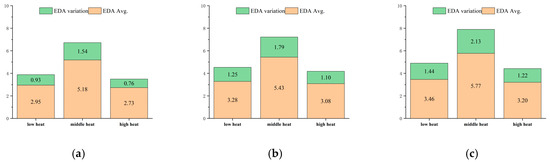
Figure 57.
Mean and variability of EDA at different temperatures under cutting grass. (a) Low volume. (b) Medium volume. (c) High volume.
3.4. Effect of Thermal–Acoustic Interaction on Overall Perception
This section of the research investigates the synergistic effects of sound and temperature on two key dimensions of human experience: overall comfort and annoyance. The study used precise temperature stimuli at 20 °C, 25 °C, and 30 °C to simulate varying thermal environments. The auditory stimuli encompassed a broad spectrum, from the natural ambiance of birdcalls and flowing water to the human element of conversational sounds, as well as the artificial backdrop of soft music, the din of traffic, and the mechanical sounds of lawn mowing. The objective was to assess the composite impact of these auditory and thermal factors on the comfort and annoyance levels perceived by participants.
3.4.1. Effect of Thermal–Acoustic Interaction on Overall Comfort
Overall Comfort under Thermal–Acoustic Interaction
The research explored the impact of temperature and sound on overall comfort, using a silent environment as the baseline for subjects. Regardless of temperature, subjective loudness values were found to be positively inclined and closely matched. In the presence of birdcall sounds, as shown in Figure 58, the overall comfort for low-volume sound increased incrementally with rising temperature. Medium-volume sound’s comfort peaked and then declined, while high-volume sound comfort exhibited a nadir followed by a peak as temperature increased. The overall comfort for low-volume sound rose by 0.40 at 25 °C over 20 °C and minimally by 0.04 at 30 °C over 25 °C. Medium-volume sound comfort improved by 0.24 at 25 °C over 20 °C but dropped by 0.40 at 30 °C over 25 °C. High-volume sound initially dipped by 0.06 in comfort at 25 °C compared to 20 °C, then rebounded by 0.14 at 30 °C compared to 25 °C.
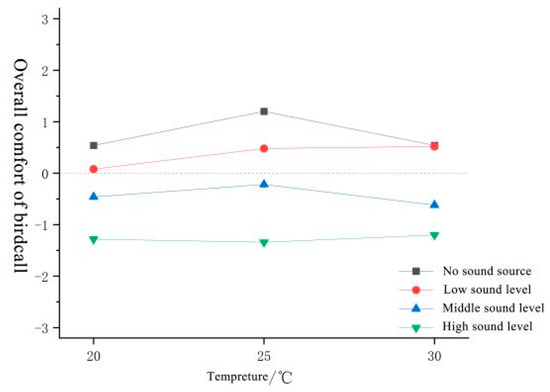
Figure 58.
Overall comfort under the interaction of temperature and birdcall.
When given a water flow sound as shown in Figure 59, an increase in temperature caused the overall comfort value of low- to medium-volume sound to first increase and then decrease, while the overall comfort value of high-volume sound showed a decreasing trend. The comfort value of low-volume sound increased by 0.06 from 20 °C to 25 °C, and by 0.34 from 25 °C to 30 °C. The comfort value of medium-volume sound increased by 0.08 from 20 °C to 25 °C, and decreased by 0.54 from 25 °C to 30 °C. The comfort value of high-volume sound showed no significant change from 20 °C to 25 °C, and decreased by 0.20 from 25 °C to 30 °C.
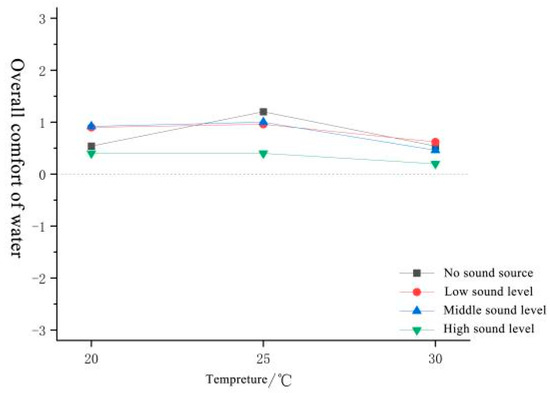
Figure 59.
Overall comfort under the interaction of temperature and water.
When the given conversation sound was as shown in Figure 60, as the temperature increased, the overall comfort value of low- and medium-volume sound showed a gradually decreasing trend, while the overall comfort of high-volume sound showed a gradually increasing trend. The comfort value of low-volume sound decreased by 0.12 at 25 °C compared to 20 °C, and by 0.10 at 30 °C compared to 25 °C. The comfort value of medium-volume sound decreased by 0.04 at 25 °C compared to 20 °C, and by 0.24 at 30 °C compared to 25 °C. The comfort value of high-volume sound increased by 0.26 at 25 °C compared to 20 °C, and by 0.36 at 30 °C compared to 25 °C.

Figure 60.
Overall comfort under the interaction of temperature and conversation.
Figure 61 illustrates the impact of temperature on overall comfort when subjects were exposed to light music. The overall comfort value for low- to medium-volume sound increased initially with rising temperature and then decreased, while the high-volume sound showed a contrasting trend of initial decrease followed by an increase. Specifically, the comfort value for low-volume sound rose by 0.34 at 25 °C over 20 °C and fell by 0.66 at 30 °C over 25 °C. For medium-volume sound, there was an increase of 0.22 at 25 °C over 20 °C, and a decrease of 0.16 at 30 °C over 25 °C. High-volume sound initially decreased by 0.18 at 25 °C compared to 20 °C, then increased by 0.26 at 30 °C compared to 25 °C.
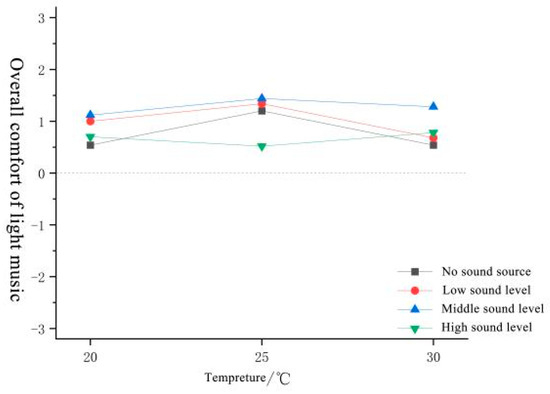
Figure 61.
Overall comfort under the interaction of temperature and light music.
Figure 62 illustrates the effects of temperature on overall comfort when subjects were exposed to traffic sounds. As temperature increased, the comfort value for low- and medium-volume sounds showed a steady decline, while the comfort value for high-volume sound followed an inverse U-shaped trend, starting with a decrease and ending with an increase. Specifically, the comfort value for low-volume sound decreased by 0.08 at 25 °C over 20 °C and by 0.14 at 30 °C over 25 °C. For medium-volume sound, there was a decrease of 0.18 at 25 °C over 20 °C, with a minimal further decrease of 0.02 at 30 °C over 25 °C. High-volume sound initially decreased by 0.22 at 25 °C compared to 20 °C, then increased substantially by 0.40 at 30 °C compared to 25 °C.
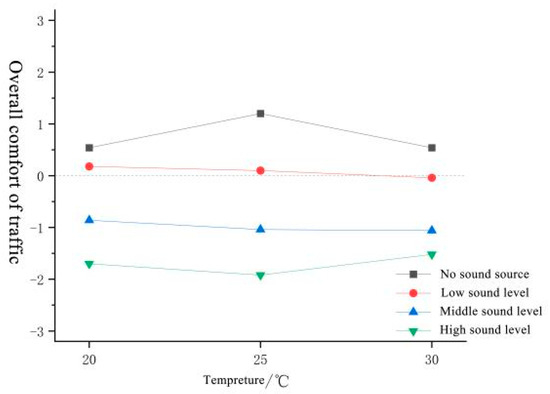
Figure 62.
Overall comfort under the interaction of temperature and traffic.
Figure 63 illustrates the influence of temperature on overall comfort when subjects were exposed to lawn mowing sounds. As temperature increased, low-volume sound followed a trend of initial decrease and subsequent increase in comfort value, medium-volume sound showed a gradual decrease, and high-volume sound exhibited an initial increase followed by a decrease. Specifically, the comfort value for low-volume sound decreased by 0.06 at 25 °C over 20 °C and increased by 0.04 at 30 °C over 25 °C, reflecting an overall minor fluctuation. Medium-volume sound did not show a significant change at 25 °C over 20 °C, but decreased by 0.12 at 30 °C over 25 °C. High-volume sound increased by 0.18 at 25 °C compared to 20 °C, then decreased by 0.12 at 30 °C compared to 25 °C.
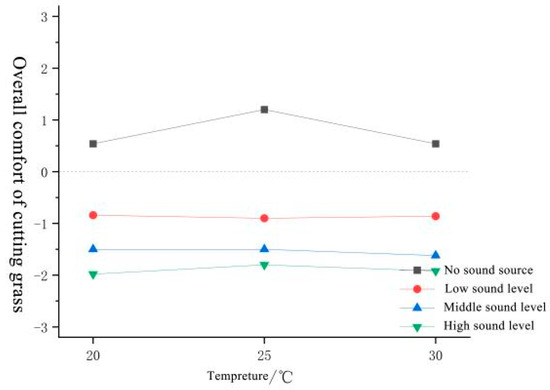
Figure 63.
Overall comfort under the interaction of temperature and cutting grass.
Analysis of Overall Comfort under Thermal–Acoustic Interaction
The multifactor analysis of variance, as detailed in Table 24, confirms that the type of sound (p = 0.000), the volume of the sound (p = 0.000), and the level of temperature (p = 0.002) all exerted a significant influence on the overall comfort level, with p-values well below the 0.05 significance threshold. This underscores the importance of auditory and thermal factors in shaping comfort perceptions.
Table 24.
ANOVAs of overall comfort.
In addition to the main effects, the analysis also uncovered significant interaction effects. The interplay between sound type and temperature level (p = 0.000 < 0.01), as well as between volume and temperature level (p = 0.019 < 0.05), both contributed significantly to the overall comfort level. These interactions indicated that the comfort impact of sound characteristics is not solely direct but is also contingent upon the thermal conditions, revealing a nuanced relationship between auditory stimuli and thermal perception.
There was no interaction between the types of sounds and other factors. According to the multiple comparison results in Table 25, there was no significant difference in overall comfort between conversations and birdcall, water flow and no sound source, and no sound source and light music. The comfort level was increased more by light music and no sound source compared to birdcall, conversations, traffic sounds, and lawn mowing sounds.
Table 25.
Multiple comparisons of overall comfort under the influence of sound type.
Table 26 presents the results of multiple comparisons of the interaction between volume and temperature on the overall comfort mean. For the no-sound condition, temperature was divided into two homogeneous subsets, high heat and low heat, which were significantly different from the medium-heat condition, with the highest overall comfort at medium heat. For low, medium, and high volume, different temperature levels showed no significant differences, and medium heat significantly increased the overall comfort.
Table 26.
Multiple comparisons of overall comfort under the influence of volume and thermal conditions.
Table 27 presents a multiple comparison of temperature and volume. For low-heat conditions, the four volumes were divided into three homogenous subsets, with no significant difference between low volume and no sound source. There was a trend of increasing overall comfort as the volume decreased, with the highest overall comfort when there was no sound source. For medium-heat conditions, the four volumes were divided into four homogenous subsets, with significant differences between high, medium, low, and no volume (p = 0.000 < 0.01). Overall comfort gradually increased as the volume decreased. For high-heat conditions, the four volumes were divided into two homogenous subsets, with no significant difference in the impact of high- and medium-volume on overall comfort, and the impact of medium and high volume on overall comfort was less than that of low volume and no sound source.
Table 27.
Multiple comparisons of overall comfort under the influence of thermal and volume.
3.4.2. Effect of Thermal–Acoustic Interaction on Overall Irritability
Overall Irritability in the Thermal–Acoustic Interaction
Figure 64 from the study illustrates the impact of temperature on overall irritability when subjects were exposed to birdcall sounds. The overall irritability values for low- to medium-volume sounds initially increased with temperature and then decreased, while high-volume sound irritability showed a steady increase. Specifically, the overall irritability for low-volume sound increased by 0.26 at 25 °C over 20 °C and slightly decreased by 0.02 at 30 °C over 25 °C. Medium-volume sound irritability increased by 0.22 at 25 °C over 20 °C and decreased by 0.24 at 30 °C over 25 °C. High-volume sound irritability, on the other hand, showed a minimal increase of 0.02 at 25 °C compared to 20 °C, with a more significant increase of 0.24 at 30 °C compared to 25 °C.
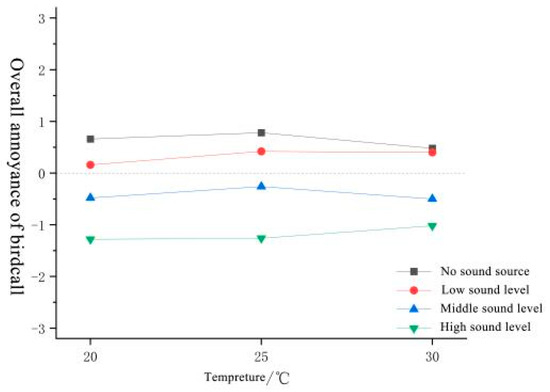
Figure 64.
Overall annoyance votes under the interaction of temperature and birdcall.
As shown in Figure 65, water flow variations induced gradual attenuation in low-frequency sound annoyance, followed by an initial increase and subsequent decrease in annoyance of mid-frequency sounds. Low-frequency sound annoyance decreased by 0.02 at 25 °C and 0.48 at 30 °C compared to 20 °C. Medium-frequency sound annoyance increased by 0.14 at 25 °C and decreased by 0.44 at 30 °C compared to 25 °C. High-frequency sound annoyance remained stable at 25 °C and decreased by 0.14 at 30 °C compared to 25 °C.
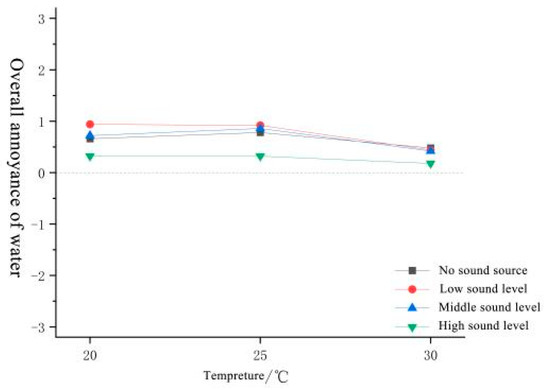
Figure 65.
Overall annoyance votes under the interaction of temperature and water.
As shown in Figure 66, conversation-induced sound annoyance exhibited a gradual decrease for low- to medium-frequency sounds and a gradual increase for high-frequency sounds. Low-frequency sound annoyance decreased by 0.14 at 25 °C and 0.06 at 30 °C compared to 20 °C. Medium-frequency sound annoyance decreased by 0.20 at 25 °C, with no significant change at 30 °C compared to 25 °C. High-frequency sound annoyance increased by 0.18 at 25 °C and 0.34 at 30 °C compared to 25 °C.

Figure 66.
Overall annoyance votes under the interaction of temperature and conversation.
Figure 67 illustrates the influence of temperature on overall annoyance when subjects were exposed to light music. As temperature increased, the annoyance value for low- and medium-volume sounds exhibited an initial increase followed by a decrease, while high-volume sound showed an inverse trend of initial decrease and subsequent increase. Specifically, the annoyance value for low-volume sound rose by 0.30 at 25 °C over 20 °C and fell by 0.60 at 30 °C over 25 °C. Medium-volume sound increased by 0.24 at 25 °C over 20 °C and decreased by 0.18 at 30 °C over 25 °C. High-volume sound decreased by 0.18 at 25 °C compared to 20 °C, then increased by 0.28 at 30 °C compared to 25 °C.
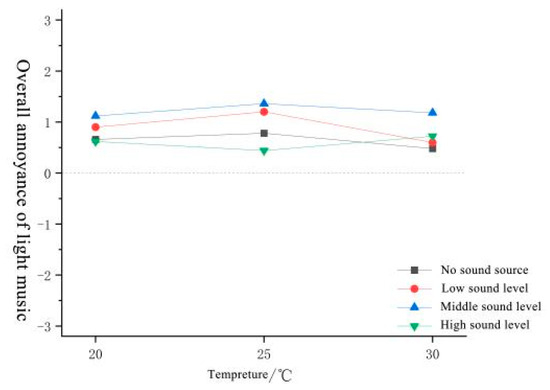
Figure 67.
Overall annoyance votes under the interaction of temperature and light music.
Figure 68 illustrates the influence of traffic noise on overall annoyance at varying temperature levels. Low-to-medium-volume sound annoyance values showed a trend of initial decrease followed by a non-significant increase as temperature rose. High-volume sound annoyance values, however, indicated a steady decline. Specifically, the annoyance value for low-volume sound decreased by 0.34 at 25 °C over 20 °C and minimally increased by 0.02 at 30 °C over 25 °C. Medium-volume sound decreased by 0.10 at 25 °C over 20 °C and increased by 0.08 at 30 °C over 25 °C. High-volume sound showed no significant change at 25 °C compared to 20 °C but then increased significantly by 0.30 at 30 °C compared to 25 °C.
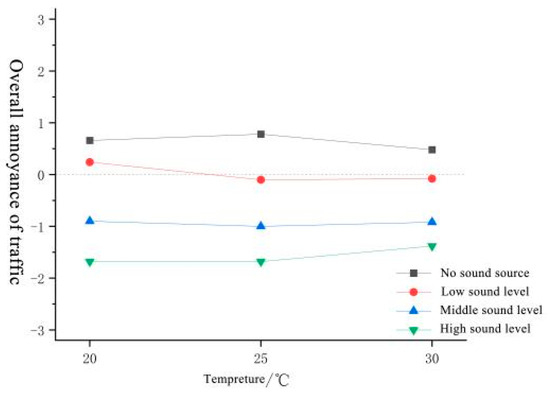
Figure 68.
Overall annoyance votes under the interaction of temperature and traffic.
In Figure 69, grass cutting noise exposure resulted in varying annoyance responses across sound levels and temperatures. Low-frequency sound annoyance decreased at 25 °C and then increased at 30 °C compared to 20 °C. Medium- and high-frequency sound annoyance gradually decreased with increasing temperature. Specifically, low-frequency sound annoyance decreased by 0.10 at 25 °C and increased by 0.18 at 30 °C compared to 20 °C. Medium-frequency sound annoyance decreased by 0.02 at 25 °C and further decreased by 0.06 at 30 °C compared to 20 °C. High-frequency sound annoyance increased by 0.18 at 25 °C and slightly increased by 0.02 at 30 °C compared to 20 °C.
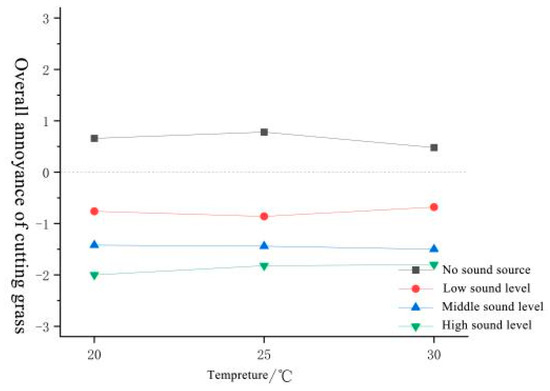
Figure 69.
Overall annoyance votes under the interaction of temperature and cutting grass.
Analysis of Global Irritability under Thermal–Acoustic Interaction
The multivariate analysis of variance conducted to evaluate overall irritability, as presented in Table 28, demonstrates that sound type and volume were significant predictors of irritability, with p-values significantly below the 0.01 threshold. The interactions between these auditory factors and temperature level also reached statistical significance, with the interaction between sound type and temperature level being moderate (p = 0.100) and the interaction between volume and temperature level being more robust (p = 0.011).
Table 28.
ANOVAs of overall annoying.
This indicates that the perception of overall irritability was not solely determined by the type and volume of sound but was also significantly influenced by the ambient temperature, pointing to a complex interplay between environmental and auditory factors in the assessment of irritability.
Table 29 presents a multiple comparison of sound types with temperature. For water flow sound, three temperature levels were divided into two homogeneous subsets, with low and medium temperatures forming one group and showing significant differences compared to the high-temperature condition. The high-temperature condition also exhibited more annoyance compared to the low and medium temperatures. For sound types such as birdcall, conversations, light music, traffic noise, and lawnmower sound, there were no significant differences across different temperature levels. However, light music at medium temperature significantly optimized overall annoyance.
Table 29.
Multiple comparisons of overall annoyance under the influence of sound type and thermal conditions.
Table 30 shows the multiple comparisons of temperature and sound types. For low-arousal conditions, the seven sound sources were grouped into three homogeneous subsets, with the sound of no source and light music in one group; traffic noise, birdcall, and conversation in another group; and significant differences between the sound of mowing the grass. The positive impact of light music on overall irritability was the strongest, while mowing the grass had the opposite effect. For medium- to high-arousal conditions, the seven sound sources were grouped into four homogeneous subsets, with the positive impact of light music, no source, and the sound of flowing water on overall irritability being stronger than that of mowing the grass, traffic noise, conversation, and birdcall.
Table 30.
Multiple comparisons of overall annoying under the influence of thermal and sound type.
Table 31 shows the multiple comparisons of volume and temperature. For the four different volume conditions, there were no significant differences across different temperature levels. However, in the absence of sound, the medium temperature level significantly improved overall irritability.
Table 31.
Multiple comparisons of overall annoying under the influence of volume and thermal conditions.
Table 32 shows the multiple comparisons of temperature and volume. For low levels of arousal, the four volume levels were divided into three homogeneous subsets. There was no significant difference between low volume and no sound, but as the volume increased, the participants became increasingly irritable. For medium levels of arousal, the four volume levels were divided into four homogeneous subsets, and there was a significant difference in their overall irritability. As the volume increased, the participants felt increasingly irritable. For high levels of arousal, the four volume levels were divided into two homogeneous subsets: high and medium volume were grouped together, while low volume and no sound were grouped together. There was a significant difference in overall irritability between the two groups, and as the volume increased, the participants felt increasingly irritable.
Table 32.
Multiple comparisons of overall annoying under the influence of thermal and volume.
4. Discussion
4.1. Differences and Similarities in the Evaluation of Sound and Thermal Perception under the Thermal–Acoustic Interaction
In different thermal–acoustic environments, there are differences in the perception and evaluation of sound and thermal comfort. Studies have shown that within the suitable temperature range, the evaluation of sound comfort and sound preference generally increases. At the same time, in most cases, the introduction of sound can also enhance the evaluation of thermal comfort and thermal acceptance. The possible reason is that the selected sounds, including birdcall, water flow, light music, and conversation, are mostly positively evaluated by people, and the thermal environment is considered neutral or positive. This explains that positive stimuli in multi-sensory stimulation usually improve the evaluation of another sensory, and vice versa reduces it [38].
Recent scholarly investigations have unveiled the intriguing phenomenon of masking effects within the realm of thermal–acoustic interactions [39,40,41]. This occurrence can be ascribed to the heightened susceptibility to distraction under the influence of multisensory stimuli. It has been observed that the more pronounced the intensity of one sensory stimulus, the more diminished becomes the receptivity to information from another sensory modality [42,43]. Consequently, this leads to the emergence of masking effects amidst the constraints of limited information processing. Further research is warranted to delve into the neurophysiological underpinnings [44] and cognitive elements that contribute to the manifestation of masking effects within the sphere of thermal–acoustic perceptual interactions. This exploration will undoubtedly enrich our understanding of sensory integration and its complexities, thereby enhancing the tapestry of knowledge in this multidisciplinary field.
4.2. Relationship between Single Sensory Evaluation and Overall Evaluation under the Thermal–Acoustic Interaction
The Spearman correlation analysis revealed significant associations between overall comfort and its auditory and thermal components. The correlation coefficient between global comfort and auditory comfort stood at 0.8618 (p < 0.01), indicating a strong and positive relationship, while the coefficient between global comfort and thermal comfort was 0.3551 (p < 0.01), suggesting a moderate correlation. This underscores the more pronounced impact of auditory comfort on the overall comfort experience.
Conversely, the correlation coefficient between global irritability and auditory comfort was 0.8404 (p < 0.01), and between global irritability and thermal comfort was 0.3205 (p < 0.01), confirming the more salient influence of acoustics on overall irritability. These findings echo the results of prior research [45].
These insights further our comprehension of the dominant roles that different senses play in multisensory integration and amplify the significance of auditory perception in thermal–acoustic interactions. Additionally, the Spearman correlation coefficient between auditory comfort and thermal comfort was 0.2644 (p < 0.0.01), indicating that an enhancement in thermal comfort is accompanied by an increase in auditory comfort, and vice versa. This finding aligns with the outcomes obtained in previous studies [46] and further substantiates the interrelation among sensory perceptions, particularly the synergistic effect between thermesthesia and audition.
In terms of overall sensory evaluation, the correlation coefficient between global comfort and irritability was 0.8970 (p < 0.01), implying that reducing irritability can elevate comfort levels. Therefore, when aiming to enhance comfort, it is imperative to focus more intently on how to mitigate irritability, as a pleasant temperature or sound alone does not guarantee a comfortable experience. Only by effectively reducing irritability can the overall sense of comfort truly be augmented.
It must be in harmony with the surrounding environment in order to comprehensively enhance the experience. The researchers found that even if the temperature and sound are pleasant, if they are not in harmony with the surrounding environment, it can still cause discomfort [47].
4.3. The Relationship between Physiological Indicators in the Thermal–Acoustic Interaction
The study of the thermal–acoustic interaction is not limited to subjective single sensory evaluation and overall evaluation, and physiological indicators are also very important. Research has shown that in the category of environmental effects on perception, changes in HR and skin conductance are the most common physiological indicators [48]. HR can reflect the response of the autonomic nervous system to sensory stimulation, so in experiments, the HR will change accordingly when the subjects receive certain stimuli [49]. In experiments involving thermal–acoustic interaction, changes in HR are closely related to ratings of comfort and irritation. In addition, skin conductance is also a physiological indicator that reflects the activity of the autonomic nervous system [50]. In experiments involving thermal–acoustic interaction, changes in skin conductance are also related to the subjects’ ratings of comfort and irritation.
Research has found that the impact of sound and temperature on physiological indicators is not simply an additive relationship. In some cases, the two can counteract each other, meaning that the effects of sound stimuli on physiological indicators such as HR are weakened or suppressed by the effects of temperature stimuli. This suggests that the impact of sound and temperature on bodily reactions is complex and interactive. This property is consistent with previous studies [51].
Overall, the physiological indicators of sound–temperature interaction vary widely, influenced by factors such as individual differences, experimental design, and the type and intensity of stimuli. In the future, it is necessary to further explore the mechanisms and laws behind these changes, as well as to integrate knowledge from psychology and neuroscience to provide a deeper understanding and support for the application of sound–temperature interaction.
4.4. Shortcomings and Prospects
The current research mainly focuses on exploring the perceptual responses elicited by combinations of sensory stimuli, aiming to provide extensive guidance for the design of sensory environments and to clarify the direction for future research. The research has several scalable directions:
- (1)
- Even though simulated variables can be precisely controlled in the laboratory, they cannot replace real-time sensory experiences in actual environments.
- (2)
- Therefore, the conclusions drawn from laboratory research need to be validated in practical applications. At the same time, the impact of user characteristics on the perception of auditory–olfactory simulation needs to be considered, such as gender, age, cultural differences, and professional backgrounds.
- (3)
- Given the dominant position of vision among the five senses, its influence cannot be ignored. Future experiments can incorporate visual factors as variables to further investigate the interactions between visual, auditory, and olfactory stimuli.
5. Conclusions
This study delves into the influence of thermal–acoustic interactions on human perception in urban forests, particularly in the subtropical urban forest environment of Xihu Park, Fuzhou. Through laboratory simulation experiments, we systematically assessed the effects of sound, temperature, and their interactions on participants’ acoustic perception, thermal sensation, and overall perception, while monitoring objective physiological indicators. The results revealed how elevated temperature enhances perceived loudness, especially in quiet environments, as well as the significant impact of sound type and loudness on thermal sensation. Moreover, we found that certain soundscapes can significantly enhance overall comfort at moderate loudness levels, while temperature exerts substantial influence on both comfort and annoyance.
The study underscores the importance of considering the interplay between sound and thermal comfort when designing more human-centric environments. Our findings provide scientific guidance for sensory design in urban forest environments, especially considering how sound and temperature together affect psychological and emotional states. By optimizing these environmental factors, urban forests can offer more comfortable and restorative green spaces for city dwellers.
The study’s conclusions have practical implications for urban forest planning and management, especially given the increasing environmental challenges in urbanizing regions. We suggest that future urban forest designs holistically consider thermal–acoustic environmental factors to create more harmonious and salubrious natural environments. Furthermore, the study’s methodology and findings offer a reference for future research in diverse environmental and cultural contexts.
Author Contributions
Conceptualization, Y.C. and Y.L.; methodology, Y.C., Y.L. and T.L.; software, Y.C., T.L. and S.C.; validation, Y.C., T.L., S.C. and H.C.; formal analysis, Y.C., T.L., H.C. and S.C.; investigation, Y.C., T.L., H.C. and S.C.; resources, Y.C., S.C. and T.L.; data curation, Y.C.; writing—original draft preparation, Y.C., T.L., H.C. and S.C.; writing—review and editing, Y.C., T.L., H.C. and S.C. All authors have read and agreed to the published version of the manuscript.
Funding
This research was funded by (1) Special Project of Wuyishan National Park Research Institute, grant number KJG20009A; (2) Forest Park Engineering Technology Research Center of State Forestry Administration, grant number PTJH15002; (3) Green Urbanization across China and Europe: Collaborative Research on Key technological Advances in Urban Forests, grant number 2021YFE0193200; (4) Horizon 2020 strategic plan: CLEARING HOUSE-Collaborative Learning in Research, Information Sharing, and Governance on How Urban Tree-Based Solutions Support Sino-European Urban Futures, grant number 821242; (4) Education Department of Fujian Province, grant number JAT220221; (5) Fujian University of Technology, grant number GY-Z220213; (6) The 2 Batch of 2022 MOE of PRC Industry-University Collaborative Education Program: Kingfar- CES ”Human Factors and Ergonomics”, grant number 220705329010520.
Data Availability Statement
The data used to support the findings of this study are available from the corresponding author upon request.
Conflicts of Interest
Author Taoyu Li is employed by the company Xiamen Tobacco Industry Co., Ltd., and author Hangqing Chen is employed by the company Fujian Expressway Maintenance Engineering Co., Ltd. The remaining authors declare that the research was conducted in the absence of any commercial or financial relationships that could be construed as a potential conflict of interest.
References
- Ma, T.; Sun, S.; Fu, G.; Hall, J.W.; Ni, Y.; He, L.; Yi, J.; Zhao, N.; Du, Y.; Pei, T. Pollution exacerbates China’s water scarcity and its regional inequality. Nat. Commun. 2020, 1, 650. [Google Scholar] [CrossRef] [PubMed]
- Sun, S.; Zheng, X.; Liu, X.; Wang, Z.; Liang, L. Global pattern and drivers of water scarcity research: A combined bibliometric and geographic detector study. Environ. Monit. Assess. 2022, 194, 523. [Google Scholar] [CrossRef] [PubMed]
- Awasthi, A.K.; Li, J.; Koh, L.; Ogunseitan, O.A. Circular economy and electronic waste. Nat. Electron. 2019, 2, 86–89. [Google Scholar] [CrossRef]
- Fucheng, Y.; Jichang, Y.; Yuehong, W.; Dawei, C. Site environmental assessment to an old paint factory in China. Environ. Monit. Assess. 2008, 139, 93–106. [Google Scholar]
- Kastner, J. The new baby boom. Soap Perfum. Cosmet. 2016, 89, 19. [Google Scholar]
- Huang, Y.; Griffin, M.J. The discomfort produced by noise and whole-body vertical vibration presented separately and in combination. Ergonomics 2014, 57, 1724–1738. [Google Scholar] [CrossRef]
- Guo, L.; Cheng, S.; Liu, J.; Wang, Y.; Cai, Y.; Hong, X. Does social perception data express the spatio-temporal pattern of perceived urban noise? A case study based on 3,137 noise complaints in Fuzhou, China. Appl. Acoust. 2022, 109129. [Google Scholar] [CrossRef]
- Wang, C.; Geng, L.; Rodríguez-Casallas, J.D. How and when higher climate change risk perception promotes less climate change inaction. J. Clean. Prod. 2021, 321, 128952. [Google Scholar] [CrossRef]
- Karimi, A.; Mohammad, P.; García-Martínez, A.; Moreno-Rangel, D.; Gachkar, D.G.S. New developments and future challenges in reducing and controlling heat island effect in urban areas. Environ. Dev. Sustain. 2023, 25, 10485–10531. [Google Scholar] [CrossRef]
- Giannaros, T.M.; Melas, D. Study of the urban heat island in a coastal Mediterranean City: The case study of Thessaloniki, Greece. Atmos. Res. 2012, 118, 103–120. [Google Scholar] [CrossRef]
- Yang, B.; Yang, X.; Leung, L.R.; Zhong, S.; Qian, Y.; Zhao, C.; Chen, F.; Zhang, Y.; Qi, J. Modeling the impacts of urbanization on summer thermal comfort: The role of urban land use and anthropogenic heat. J. Geophys. Res. D Atmos. JGR 2019, 124, 6681–6697. [Google Scholar] [CrossRef]
- Silva, R.D.S.E.; Da Silva, R.M.; De Freitas, A.F.; Dos Santos, J.S.; Guimaraes Santos, C.A.; Rodrigues, V.D.L.E. Thermal comfort conditions at microclimate scale and surface urban heat island in a tropical city: A study on Joao Pessoa city, Brazil. Int. J. Biometeorol. J. Int. Soc. Biometeorol. 2022, 66, 1079–1093. [Google Scholar] [CrossRef]
- Loures, L.; Santos, R.; Panagopoulos, T. Urban parks and sustainable city Planning-The case of portimão, portugal. WSEAS Trans. Environ. Dev. 2007, 3, 171–180. [Google Scholar]
- Di, L.; Yan, S.; Yue, Y.; Yi, H.; Chengyang, X. Urban park use and self-reported physical, mental, and social health during the COVID-19 pandemic: An on-site survey in Beijing, China. Urban For. Urban Gree. 2023, 79, 127804. [Google Scholar]
- Hong, X.; Cheng, S.; Liu, J.; Dang, E.; Wang, J.; Cheng, Y. The physiological restorative role of soundscape in different forest structures. Forests 2022, 13, 1920. [Google Scholar] [CrossRef]
- Rigolon, A.; Browning, M.; Jennings, V. Inequities in the quality of urban park systems: An environmental justice investigation of cities in the United States. Landsc. Urban Plan. 2018, 178, 156–169. [Google Scholar] [CrossRef]
- Jin, Y.; Jin, H.; Kang, J. Combined effects of the thermal-acoustic environment on subjective evaluations in urban squares. Build. Environ. 2020, 168, 106517. [Google Scholar] [CrossRef]
- Menatti, L.; Heft, H. Editorial: Changing perspectives on landscape perception: Seeking common ground between the psychological sciences and the humanities. Front. Psychol. 2020, 11, 159. [Google Scholar] [CrossRef] [PubMed]
- Meng, Q.M.Q.; Kang, J.K.J. The influence of crowd density on the sound environment of commercial pedestrian streets. Sci. Total Environ. 2015, 511, 249–258. [Google Scholar] [CrossRef]
- Mohammadzadeh, N.; Mohammadzadeh, R. The assessment of soundscape quality in historic urban parks: A case study of El-Goli Park of Tabriz, Iran. Noise Vib. Worldw. 2023, 54, 248–260. [Google Scholar] [CrossRef]
- Amsellem, S.; Hochenberger, R.; Ohla, K. Visual-Olfactory Interactions: Bimodal Facilitation and Impact on the Subjective Experience. Chem. Senses 2018, 43, 329–339. [Google Scholar] [CrossRef]
- Pellerin, N.; Candas, V. Combined effects of temperature and noise on human discomfort. Physiol. Behav. 2003, 78, 99–106. [Google Scholar] [CrossRef] [PubMed]
- Zadeh, N.M.; Karimi, A.; Brown, R.D. The influence of outdoor thermal comfort on acoustic comfort of urban parks based on plant communities. Build. Environ. 2022, 228, 109884. [Google Scholar]
- Pellerin, N.; Candas, V. Effects of steady-state noise and temperature conditions on environmental perception and acceptability. Indoor Air 2010, 14, 129–136. [Google Scholar] [CrossRef]
- Yao, X.; Zeng, X.J.; Zhu, Z.P.; Lan, Y.X.; Shen, Y.P.; Liu, Q.Y.; Yang, F. Exploring the diurnal variations of the driving factors affecting block-based LST in a “Furnace city” using ECOSTRESS thermal imaging. Sustain. Cities Soc. 2023, 98, 104841. [Google Scholar] [CrossRef]
- Tarlao, C.; Steffens, J.; Guastavino, C. Investigating contextual influences on urban soundscape evaluations with structural equation modeling. Build. Environ. 2021, 188, 107490. [Google Scholar] [CrossRef]
- Nagano, K.; Horikoshi, T. New comfort index during combined conditions of moderate low ambient temperature and traffic noise. Energ. Build. 2005, 37, 287–294. [Google Scholar] [CrossRef]
- Guan, H.; Hu, S.; Lu, M.; He, M.; Mao, Z.; Liu, G. People’s subjective and physiological responses to the combined thermal-acoustic environments. Build. Environ. 2020, 172, 106709. [Google Scholar] [CrossRef]
- Yang, W.; Moon, H.J. Combined effects of acoustic, thermal, and illumination conditions on the comfort of discrete senses and overall indoor environment. Build. Environ. 2019, 148, 623–633. [Google Scholar] [CrossRef]
- Huang, L.H.L.; Zhu, Y.Z.Y.; Ouyang, Q.O.Q.; Cao, B.C.B. A study on the effects of thermal, luminous, and acoustic environments on indoor environmental comfort in offices. Build. Environ. 2012, 49, 304–309. [Google Scholar] [CrossRef]
- Humphreys, M.A. Quantifying occupant comfort: Are combined indices of the indoor environment practicable? Build. Res. Inf. Int. J. Res. Dev. Demonstr. 2005, 33, 317–325. [Google Scholar] [CrossRef]
- Wu, H.; Sun, X.; Wu, Y. Investigation of the relationships between thermal, acoustic, illuminous environments and human perceptions. J. Build. Eng. 2020, 32, 101839. [Google Scholar] [CrossRef]
- Lindquist, M.; Lange, E.; Kang, J. From 3D landscape visualization to environmental simulation: The contribution of sound to the perception of virtual environments. Landsc. Urban Plan. 2016, 148, 216–231. [Google Scholar] [CrossRef]
- Faul, F.; Erdfelder, E.; Lang, A.G.; Buchner, A. G*Power 3: A flexible statistical power analysis program for the social, behavioral, and biomedical sciences. Behav. Res. Methods 2007, 39, 175–191. [Google Scholar] [CrossRef] [PubMed]
- Victoria, H. Urban Smellscapes: Understanding and Designing City Smell Environments; Taylor and Francis: London, UK, 2013. [Google Scholar]
- Pan, Y.; Meng, Z. Influence of attention on visual and auditory masking effect in condition of visual-auditory dual tasks. Shengxue Xuebao/Acta Acust. 2013, 38, 215–223. [Google Scholar]
- Nagano, K.; Horikoshi, T. New index of combined effect of temperature and noise on human comfort: Summer experiments on hot ambient temperature and traffic noise. Arch. Complex Environ. Stud. 2001, 13, 120006657531. [Google Scholar]
- Hashimoto, T.; Hatano, S.; Shin, S.H. Effect of Visual Scenery and Seat Vibration to the Perception of Sound Quality of car Interior Noise. Proc. Symp. Environ. Eng. 2006, 16, 53–56. [Google Scholar]
- Southworth, M.F. The sonic environment of cities. Environ. Behav. 1969, 1, 49–70. [Google Scholar]
- Kubartz, B. Urban smellscapes: Understanding and designing city smell environments. AAG Rev. Books 2014, 2, 99–101. [Google Scholar] [CrossRef]
- Li, S.; Chen, Z.; Guo, L.; Hu, F.; Huang, Y.; Wu, D.; Wu, Z.; Hong, X. How do spatial forms influence psychophysical drivers in a campus city community life circle? Sustainability 2023, 13, 10014. [Google Scholar] [CrossRef]
- Eramudugolla, R.Q.B.I.; Henderson, R.S.O.P.; Mattingley, J.B.O.Q. Effects of audio—Visual integration on the detection of masked speech and non-speech sounds. Brain Cogn. 2011, 75, 60–66. [Google Scholar] [CrossRef] [PubMed]
- Wernicke, M.; Mattler, U. Masking procedures can influence priming effects besides their effects on conscious perception. Conscious. Cogn. 2019, 71, 92–108. [Google Scholar] [CrossRef] [PubMed]
- Chholak, P.; Hramov, A.E.; Pisarchik, A.N. An advanced perception model combining brain noise and adaptation. Nonlinear Dynam. 2020, 100, 3695–3709. [Google Scholar] [CrossRef]
- Rey Gozalo, G.G.U.E. Relationships among satisfaction, noise perception, and use of urban green spaces. Sci. Total Environ. 2018, 624, 438–450. [Google Scholar] [CrossRef]
- Chen, Y.; Liu, F.; Lin, X.; Liu, J.; Chen, Z.; Shi, K.; Li, J.; Dong, J. Combined Effects of the Thermal-Acoustic Environment on Subjective Evaluations in Urban Park Based on Sensory-Walking. Forests 2023, 14, 1161. [Google Scholar] [CrossRef]
- Knasko, S.C.M.C. Pleasant odors and congruency: Effects on approach behavior. Chem. Senses 1995, 20, 479–487. [Google Scholar] [CrossRef] [PubMed]
- Croft, R.J.B.B.; Gonsalvez, C.J.B.B.; Gander, J.B.B.R.; Lechem, L.B.B.R.; Barry, R.J.O.B. Differential relations between heart rate and skin conductance, and public speaking anxiety. J. Behav. Ther. Exp. Psychiatry 2004, 35, 259–271. [Google Scholar] [CrossRef] [PubMed]
- Francesca Massimello, L.B.A.C. Music modulates autonomic nervous system activity in human fetuses. Front. Med. 2022, 9, 857591. [Google Scholar]
- Baccarani, A.; Donnadieu, S.; Pellissier, S.; Brochard, R. Relaxing effects of music and odors on physiological recovery after cognitive stress and unexpected absence of multisensory benefit. Psychophysiology 2023, 60, e14251. [Google Scholar] [CrossRef]
- Li, Z.; Kang, J. Sensitivity analysis of changes in human physiological indicators observed in soundscapes. Landsc. Urban Plan. 2019, 190, 103593. [Google Scholar] [CrossRef]

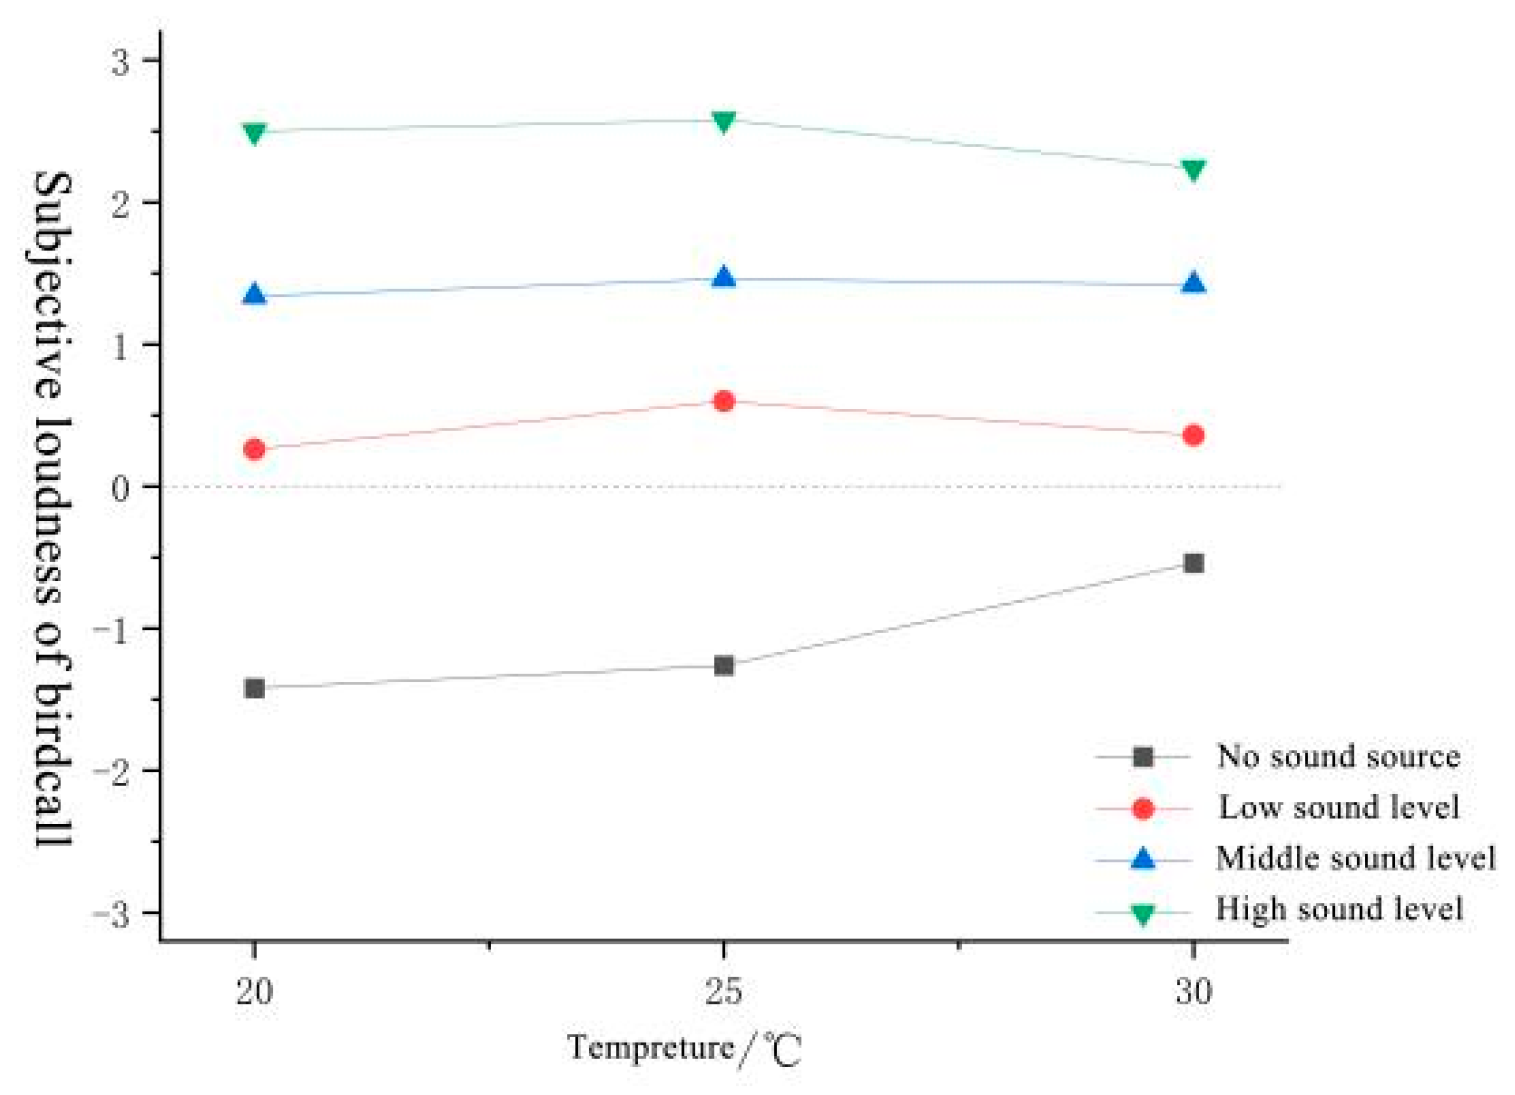
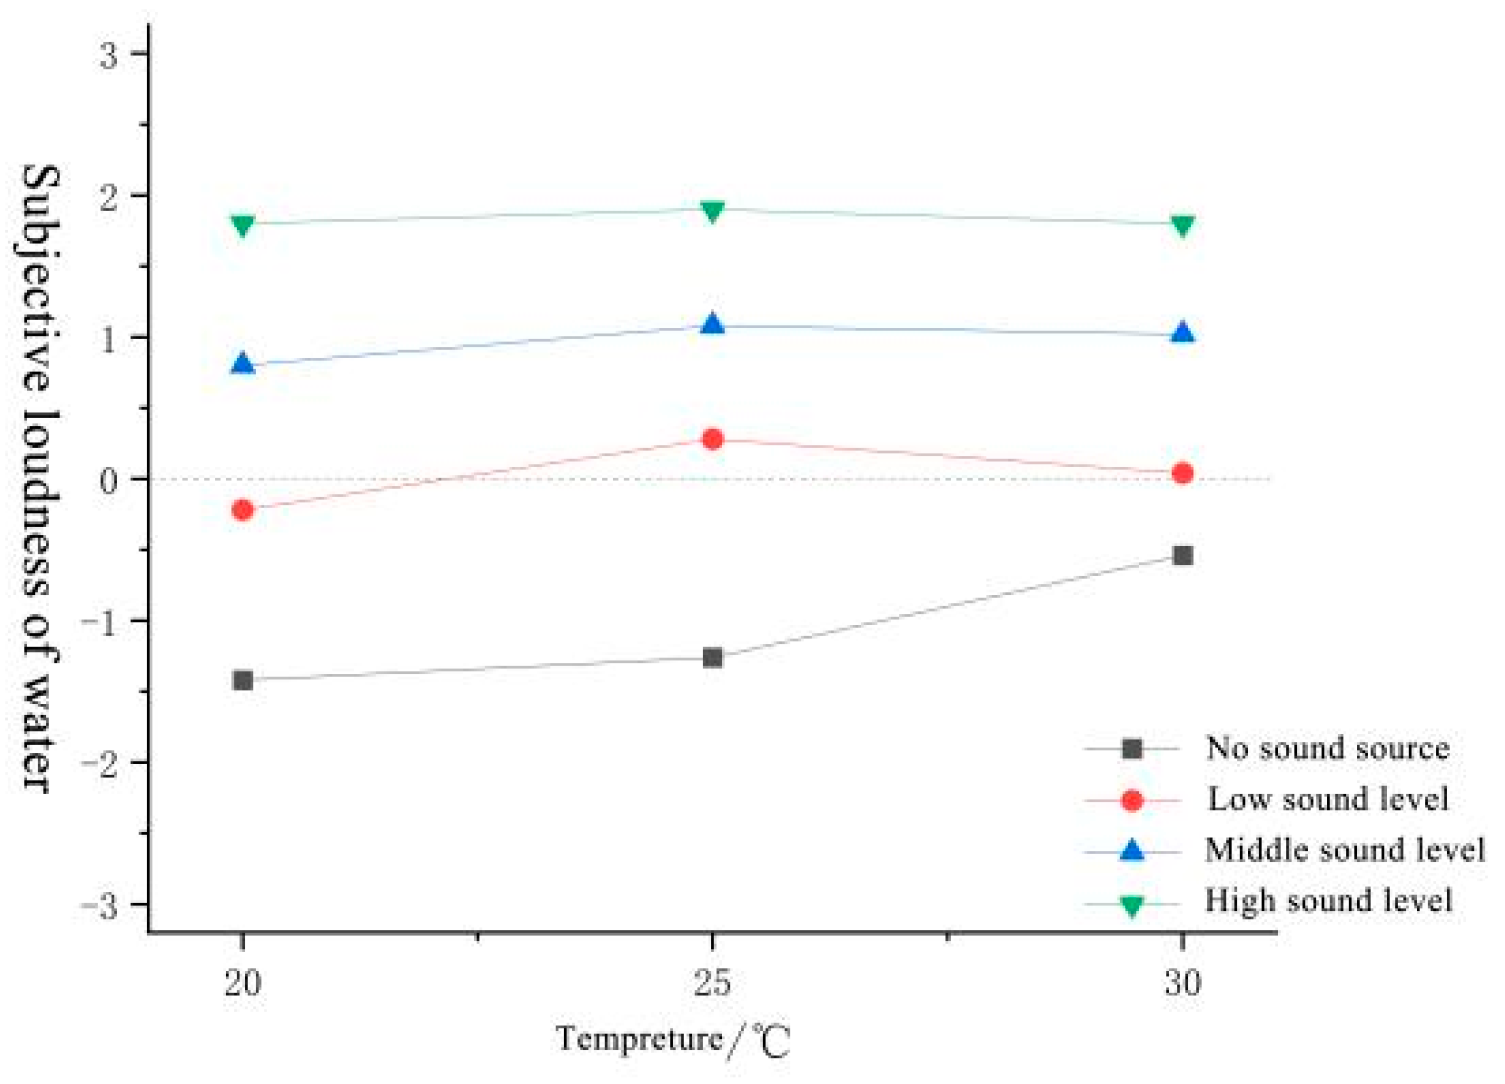
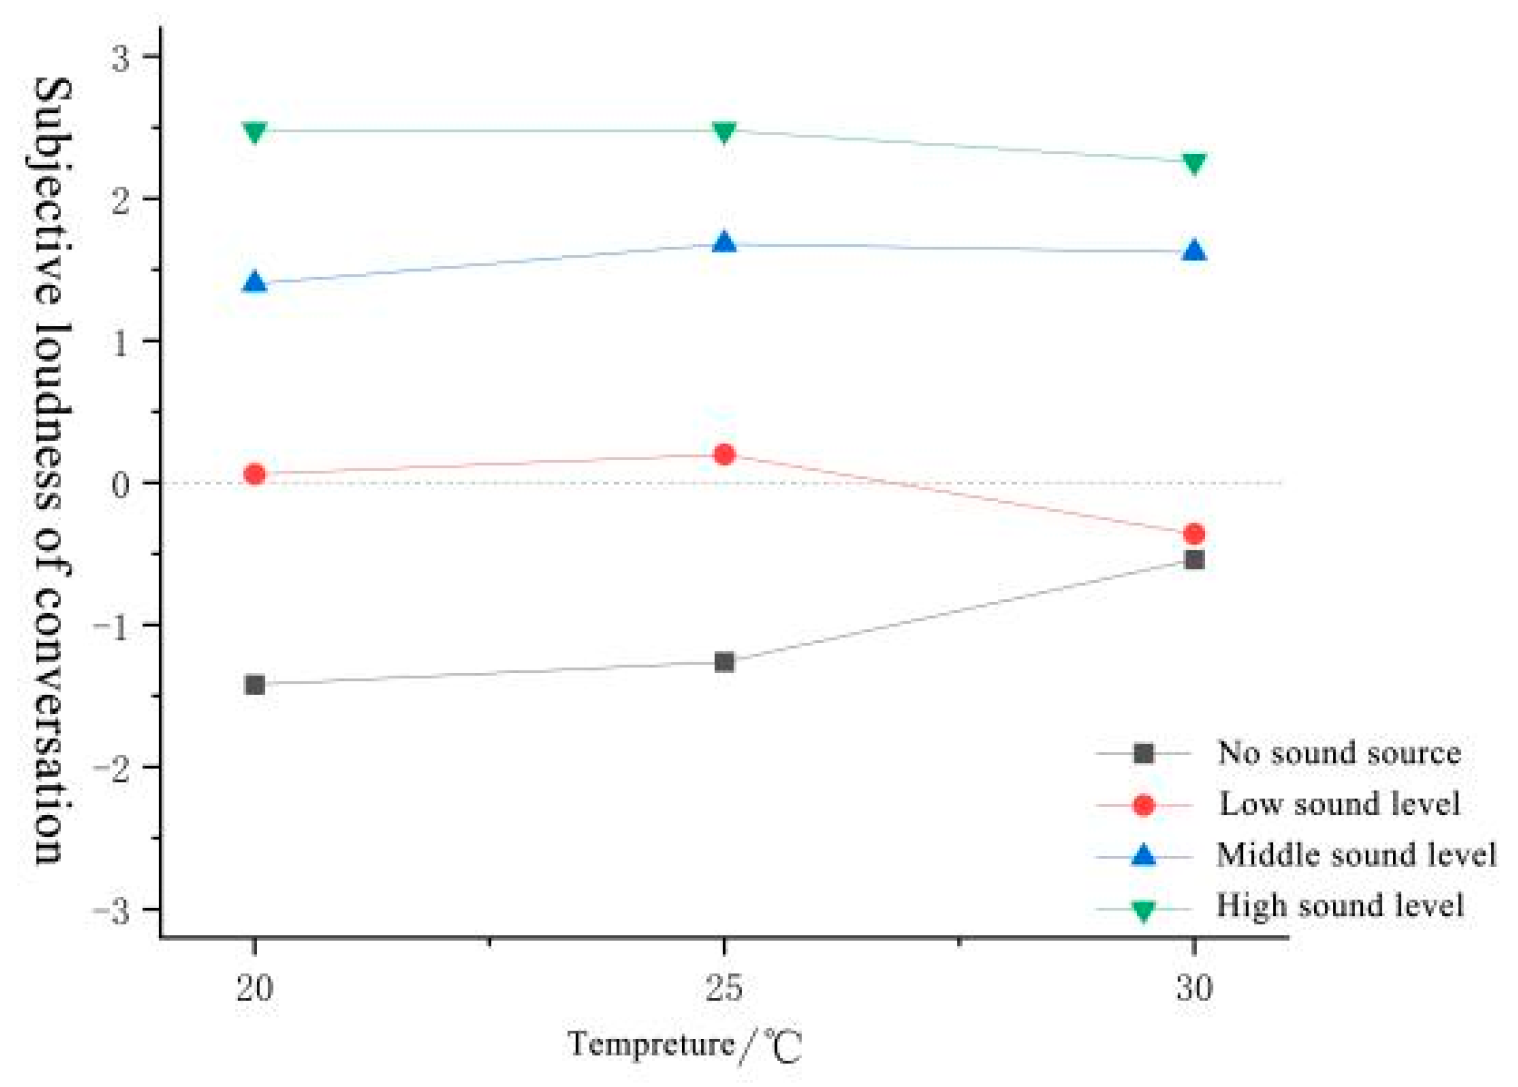
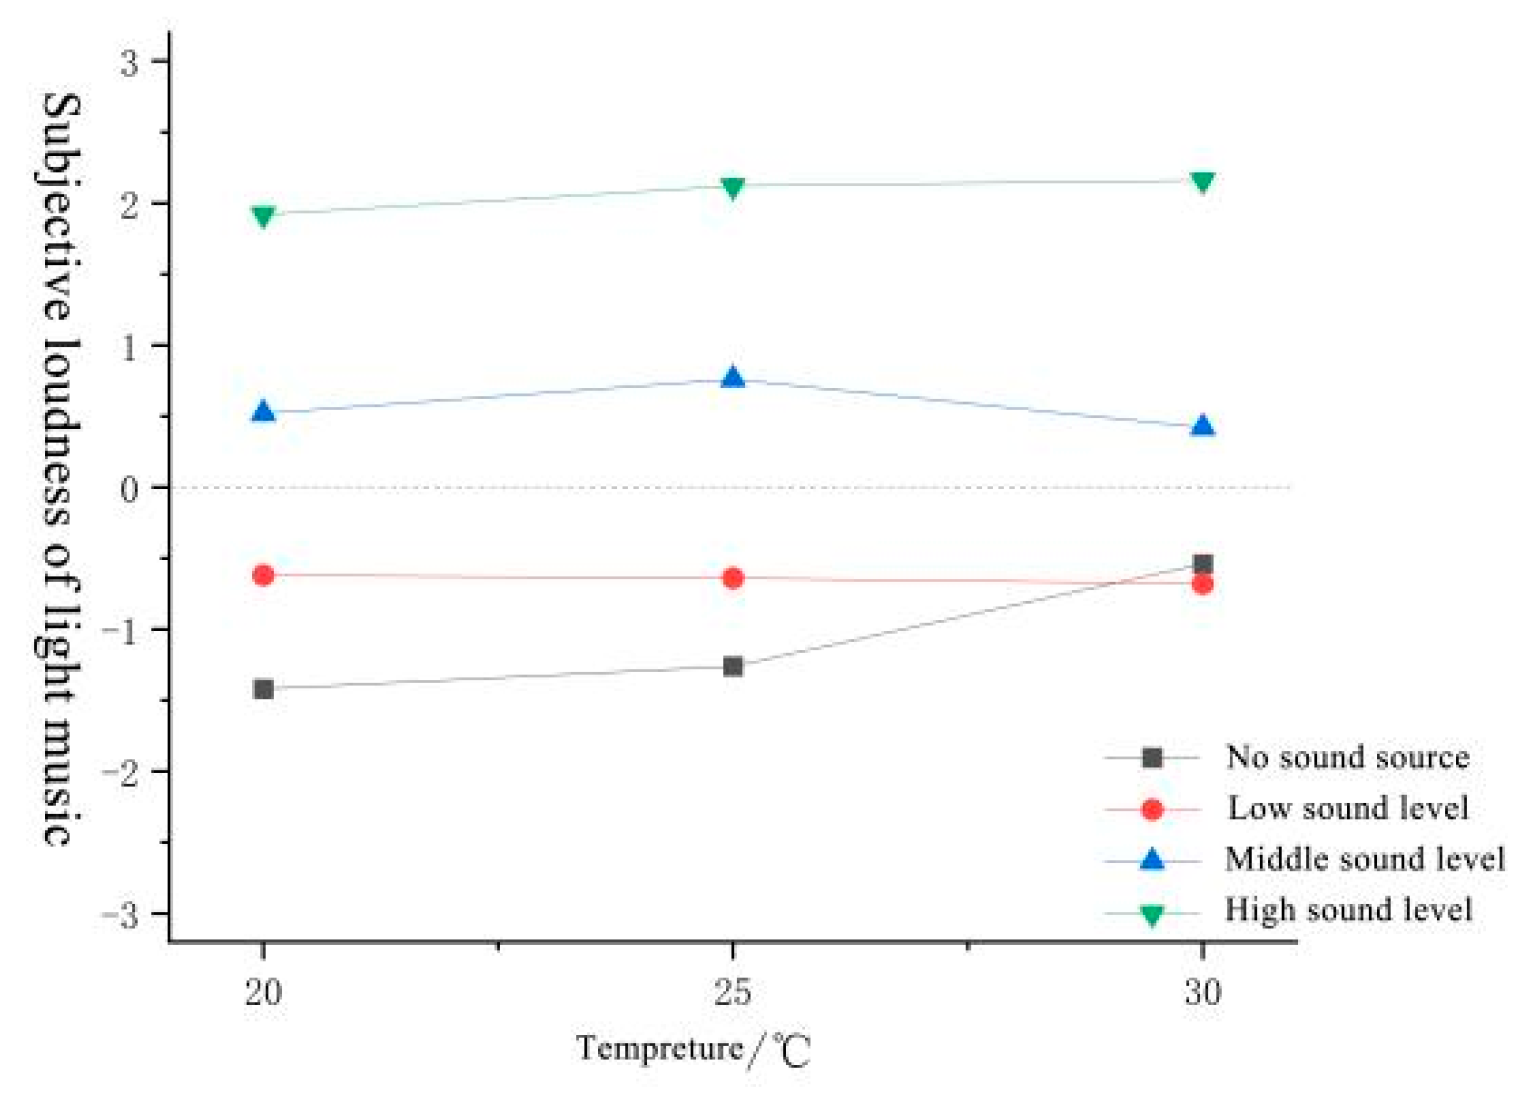
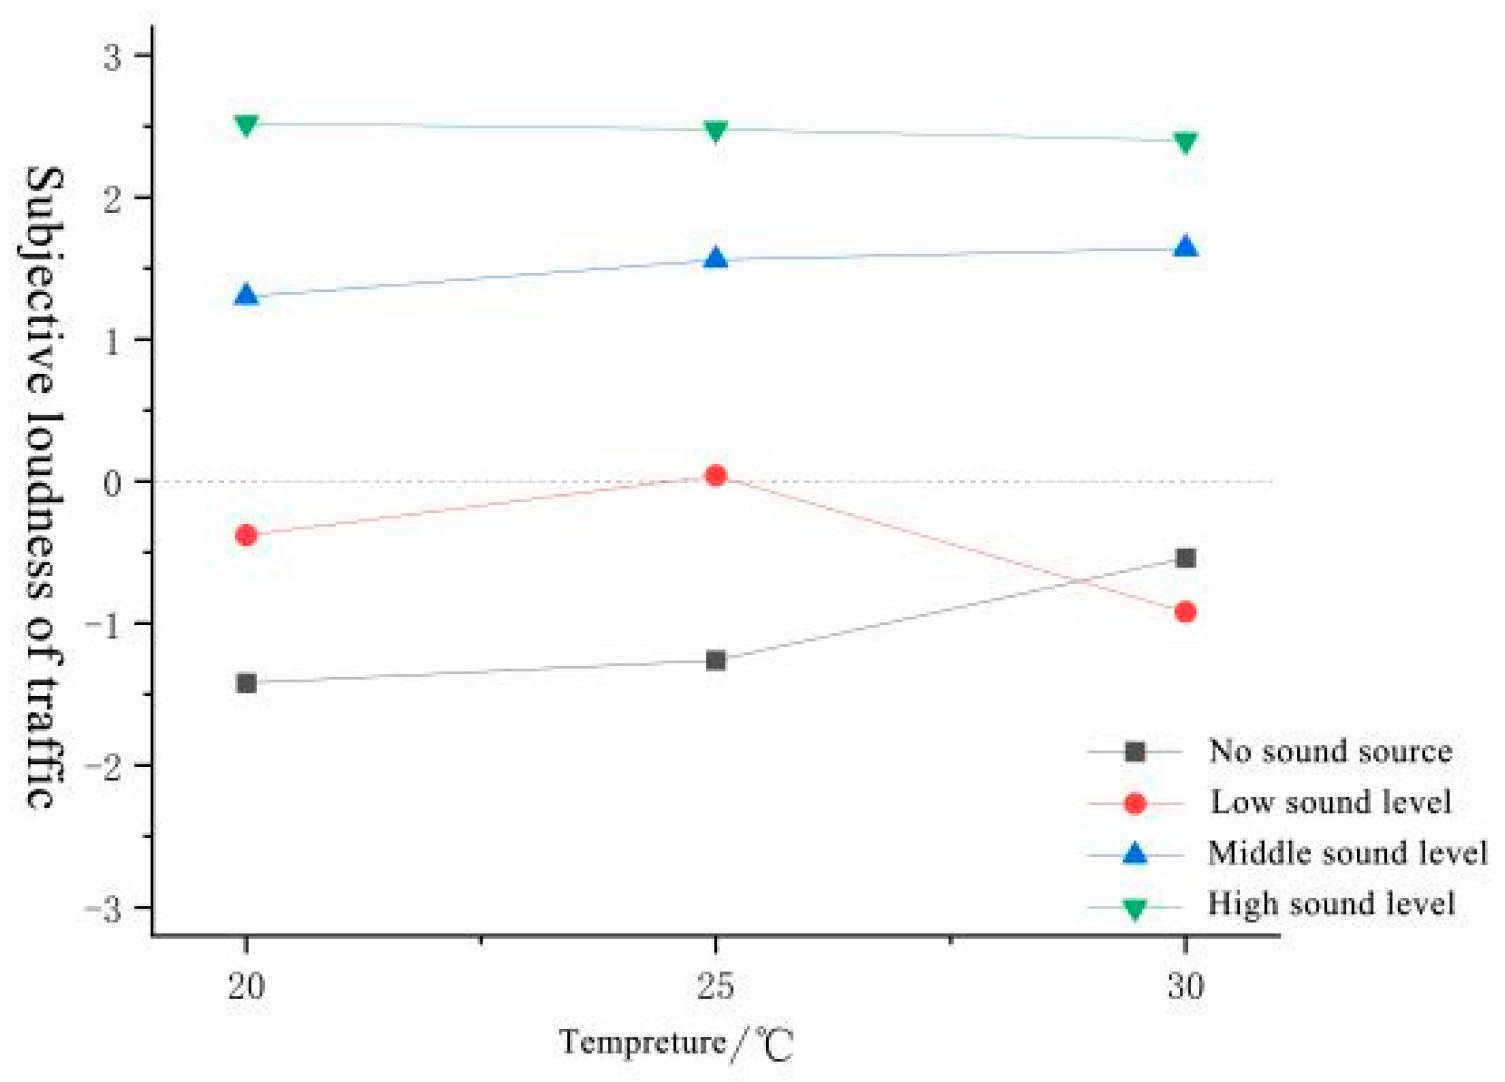
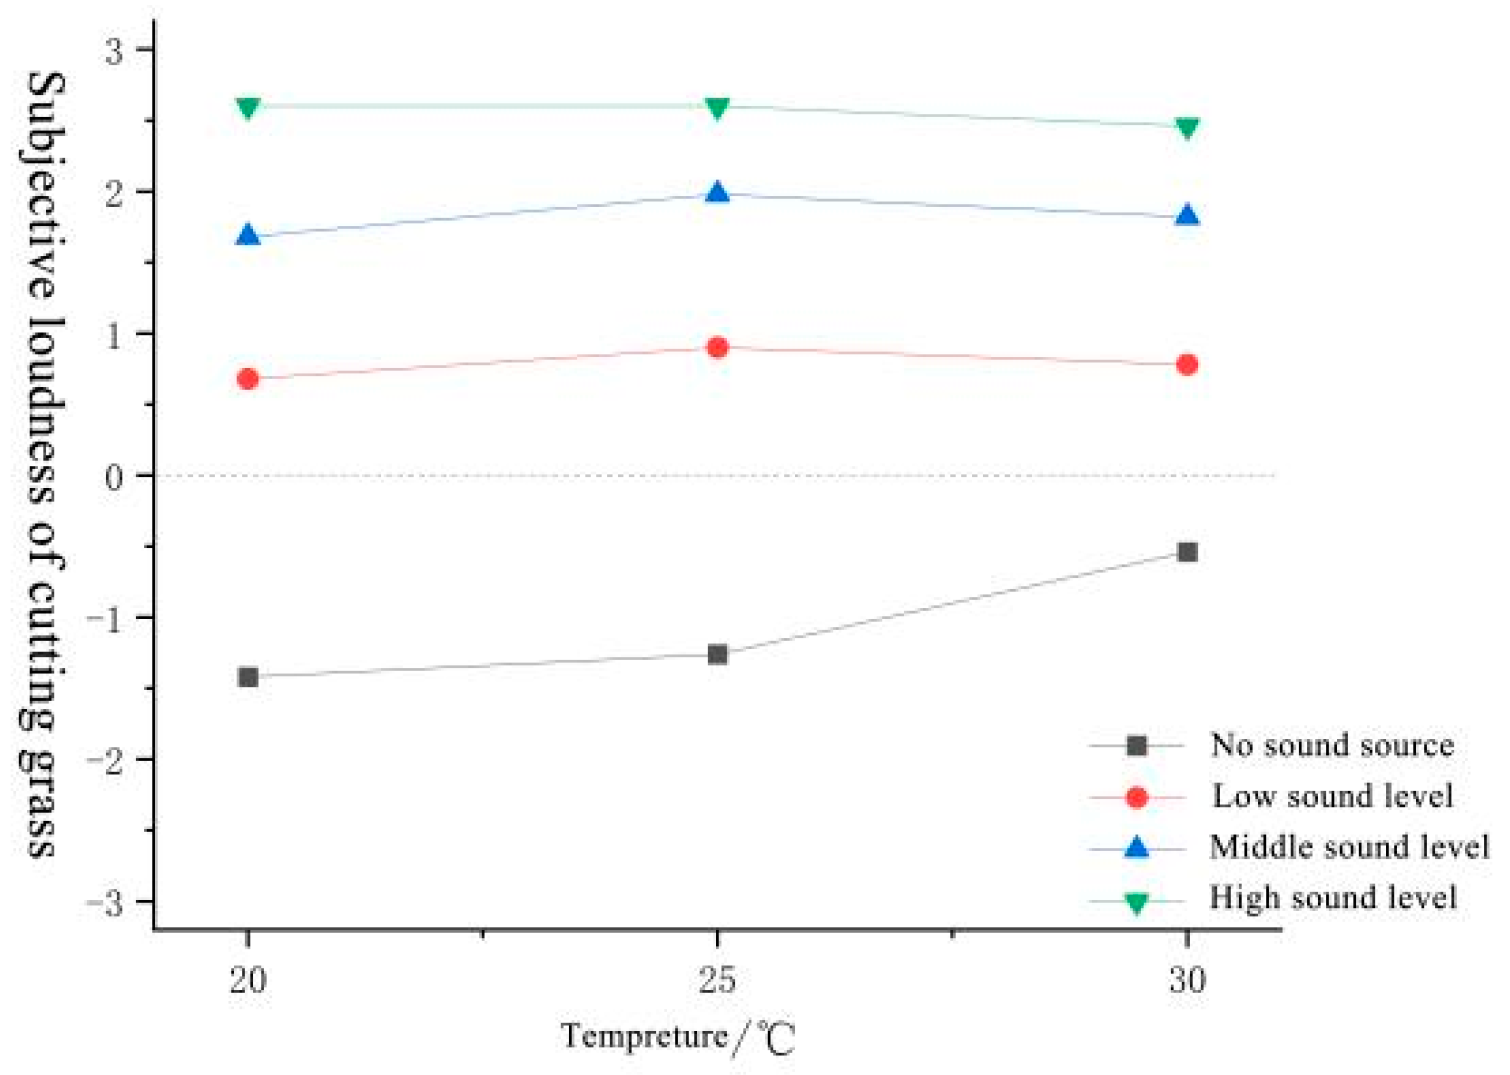
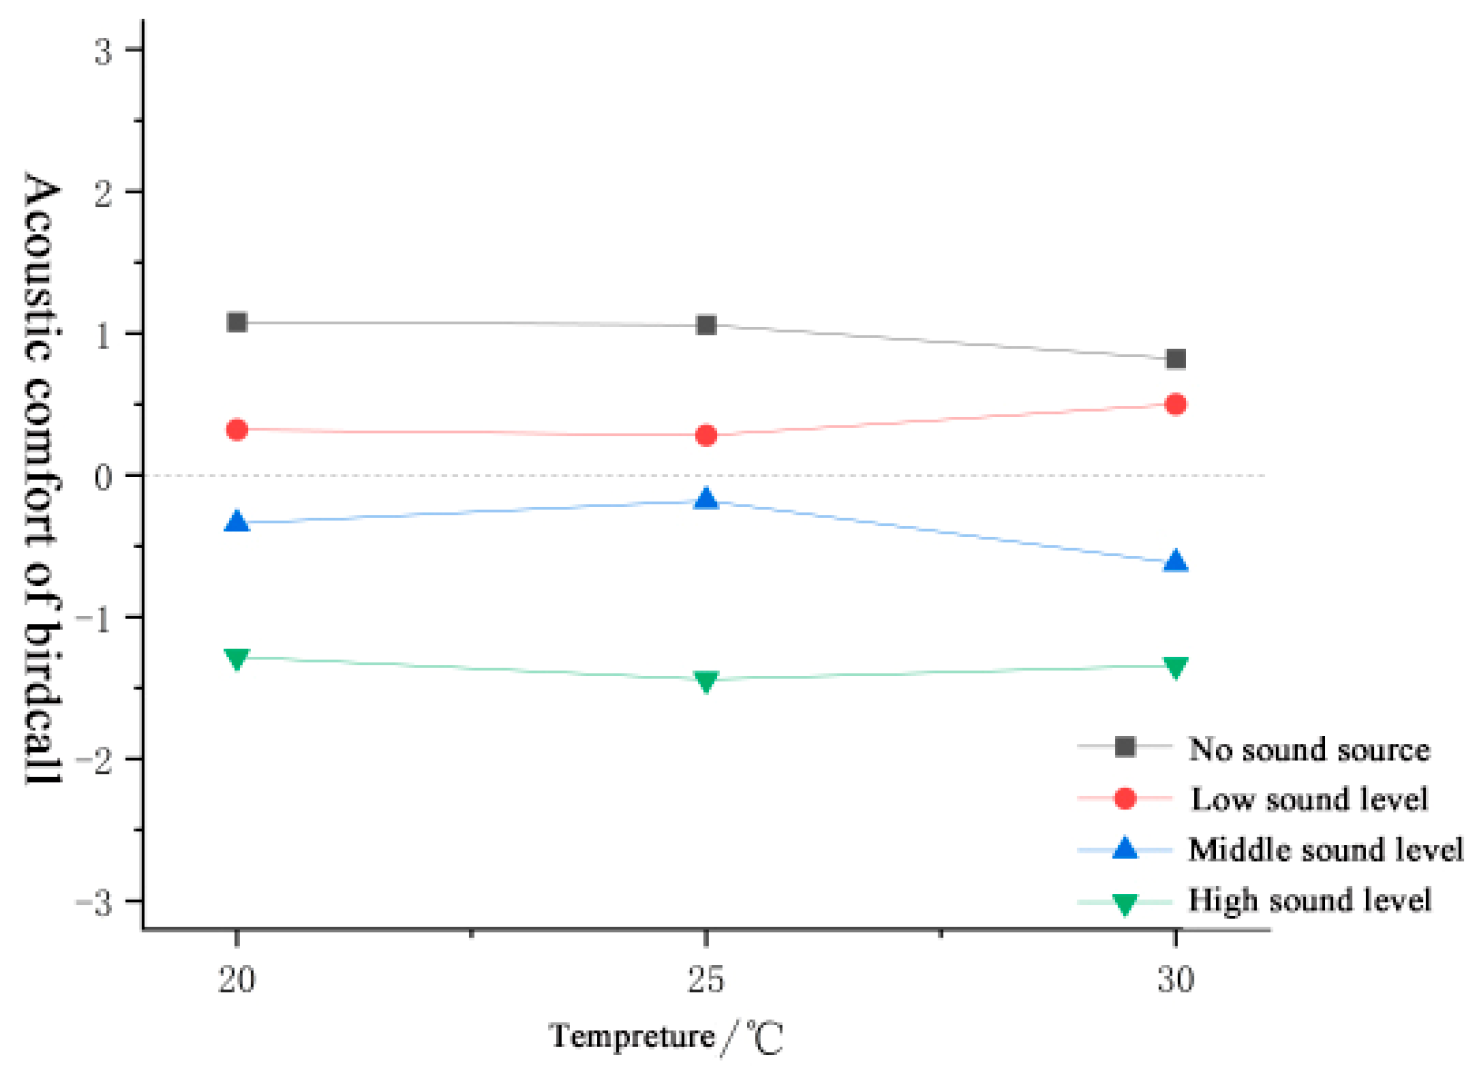
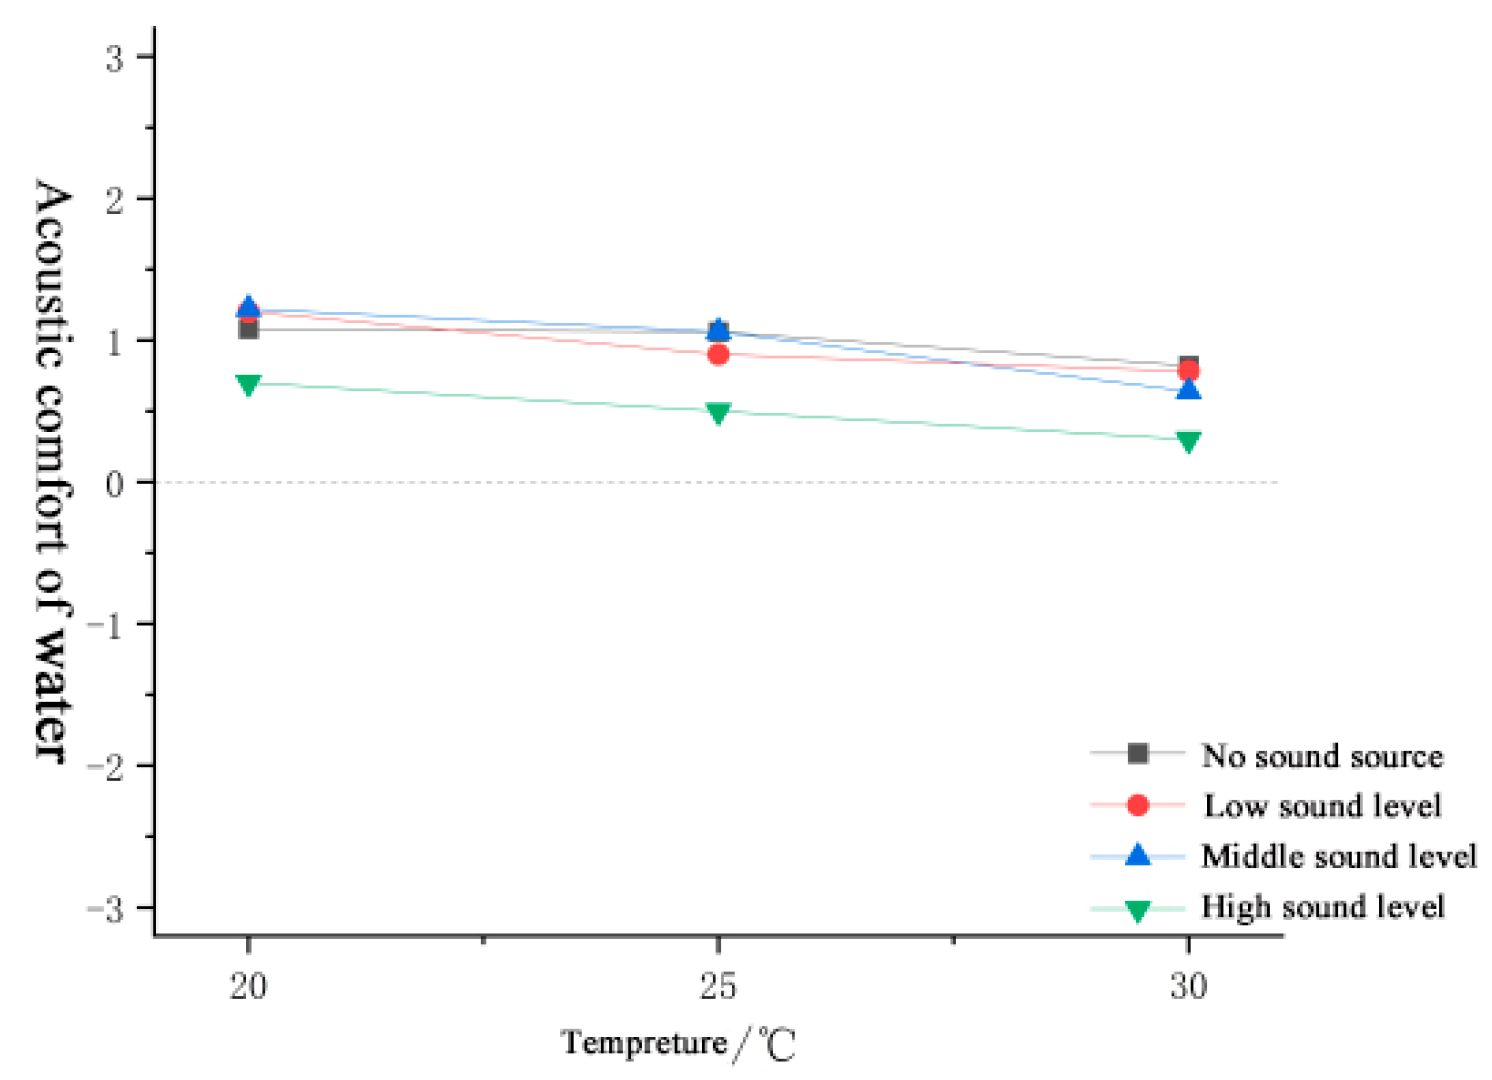

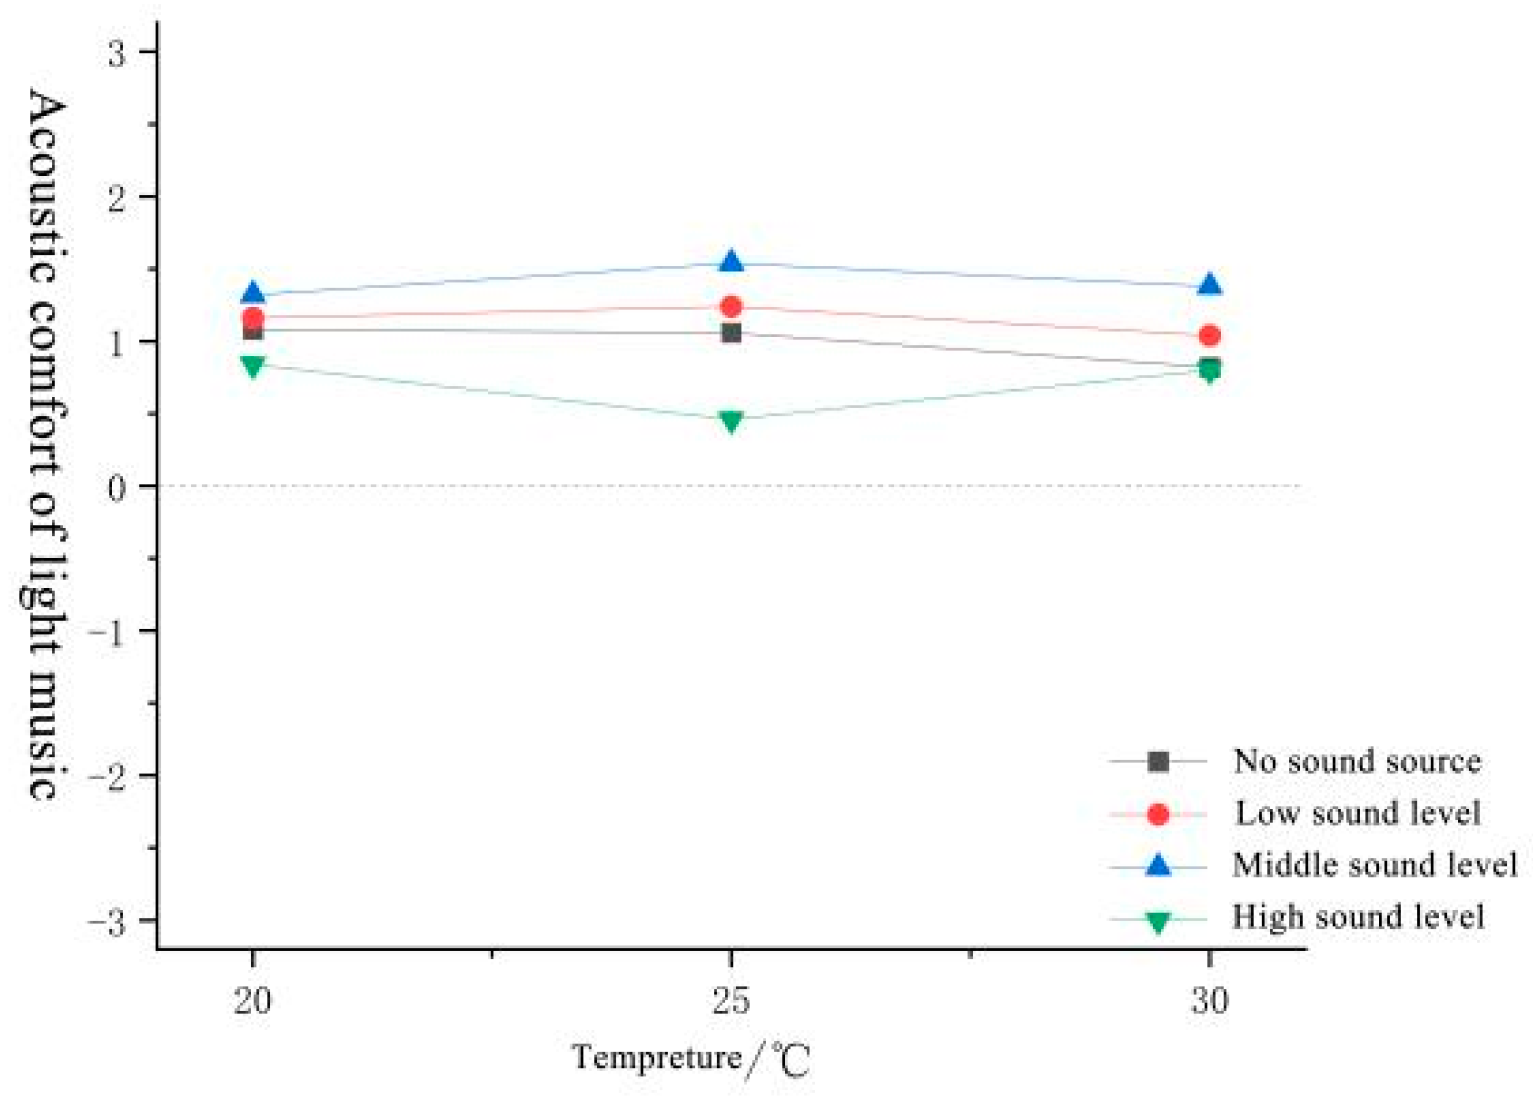
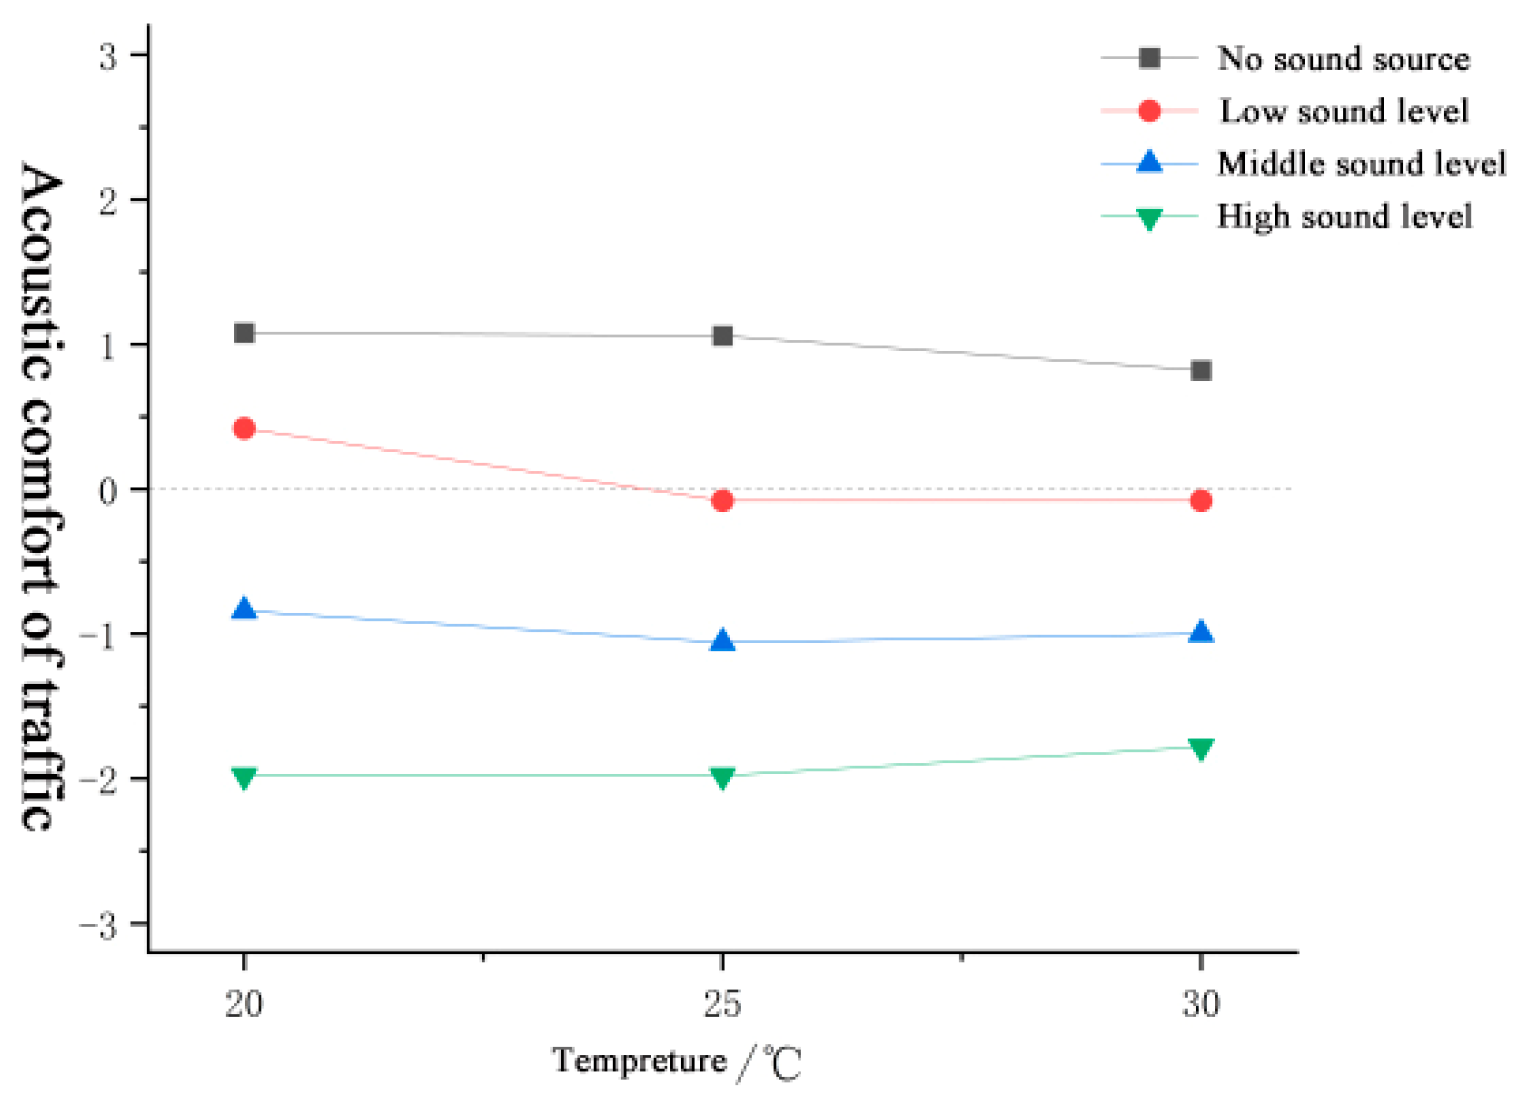
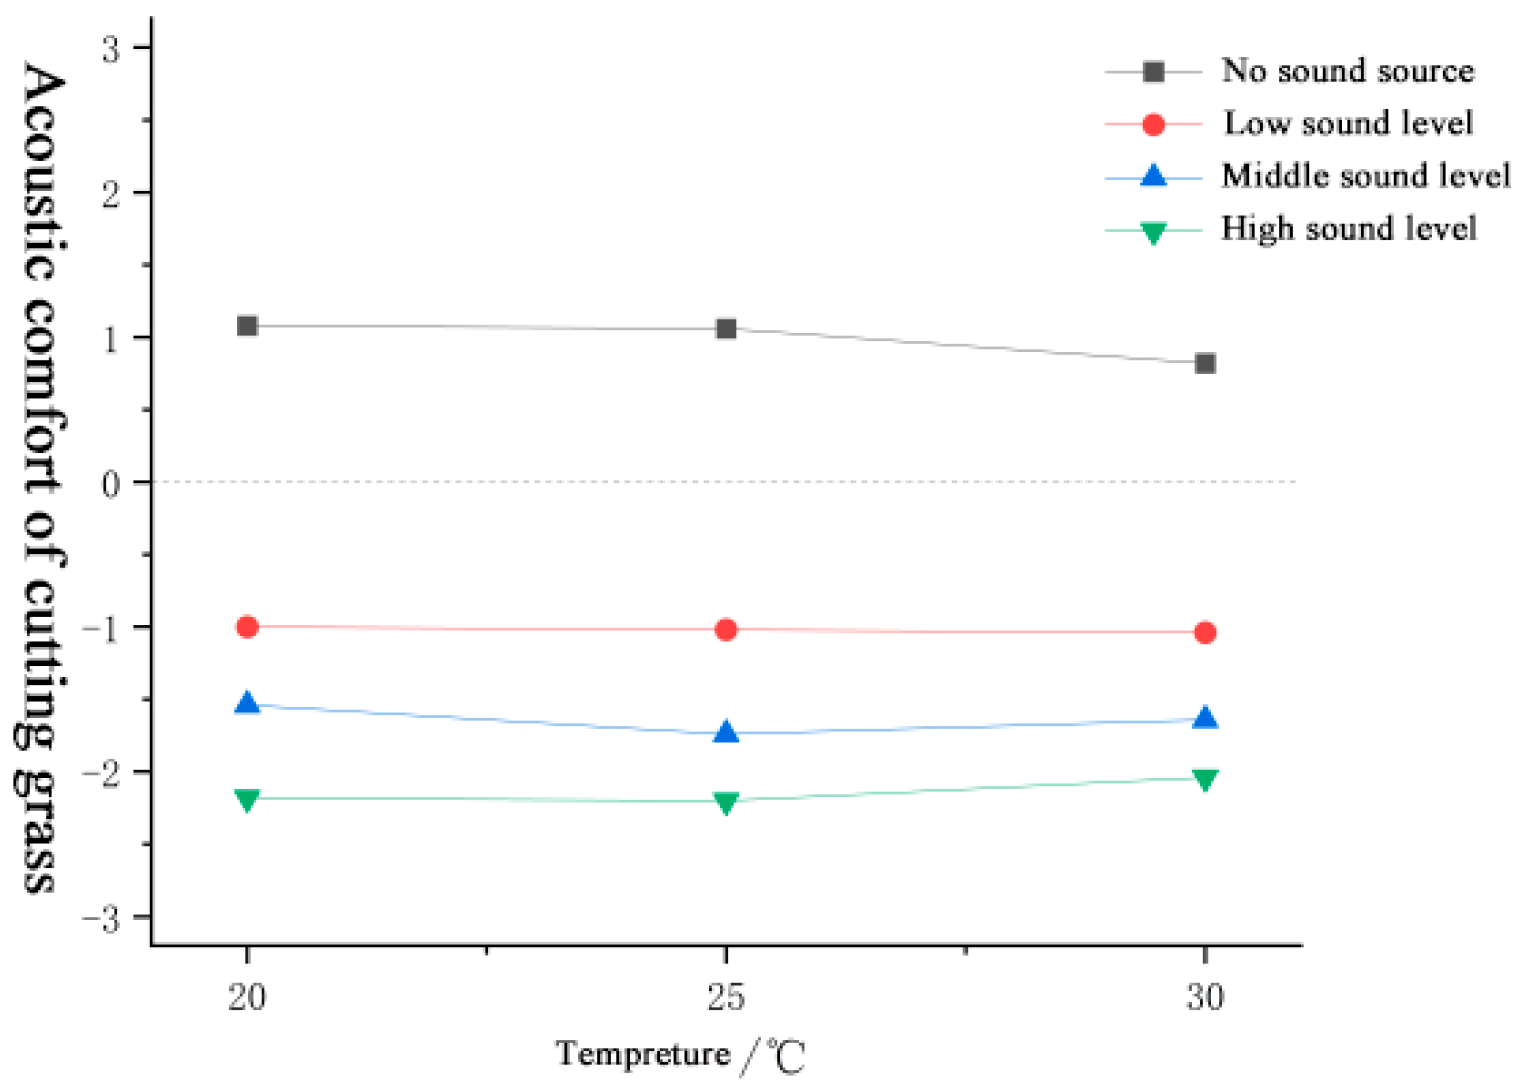
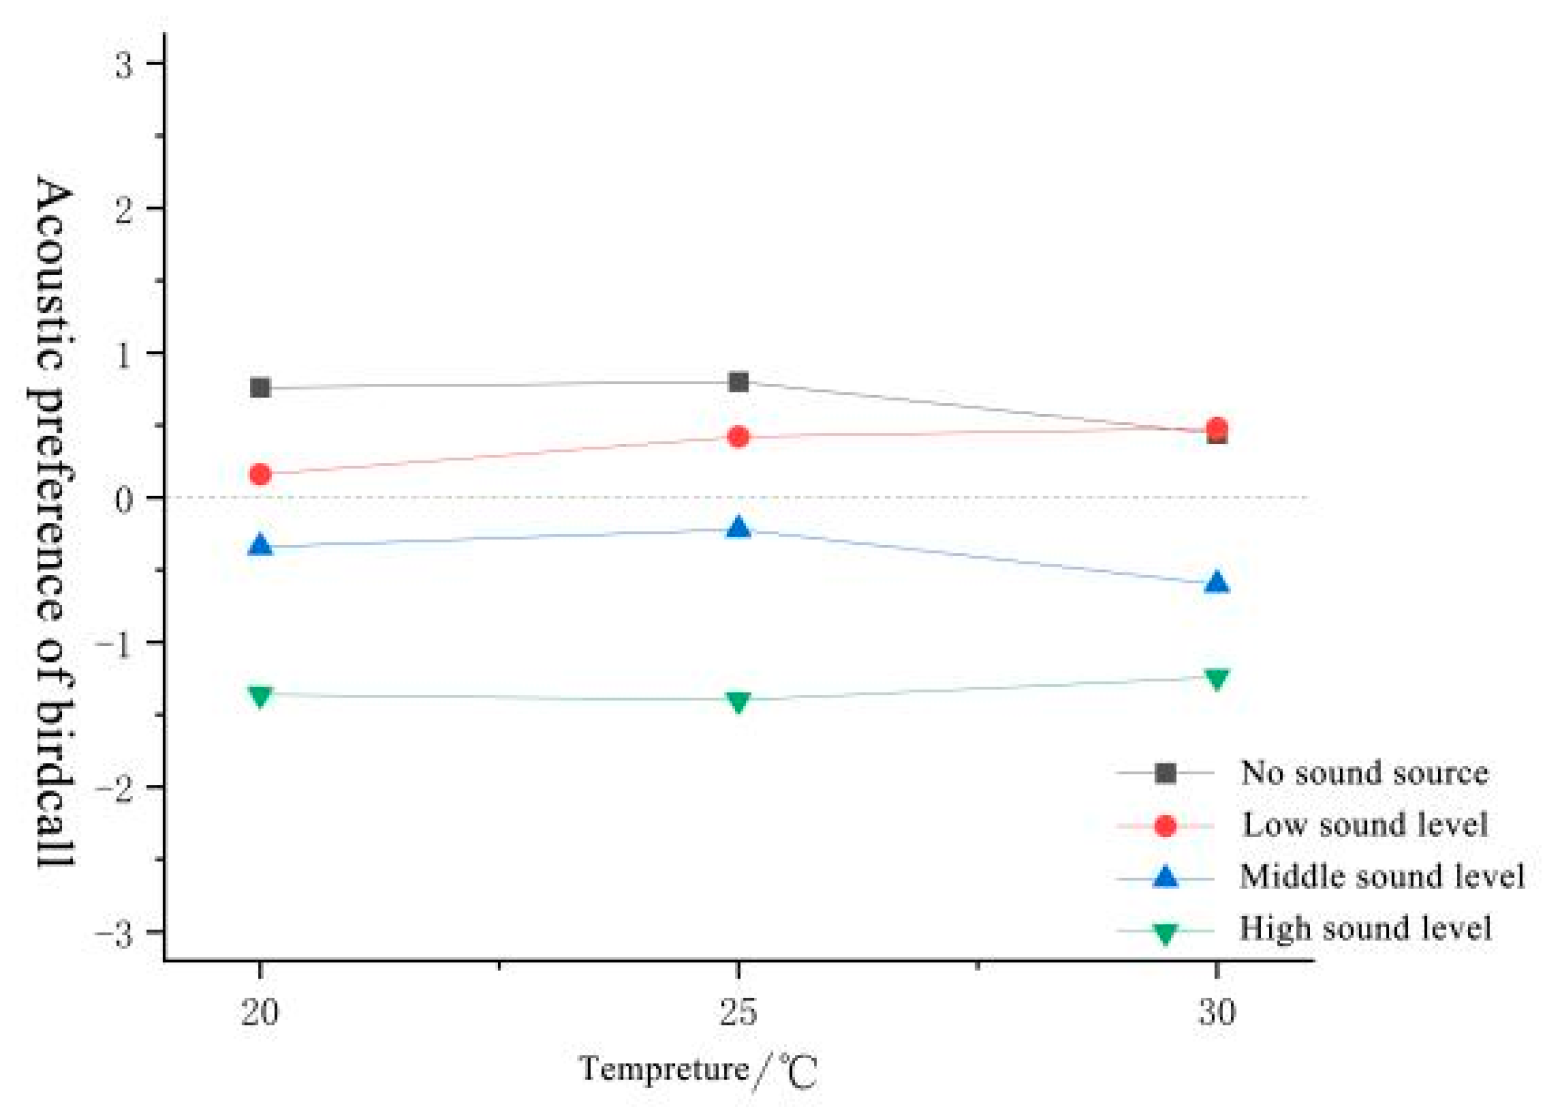
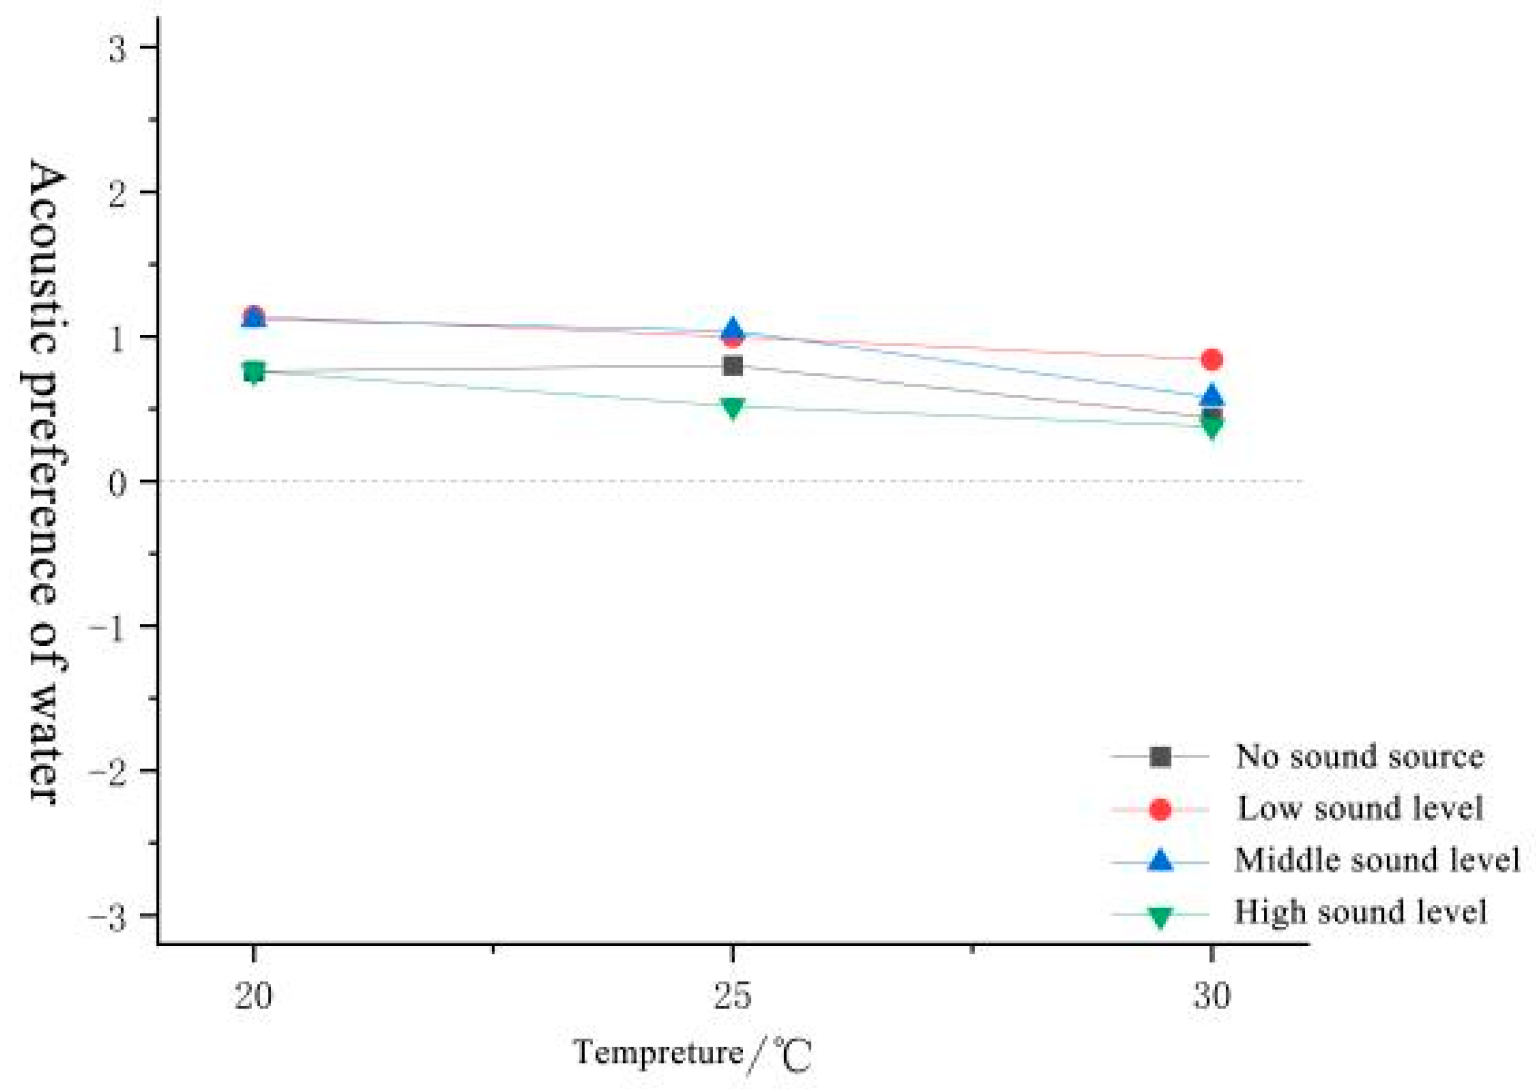
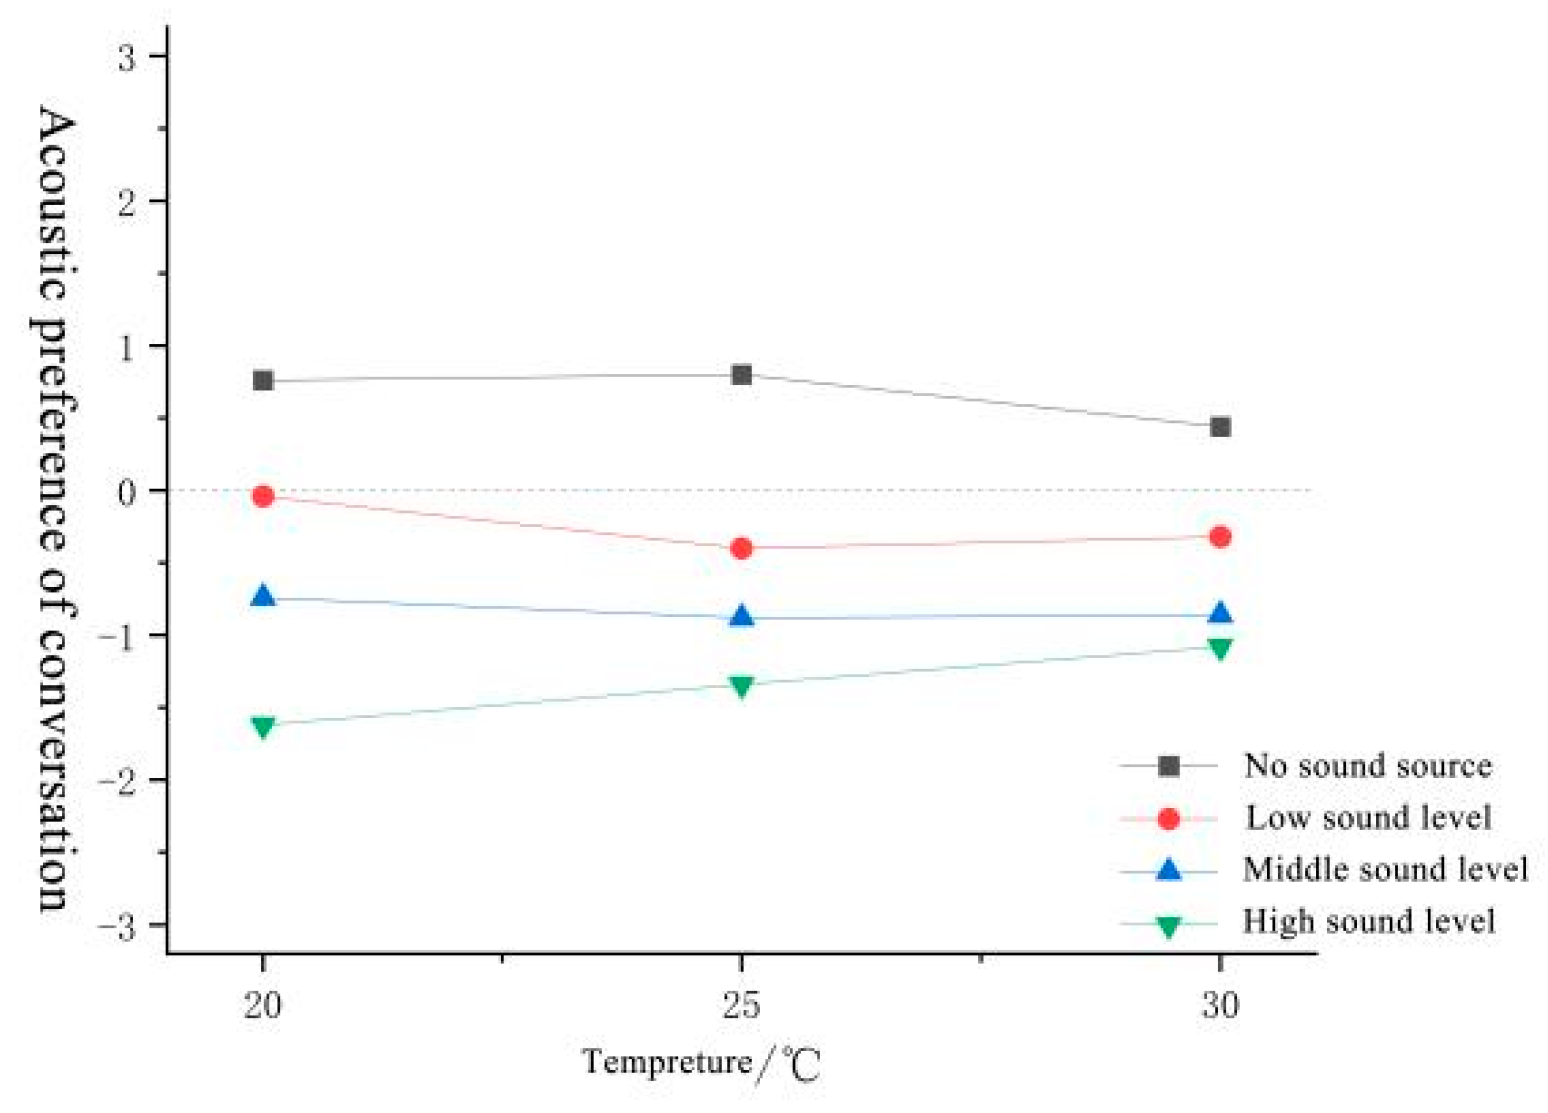
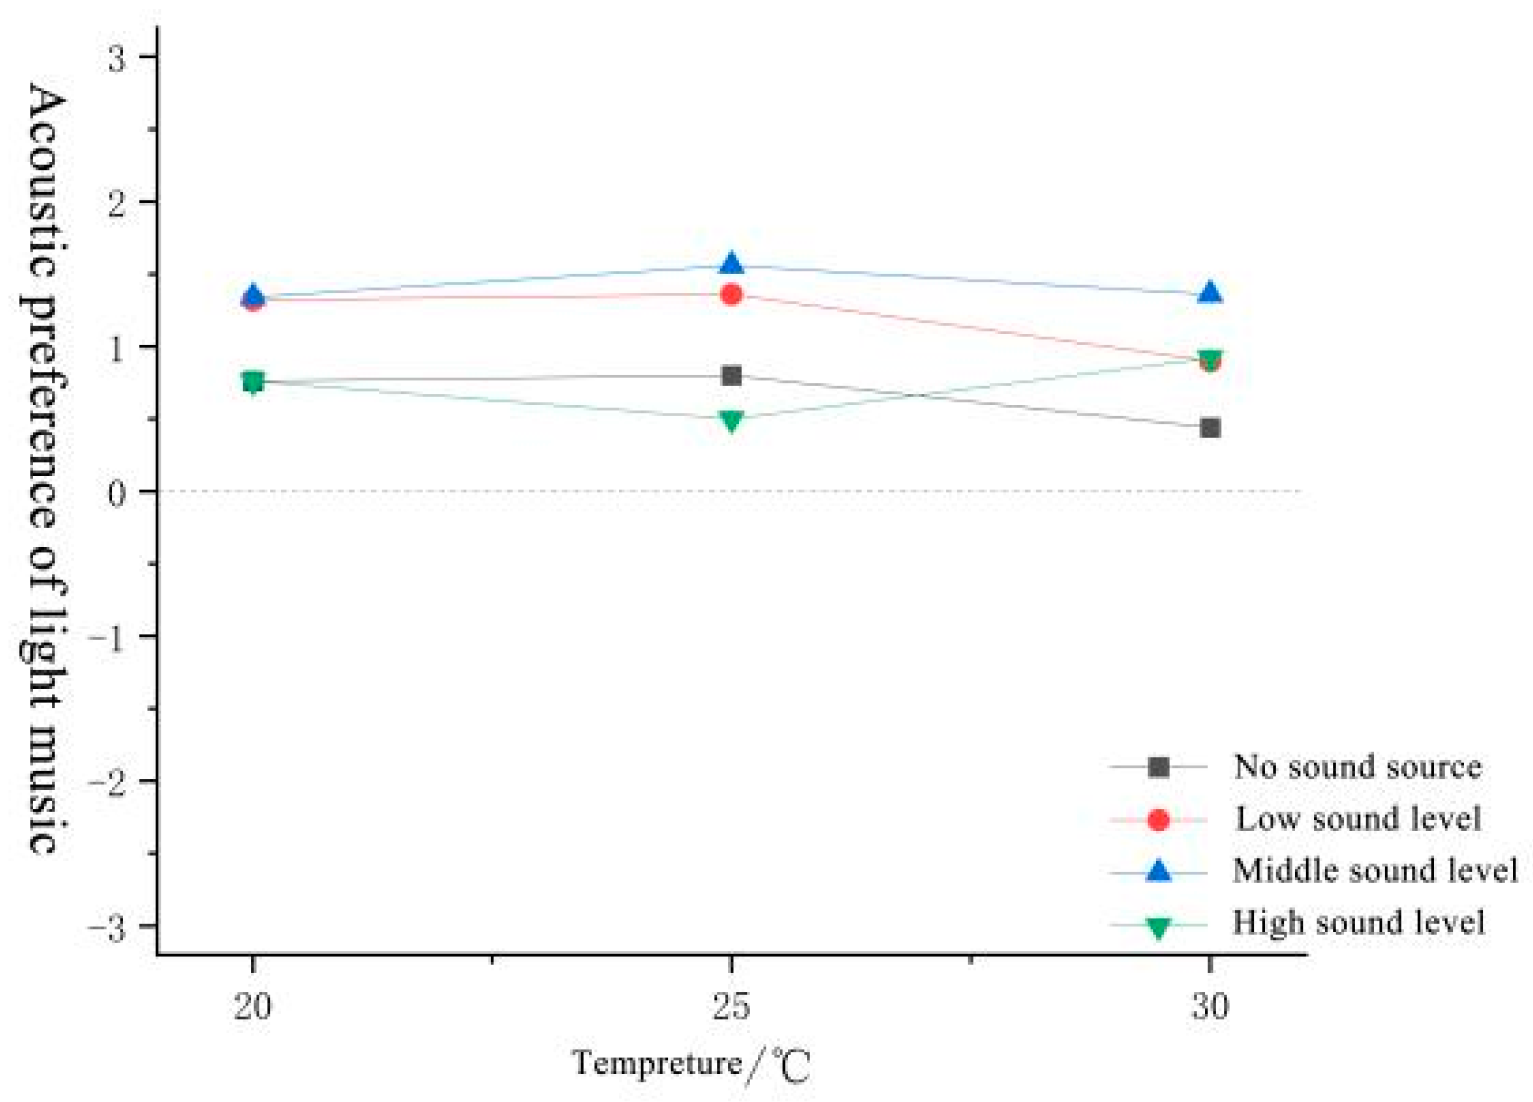
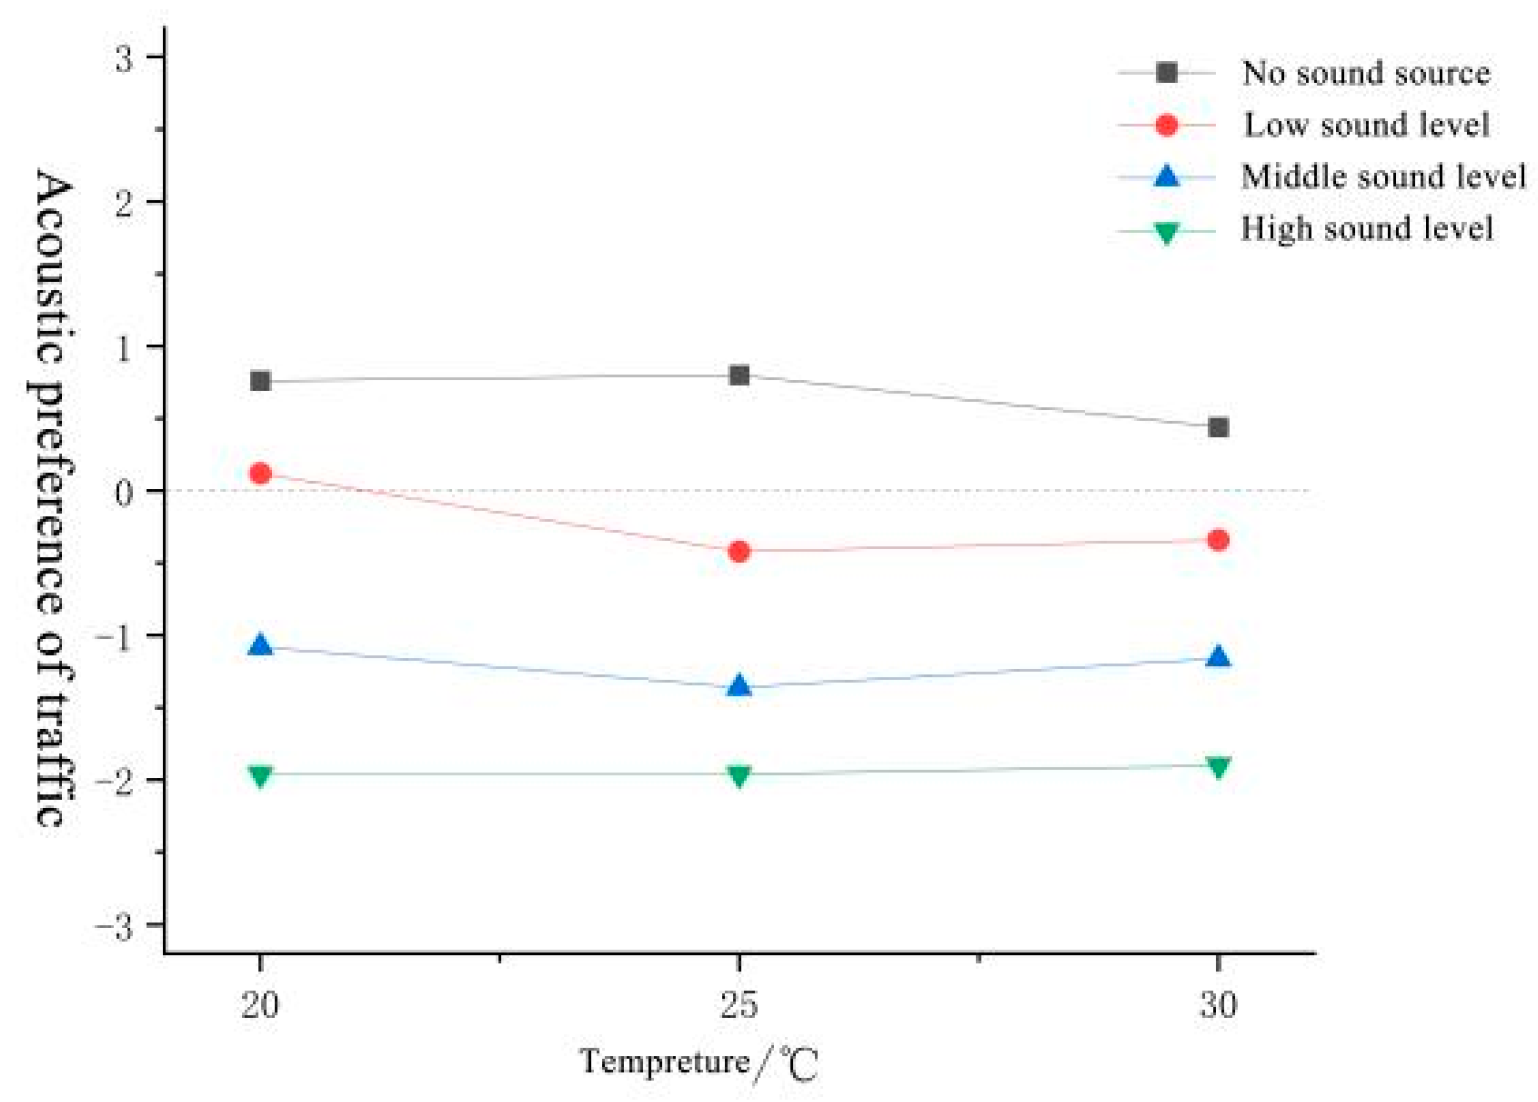
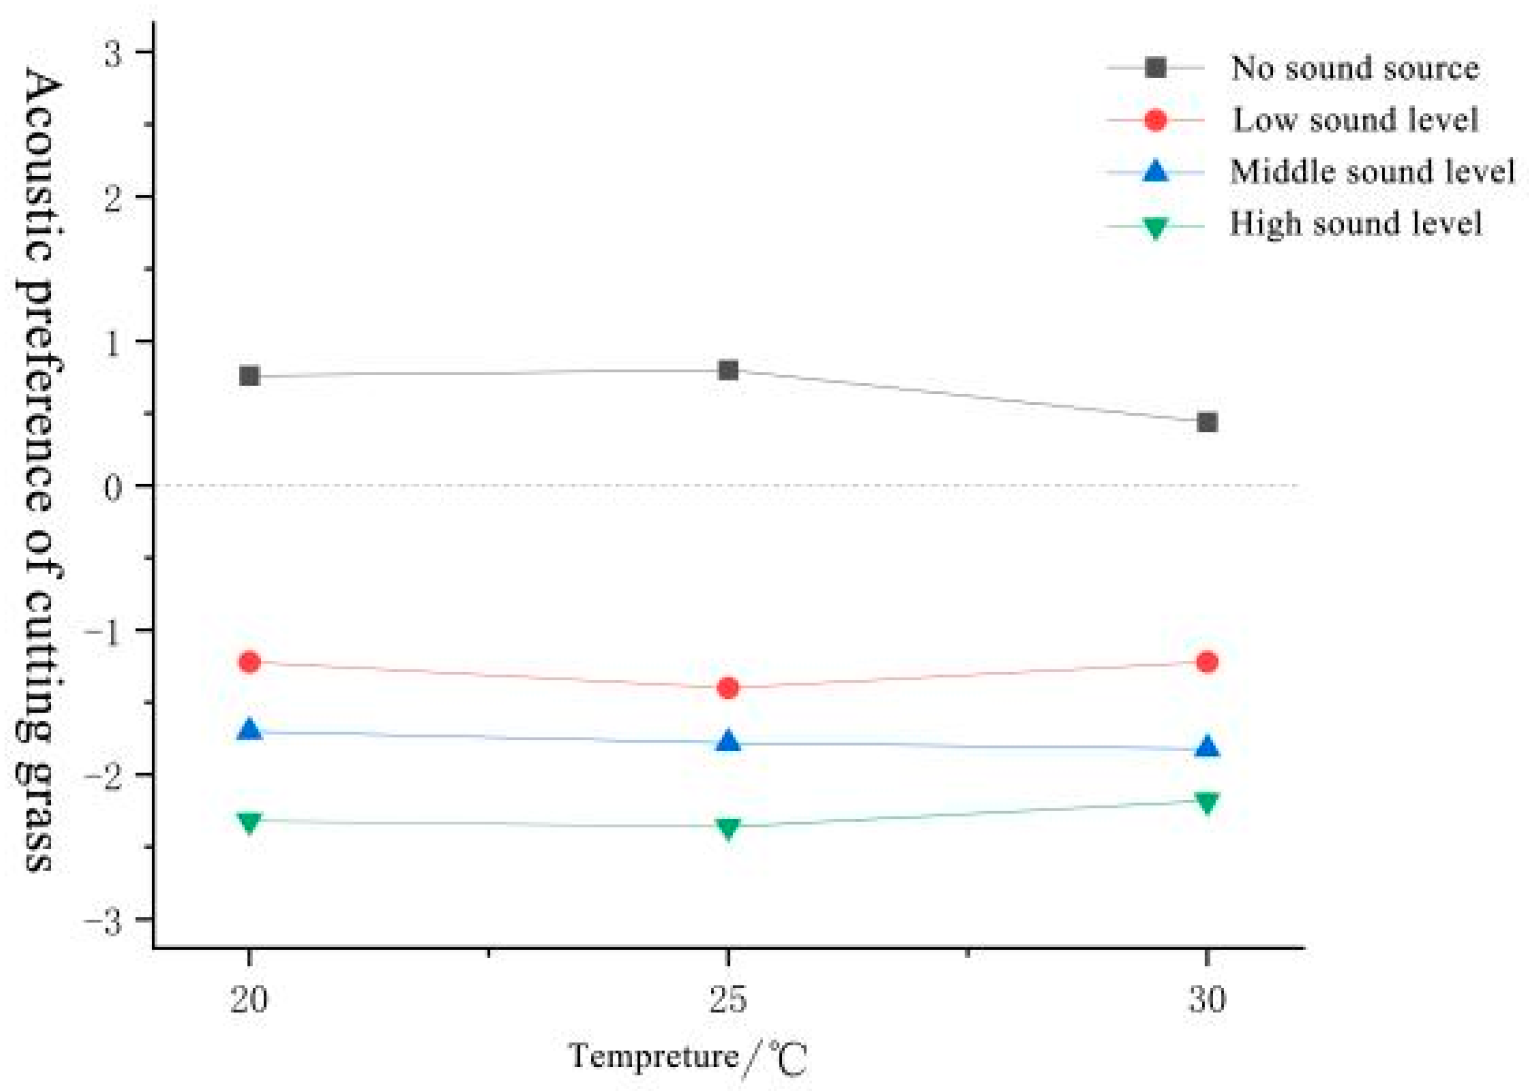
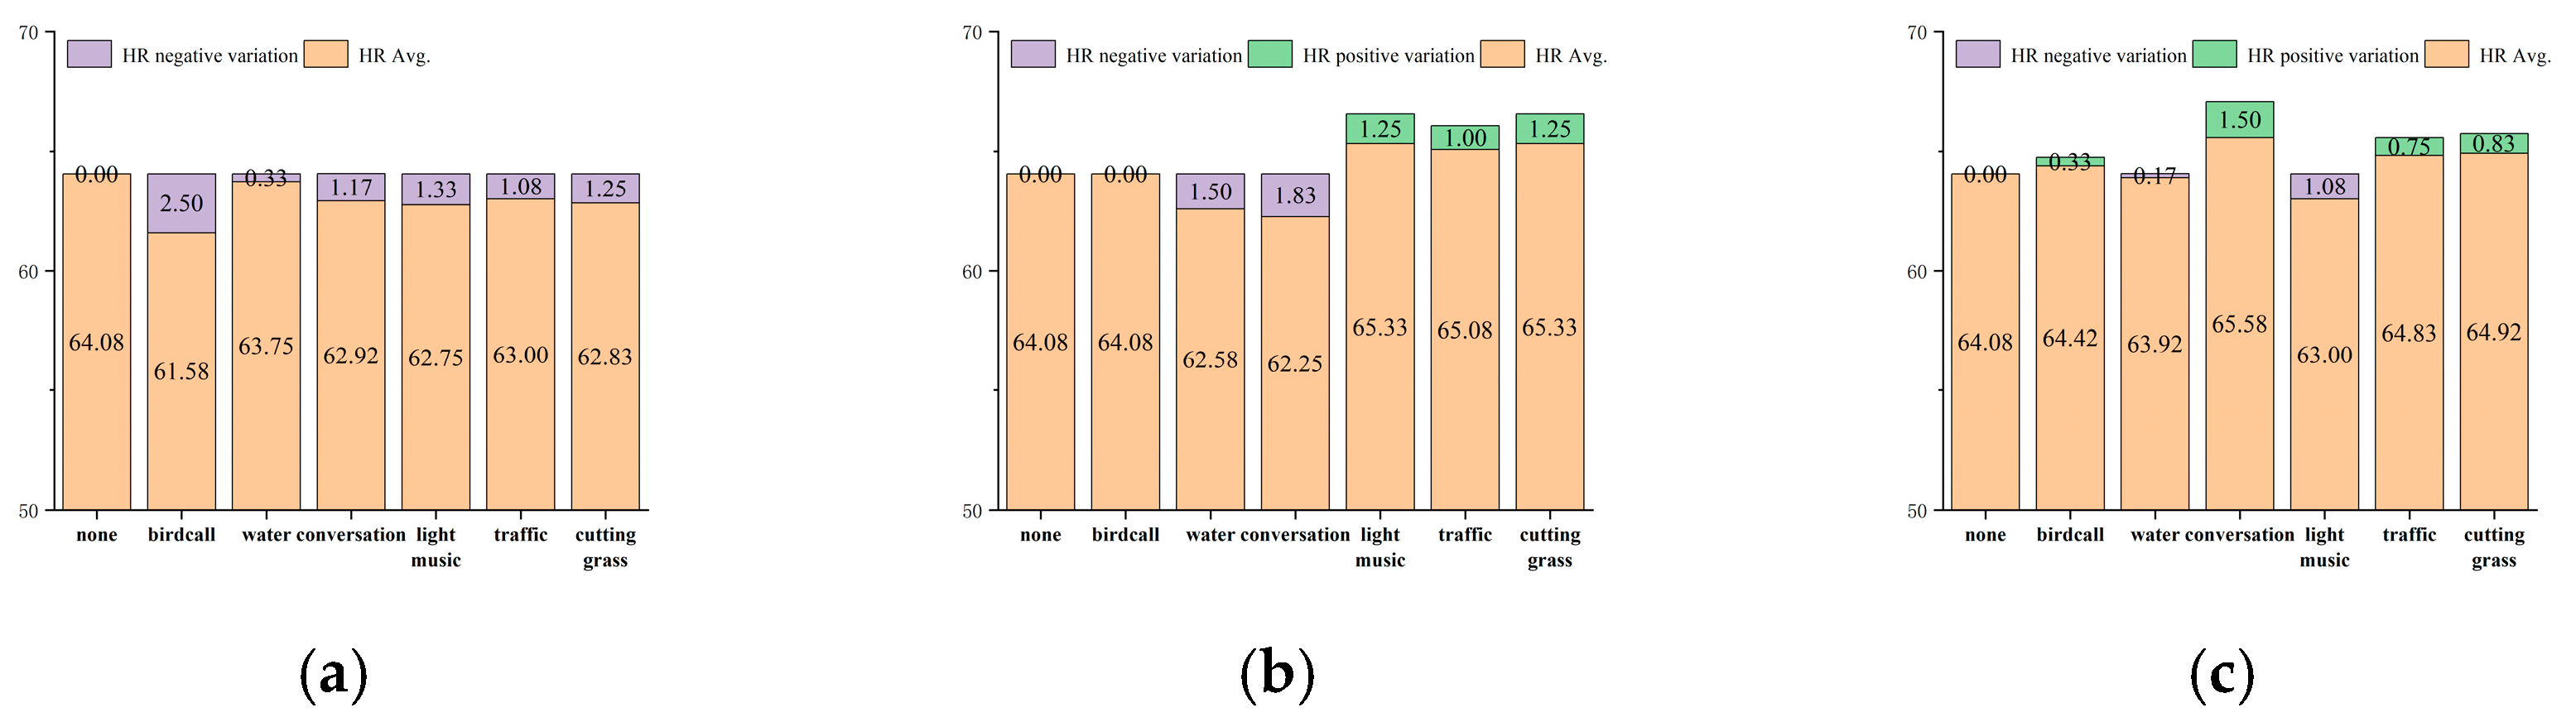
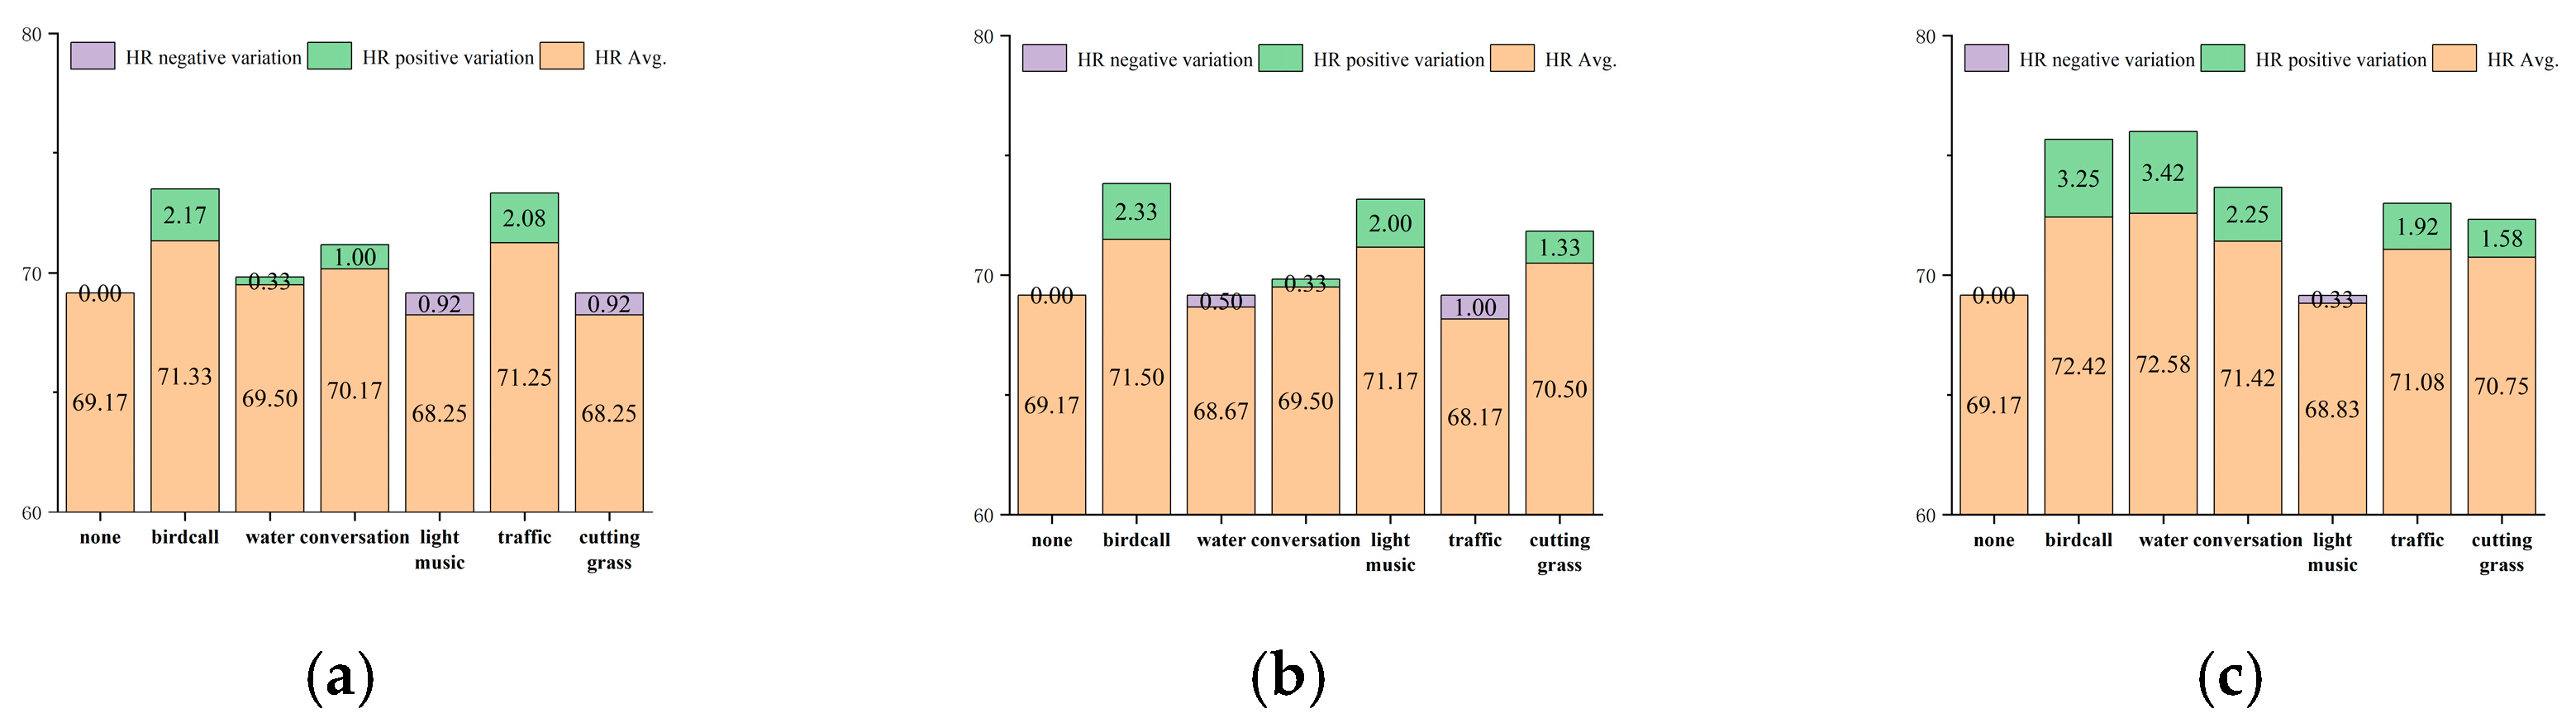


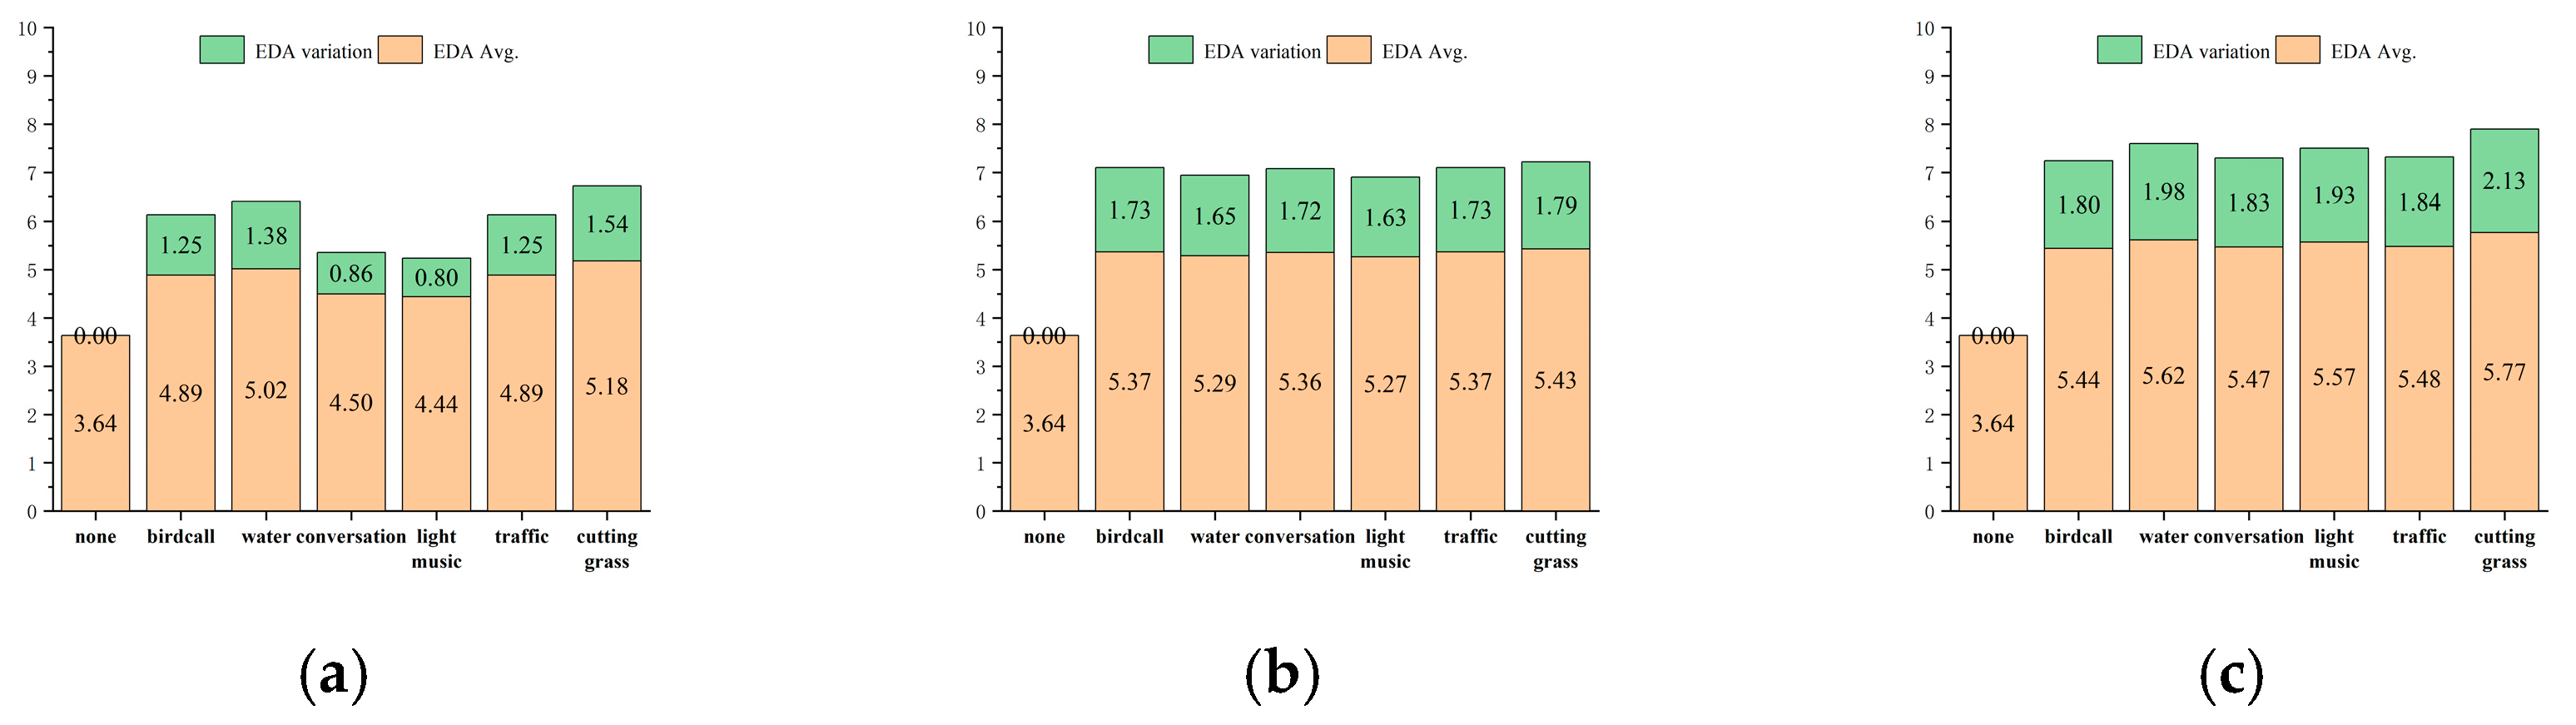
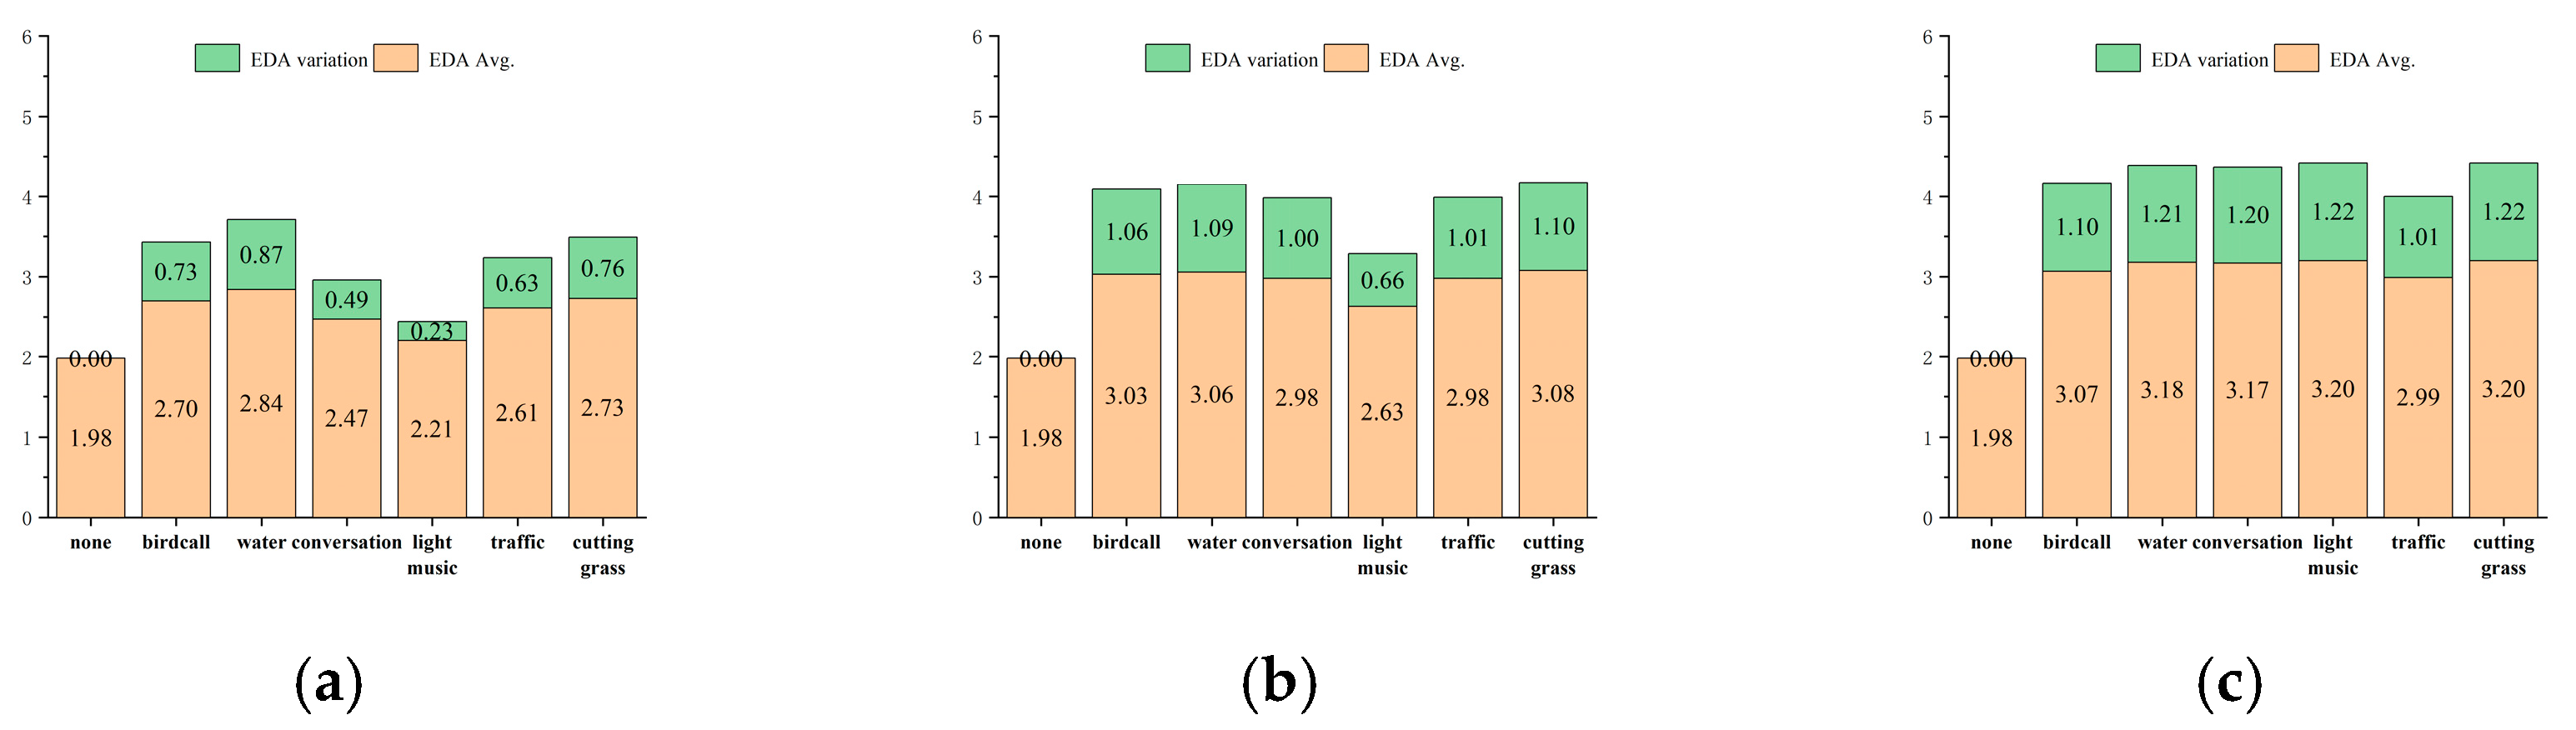
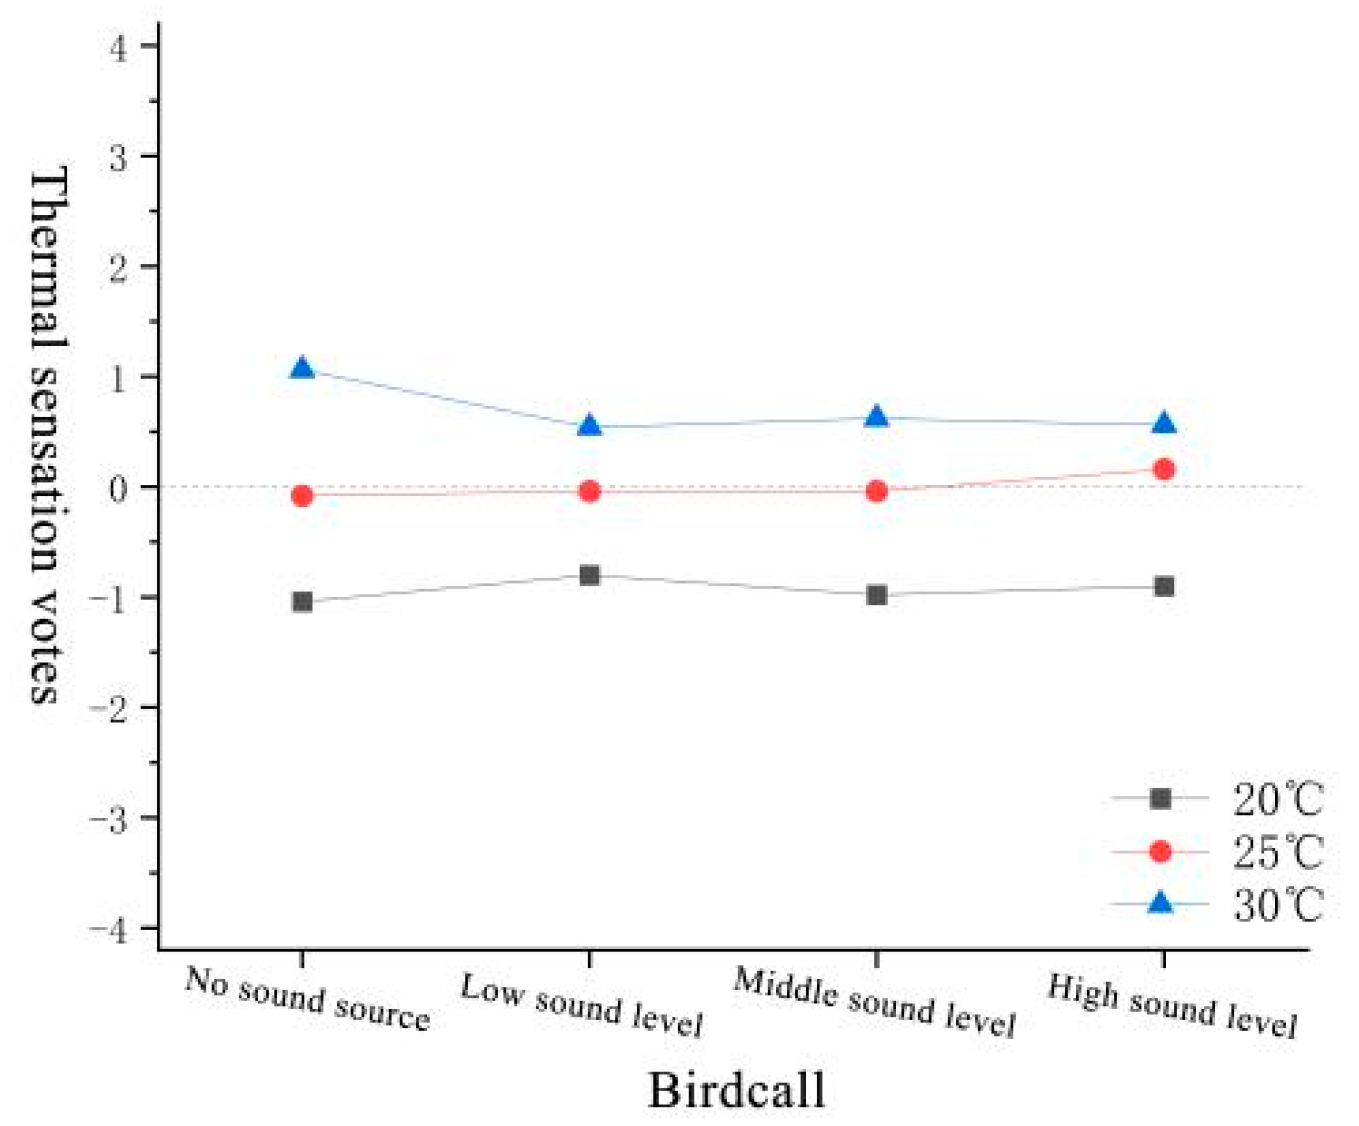
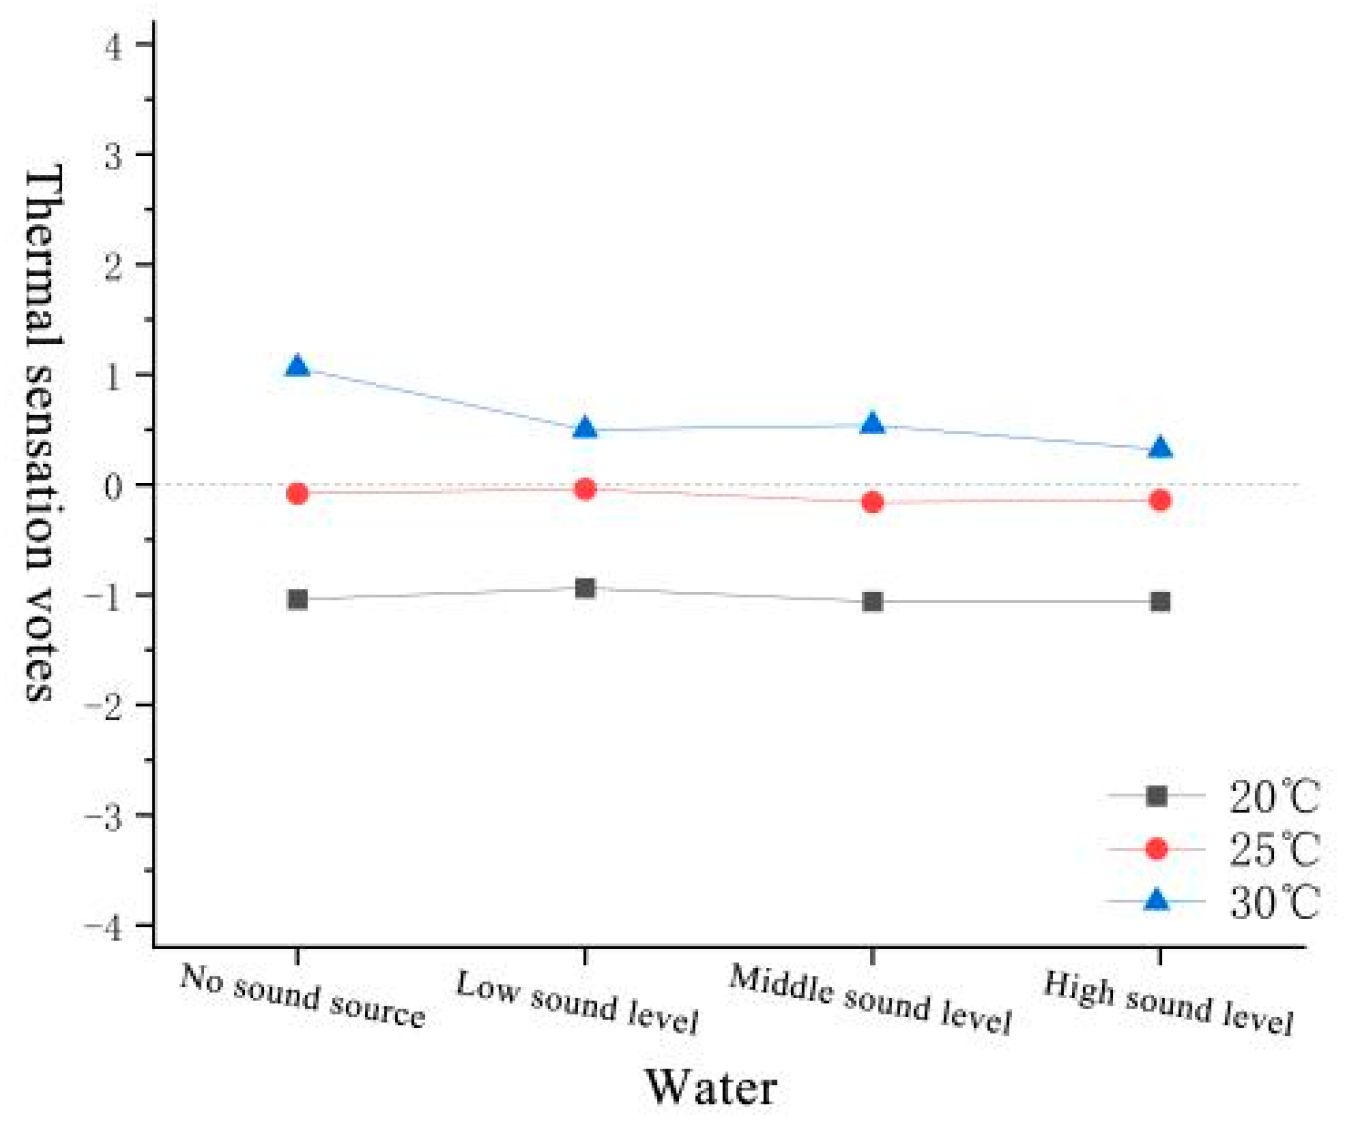
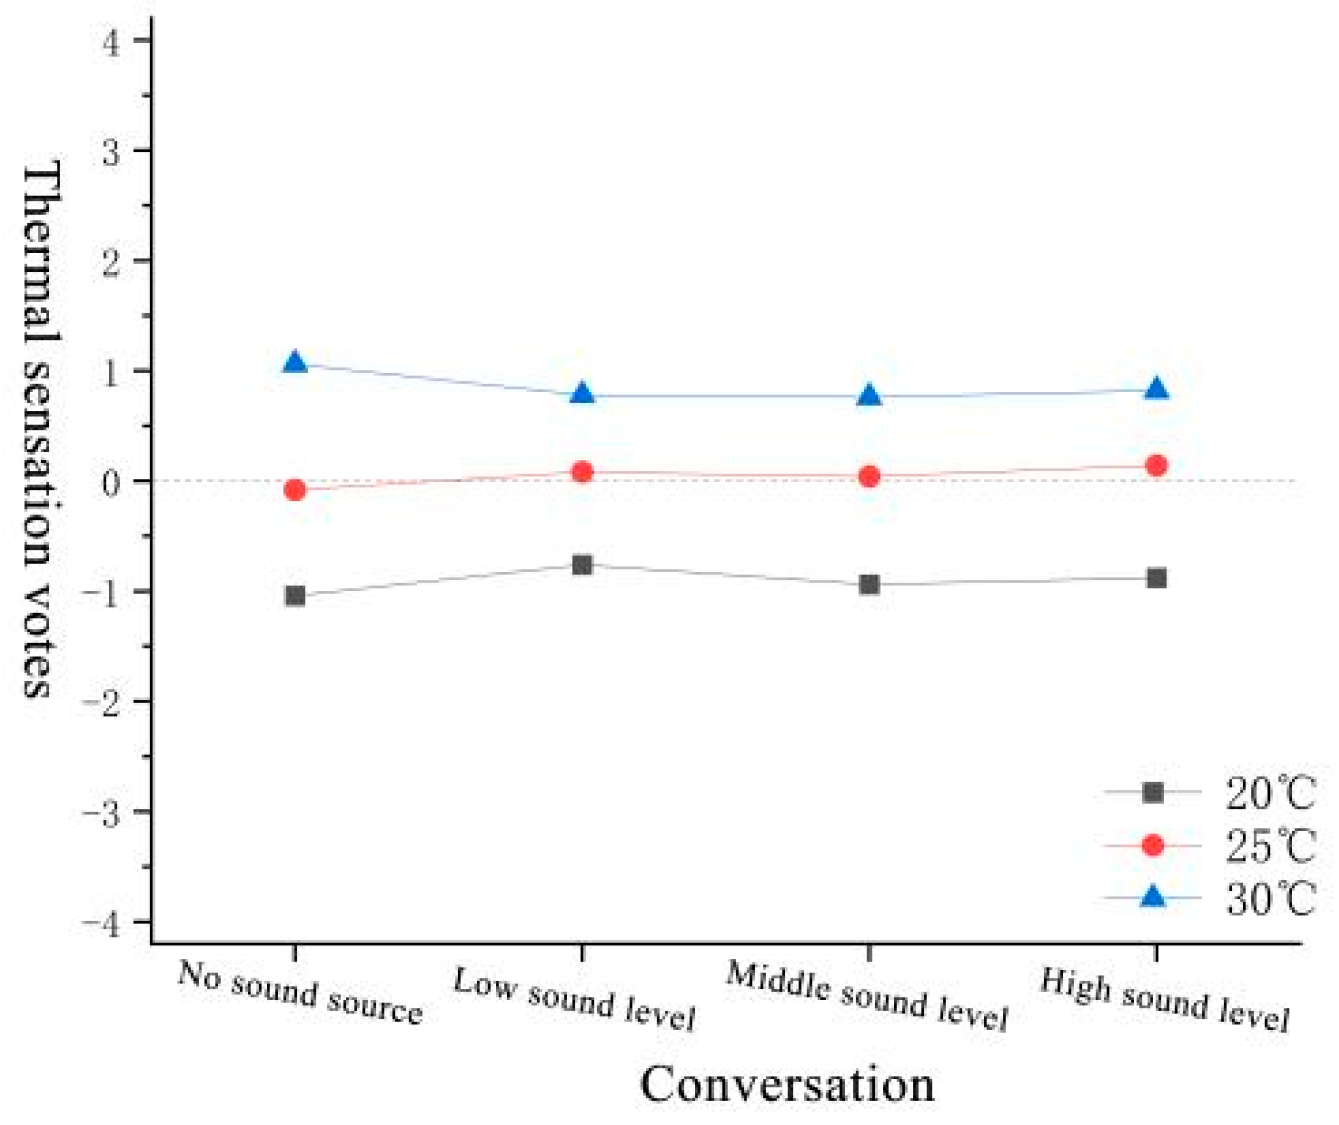
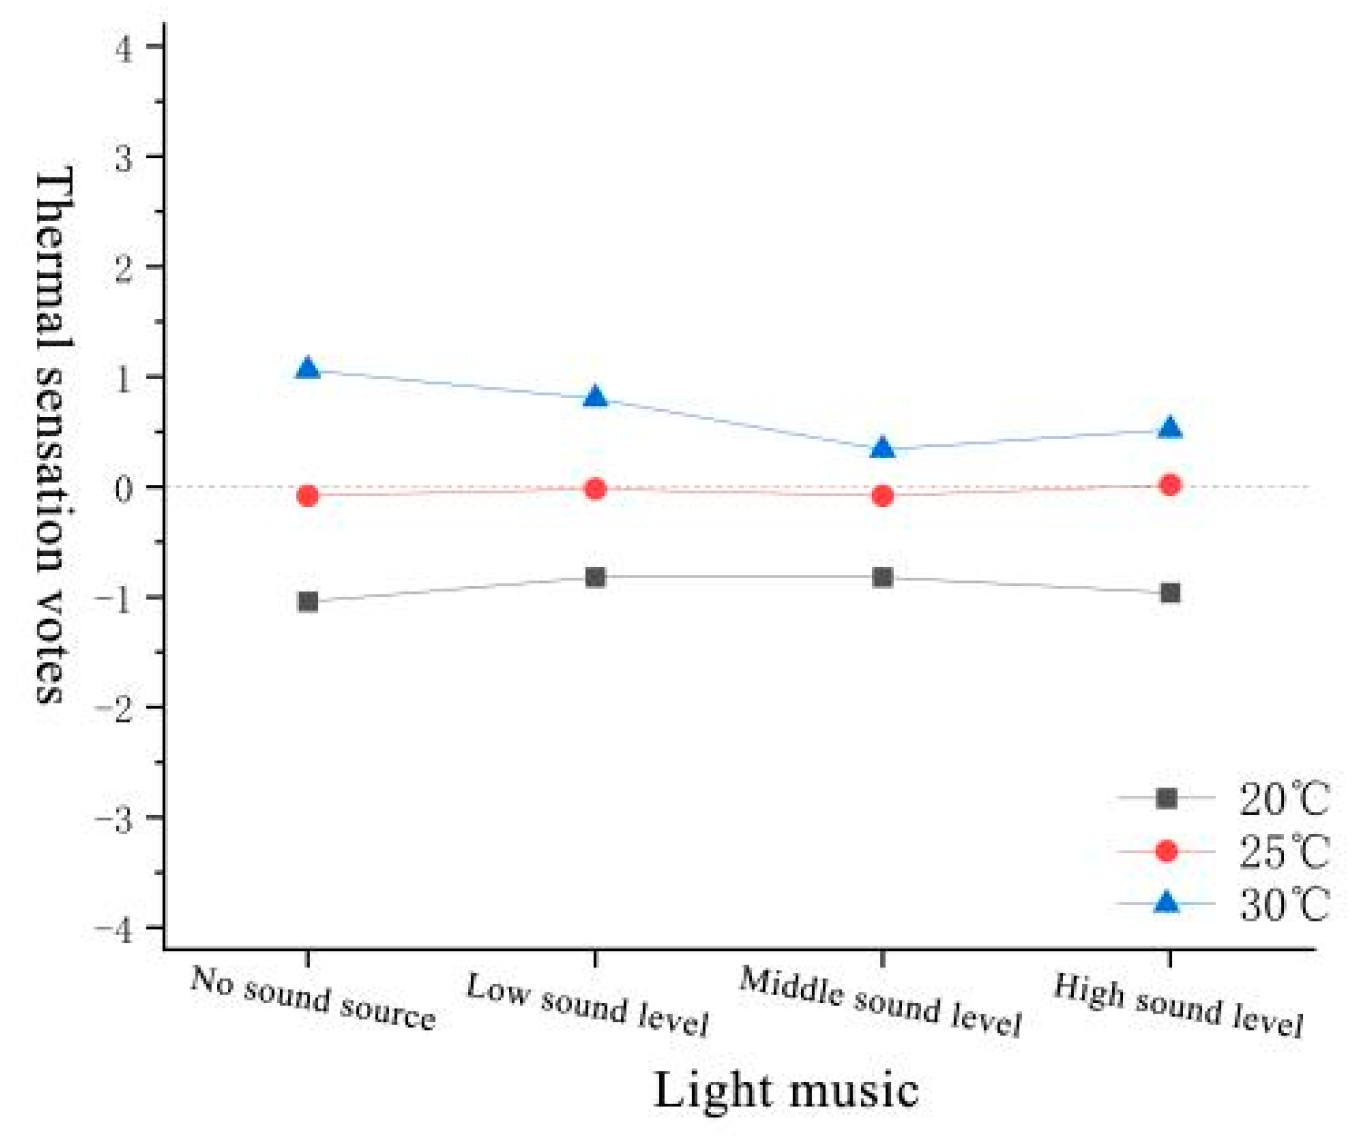
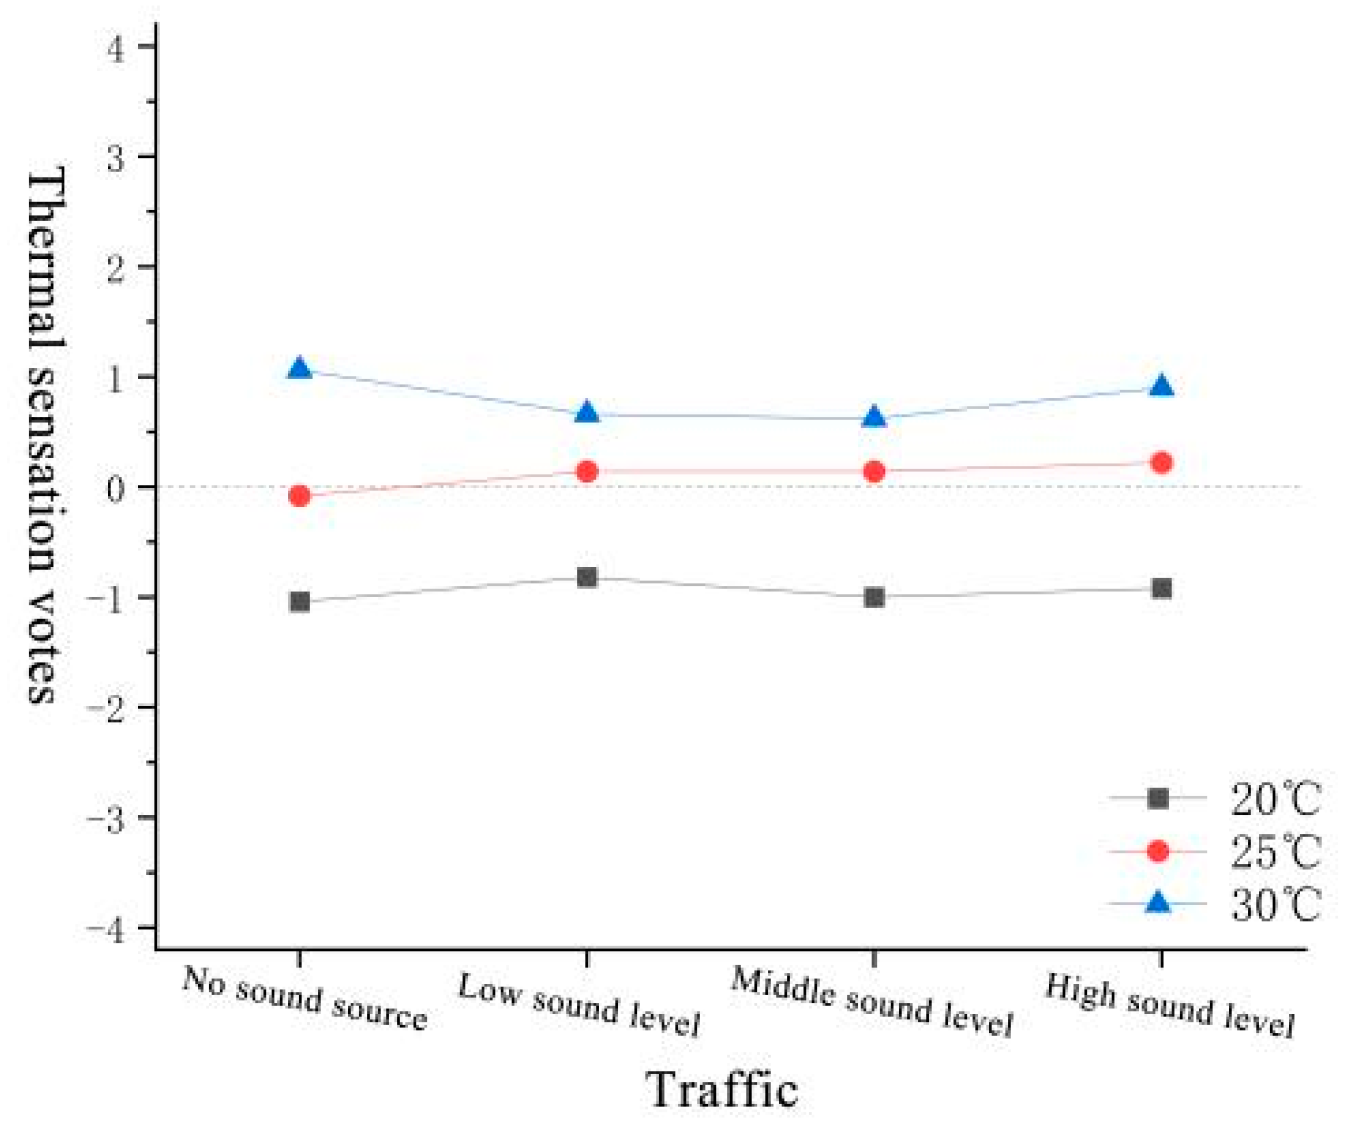
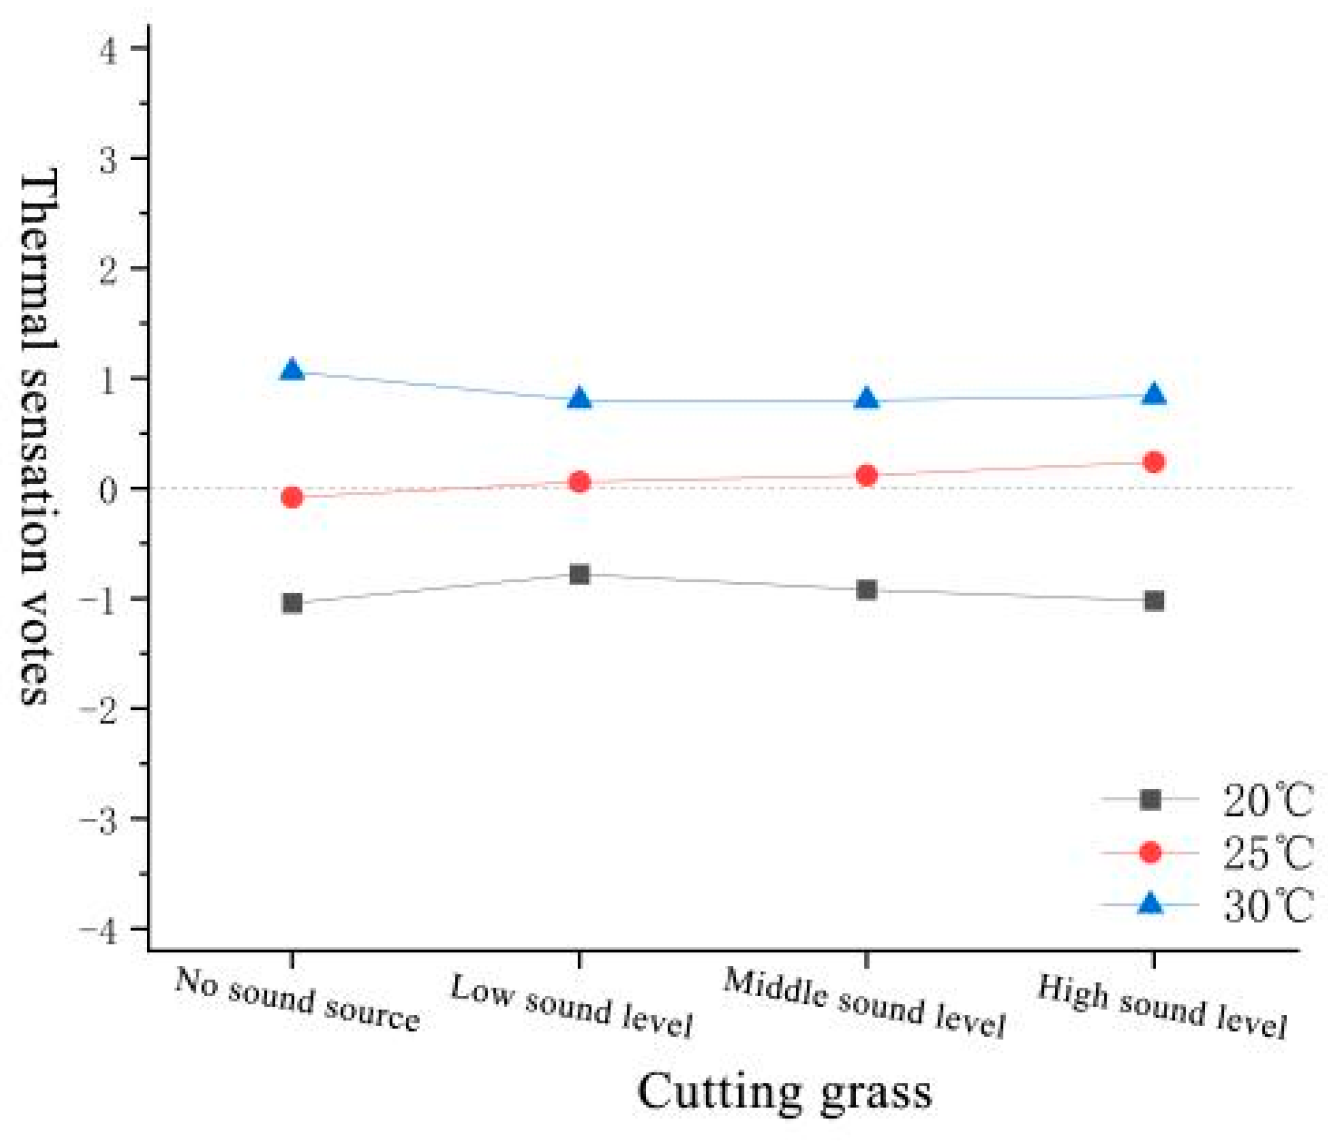
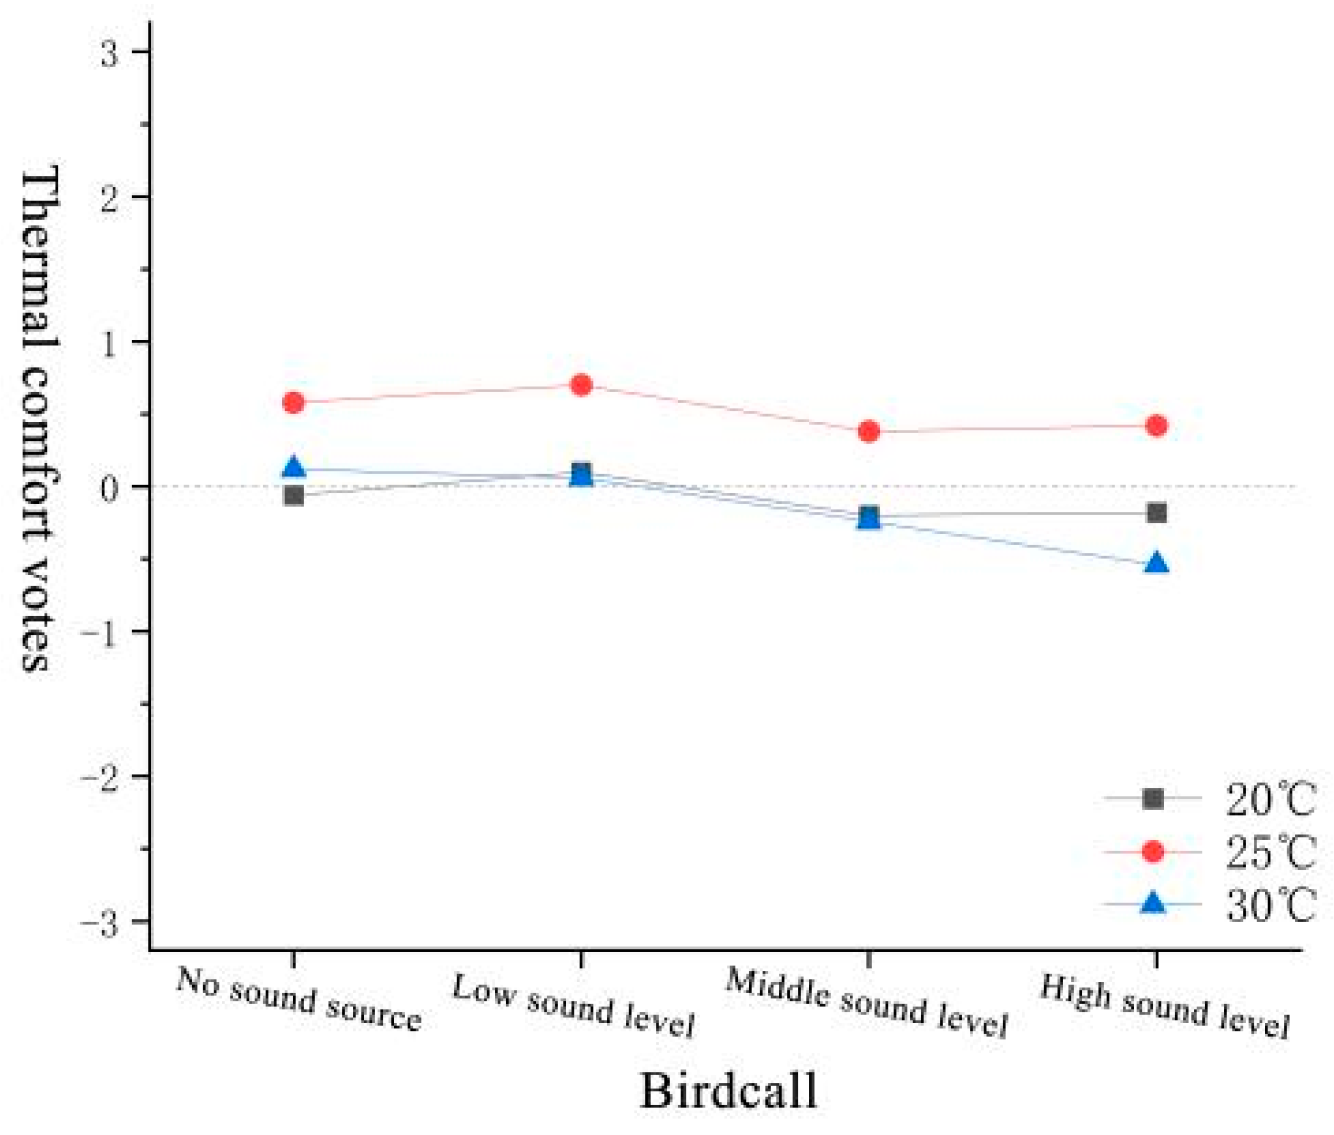
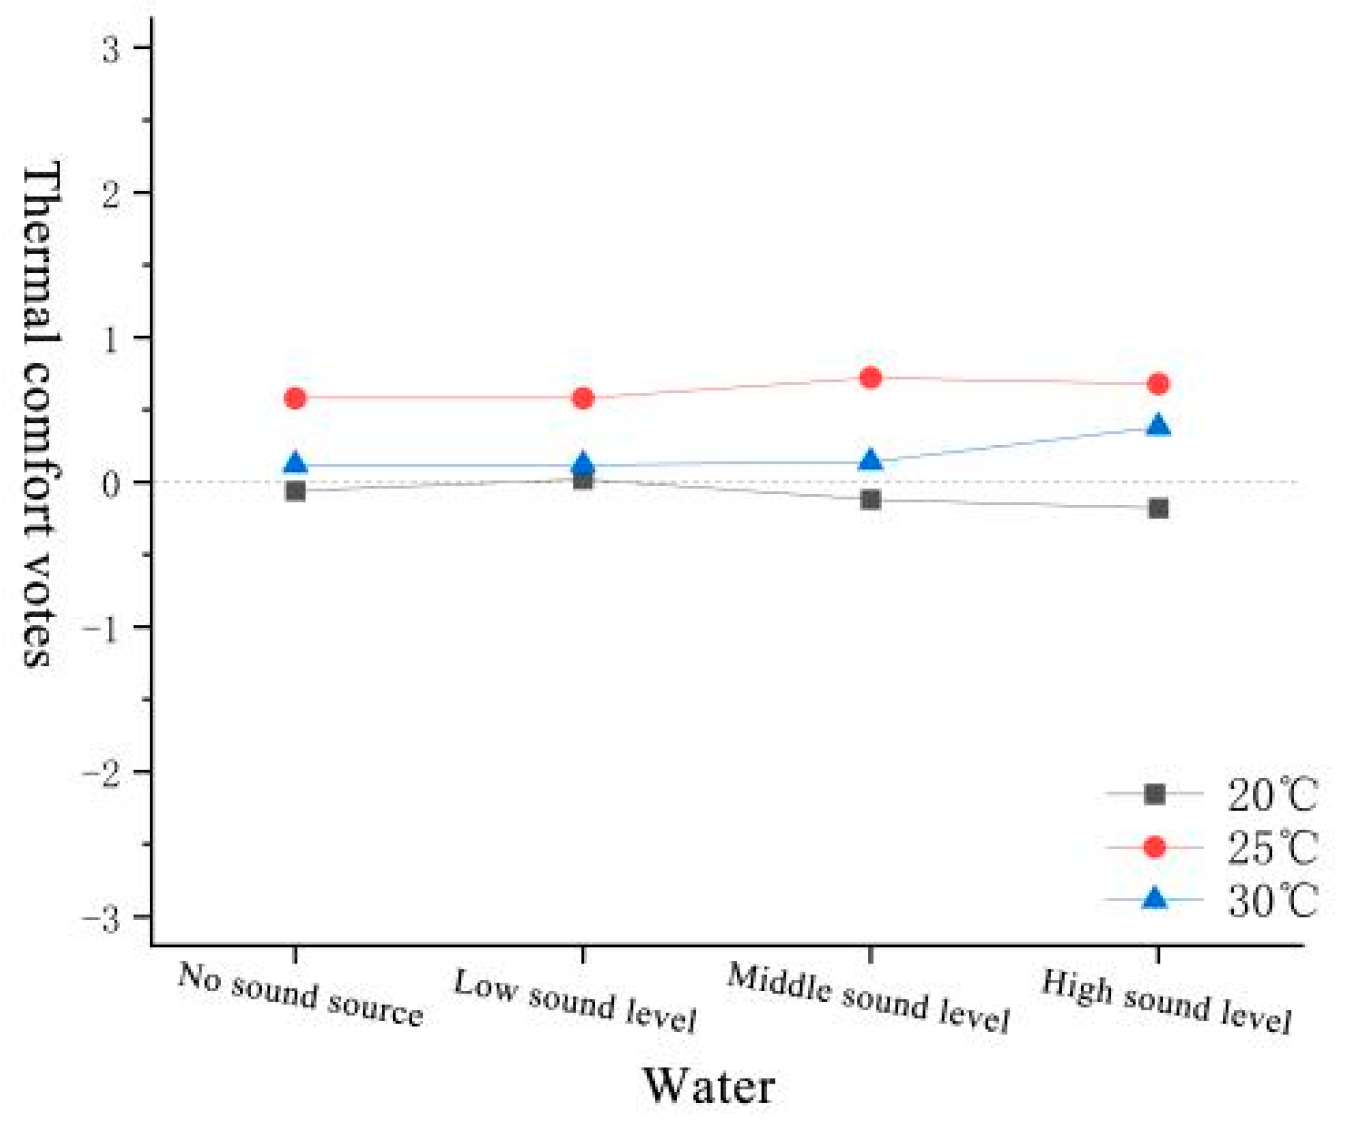
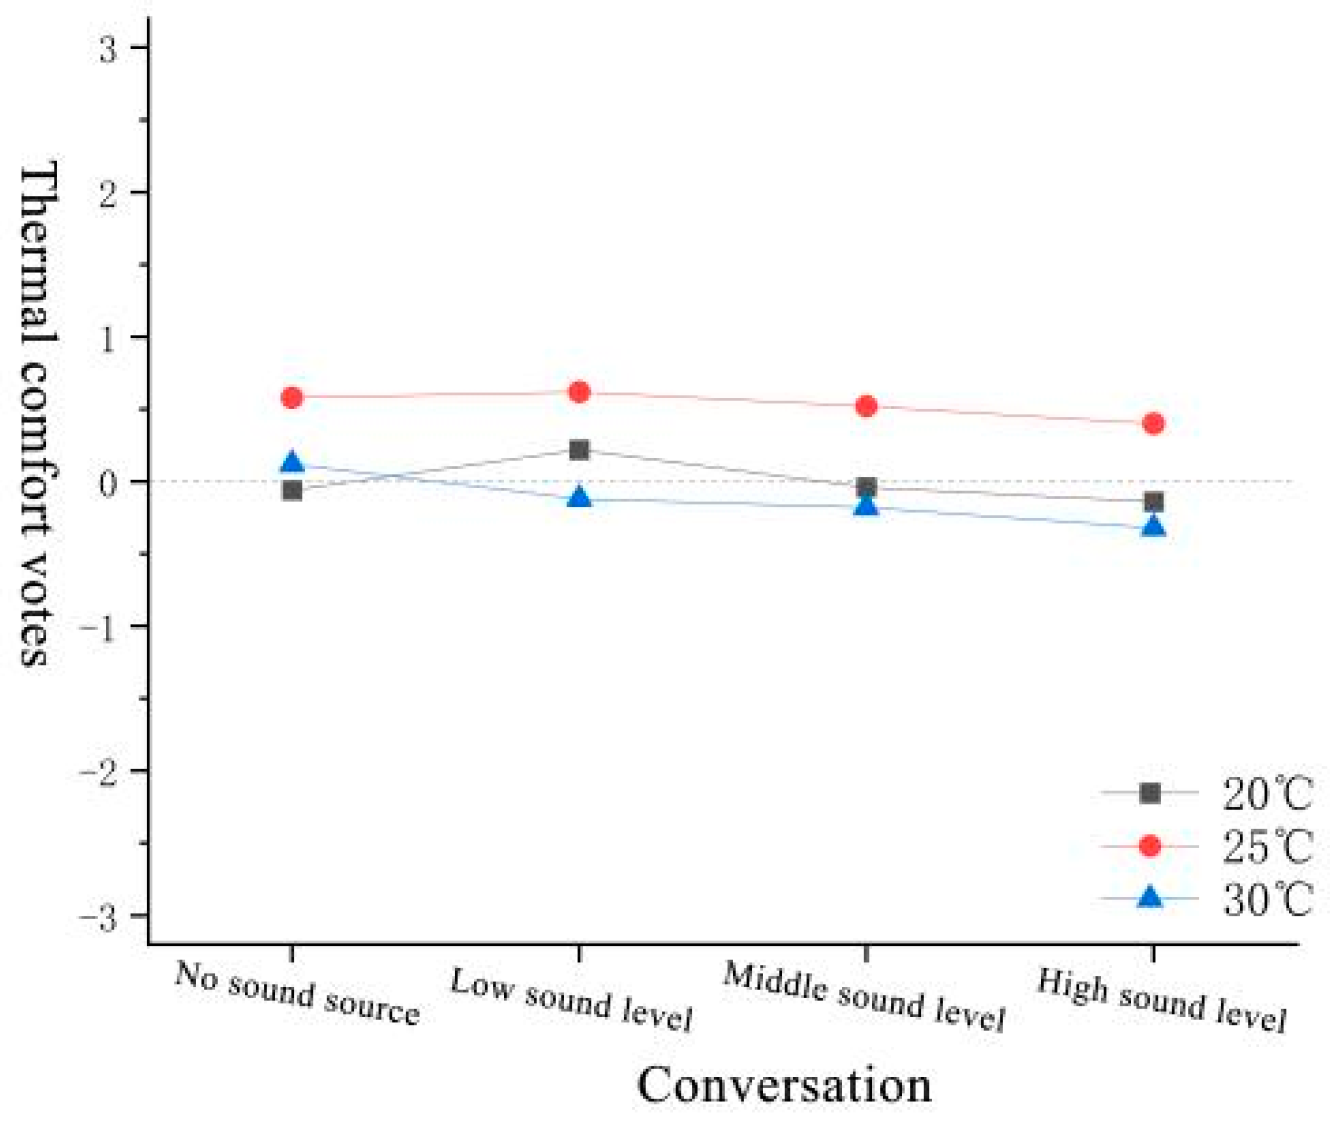
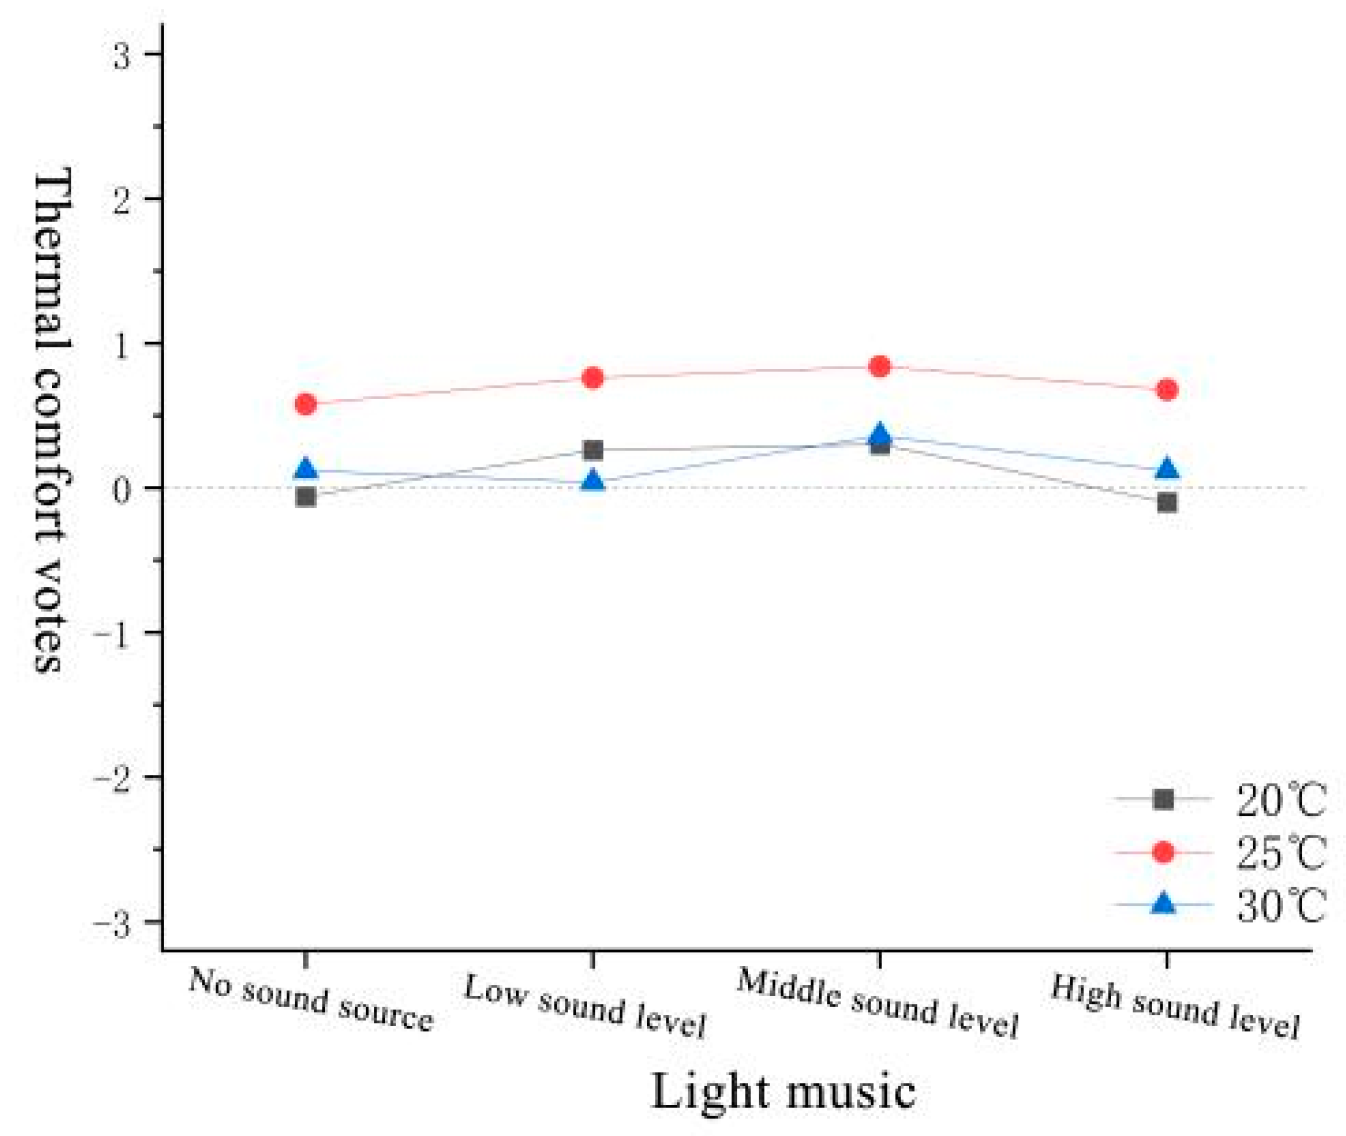
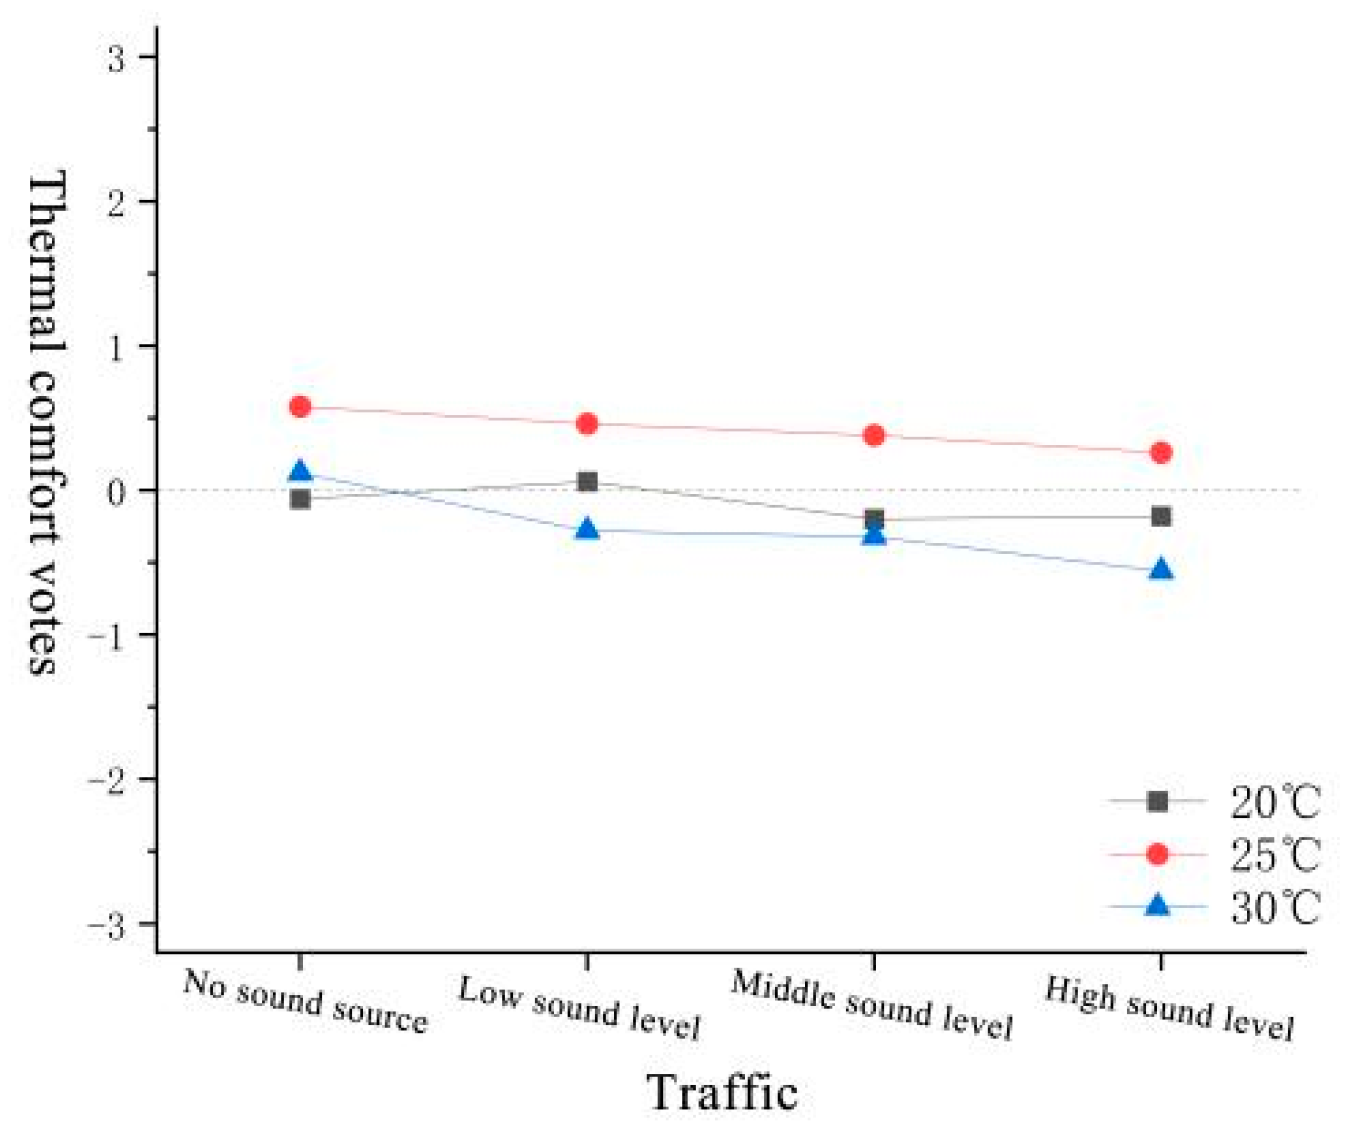
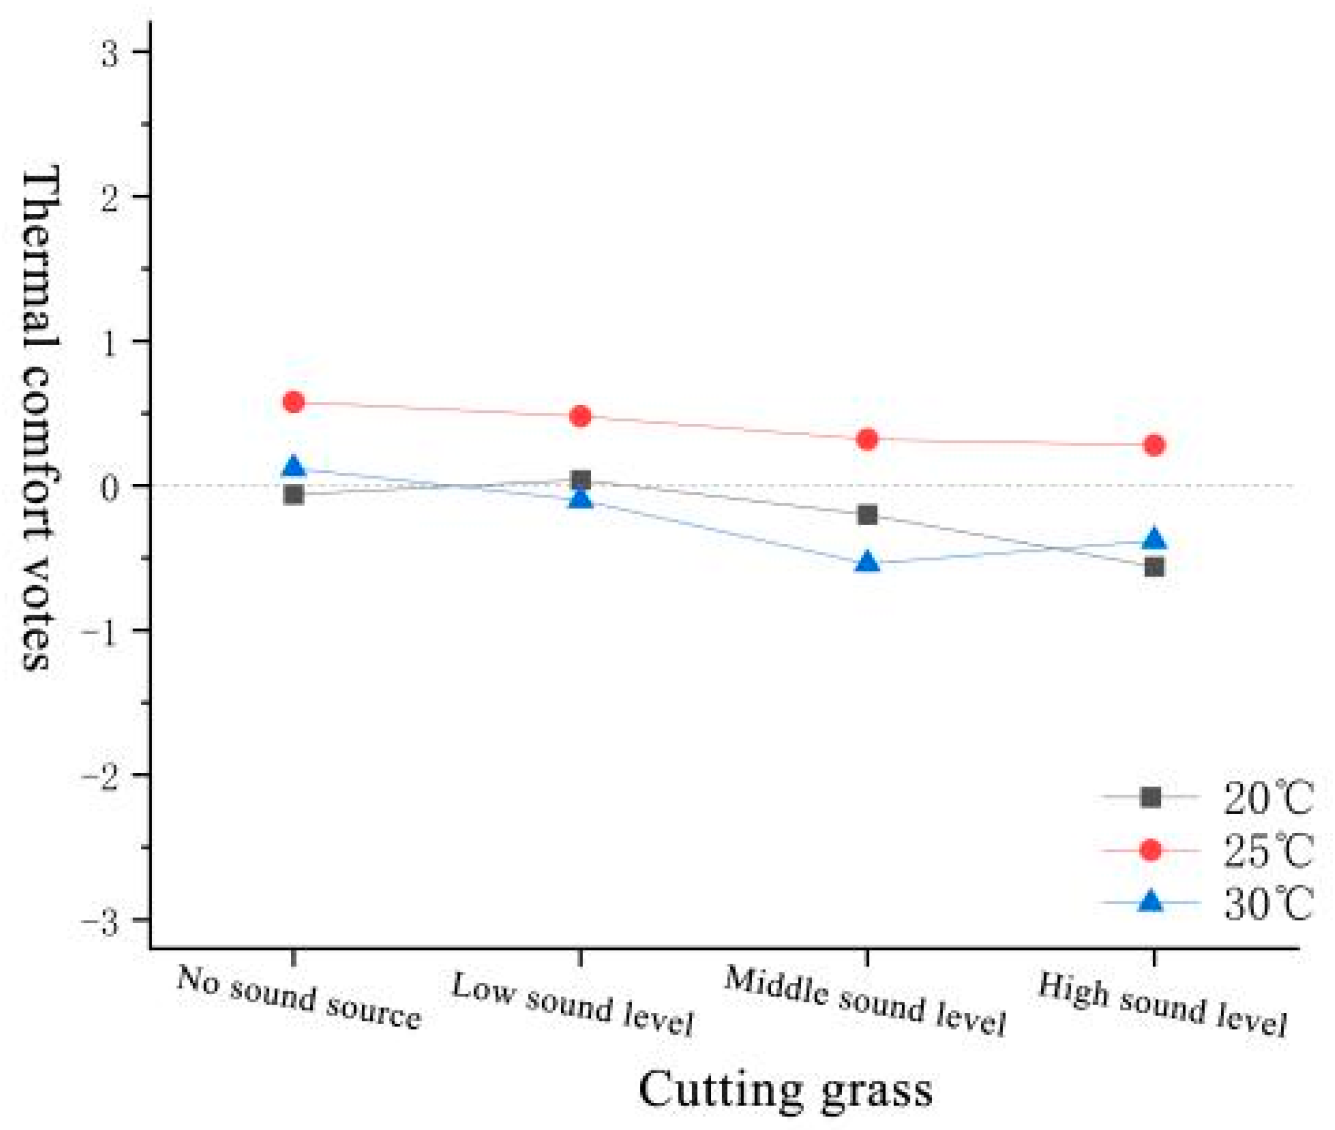
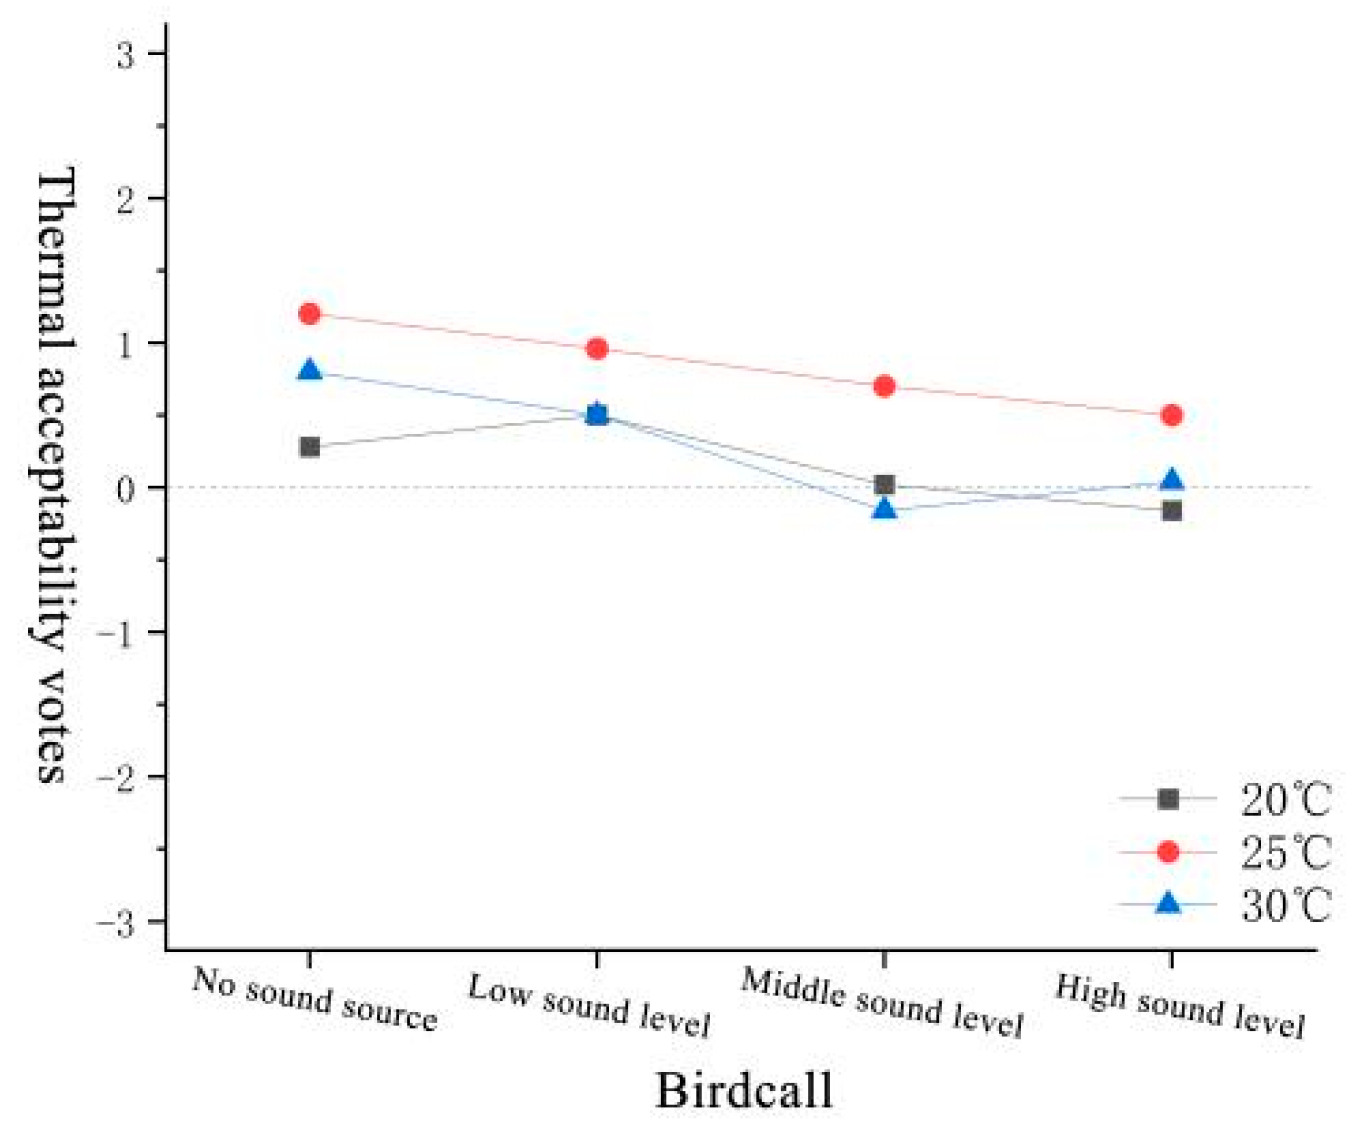
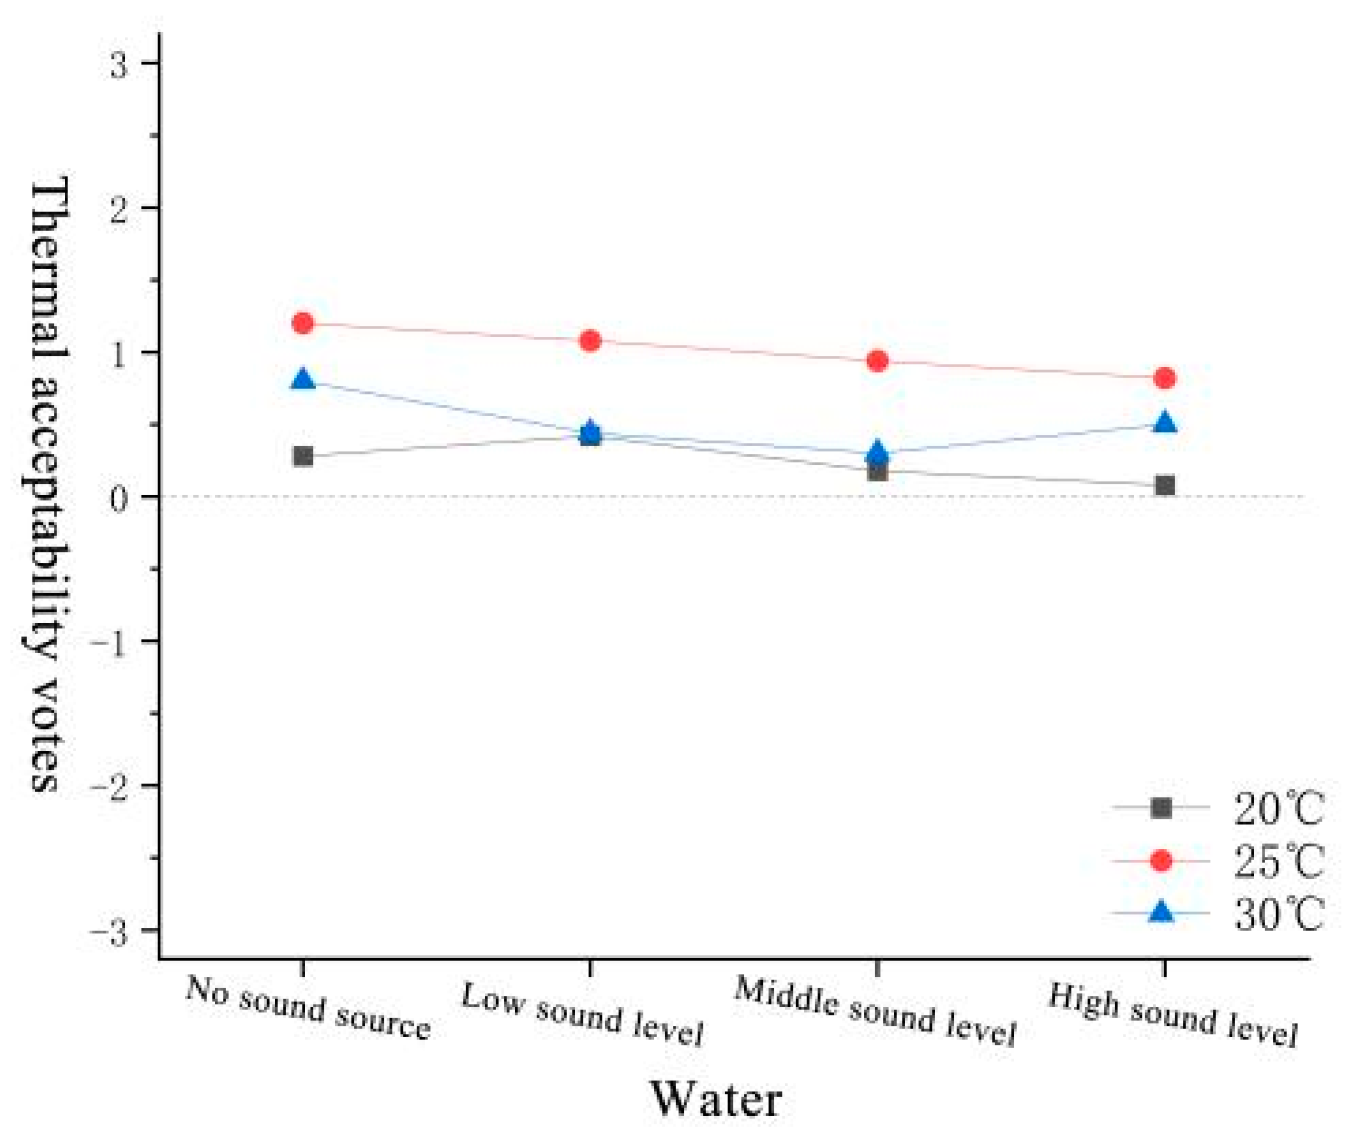
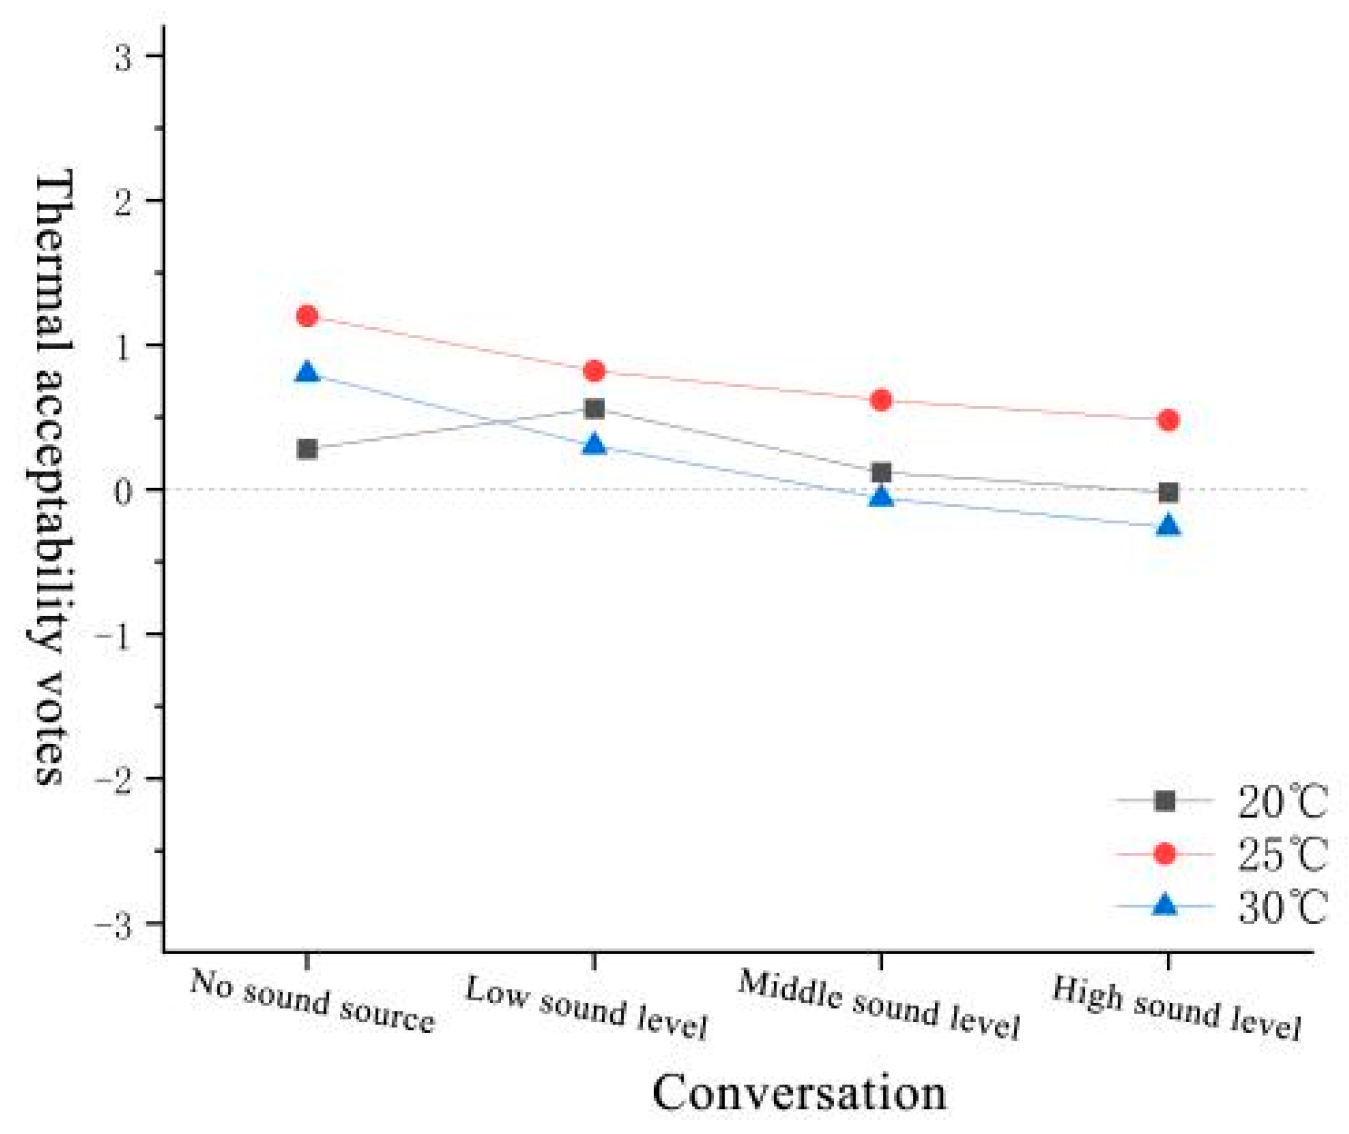
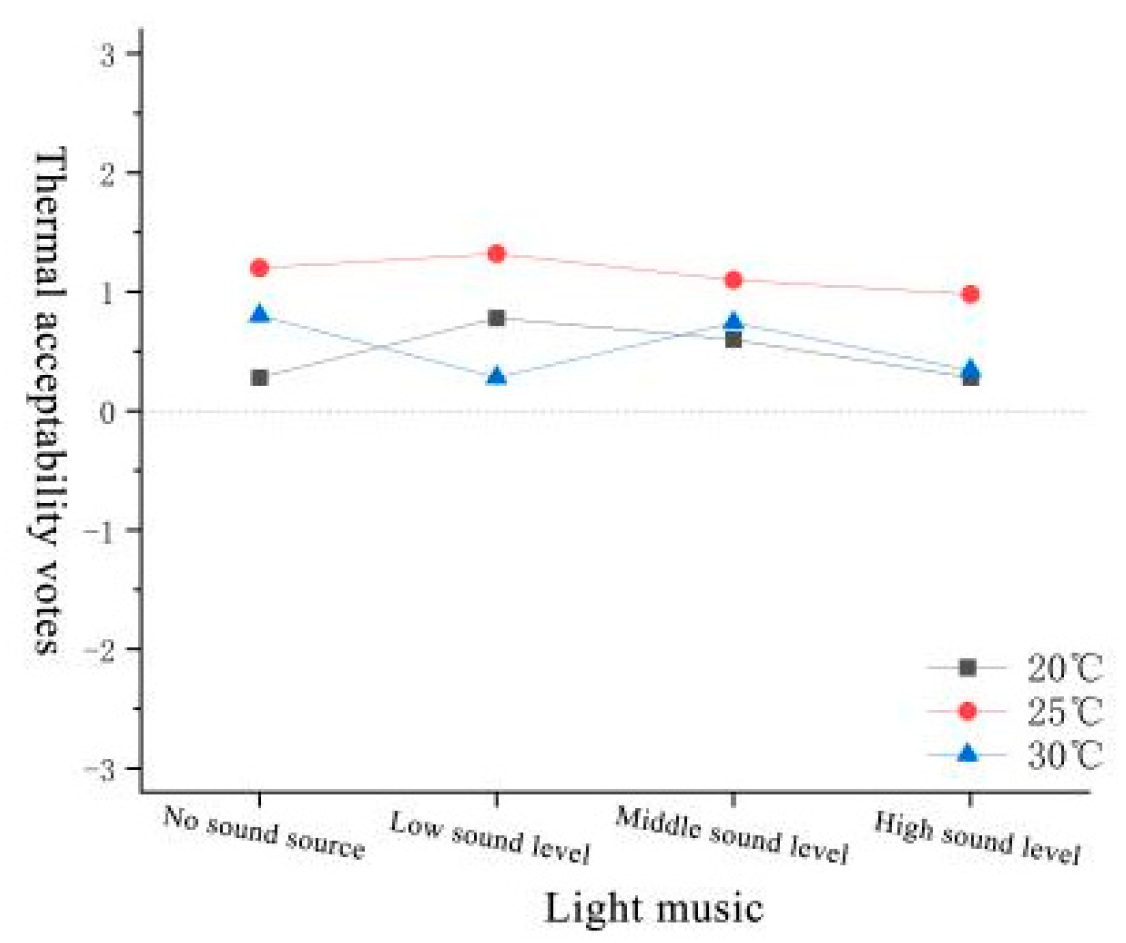
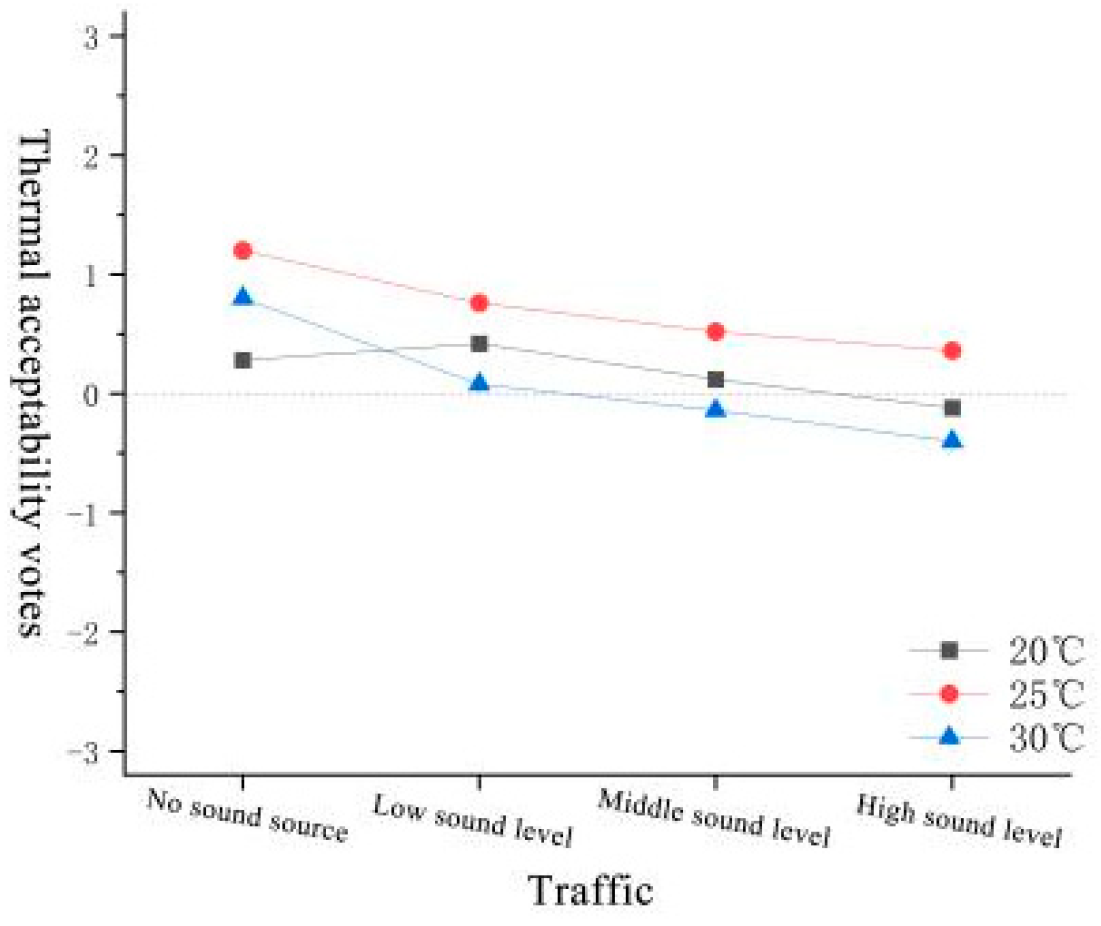
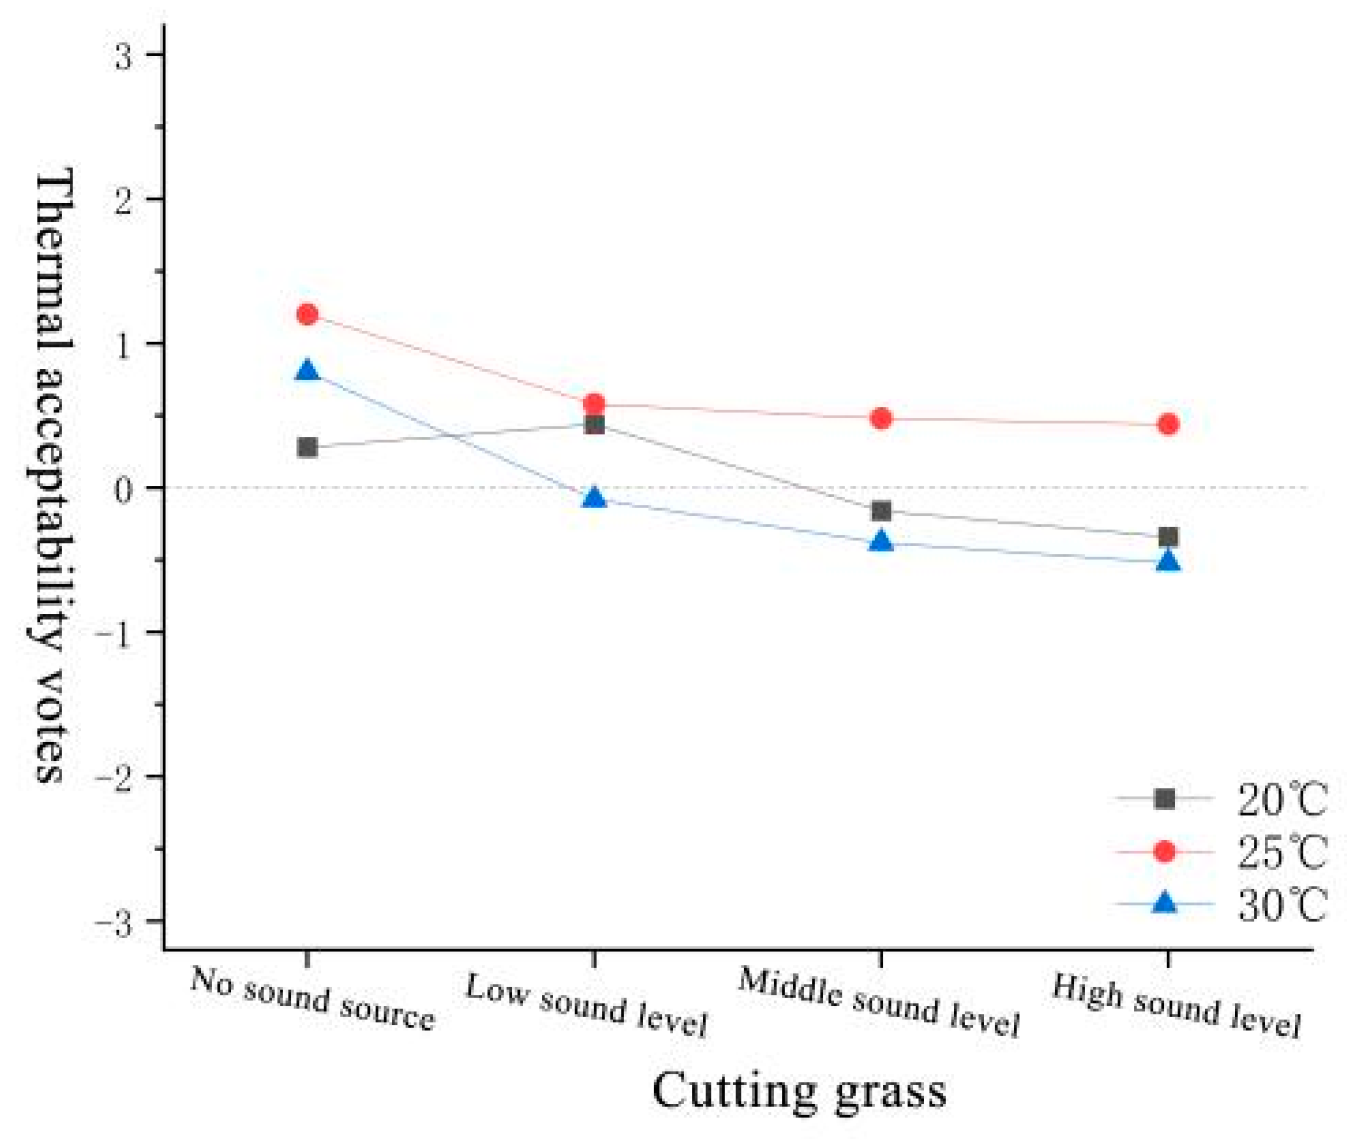

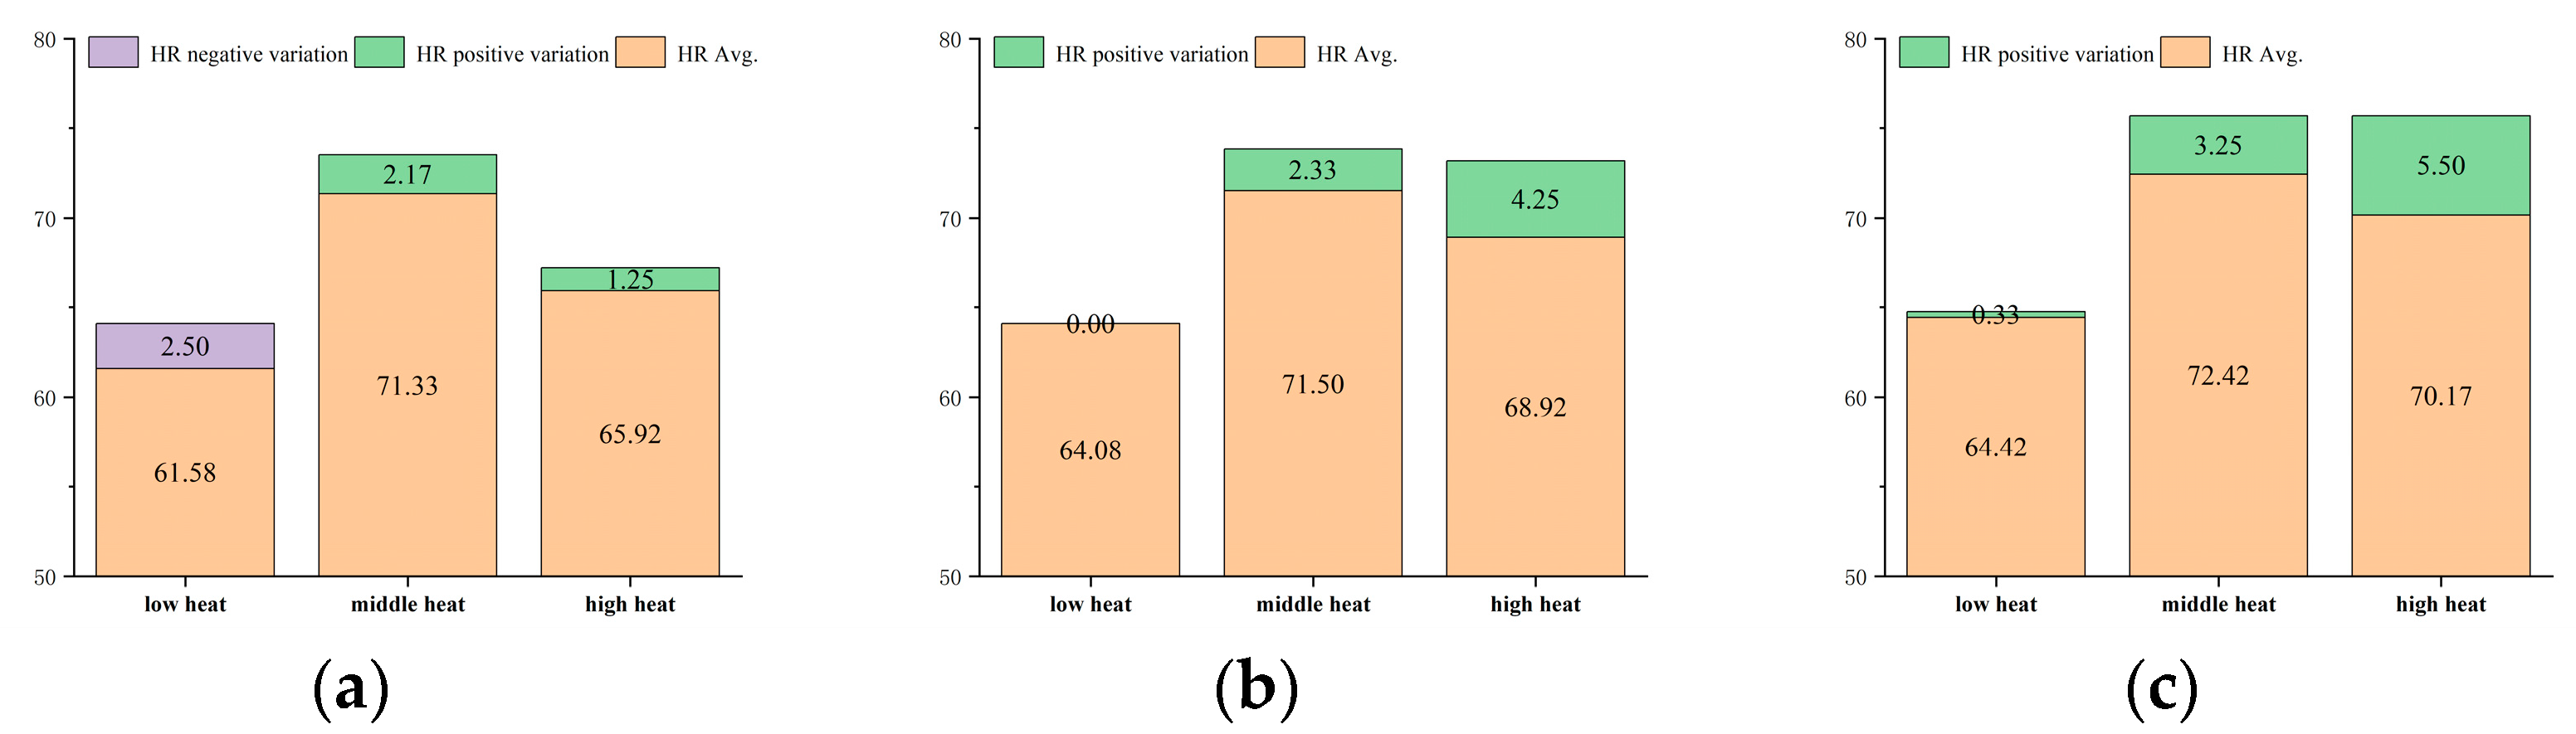
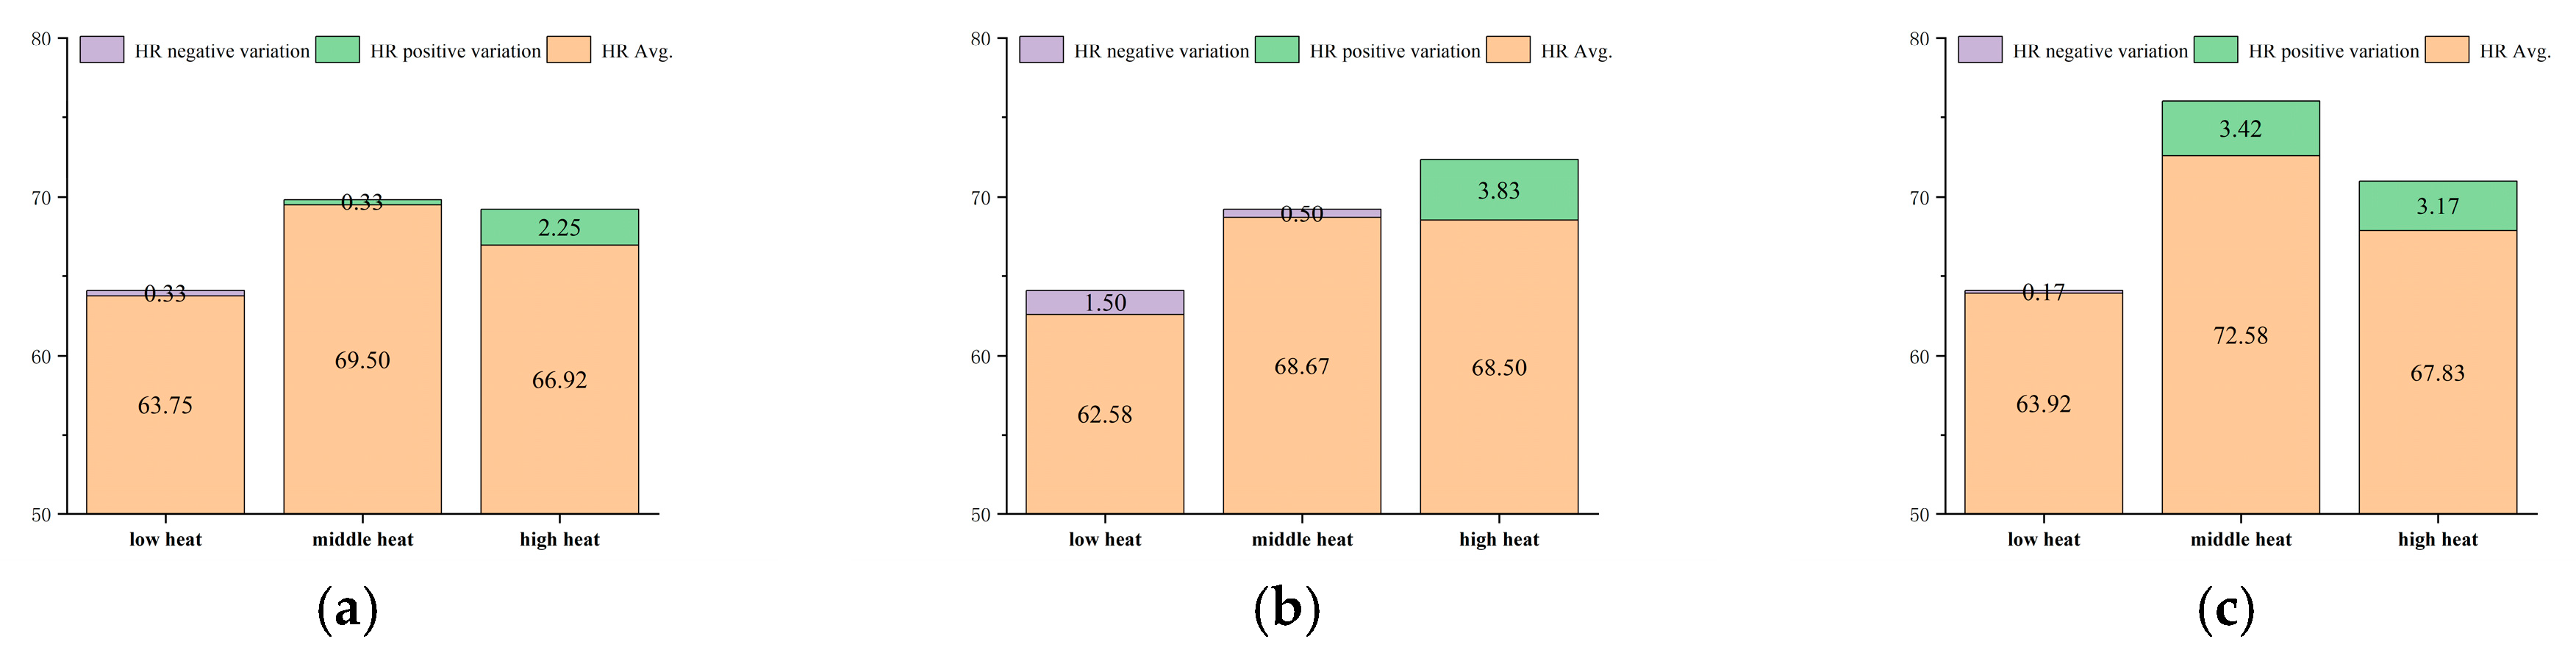

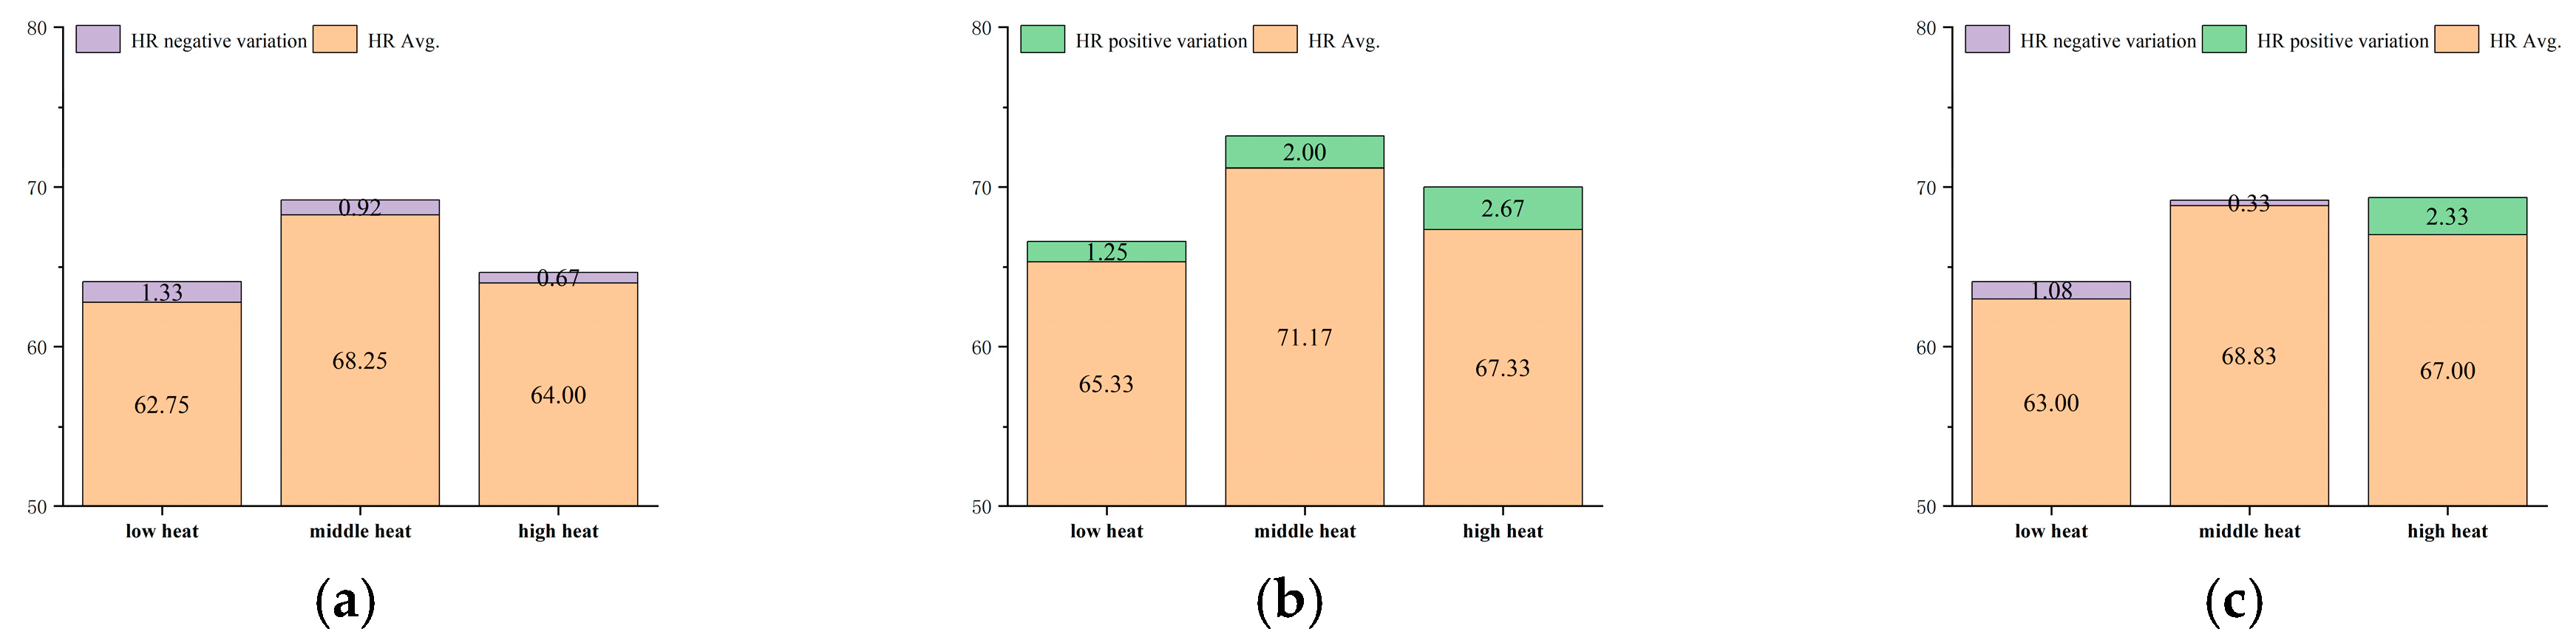
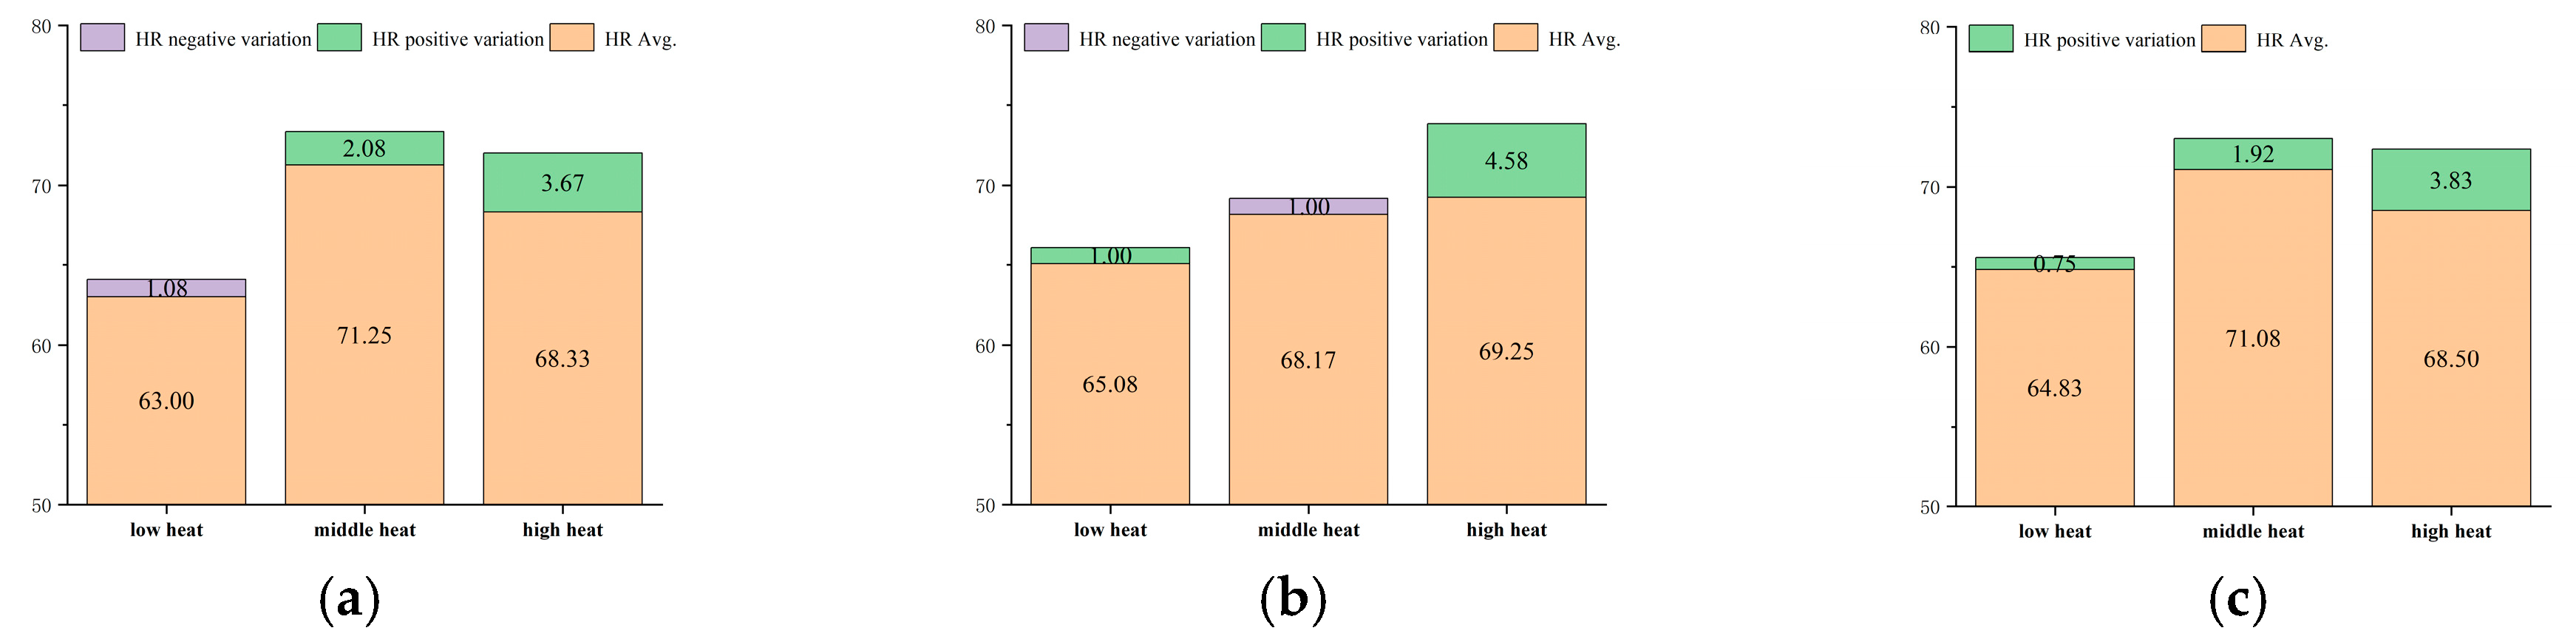
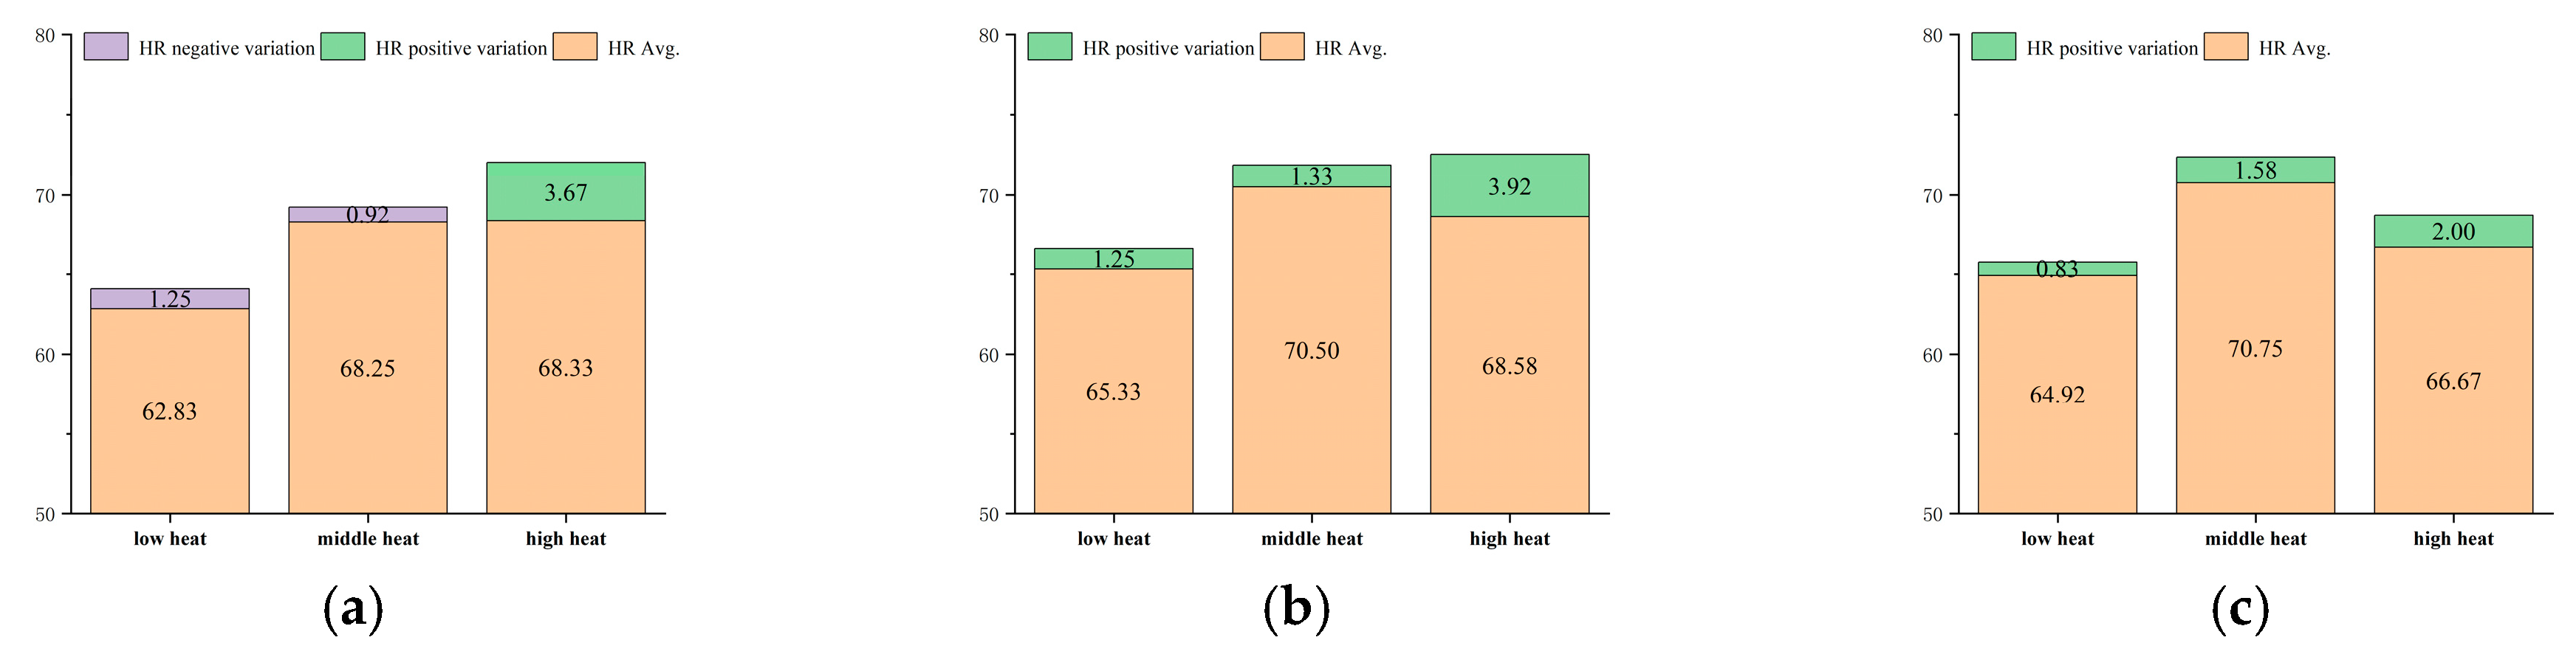
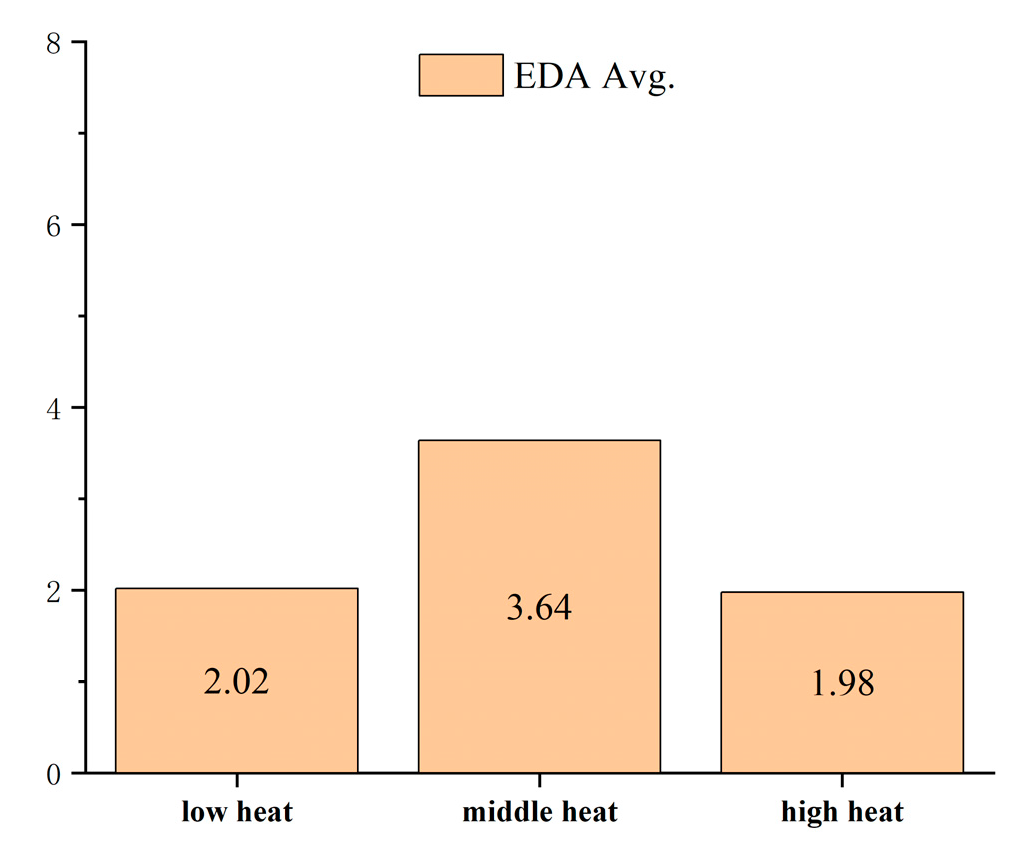
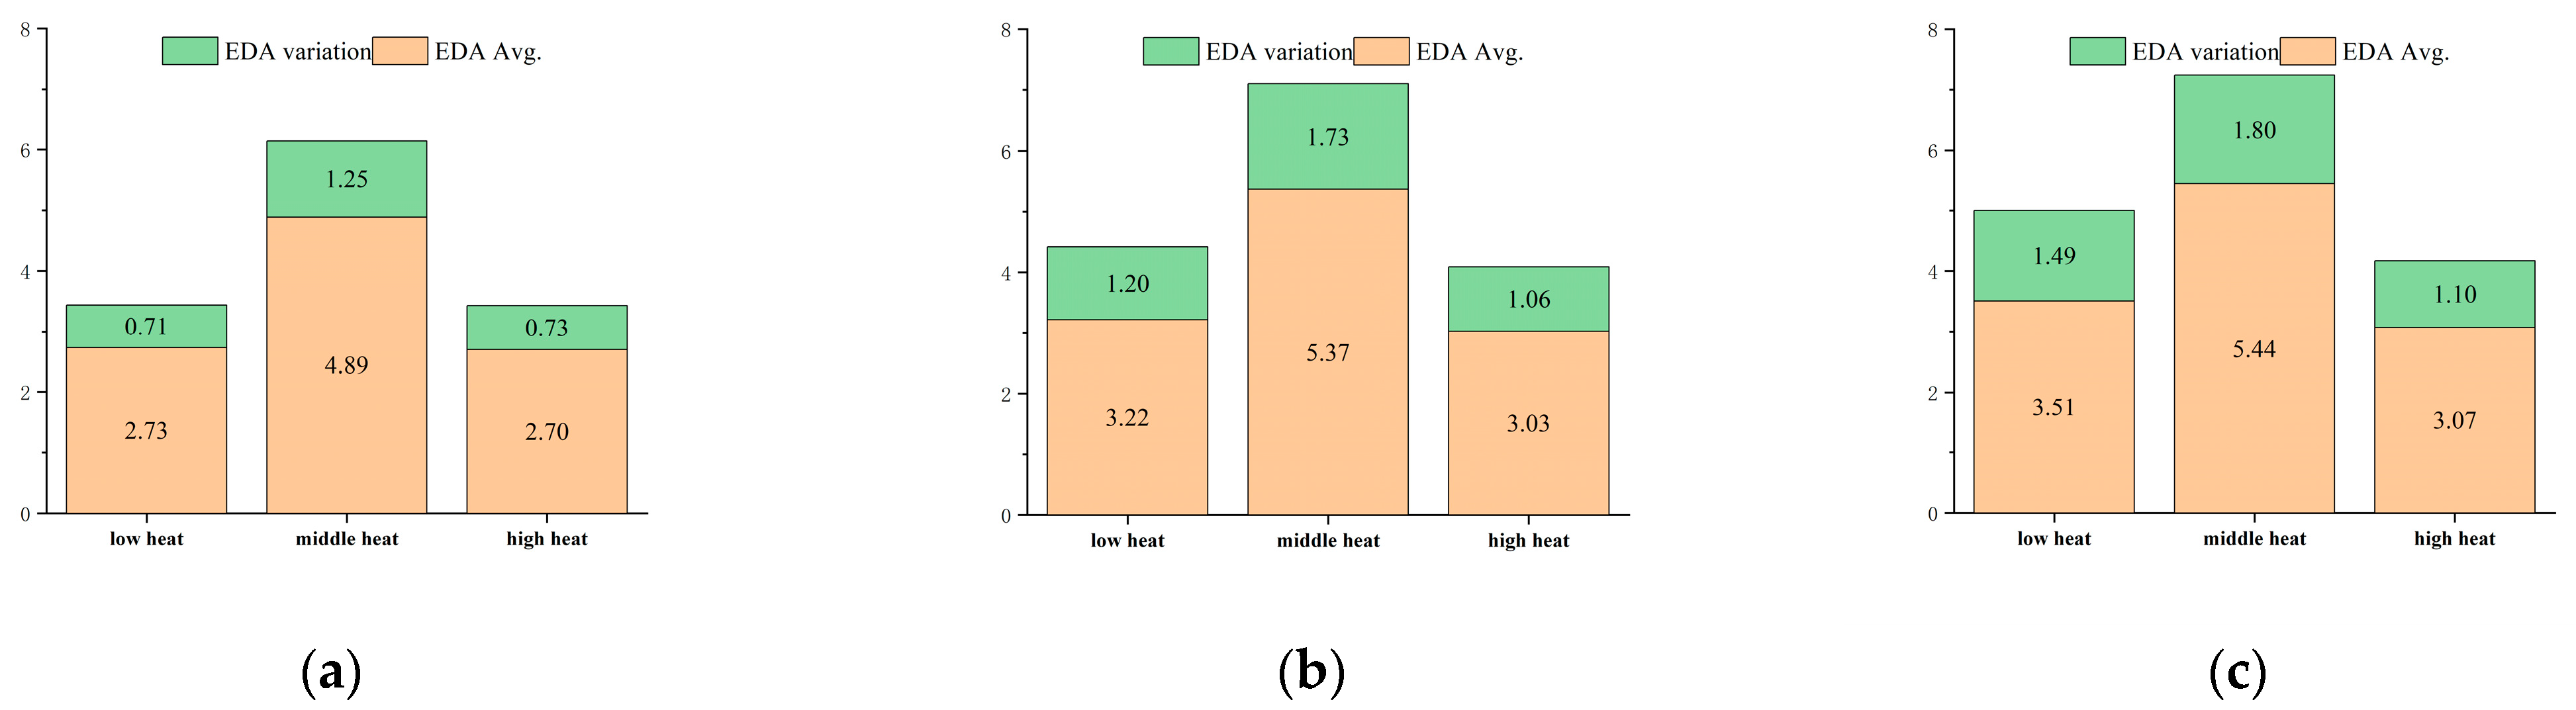
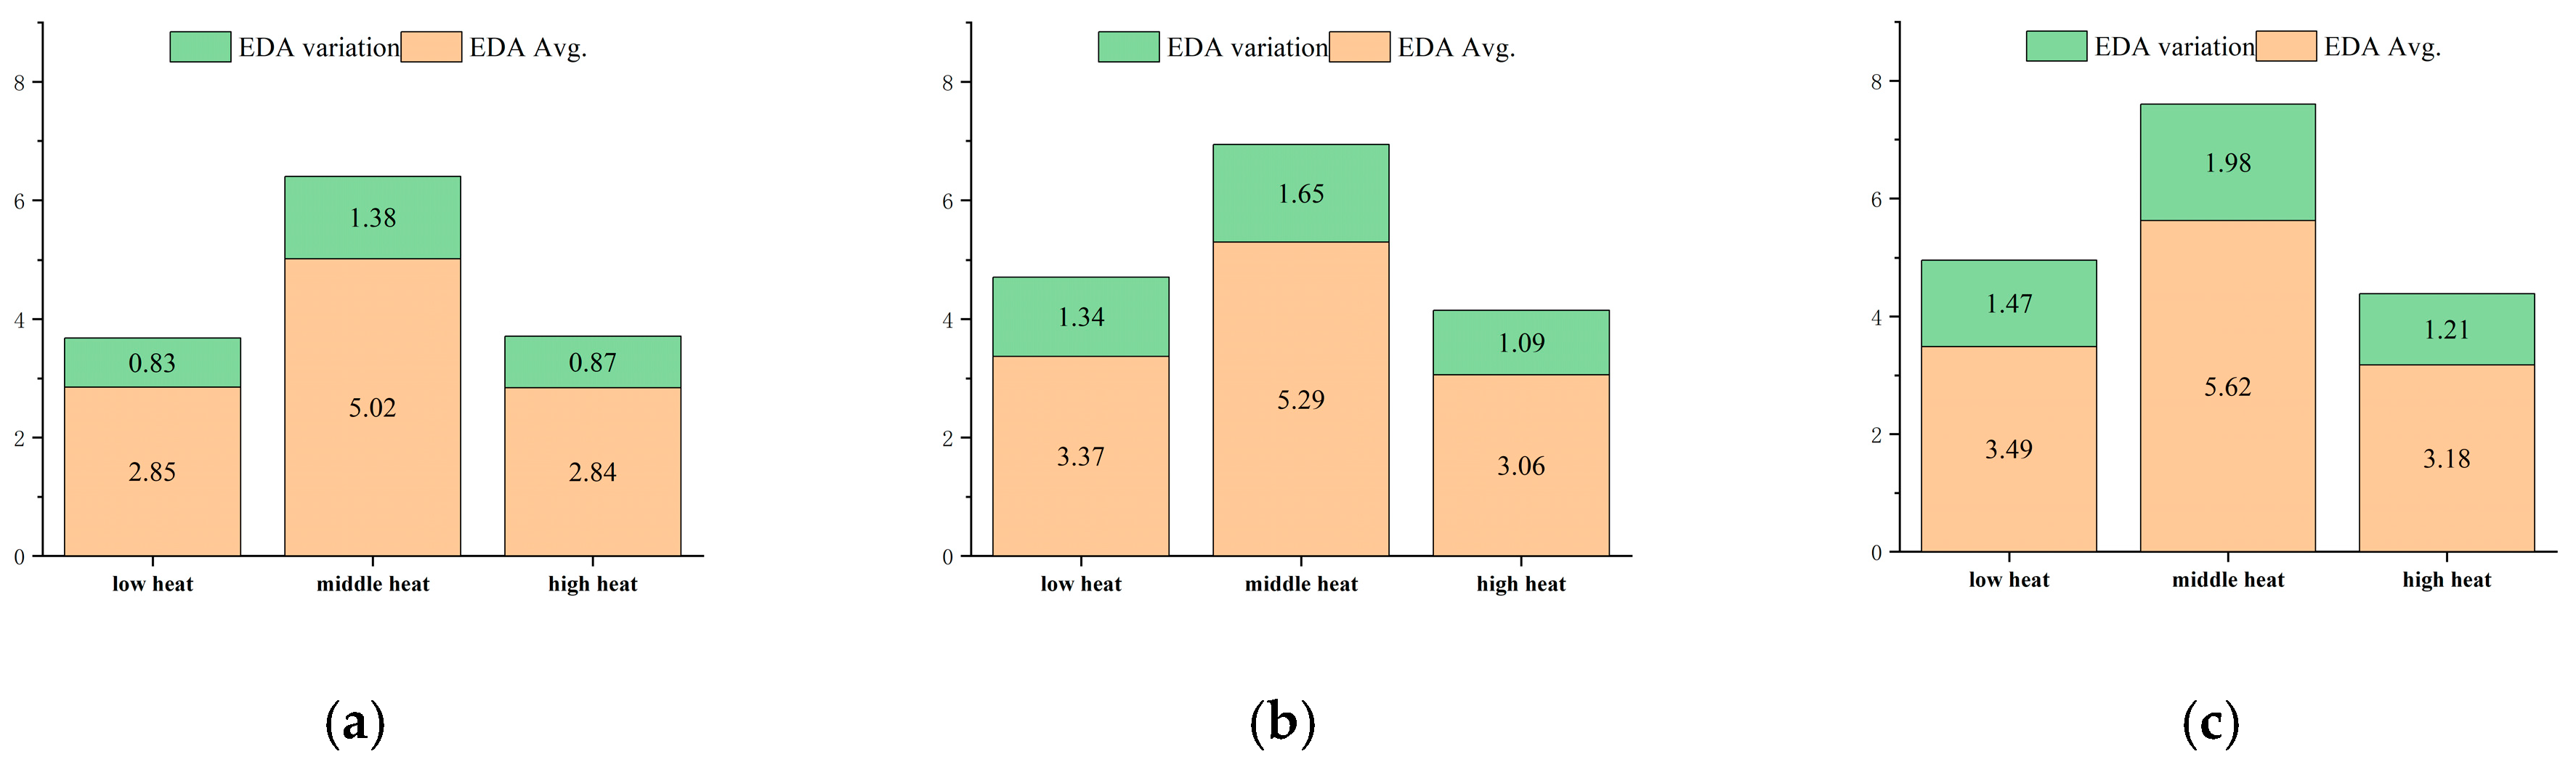
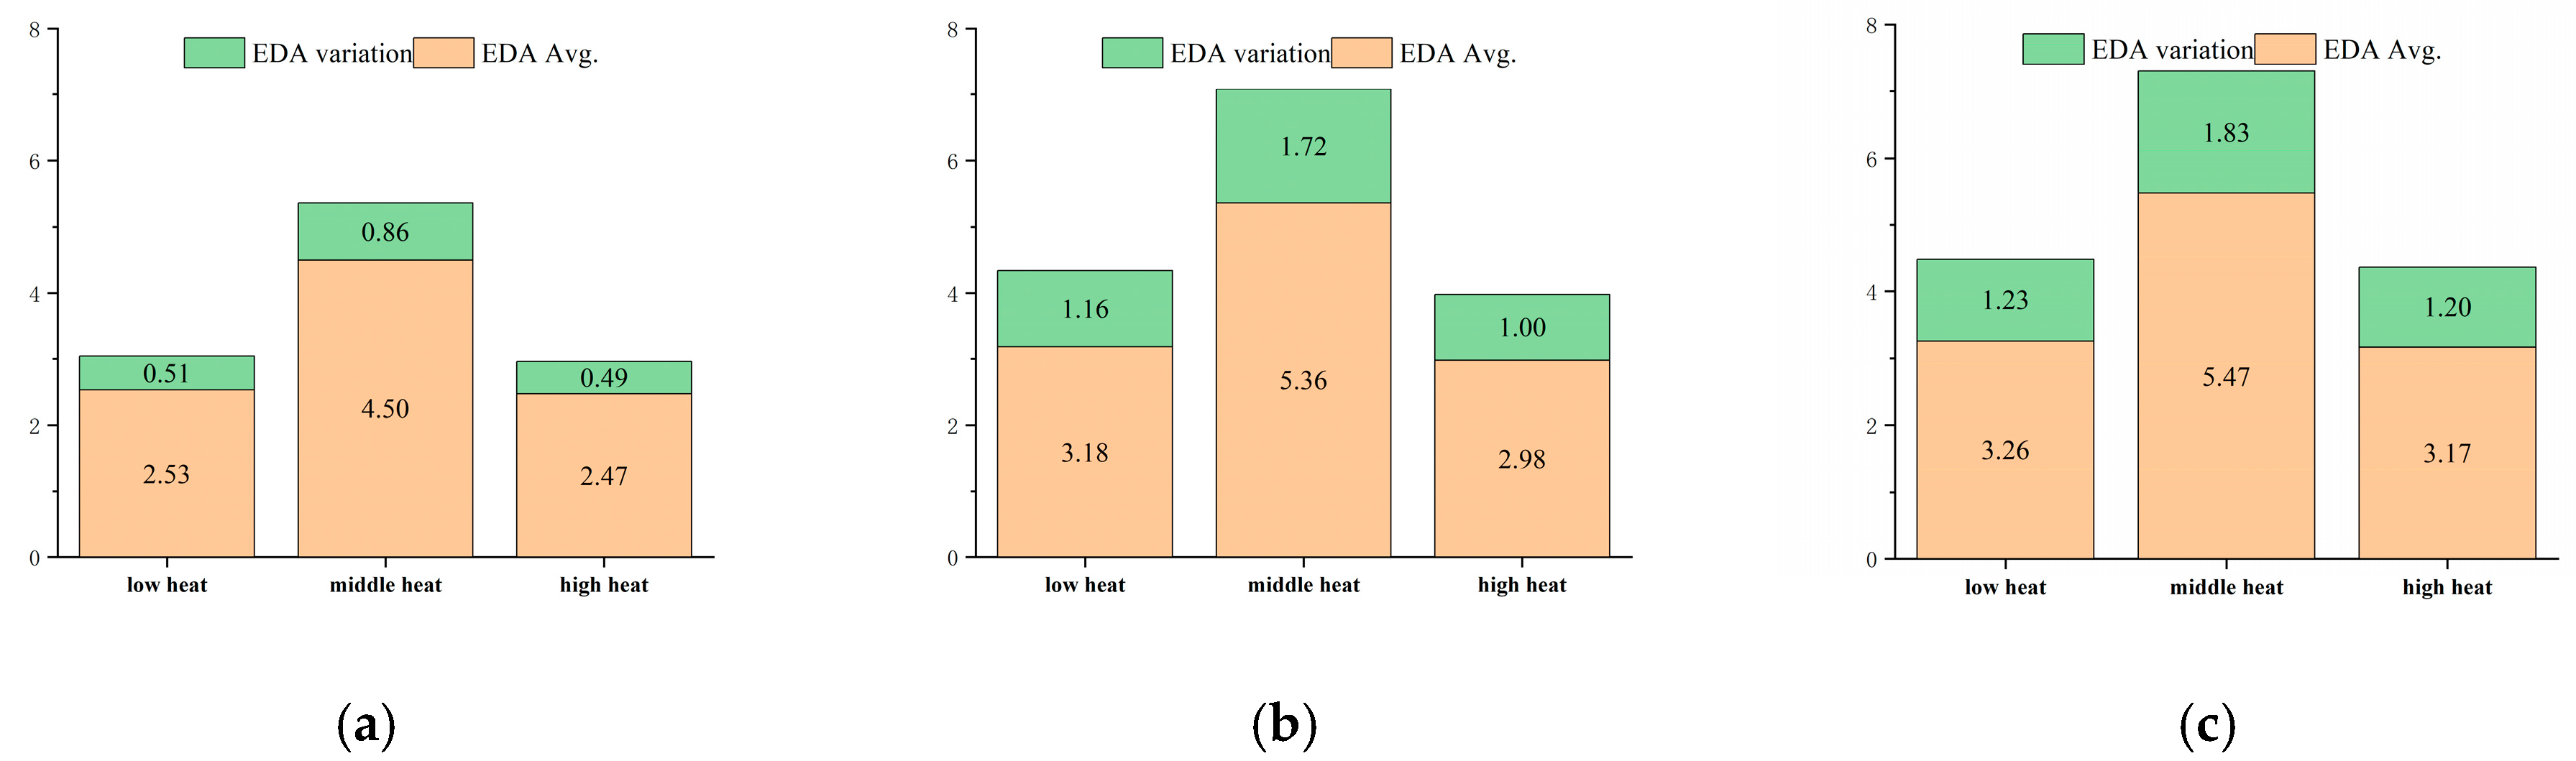
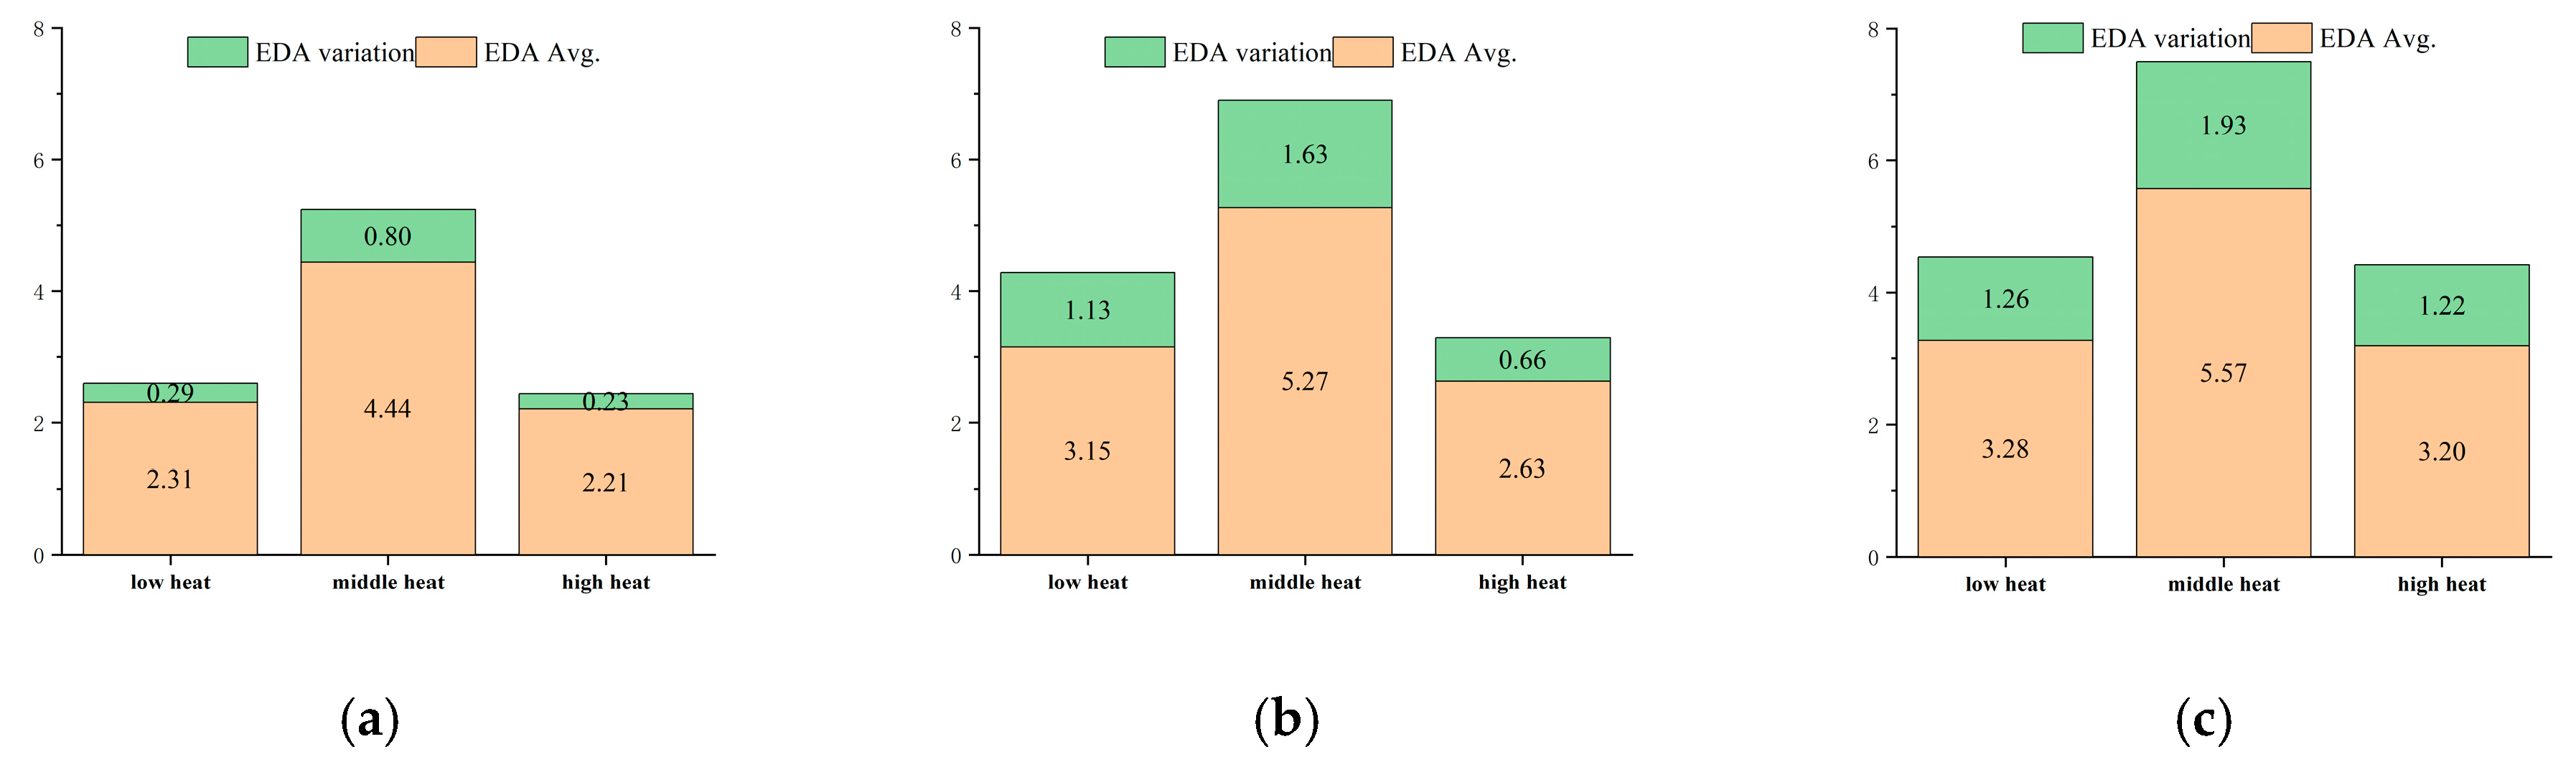
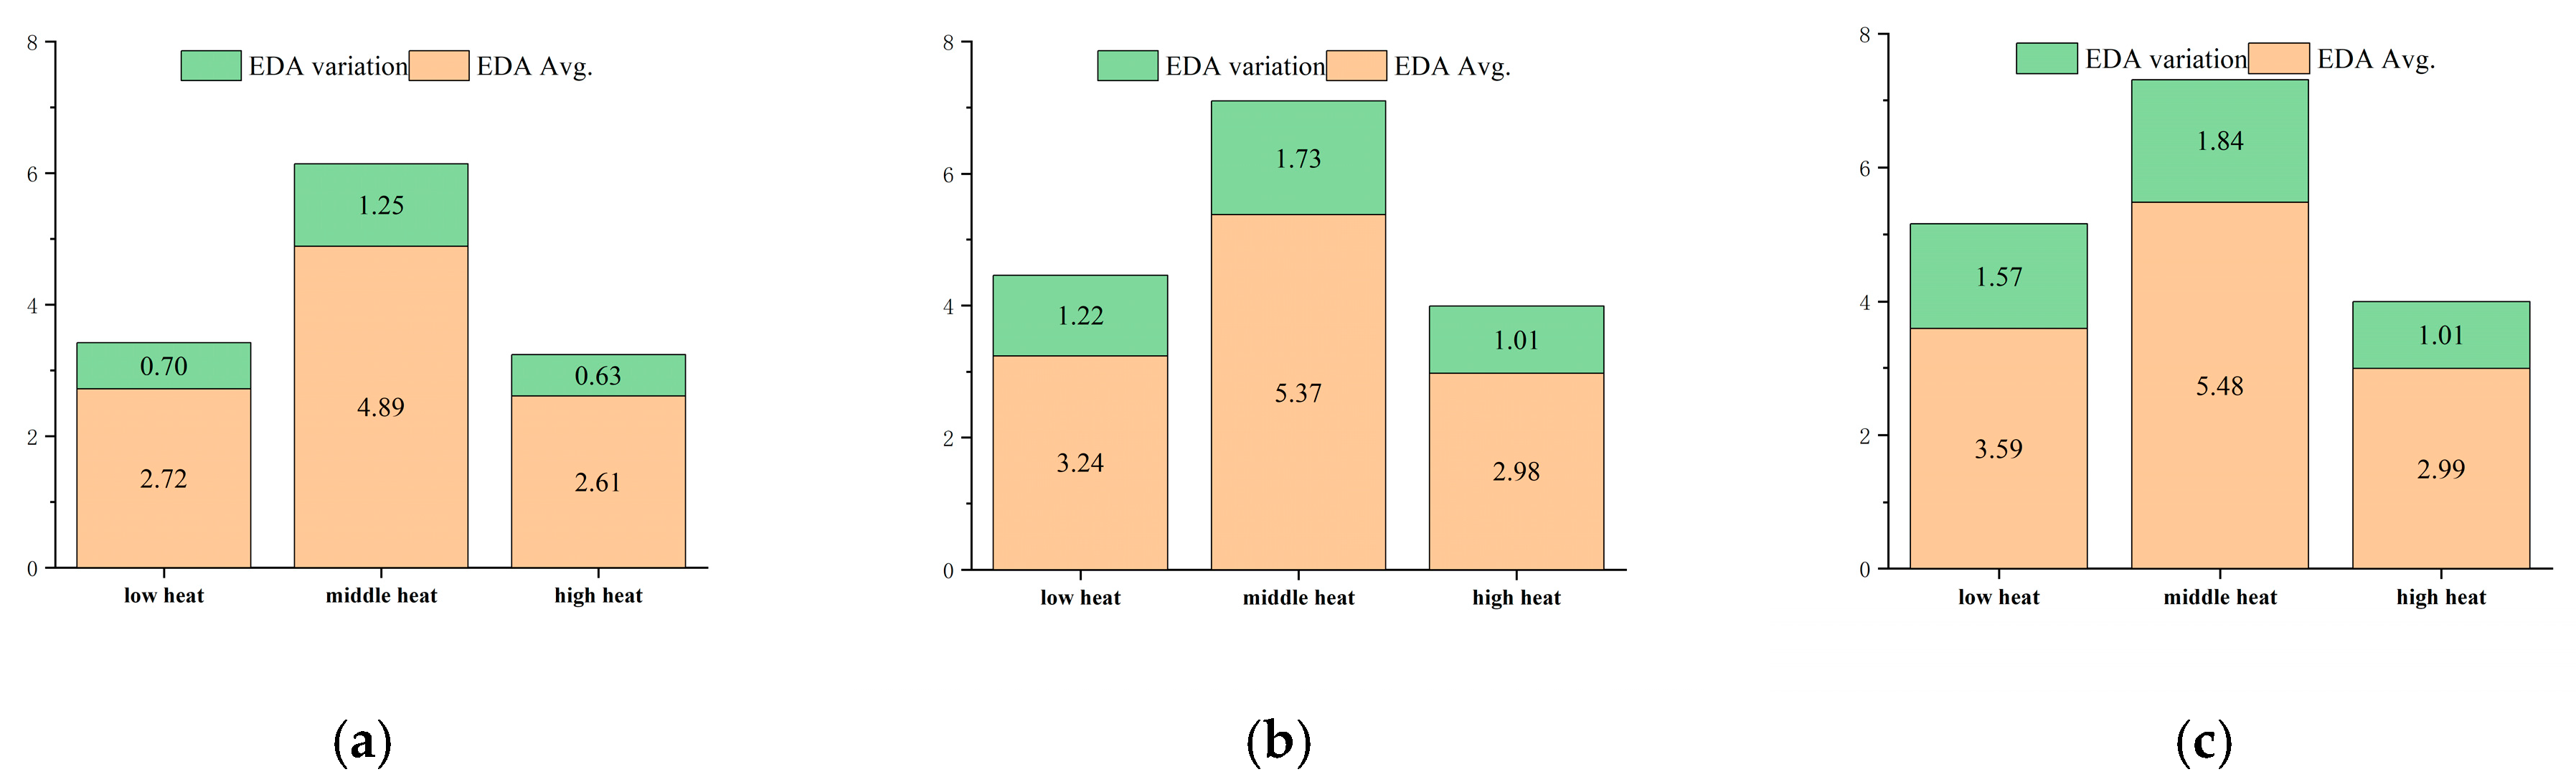
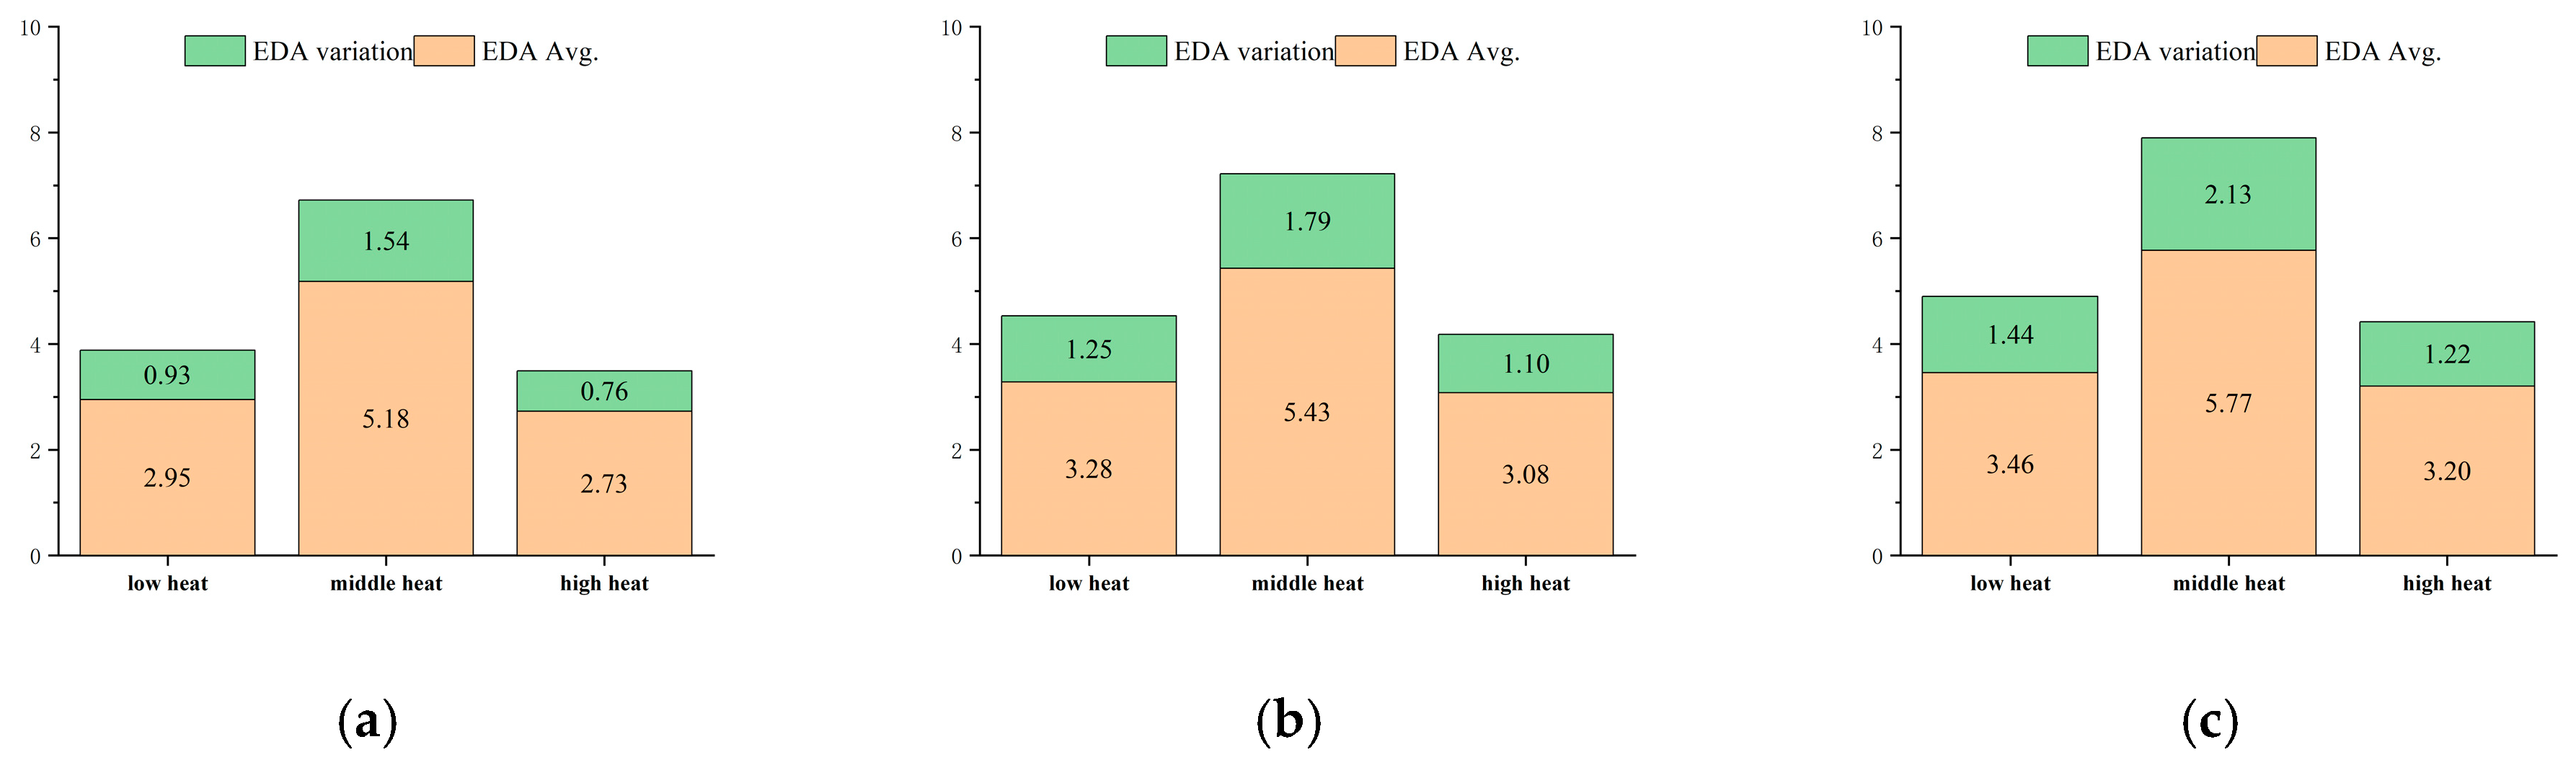
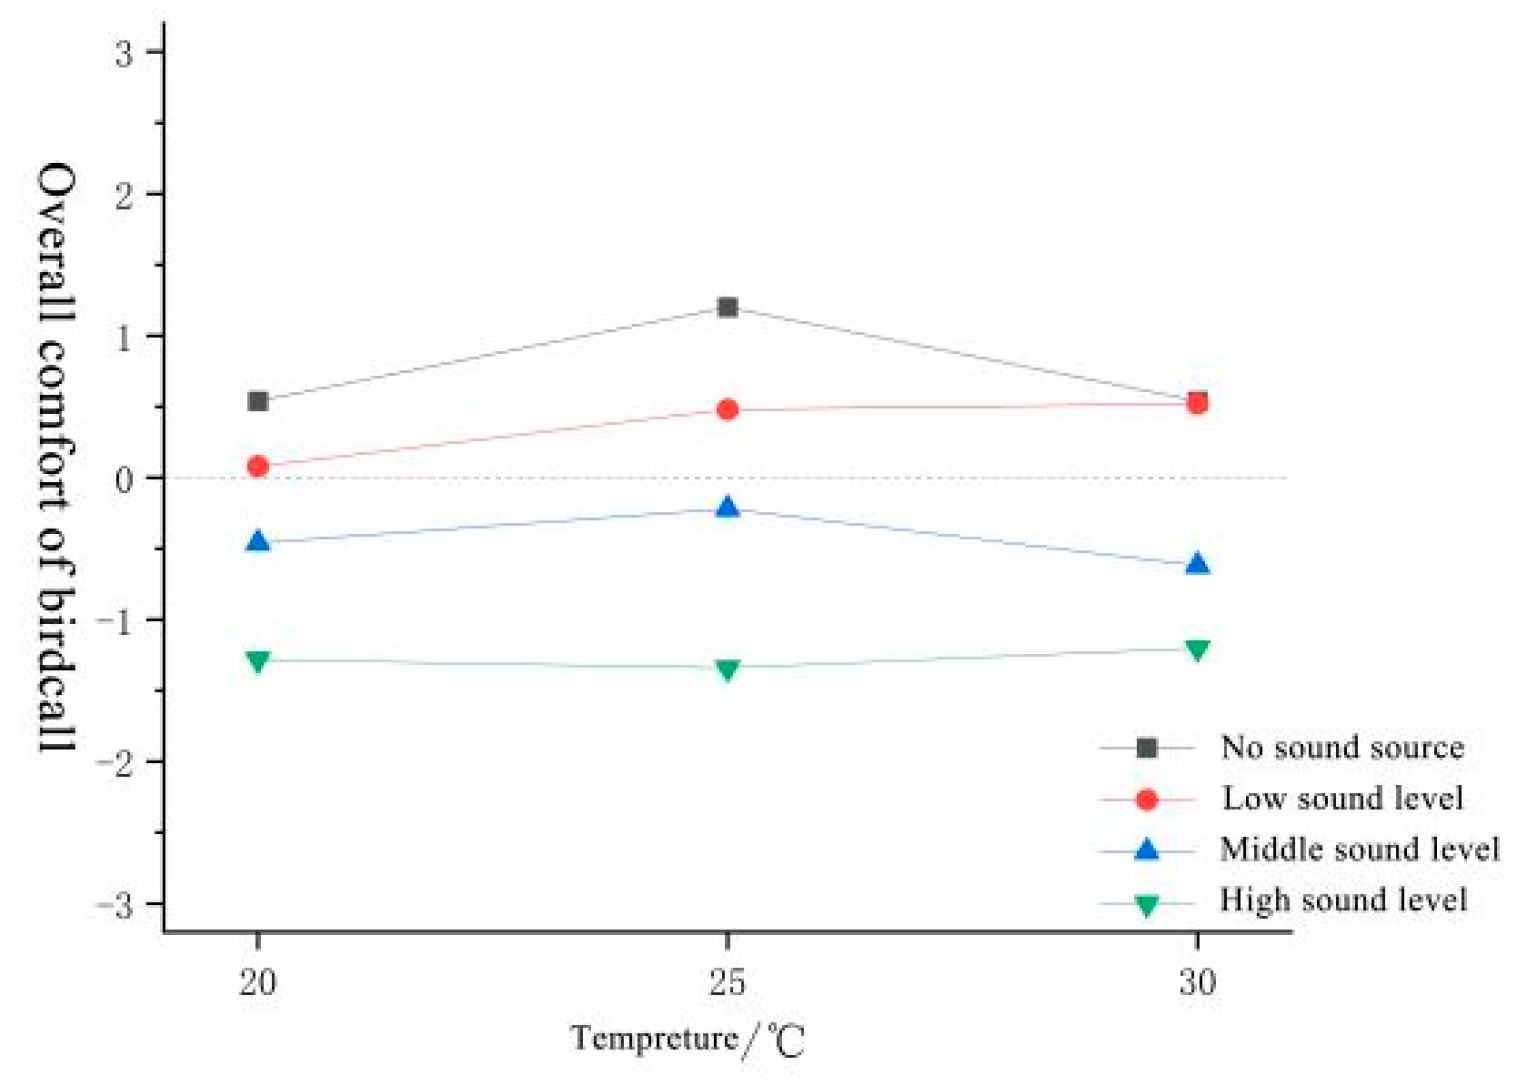
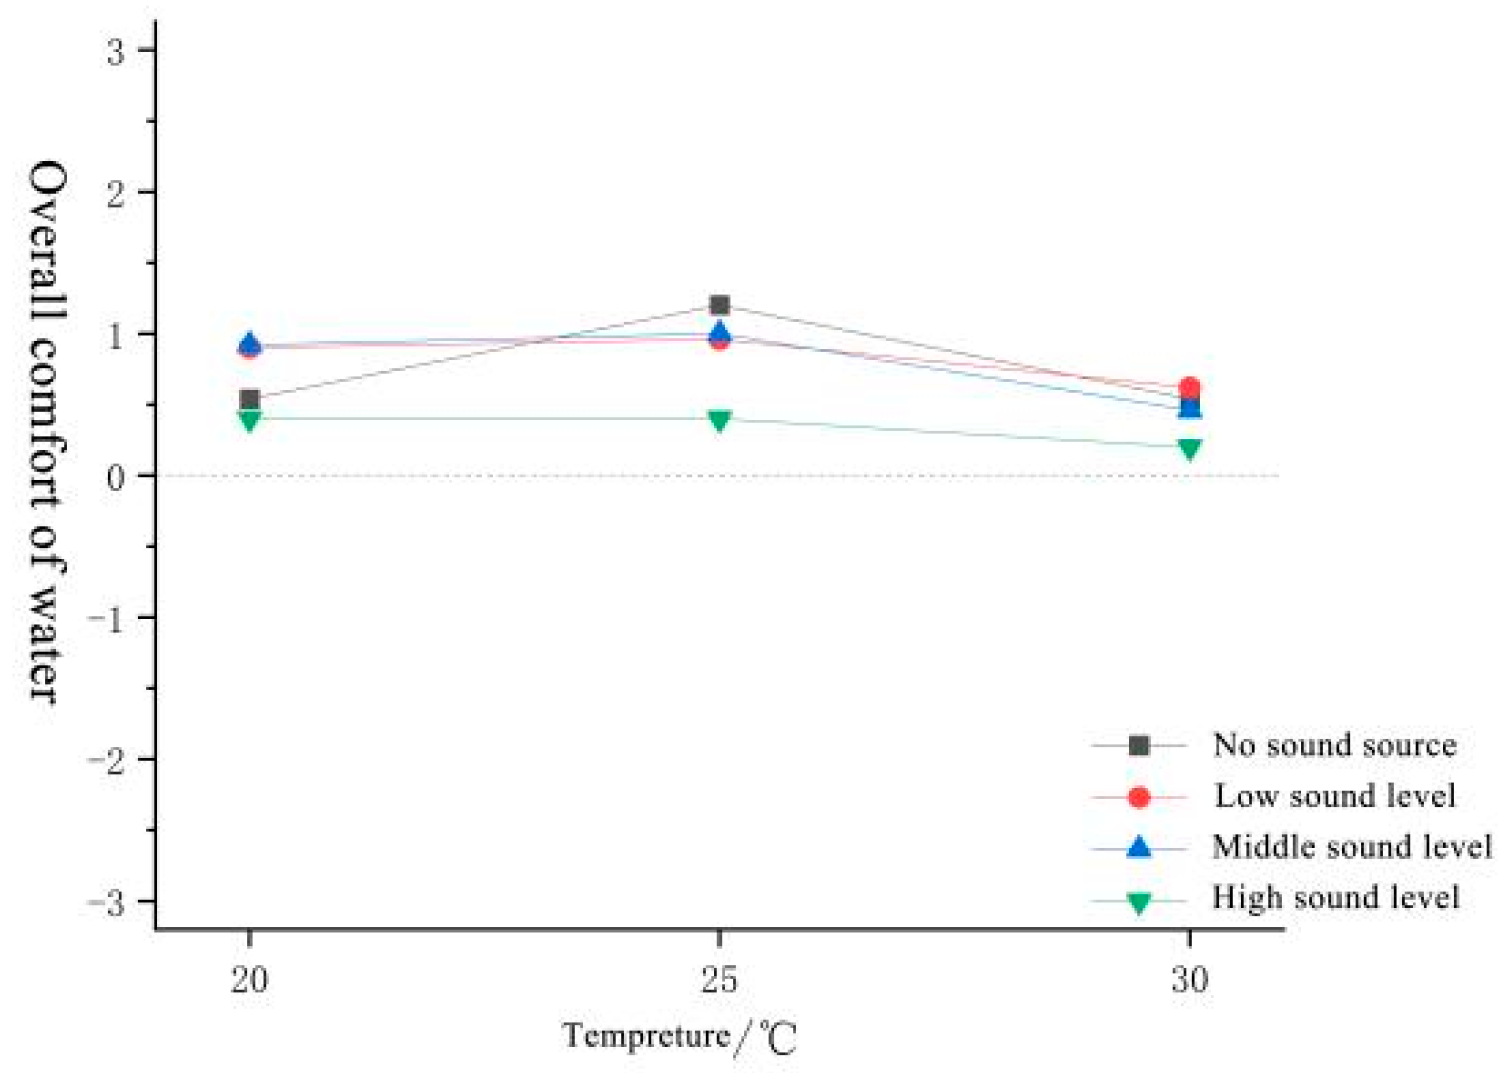
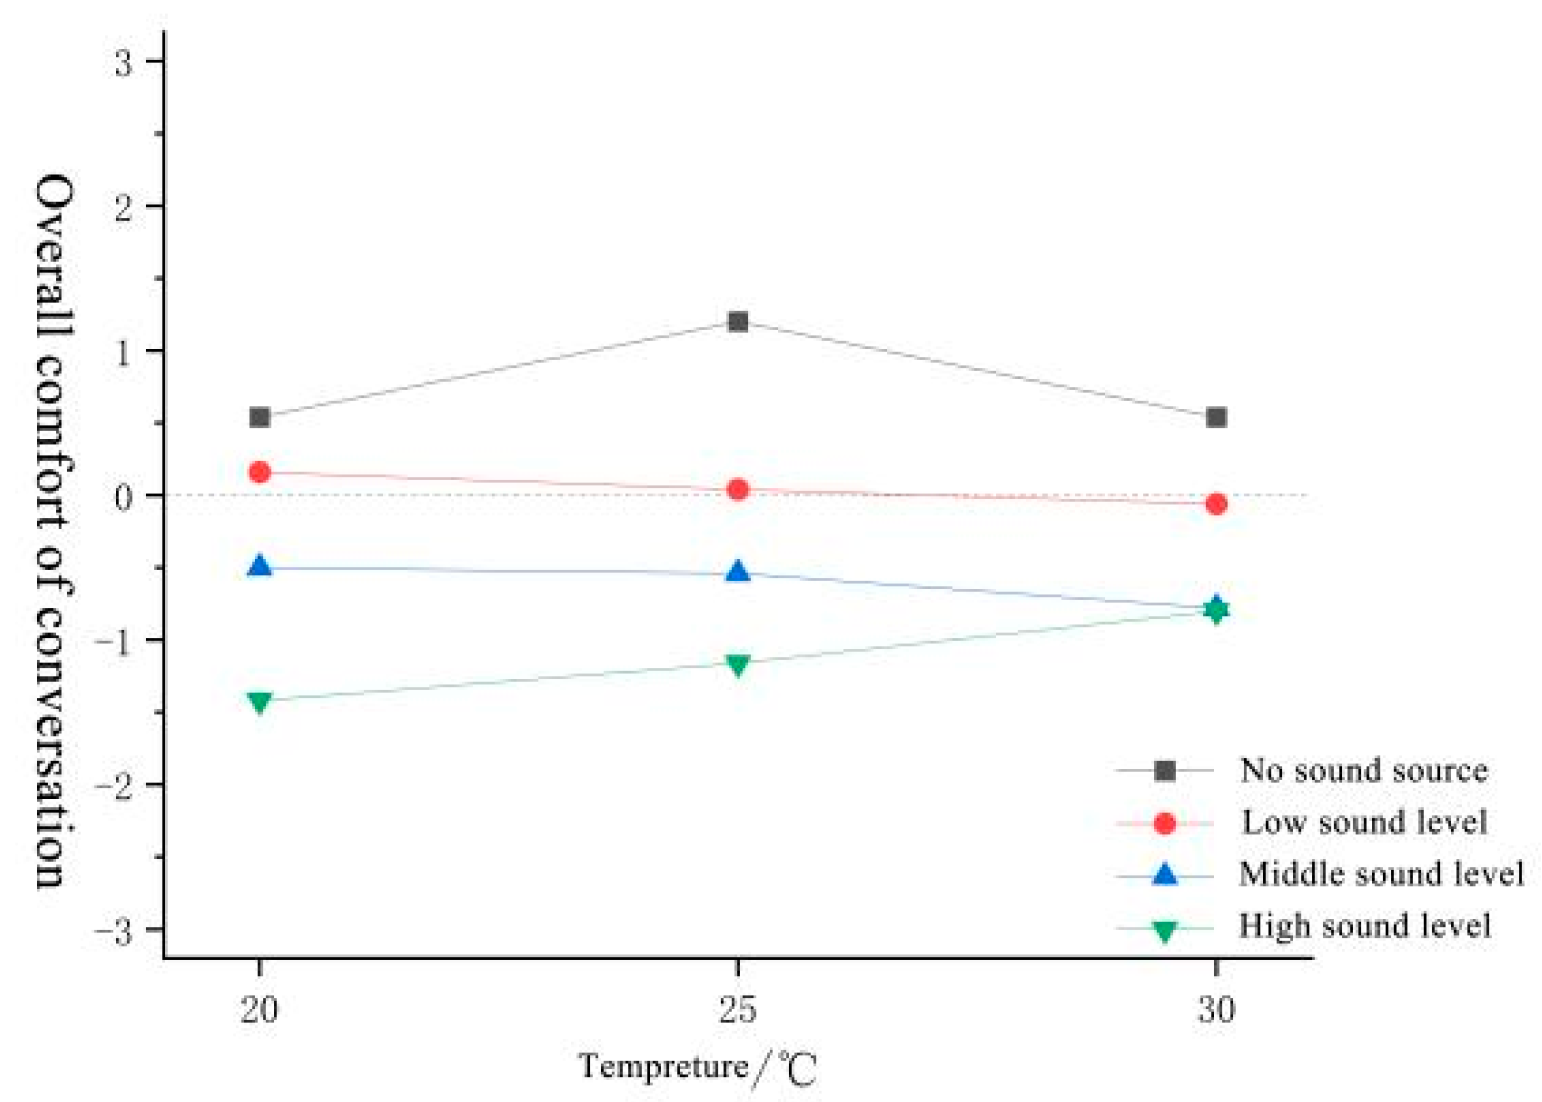
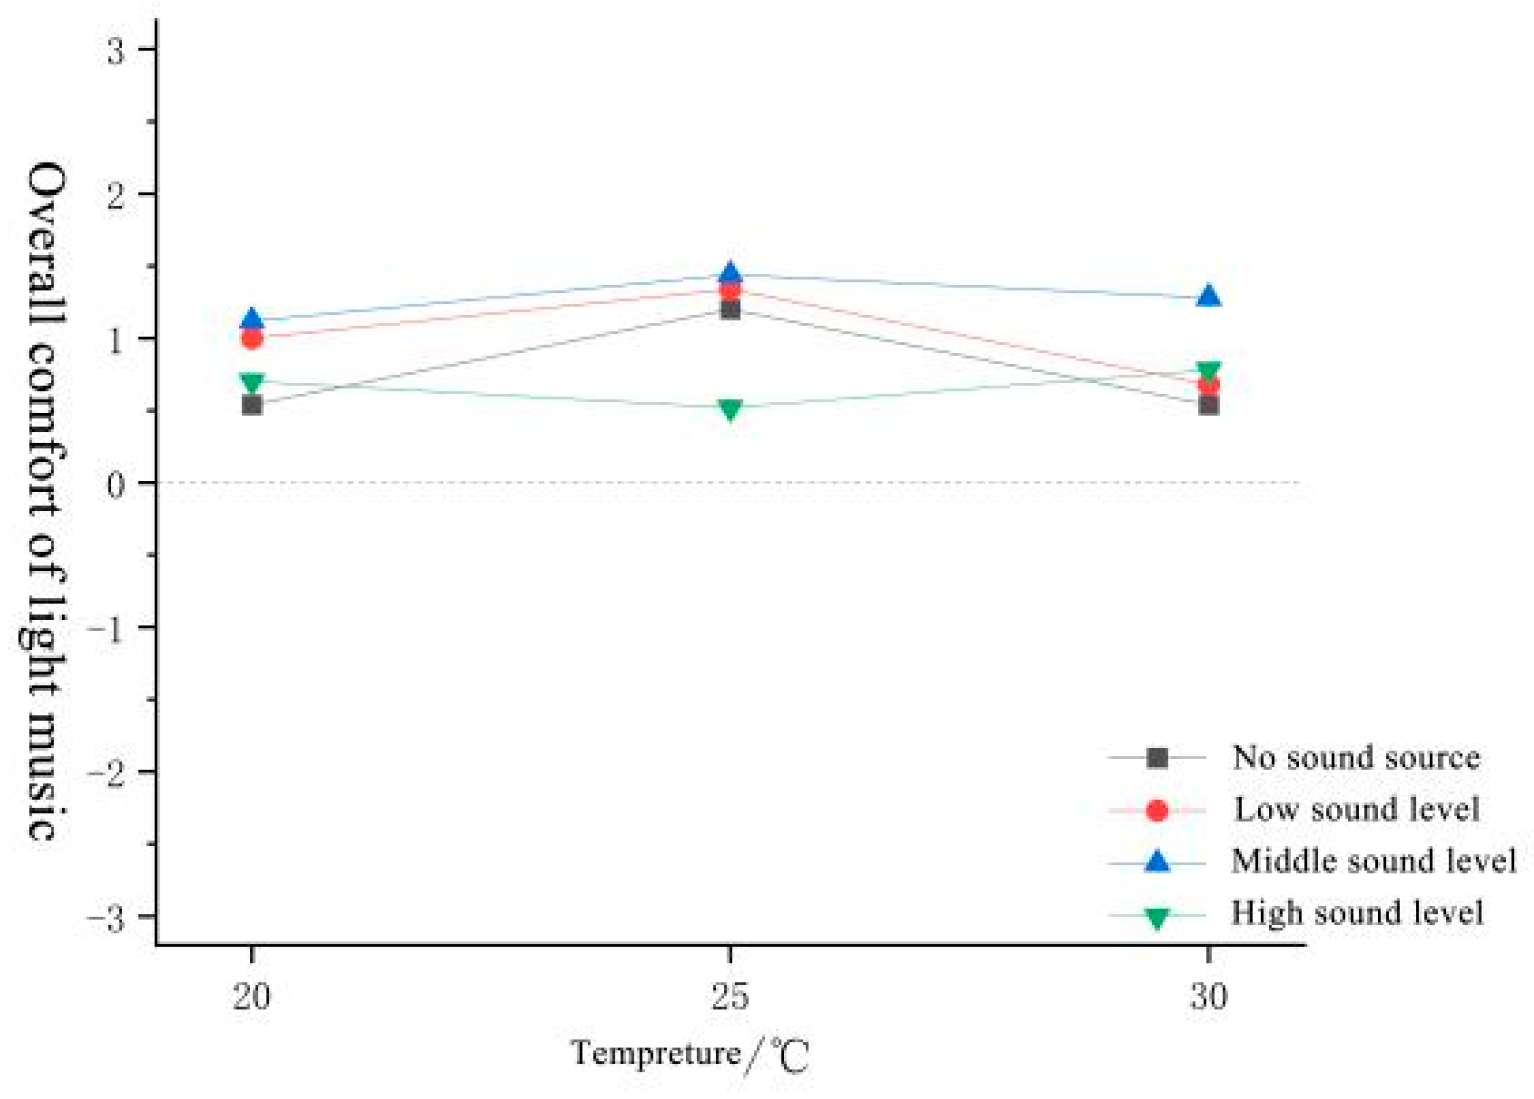
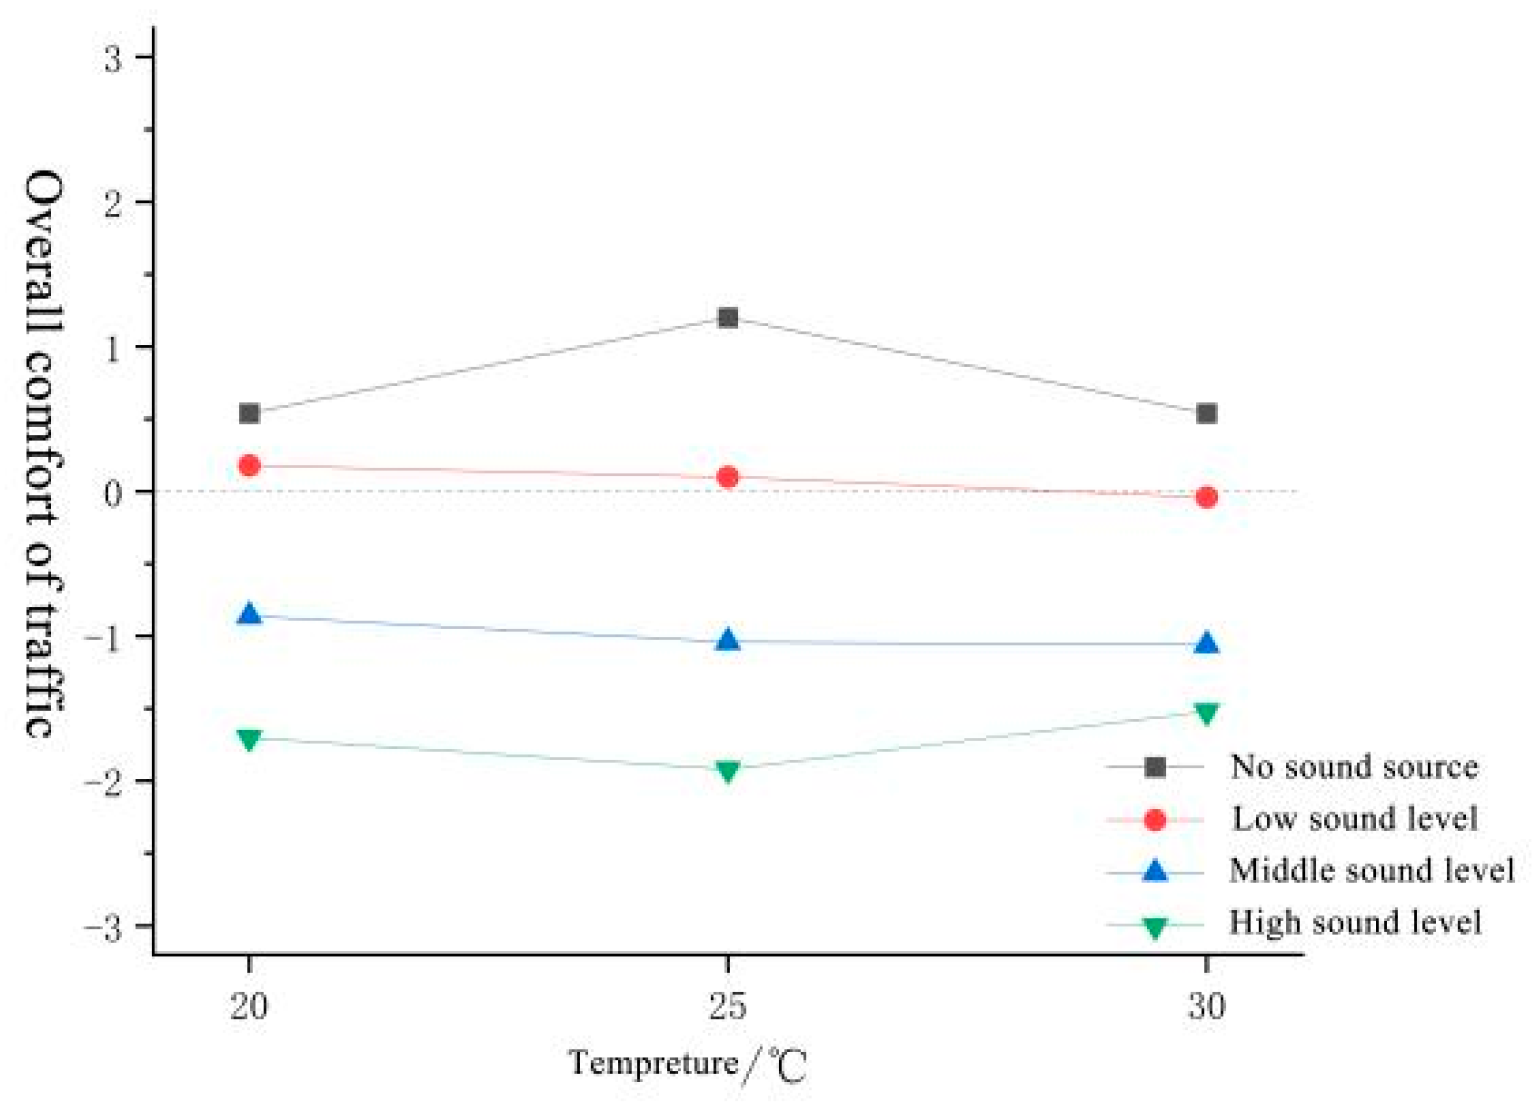
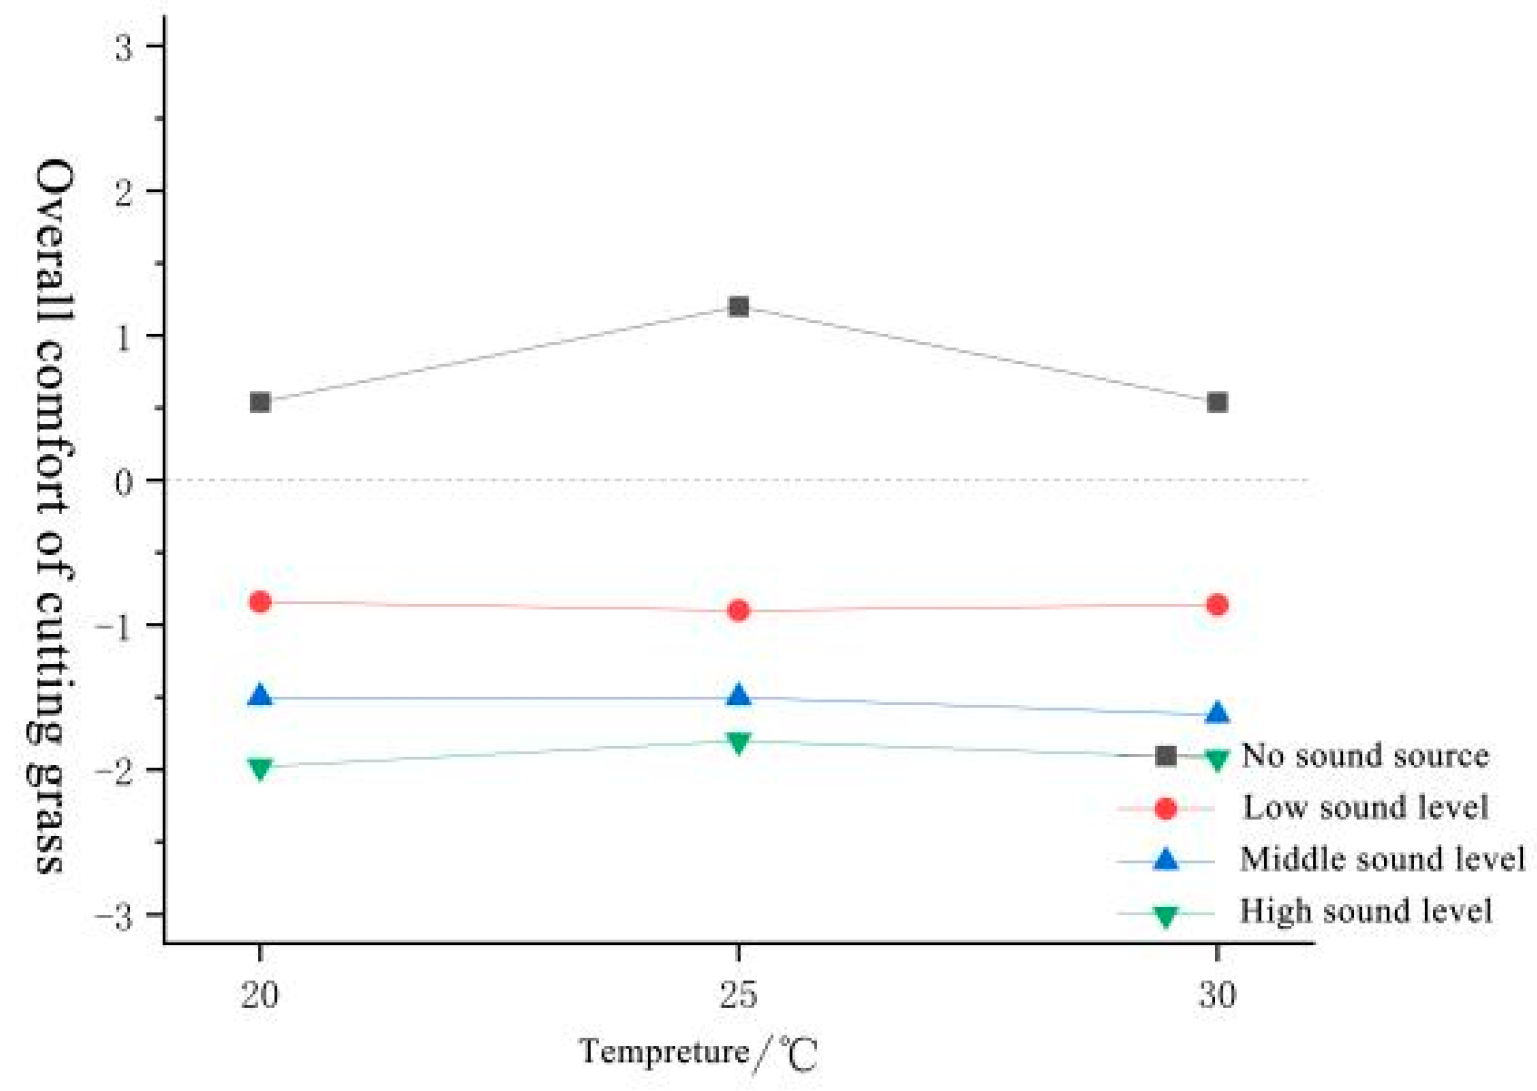
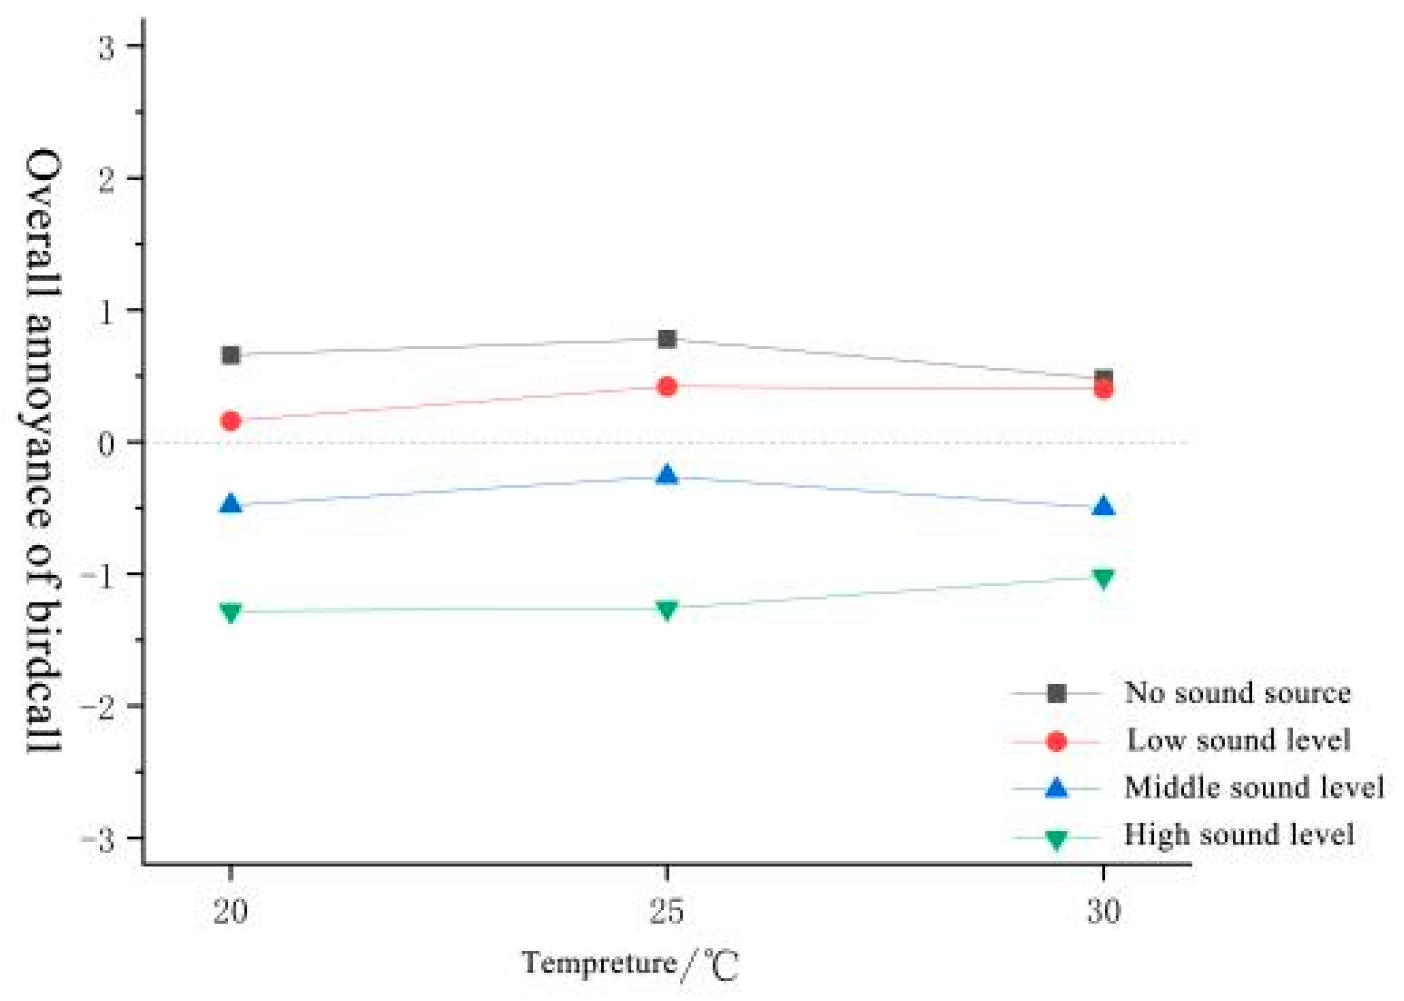

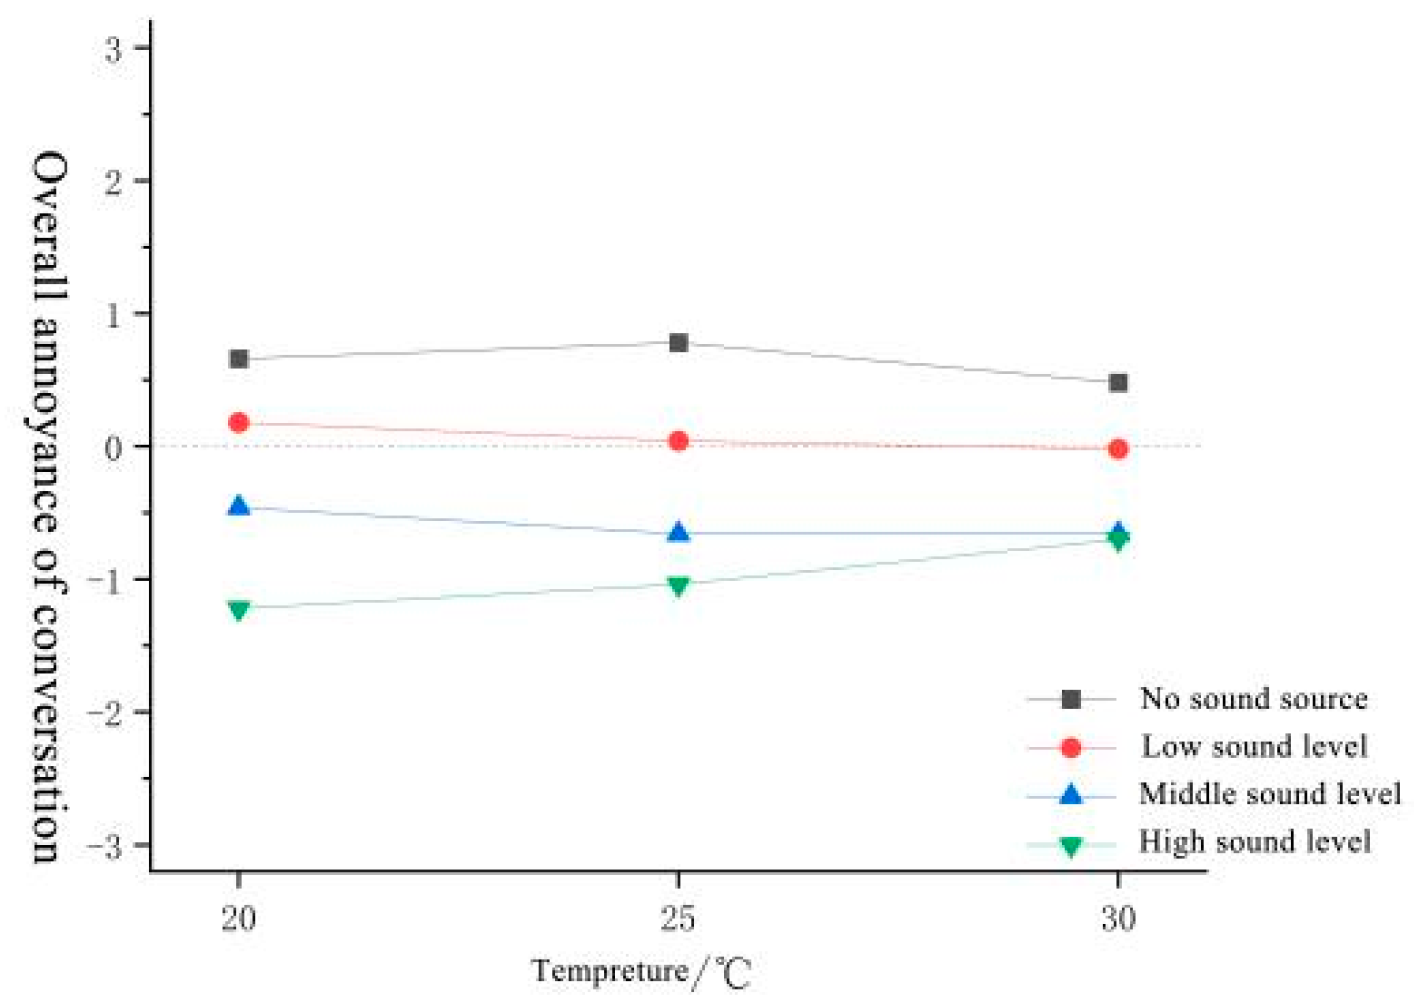

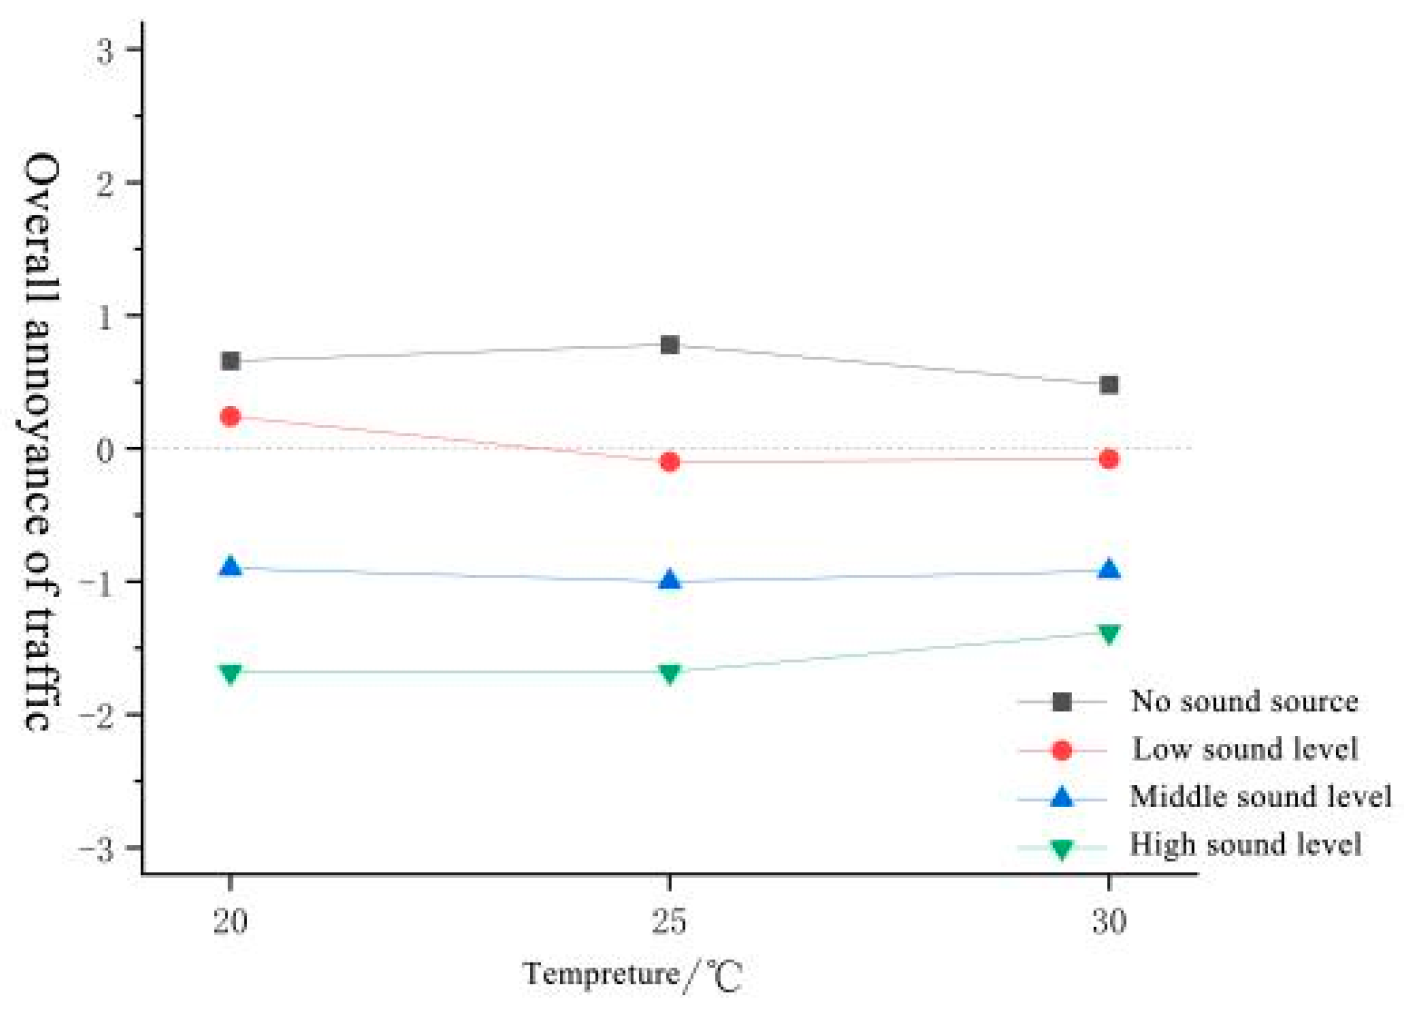
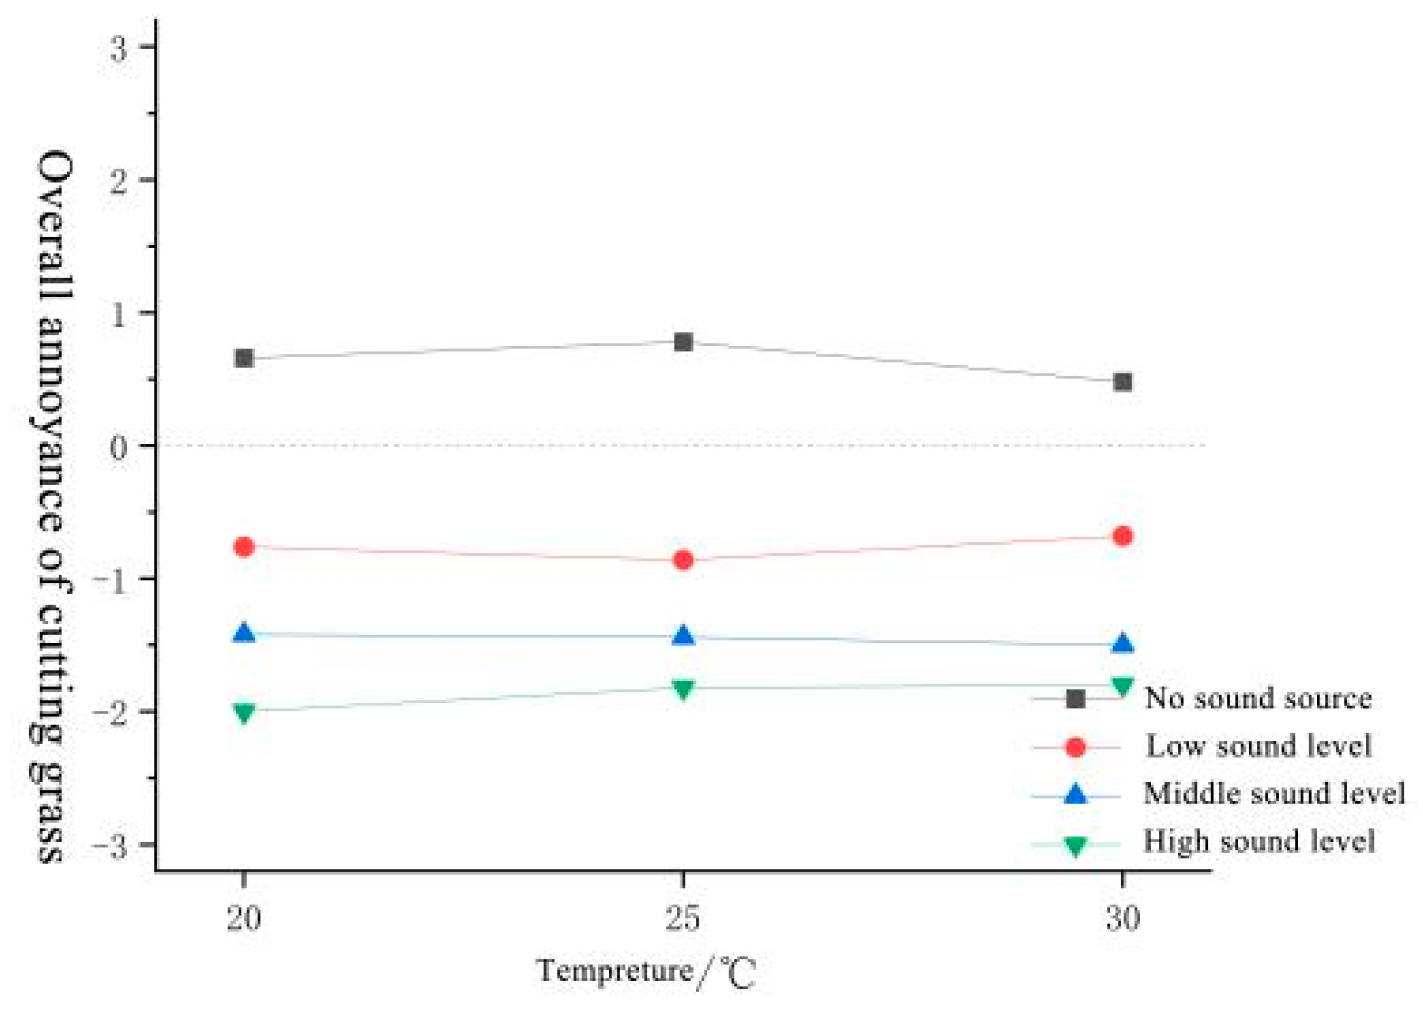


Disclaimer/Publisher’s Note: The statements, opinions and data contained in all publications are solely those of the individual author(s) and contributor(s) and not of MDPI and/or the editor(s). MDPI and/or the editor(s) disclaim responsibility for any injury to people or property resulting from any ideas, methods, instructions or products referred to in the content. |
© 2024 by the authors. Licensee MDPI, Basel, Switzerland. This article is an open access article distributed under the terms and conditions of the Creative Commons Attribution (CC BY) license (https://creativecommons.org/licenses/by/4.0/).