Article

Increased Saprotrophic Activity and Phosphate Leaching Following Forest Soil Decomposition without Root Access

1
Department of Ecosystem Biology, Faculty of Science, University of South Bohemia, Branišovská 1760, 370 05 České Budějovice, Czech Republic
2
Biology Centre CAS, Institute of Hydrobiology, Na Sádkách 702/7, 370 05 České Budějovice, Czech Republic
*
Author to whom correspondence should be addressed.
Forests 2024, 15(8), 1378; https://doi.org/10.3390/f15081378
Submission received: 21 June 2024 / Revised: 17 July 2024 / Accepted: 5 August 2024 / Published: 7 August 2024
(This article belongs to the Section Forest Soil)

Abstract

:
By incubating the soil without living roots in situ at two spruce forest sites, we simulated the effects of tree dieback and interrupted mycorrhizal associations following forest disturbance on the soil microbiome and phosphorus leaching. We observed the retreat of ectomycorrhizal fungi and increased proportion of saprotrophs without changes in community richness and the Shannon diversity index. This was accompanied by a pronounced decomposition of organic matter, associated with an increased activity of carbon-mining hydrolases and acid phosphatase. The nonexistent phosphorus uptake and immobilization by ectomycorrhizal associations led to its substantial increase in the soil, in the labile fractions, such as microbial biomass and water-soluble reactive phosphorus, but also in the fraction bound to organometallics (extractable by oxalate), and caused considerable phosphate leaching, as estimated using ion-exchange resin traps. The results show that the retreat of the root-specific environment, characterized by the input of available carbon and effective nutrient uptake and by the specific microbiome, has profound effects on phosphorus dynamics and loss. Furthermore, we suggest that ectomycorrhiza plays an equally important role in controlling phosphorus-mining from organic matter and subsequent immobilization and/or leaching from soils concurrently to its known role in nitrogen cycling and immobilization in spruce forests.

1. Introduction

The soil microbiome of temperate and boreal coniferous forests is largely dominated by two distinct fungal trophic groups: ectomycorrhizal (EcM) fungi and saprotrophic (SAP) fungi, both capable of enzymatic processing of litter input and soil organic matter [1]. SAP fungi oxidize lignified organic complexes and depolymerize and consume abundant plant polymers such as cellulose. EcM fungi, which feed on the photosynthates of their host plants [2], contribute significantly to the decomposition of complex organic compounds. The reason is not to obtain carbon (C), but to mine nutrients for their needs and those of their host plants [3,4]. The interactions between the SAP and EcM fungi appear to be an important factor controlling the rate of decomposition, nitrogen (N) immobilization and soil C stocks [5,6,7].
SAP and EcM fungi rely on different C sources (soil organic matter and photosynthates, respectively) but compete for N [8]. EcM fungi are thought to be superior competitors for N and acquire it, supported by plants, far more efficiently than saprotrophs [6]. Nitrogen uptake by ectomycorrhiza increases the C-to-N ratio in the decomposing litter, specifically in the systems with recalcitrant litter inputs such as coniferous forests [5,6]. It can lead to N limitation for other members of the soil microbiome and suppress saprotrophic activity, slowing the decomposition and promoting the accumulation of partially decomposed litter in soils, a phenomenon known as the Gadgil effect [5,9,10,11,12]. In addition, EcM fungi make a substantial proportion of soil microbial biomass and necromass and therefore contribute significantly to N stabilization in topsoil [13,14]. Ectomycorrhizal associations thus play a crucial role in the intricate web of C and N cycling in coniferous boreal and temperate forest ecosystems [13,15].
The key role of ectomycorrhizal associations and EcM fungi biomass in controlling nutrient immobilization and losses from soils is also evident in the case of forest disturbances associated with tree dieback, typically caused by bark beetle outbreaks and windstorms in central Europe [16]. Both the flow of plant photosynthates to EcM fungi and their nutrient uptake are interrupted in such situations; EcM fungi partially die off [17] and SAP fungi and bacteria become dominant in the soil microbiome [17]. The activity of such a community can be characterized by high hydrolytic enzyme production [17], accompanied by an increased decomposition rate and availability of nitrogen in the soil [18,19,20,21,22], and its elevated leaching to the receiving waters [20]. In mountain spruce forests severely affected by bark beetle infestation, increased N leaching to surface waters was accompanied by even more massive and longer-lasting leaching of phosphorus (P) [23]. This suggests that ectomycorrhizal associations, in addition to their generally recognized key role in regulating the N cycle in forests, also control P availability in and losses from soils.
P is an important biogenic element that increasingly co-limits forest production together with N [24]. The P demand of a mature forest’s biomass is relatively high and usually exceeds the supply from atmospheric deposition and weathering input (Newman, 1995). Furthermore, ionic P (orthophosphate, P-PO4) is usually strongly bound to metal hydroxides and organometallic complexes in acidic soils of coniferous forests [25]. This immobile P is less available for direct plant/microbial uptake, indicating the importance of microbial enzymatic P-mining from organic matter for forest productivity. Nevertheless, much less attention has been paid to the ability of EcM fungi to recycle organic P or their role in P uptake and transfer to host trees compared to N (reviewed in [26]). The role of the interaction between EcM fungi and saprotrophs in controlling P availability and losses in forest soils is unknown.
This study investigates how the experimental interruption of root access, e.g., after forest disturbance, affects biomass and composition of the soil microbiome and the associated enzymatic processing of soil organic matter, the redistribution of P to fractions of different mobility and its potential leaching from the soil. We designed a simple 525-day field experiment at two permanent research sites differing in their soil P dynamics. One catchment continuously loses P, while the other accumulates P from atmospheric deposition, which was previously explained by the different bedrock composition and sorption capacity of the soil [27]. We hypothesized that the proportion of saprotrophs in the soil microbiome and the activity of hydrolytic enzymes, including phosphatase, in the soil would increase with soil incubation without plant root access. This would lead to a higher concentration of P in soil, as well as in soil microbial biomass. Consequently, the surplus P-PO4 would be leached out of the soil.

2. Materials and Methods

2.1. Study Site

The experiment was conducted in the Šumava National Park (Czech Republic, Central Europe), in the unmanaged mountain catchments of the glacial lakes Plešné (PL; 48°47′ N, 13°52′ E) and Čertovo (CT; 49°10′ N, 13°11′ E). The PL and CT bedrock consists of granite and mica schist, respectively. The soils are shallow leptosols (~0.2 m deep), podzols and dystric cambisols (~0.5 m deep) (WRB). In the last ~30 years, the catchments have recovered from severe acidification caused by anthropogenic deposition of sulphur and nitrogen compounds [28]. The soil water pH ranges from 3.1 to 4.3 in the litter and the upper mineral horizons, respectively [29]. In 2000, the original vegetation was dominated by mature Norway spruce (Picea abies) with a low admixture of birch (Betula pubescens; Betula pendula), beech (Fagus sylvatica) and rowan (Sorbus aucuparia) in both catchments. The understory consisted mainly of blueberry (Vaccinium myrtillus), fern (Athyrium distentifolium), grass (Calamagrostis villosa; Avenella flexuosa) and forest rush (Luzula sylvatica) [30]. About 75% of spruces gradually died in the PL catchment from 2004 to 2008 due to bark beetle (Ips typographus) infestation, while the CT catchment was affected less by windthrows and a subsequent bark beetle outbreak from 2007 to 2011, when the total area of damaged forest (with >50% being dead trees) increased from ~4 to 18% between 2000 and 2011 [27]. Natural forest regeneration in the PL catchment started within three years after the disturbance and increased the average density from 47 to 670 spruce seedlings ha−1 from 2005 to 2015 [30]. However, the experiment was conducted at undisturbed research sites in both catchments, which were not affected by bark beetle outbreak (PL: 1132 m ASL, 48°46′39.6″ N, 13°51′51.5″ E; CT: 1065 m ASL, 49°09′46.4″ N, 13°11′5.5″ E). Vegetation at both sites was dominated by Norway spruces, with the average ages of ~60 and ~140 years in the PL and CT catchments, respectively. The younger age of spruces at the PL site was the reason why they were not infested during bark beetle outbreak.

2.2. Soil Decomposition Experiment—Sampling, Analyses and Design

In both the PL and CT catchment sites (Figure S1), we incubated local forest soils, consisting of litter and topsoil layers, in plastic boxes separated from the surroundings and preventing root ingrowth. Fe-impregnated ion exchange resin traps capturing leached P-PO4 were placed at the bottom of each box. After incubation, we assessed the changes in the soil microbiome, activities of selected hydrolytic enzymes including acid phosphatase and quantified P availability in the soil compared to the initial conditions.
We took soil samples from five pits (50 × 50 × 2–20 cm) at each of the CT and PL sites, separately from litter (O = L + F + H horizons; henceforth litter) and topsoil (upper mineral horizon A; henceforth topsoil). Soil samples were transported to the lab in a cool box. There, we immediately integrated and mixed the five samples of the respective individual horizons to obtain one composite litter and topsoil sample for each catchment. All visible stones (>0.5 cm) were removed by hand. Each soil sample was analysed in five replicates for chemical and microbial characteristics as described in the section “Soil analyses”. The subsamples for DNA extraction and extracellular enzymatic activity analyses were stored at −20 °C.
The soils were placed into open plastic boxes (13 cm diameter, 18 cm height) with a perforated bottom (nine evenly spaced holes, 1 cm diameter) covered with a polyamide net (2 mm mesh). Each box contained a layer of litter (100 g fresh weight) placed over the topsoil (500 g fresh weight), separated by a polyamide net, simulating the thicknesses of the respective soil layers under field conditions (~5 cm and 10.5 cm for litter and topsoil, respectively) (Figure S2). The filled boxes were stored at 4 °C and within one week transported back to the research sites.
At each research site, five boxes were installed in late May 2017. An iron oxide-based ion-exchange resin trap made from a stitched polyamide net for measuring P-PO4 leaching [31] was placed under each box. The whole set-up was placed in another perforated plastic box of the same size to separate an ion-exchange resin trap from the surrounding soil and buried in the soil so that the intact soil surface was at the same level as the soil surface in the box. The other ten replicates of the same ion-exchange resin traps were deployed below the litter (~5 cm below the soil surface) and in ~10 cm of the topsoil in the intact soil in the vicinity of the buried boxes as the controls (two replication per box). All ion-exchange resin traps were replaced at 6-month intervals and analysed in the laboratory for sorbed P-PO4 by dynamic elution [31]. The P caught by the traps was expressed as the cumulative amount from all three intervals and totalled for the litter and topsoil of the control in each replicate. Fresh, newly fallen litter if present, was monthly removed from the soil surface of the boxes. The boxes were finally removed after 17 months (525 days), and their soils were analysed similarly as at the starting point.

2.3. Soil Analyses

2.3.1. Soil Chemistry

Soil dry weight was obtained by soil-drying at 105 °C for 5 h. The soil pH was determined by potentiometer after 1-h soil extraction in distilled water on a horizontal shaker (soil to water ratio of 1:10, w/v). Total soil C (TC) and N (TN) were analysed in dried (60 °C, 48 h) and milled soil samples using an NC analyser (Vario Micro Cube, Elementar, Germany). Total soil P (TP) was determined colorimetrically after HNO3 and HClO4 digestion [32]. Amounts of water-extractable ammonium-nitrogen (N-NH4), nitrate-nitrogen (N-NO3), total water-soluble phosphorus (WP) and water-soluble reactive phosphorus (SRP; assuming to represent microbially available and most mobile P form), were assessed in fresh soil extracted with distilled water (soil:water, 1:10, w/v, shaken 60 min/150 opm, centrifuged 4000 rpm/10 min, filtered through acid washed 0.45 μm glass-fiber filter). Concentrations of N-NH4 and N-NO3 were measured using an automatic spectrophotometer (QuickChem 8500, Lachat Instruments, USA). The WP concentrations were determined by perchloric acid digestion [32] and the molybdate method, and SRP concentrations were determined colorimetrically, using the automatic spectrophotometer (QuickChem 8500, Lachat Instruments, USA). The soluble organic P fraction (P-ORG) in the water soil extract was then calculated as the difference between WP and SRP. Oxalate-extractable P (P-OX), representing soil P bound to Al and Fe oxyhydroxides and organometallic complexes, was determined by extraction of 0.5 g of the dry soil (60 °C, 17 h, 2 mm fraction) with 50 mL of acid ammonium oxalate solution (0.2 M H2C2O4 + 0.2 M (NH4)2C2O4; pH = 3; Cappo [33] modified by Kopáček, et al. [34]). Concentration of oxalate-extractable reactive P (RP-OX) was measured colorimetrically according to [35] and total oxalate extractable P (P-OX, more tightly bound fraction in comparison to RP-OX) was determined according to [32]. Exchangeable base cations (BC; sum of Ca2+, Mg2+, Na+ and K+) were determined by successive extraction of 2.5 g of dried soil (60 °C, 17 h, 2 mm fraction) with 50 mL of a 1 M NH4Cl solution for 1, 1 and 15 h. Their concentrations were measured in combined extracts by ICP-MS (8800 Triple Quadrupole ICP-MS analyser, Agilent Technologies, USA).

2.3.2. Soil Microbial Biomass and Extractable Organic Carbon

Soil microbial biomass C (CMB), N (NMB) and P (PMB) were measured by the fumigation-extraction method. In the case of CMB and NMB, fresh soil samples (5 g) were placed into 100 mL glass flasks in two sets (five true replicates). One set of the samples was extracted with 0.5 M K2SO4 (soil:K2SO4, 1:4, v/w, shaken 45 min/150 rpm, centrifuged 4000 rpm/10 min, filtered through 0.45 μm glass-fiber filter) while another set was extracted after fumigation (24 h) with amylene-stabilized chloroform. Extractable organic C (TOC) and total extractable N in non-fumigated and fumigated soil extracts were measured by LiquiTOC II (Elementar, Germany). CMB and NMB were then calculated as the difference in TOC and total extractable N, respectively, between fumigated and non-fumigated soils, corrected by the factors of 0.38 for CMB [36] and 0.54 for NMB [37]. PMB was analogically determined as the difference in NaHCO3 extractable reactive P concentrations (soil:NaHCO3, 1:15, v/w, shaken 45 min/150 rpm, centrifuged 4000 rpm/10 min, filtered through qualitative filter paper, Whatman, Cytiva, USA) in chloroform-treated and untreated soil samples [38]. The calculated difference was corrected for incomplete extraction of PMB using the conversion factor 0.4 and for incomplete recovery of reactive P from the soil due to adsorption. To estimate the reactive P recovery, a spike of standard KH2PO4 solution was added to the extractant and its recovery over the extraction period was measured.

2.3.3. Extracellular Hydrolytic Enzyme Activity

We determined extracellular hydrolase activities [β-glucosidase (BG), cellobiohydrolase (CEL), acid phosphatase (PME), N-acetyl-glucosaminidase (NAG) and leucine aminopeptidase (LEU)] using a fluorometric microplate assay [39]. One gram of soil (five replicates) was suspended in 100 mL of distilled water and treated with the ultrasonic bath (4 min). The concentrations of the methylumbelliferyl and 7-aminomethyl-4-coumarin substrates used were selected in a preliminary experiment in which 50, 100 and 300 μmol/L solutions of each substrate were used. The concentrations of the substrate with the highest enzymatic activities (saturated enzyme) were selected for the subsequent measurement. It was 50 μM in all cases. A volume of 200 μL of the suspension was then added to 50 μL of the substrate solution and the plates were incubated at 20 °C for 120 min. Fluorescence was quantified at an excitation wavelength of 365 nm and an emission wavelength of 450 nm (Infinite F200 Microplate Reader, TECAN, Germany). The specific enzymatic activity (CMB specific ENZ activity) was calculated as the sum of enzymatic activity divided by microbial biomass C. The sum of C-enzymatic activity (C-ENZ; BG + CEL) and N-enzymatic activity (N-ENZ; LEU + NAG) was calculated.

2.3.4. DNA Extraction and Quantification

Soil DNA was isolated from 0.25 g of soil using DNEasy PowerSoil Pro Kit, (Qiagen, Germantown, MD, USA) according to the manufacturer’s protocol. Quantitative PCR of bacterial and fungal marker genes (16S rRNA and 18S rRNA genes, respectively) was performed on the StepOne system (Thermo Fisher Scientific, USA) using FastStart SybrGREEN Roche R © Supermix (Roche, Schwitzerland) as described previously [40]. Bacteria/fungi ratio was calculated as the count of 16S copies divided by 18S copies.

2.3.5. Microbial Community Composition Analysis and Lifestyle Assignment

Soil microbiome composition was assessed by amplicon sequencing performed on the Illumina HiSeq 2500 platform. The selected PCR primers pairs were 515F/806R (V4 region, bacteria) and ITS1f/ITS2 (ITS region, fungi) [41,42]. A detailed description of library preparation and sequencing run was previously published [43]. Raw sequence data are deposited at the European Nucleotide Archive (https://www.ebi.ac.uk/ena) under the study accession number PRJEB72305 (accessed on 6 August 2024).
The detailed workflow of sequence data processing is available at https://github.com/chomic-kbe/EcMExcl, accessed on 6 August 2024. Briefly, bacterial paired-end reads were merged and length- and quality-filtered (min. 252 bp, max. expected errors 1) with the help of USEARCH v11 and PRINSEQ-lite 0.20.4 [44,45]. Curated sequences were then clustered to zOTUs by UNOISE3 [46] and taxonomy was annotated by BLAST [47] within QIIME v. 1.9.1 [48] with database Silva 138 [49]. In the case of fungi, only forward reads were processed. After ITS extraction using ITSxpress [50], only high-quality reads (min. length 140 bp, max. expected errors 1) were used to obtain zOTUs using the same tools as when processing bacteria. Additionally, fungal zOTUs were clustered to OTUs at 98.5% identity using USEARCH v11. QIIME embedded BLAST was used for taxonomical assignment according to UNITE 8.0 [51]. Lifestyle was assigned to fungal OTUs using FungalTraits [52].

2.4. Statistical Analyses

Data on soil composition and biochemistry were analysed in Statistica 14.0, using a factorial ANOVA with the factors: site, horizon and soil incubation (initial vs. final). This was followed by multiple comparison using Tukey’s HSD test. The data from the ion resin traps did not meet the assumption of a normal distribution and were therefore analysed using the Mann–Whitney U-test for independent groups. Microbial community data were evaluated in R, using phyloseq (R Core Development [53,54]). Samples with sequencing depths lower than 2000 reads per sample (one and two from fungal and bacterial dataset, respectively) that might be insufficient to cover the main pattern of the microbial community were discarded [41]. Bacterial zOTU and fungal OTU richness and Shannon indices were estimated from rarefied datasets (rarefaction to the size of the sample with minimal sequencing depth within the respective dataset; 3780 and 4634 for bacteria and fungi, respectively), while the other analyses (beta diversity based on the Bray–Curtis sample dissimilarity, differential abundance, etc.) were performed on non-rarefied data [55]. The effect of incubation on the composition of soil microbial communities was tested by PERMANOVA analysis of Bray–Curtis sample dissimilarities (based on square-root transformation zOTU/OTU relative abundance) (R package vegan [56]). The effect of soil incubation on bacterial and fungal richness and the Shannon index and relative abundance of fungal lifestyles was tested using generalized linear models and estimated marginal means (emmeans, [57]). Changes in abundance of fungal genera and OTUs with unclear genus assignment, and bacterial orders and genera prior to and after incubation were assessed by differential gene expression analysis (DESeq2, [58]).

3. Results

3.1. Initial Soil Composition and Biochemistry

Some characteristics of the composite litter and topsoil samples differed between the CT and PL sites at the beginning. The pH in CT soils was lower than the pH of PL soils (3.8–4.1 vs. 3.8–4.3; Table S1). The CT soils also contained less exchangeable base cations than the PL soils. The litter at both sites had similar TC, TN and TP concentrations, while the CT topsoil was richer in TC and TN than the PL topsoil (Table S1). The concentration of available mineral N (N-NO3 + N-NH4) was higher in the CT than PL soils (0.88 vs. 0.69 µmol N g−1 in the litter and 0.52 vs. 0.32 µmol N g−1 in the topsoil, Table 1), but concentrations of available P forms (SRP, P-ORG) and P-OX were similar (Table S2). The RP-OX concentration was the highest in the CT topsoil (Table S2). The total activity of hydrolytic enzymes was two to three times higher in the CT litter than in all other soils (F = 9.8, p < 0.007, Table S3), except for leucine aminopeptidase and acid phosphatase which were like the other soils. The sites did not differ in CMB, NMB and PMB, but the PL soils contained more bacterial 16S rRNA genes (Table 1) and extractable TOC than the CT soils. The specific ENZ activity did not differ between the sites (Table 1).

3.2. Initial Soil Microbiome Composition

The composition of the soil microbiome was typical for acid forest soils in both sites. The EcM fungi genera were dominated by Tylospora, Piloderma, Russula, Craterellus and Cortinarius and together represented ~25% of all fungal OTU in litter at both sites, but significantly more in topsoils (48% and 65% in the PL and CT sites, respectively). The SAP fungi formed between 10%–30% of fungal OTUs in the soils. The abundant saprotrophic fungal genera were Cladophialophora, Mortierella, Luellia, Fimetariella or Penicillium. There were also fungi with variable saprotrophic and/or biotrophic capabilities: Meliniomyces, Oidiodendron, Pezoloma and Trichoderma. For part of the fungal community, lifestyle could not be assigned, particularly due to unknown genus classification. Soils were mutually dominated by the same bacterial orders at both sites: Acidobacteriales, Subgroup 2 (Acidobacteriae), Frankiales, Rhizobiales, Acetobacterales and WD260. Alpha diversity was similar in the PL and CT soils (Supplementary Materials: alpha_div), but the soils differed in relative abundances of several fungal and bacterial groups (for details see Supplementary Materials: deseq_bac_litter; deseq_bac_topsoil; deseq_fun_litter; deseq_fun_topsoil).

3.3. Soil Response to Incubation without Root Access

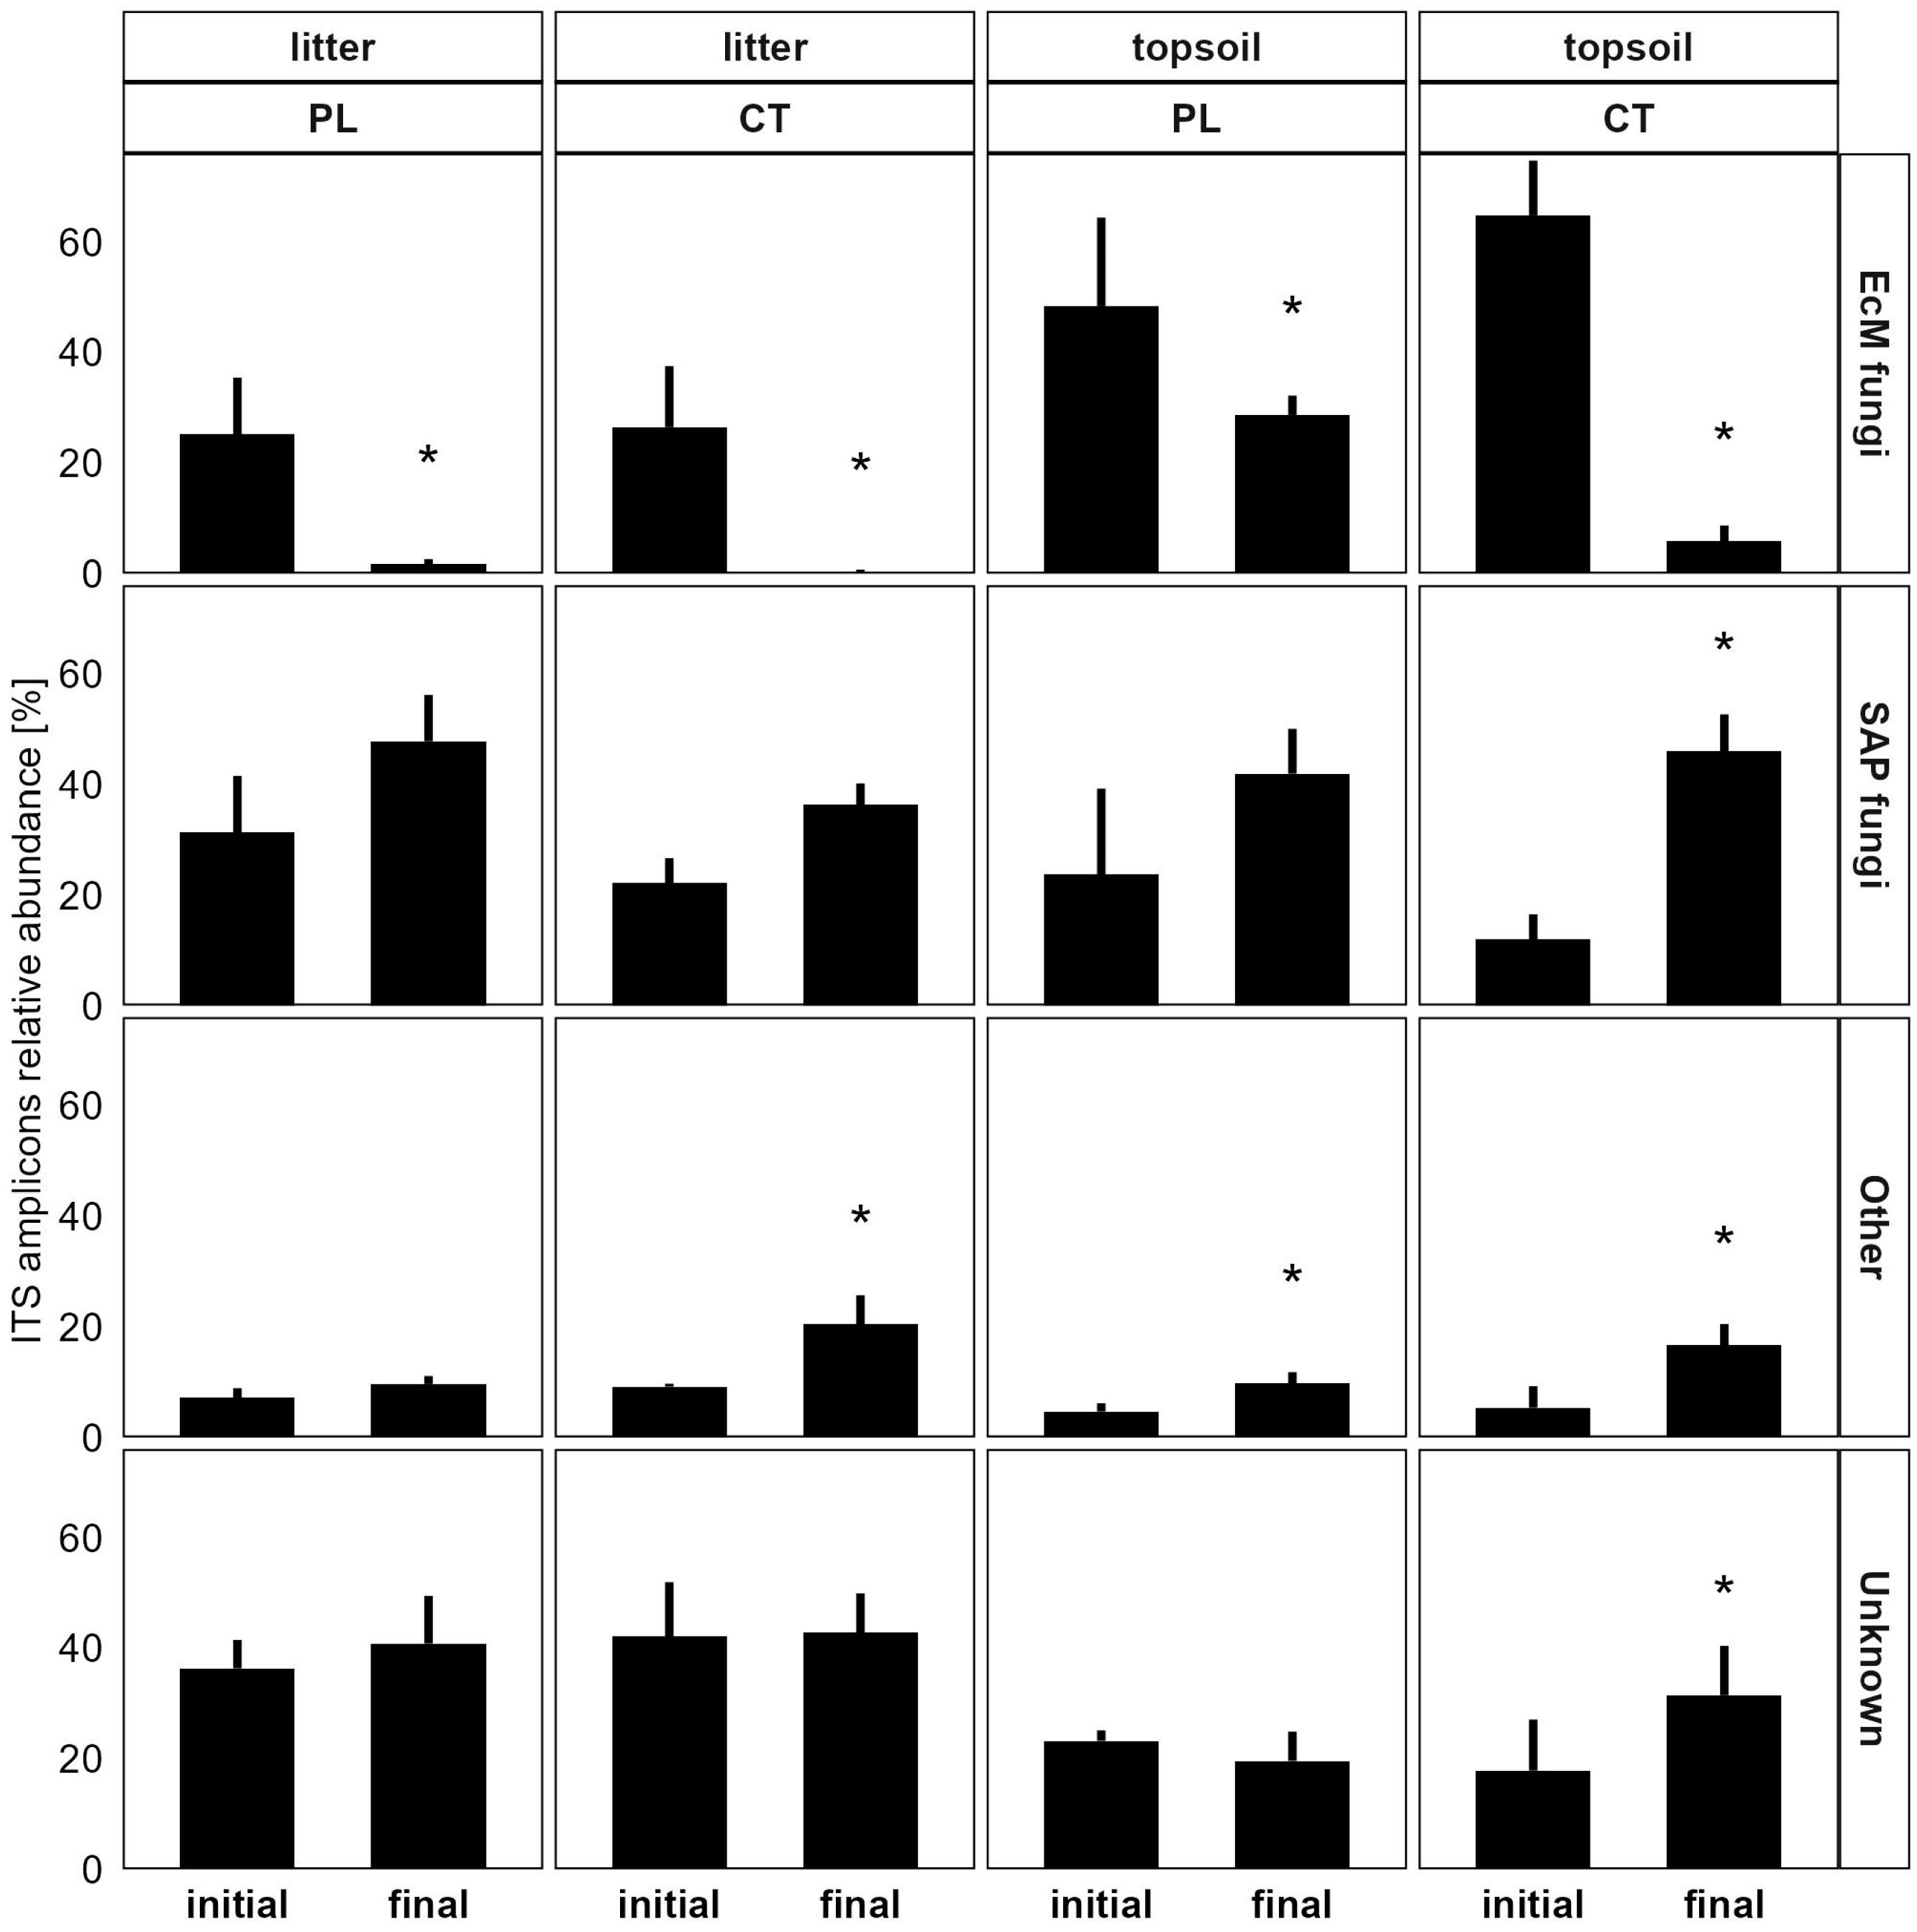
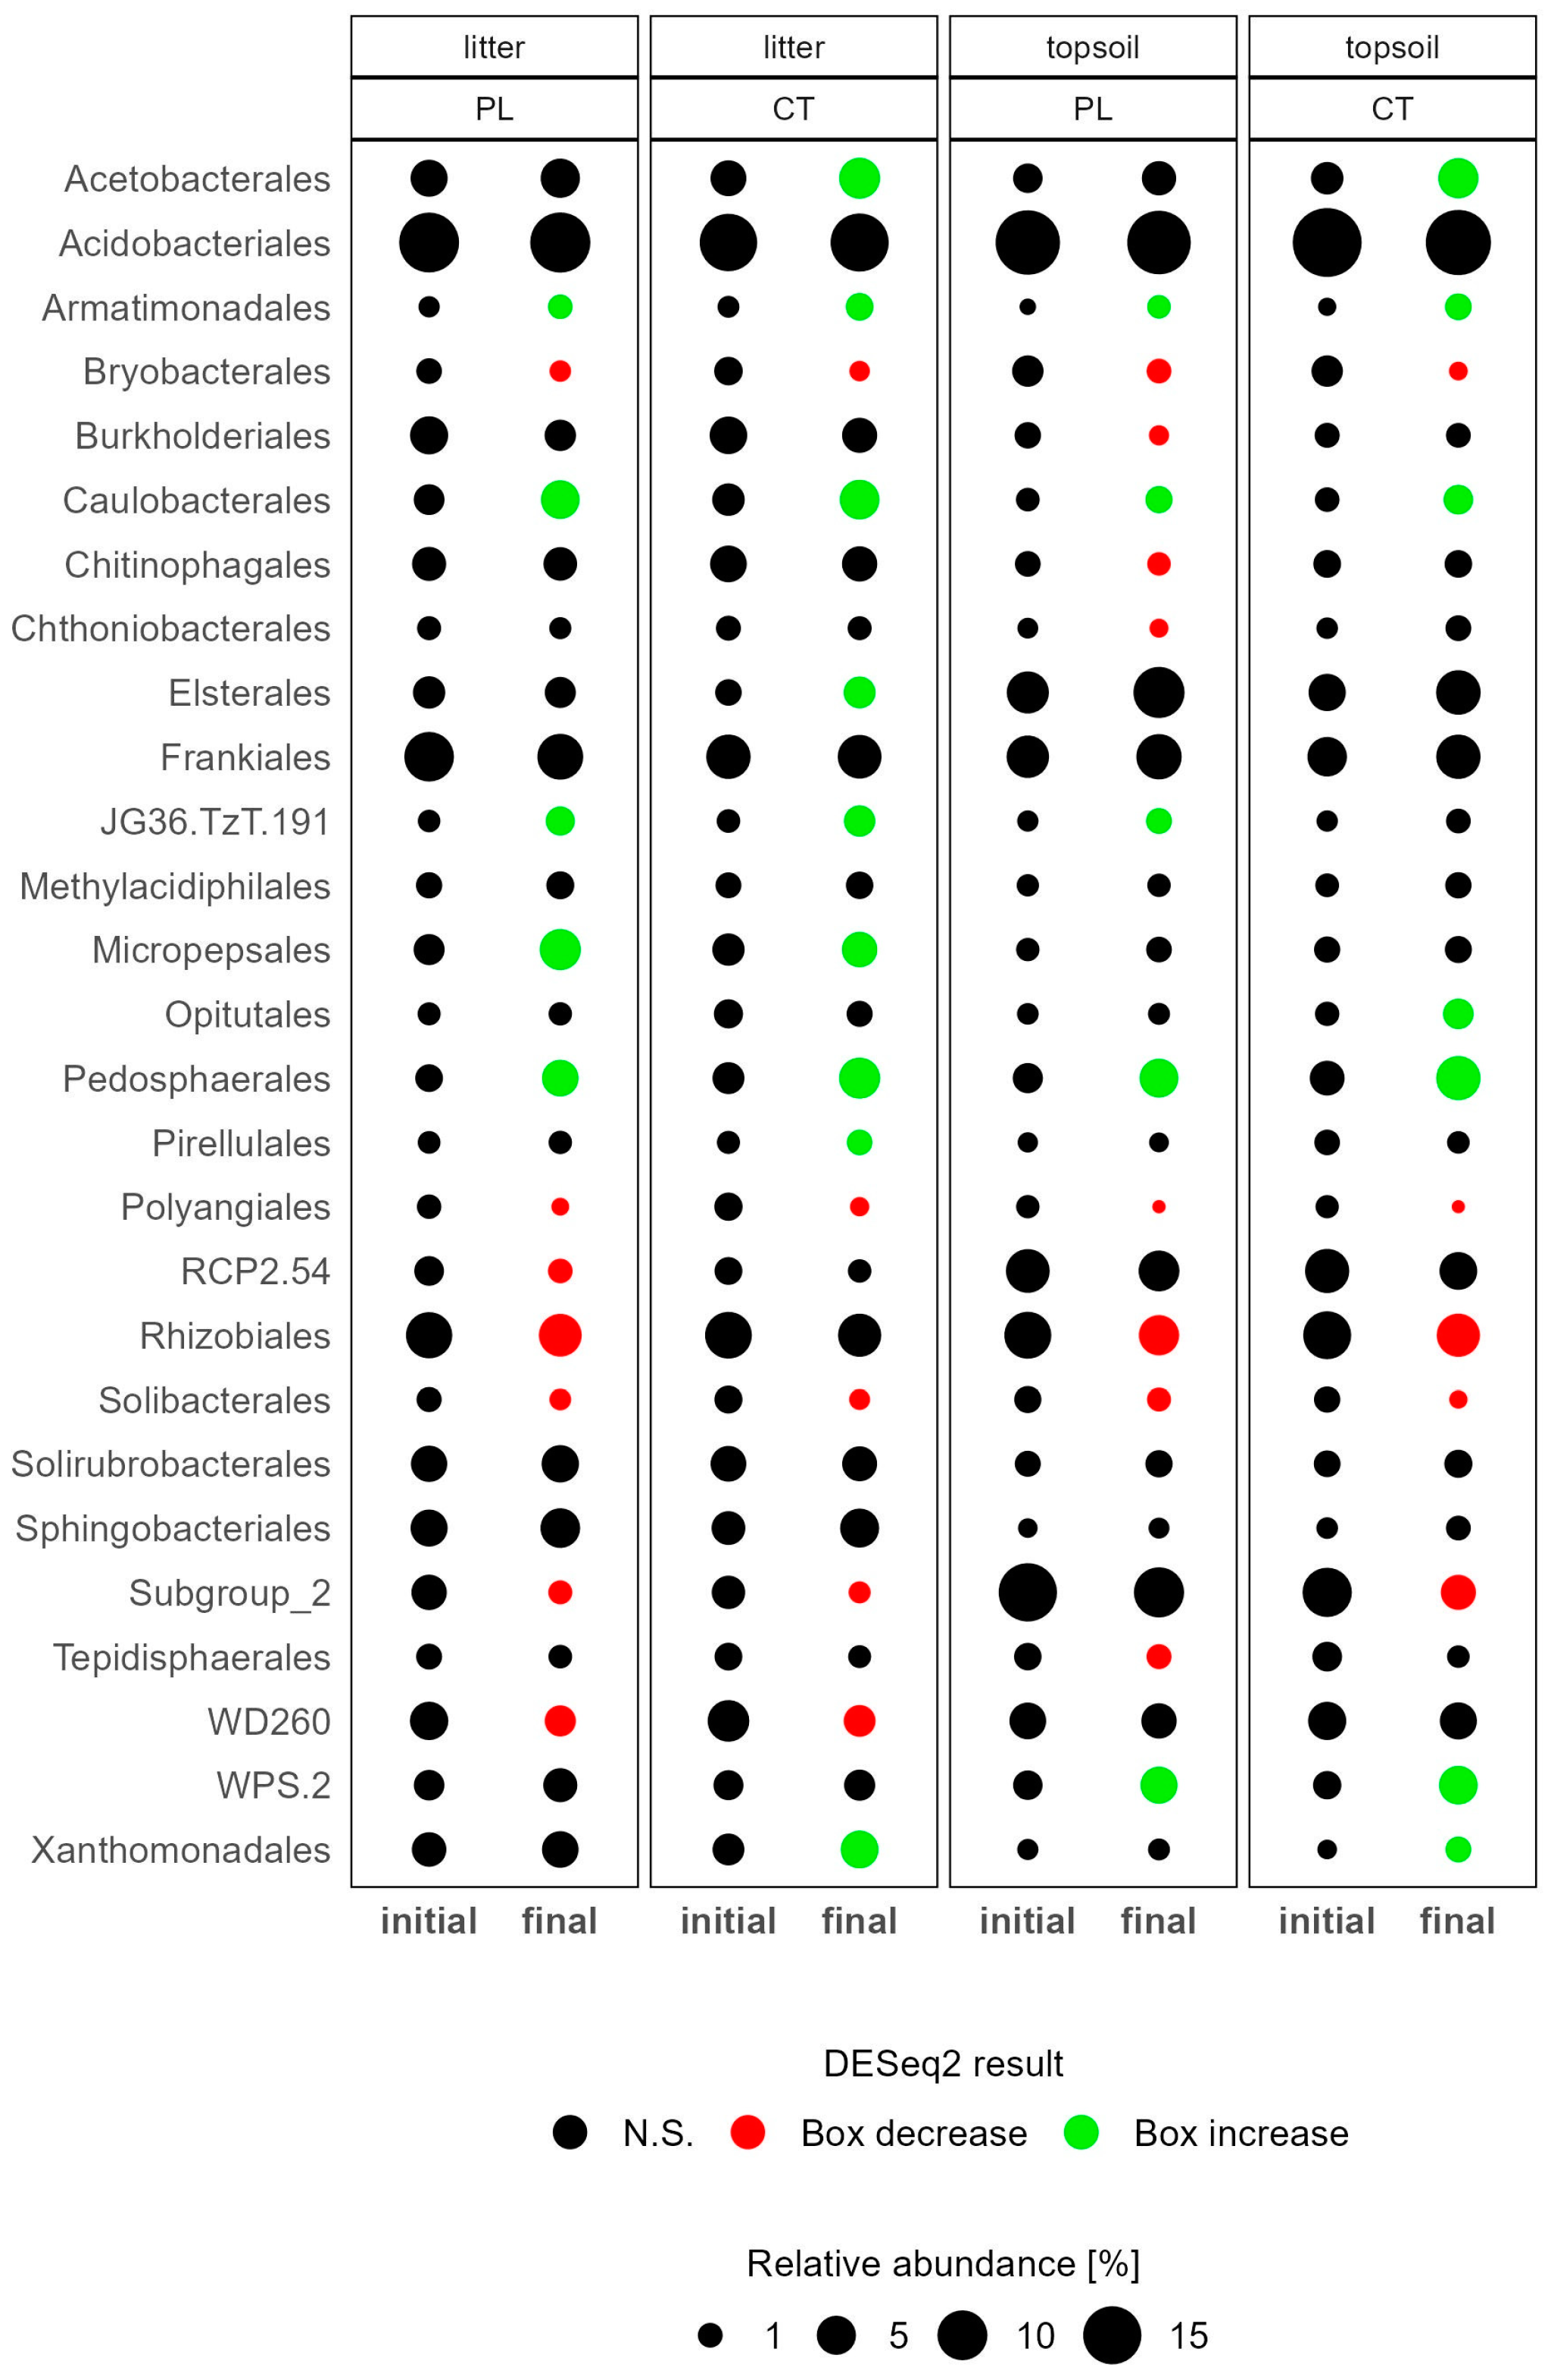
3.3.1. Soil Microbiome Response

Field incubation of soils without root access shifted their microbiome composition (Supplementary Materials: PERMANOVY). The relative abundance of all EcM fungi genera profoundly decreased after incubation (F = 77, p < 0.001) from ~25% of all fungal OTUs to 0.4% and 1.7% in the CT and PL litter, respectively. A more than tenfold decrease was observed in the CT topsoil, while a less pronounced decrease by 29% of all fungal amplicons occurred in the PL topsoil due to less pronounced decreases in Tylospora (namely T. fibrillosa) and Russula (namely R. ochroleuca) compared to the other soils (Figure 1 and Figure 2).
The retreat of EcM fungi was complemented with an increase in summed relative abundance of SAP fungi (F = 51, p < 0.001) in all soils to ~40% of fungal OTUs, although the pairwise post-hoc comparison was significant in topsoils only (Figure 1). Whereas only Mortierella in the CT topsoil and Aphanobasidium in the PL litter increased their relative abundances significantly, a proportion of many other saprotrophic genera also showed increasing tendency (Figure 2, Supplementary Materials: deseq_fun_litter, deseq_fun_topsoil). On the other hand, the proportion of Cladophialophora decreased in both topsoils (Figure 2B, Supplementary Materials: deseq_fun_topsoil). The litter was enriched in lichenized Umbilicaria at both sites and, in the CT litter, also enriched in plant pathogenic/saprotrophic Mycosphaerella (Figure 2A, Supplementary Materials: deseq_fun_litter).
Soil incubation caused a consistent shift in multiple bacterial orders across both sites and horizons (Figure 3, Supplementary Materials: deseq_bac_litter, deseq_bac_topsoil). Proportions of Armatimonadales, Caulobacterales, Jg36-TzT-191 and Pedosphaerales increased, while Bryobacterales, Polyangiales, Rhizobiales (namely Roseiarcus), Solibacterales and Subgroup 2 decreased in the incubated boxes compared to the initial soil conditions (Figure 3, Supplementary Materials: deseq_bac_litter, deseq_bac_topsoil). We further observed lower abundance of several root-associated genera from Burkholderiales and Rizobiales, e.g., Burkholderia-Caballeronia-Paraburkholderia, Pandoraea, Massilia and Roseiarcus, especially in topsoils (Supplementary Materials: deseq_bac_genus). Additionally, Acetobacterales and Xanthomonadales significantly increased in both CT litter and topsoil, WPS-2 increased in both topsoils and Micropepsales increased in both litters (Supplementary Materials: deseq_bac_litter, deseq_bac_topsoil). Despite significant changes in the structure of both fungal and bacterial communities, their richness and Shannon indexes remained unchanged (Supplementary Materials: alpha div).

3.3.2. Soil Biochemistry Changes

The soil properties changed consistently in boxes at both sites (no interaction was observed between the treatment and the site). While both litter horizons lost about 15%–21% of TC, ~10% of TN and ~5% of TP compared to their original concentrations during field exposure, their respective concentrations increased in the topsoils (Figure S3, significant interaction treatment × horizon).
During incubation, concentrations of CMB and NMB decreased by ~50%, while the PMB concentrations increased by 2–4 times in both horizons at both sites (Table 1). As a result, the microbial biomass became enriched with P. The molar CMB/PMB ratio of the microbial biomass decreased on average from 152 to 32 in the litter and from 122 to 18 in the topsoil, and the molar NMB/PMB ratio decreased from ~10 to 2 in both horizons at both sites (Table 1).
The total (F = 101, p < 0.001) and also the specific activity of the hydrolytic enzymes increased, which was mainly due to the higher activity of the C-mining hydrolases (Figure 4, F = 201, p < 0.001), i.e., of BG (F = 187, p < 0.001) and CEL (F = 185, p < 0.001), as well as the increased activity of PME (F = 32, p < 0.001, Figure 4, S4, Table 1), in both horizons and catchments. An exception was the CT litter, where the activity of the C-mining hydrolases was already very high initially. The relative proportion of C-mining hydrolases in the total hydrolytic activity increased from 20–30% at the beginning to 40–60% after 17 months of soil exposure in the field without root access (Figure S4).
The soil incubation had a significant effect on the availability of soil C, N and P. The concentrations of TOC decreased by about 6%–57% in the litter and topsoil at both sites (Table 1). Similarly, concentrations of N-NO3 decreased in both litter and topsoil from ~300 to 20 nmol g−1 and from ~200 to 50 nmol g−1 in the CT and PL sites, respectively. In contrast, the concentration of N-NH4 doubled in the litter and increased by an order of magnitude in both topsoils (change from 0.2 μmol g−1 to 3 μmol g−1). P was also mobilized during the incubation of the soils (Figure 5). The concentrations of SRP increased (F = 1676, p < 0.001) more in the topsoil than in the litter (interaction incubation × horizon, F = 33, p < 0.001) and more at the CT than PL site (site × incubation, F = 9.5, p = 0.004) (Figure 5). The RP-OX (F = 181, p < 0.001) and P-OX (F = 10, p = 0.003) concentrations also increased in both horizons, but markedly in both topsoils rather than litters. Excess P leaked out in 2–6 times greater quantities from the box-incubated soils than from the surrounding control soils, with P-PO4 losses from the incubated PL soils being more pronounced than from the CT soils (Figure 6).

4. Discussion

We focused on the role of the soil microbiome in controlling P availability and potential leaching from coniferous forests by mimicking soil organic matter decomposition following forest disturbance. In accord with our hypotheses, we have shown that the predominance of saprotrophs over EcM fungi during soil incubation resulted in a significant P mobilization in the soil in less than two years. The quantities of the exchangeable P bound to organometallic complexes, P immobilized in the microbial biomass, as well as concentrations of the most mobile water-extractable P forms increased. At the same time, P leaching from the soil increased by a factor of 2–6.

4.1. Microbiome Changes

Despite the initial differences in soil chemistry and microbiome composition, the soils at both sites responded similarly. At both sites, the abundance of EcM fungi decreased to only a few percent of all fungal OTUs in the litter but also in topsoil, where they originally accounted for ≥50% of fungal OTUs. The dominant position of EcM fungi was taken over by SAP fungi following soil incubation, which made ~40%–50% of fungal amplicons. Simultaneously, the decrease in the bacteria/fungi ratio suggests that the SAP fungi became the superior group among the soil microbiomes. The soil incubation and therewith the associated retreat of EcM fungi (i.e., disappearance of ectomycorrhizosphere) and change in soil C, N and P availability induced shifts also in bacterial communities. We observed a consistent pattern of shifts in the relative abundance of several bacterial orders across soils and horizons. In terms of functional composition, there was no profound change, as both initial and final soils were similarly dominated by generally oligotrophic and often acid-tolerant bacterial groups typical of spruce forest soils [43,59]. However, among the groups with increasing (e.g., Armatimonadales, Caulobacterales, Pedosphaerales) and decreasing abundance (e.g., Bryobacterales, Solibacterales), groups with potent saprotrophic abilities (capable of breakdown of polymeric substances) [60,61,62], as well as groups whose ecology remains largely unknown appear. Uncertain taxonomic assignment at higher resolutions of zOTUs further limits well-supported interpretations. Nevertheless, the decay of roots and the absence of their EcM fungi in incubated soils was reflected in a decrease in bacteria typical for this C-rich and highly active soil microhabitat—ectomycorrhizosphere-associated copiotrophic bacteria (e.g., Roseiarcus, Burkholderia-Caballeronia-Paraburkholderia, Pandoraea and Massilia) and bacterial predators (Polynagiales) that feed on active microbial biomass in the vicinity of roots [63,64,65,66,67].

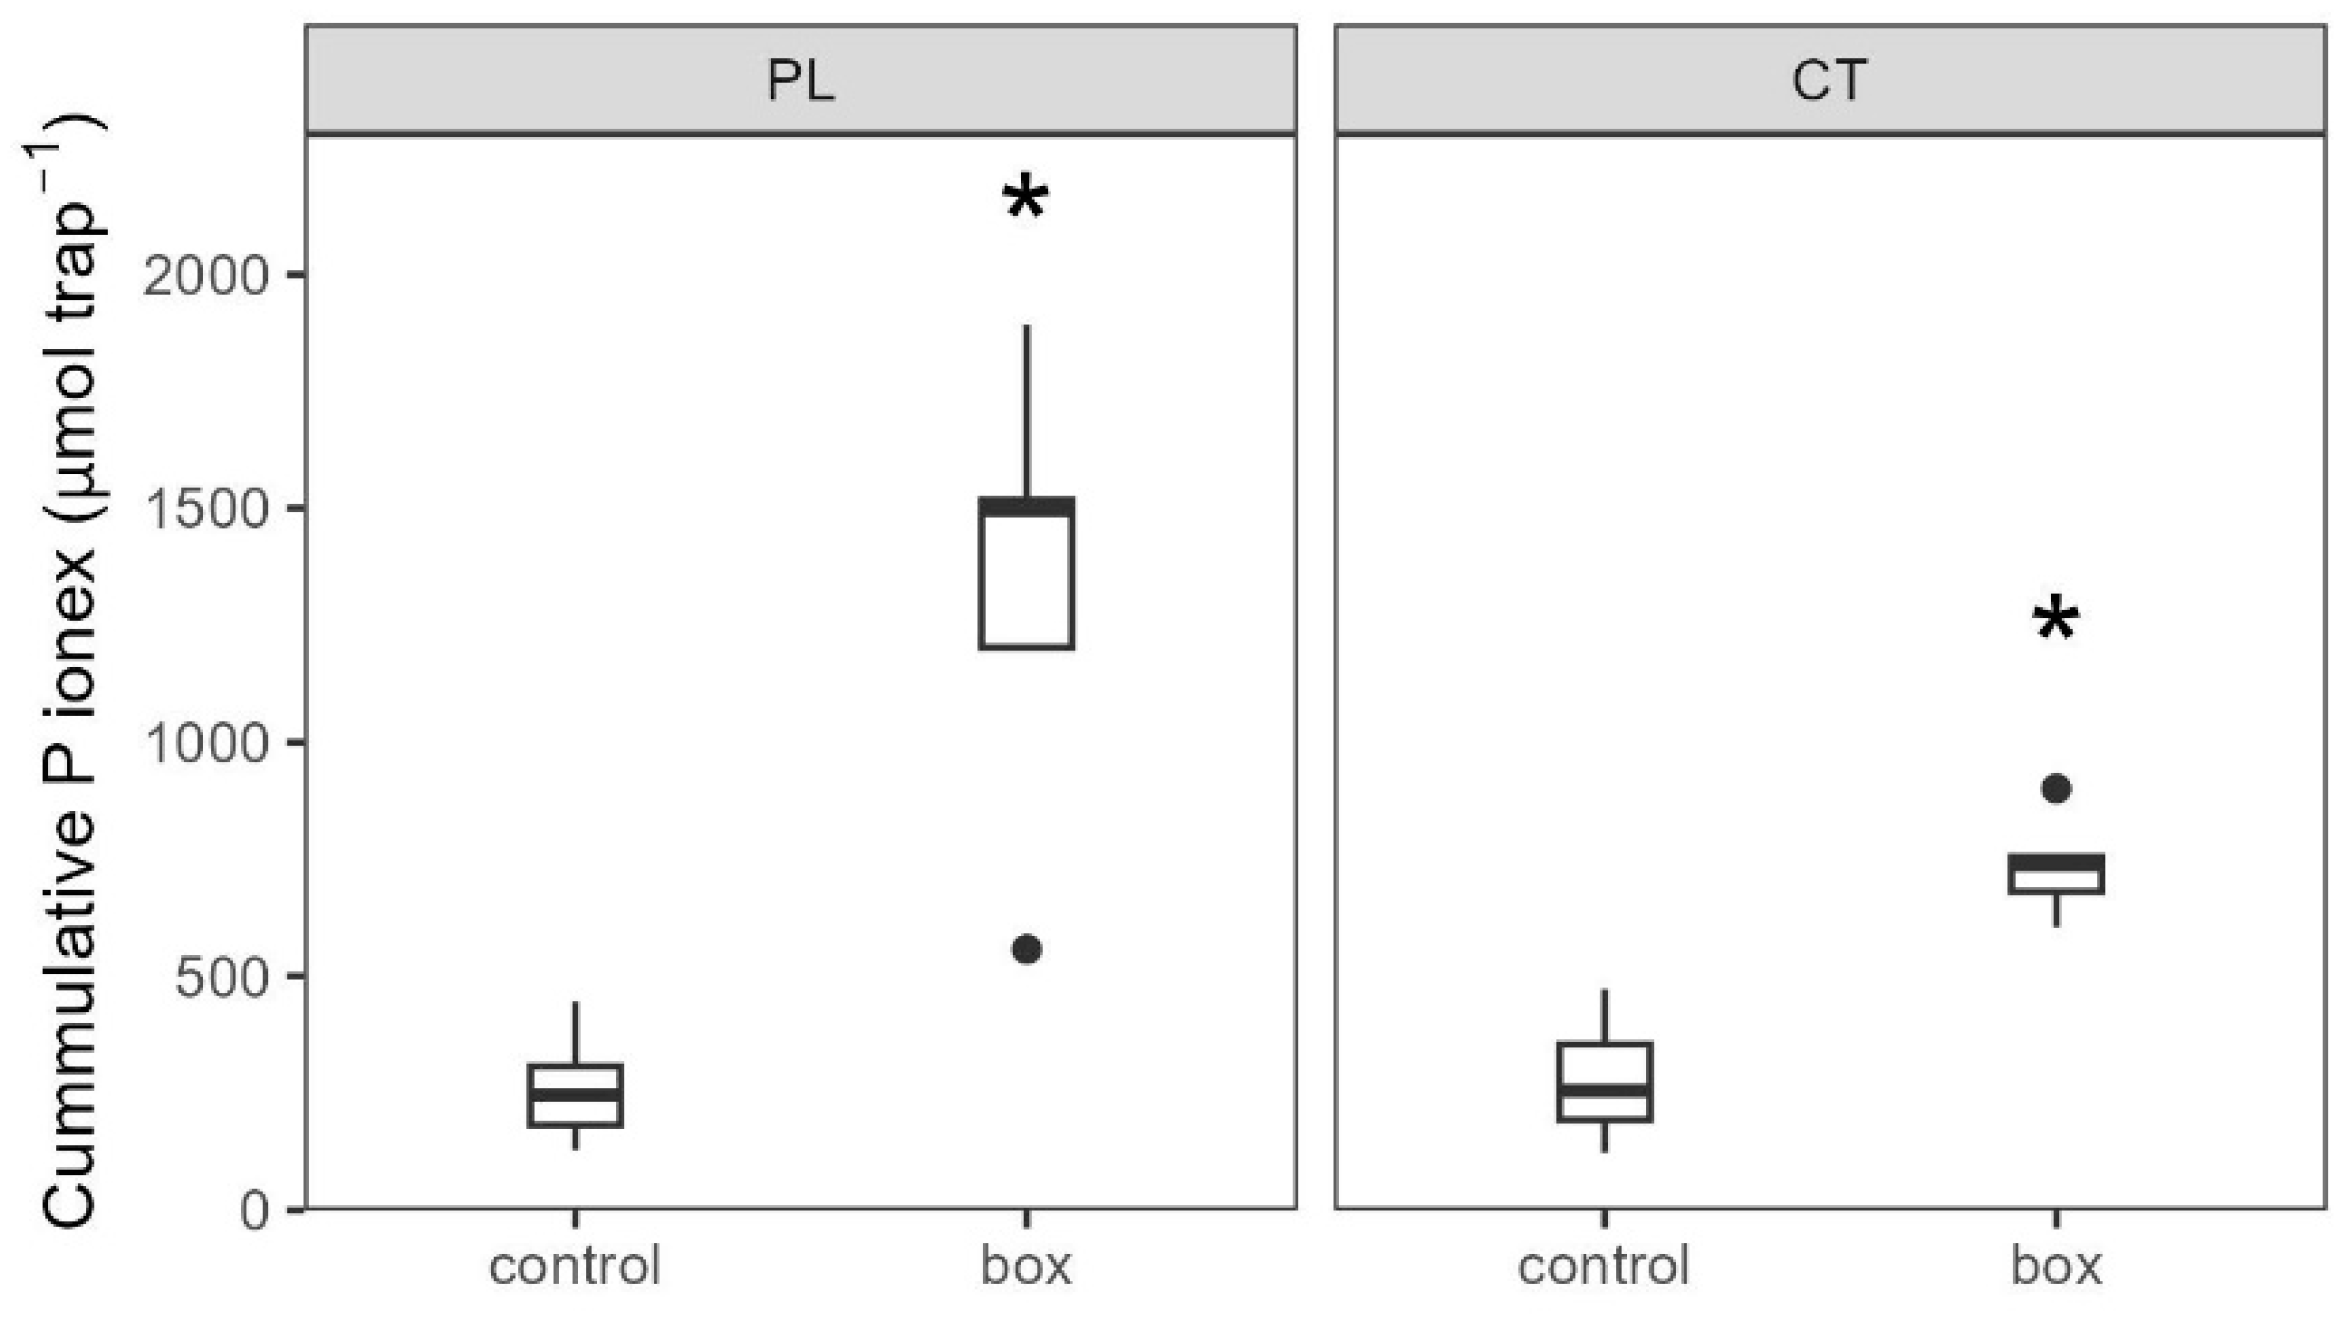
4.2. Intensification of P Cycling

In the presence of EcM fungi, the decomposition of soil organic matter and the associated nutrient mineralization might be suppressed by the Gadgil effect [12]. One of the presumed mechanisms of this phenomenon is the competitive pressure against SAP fungi resulting from the high demand and more efficient N uptake by EcM fungi [7]. After the disappearance of EcM fungi during soil incubation, the CMB halved. Similarly with our results, Averill and Hawkes [11] showed in their mesh-bags experiment that the removal of ectomycorrhizal symbionts significantly reduced CMB. This is also in line with the observations of Högberg and Högberg [14] after experimental tree girdling and supports their conclusion that EcM fungi constitute a major part of the microbial biomass of the coniferous forest soils.
The cessation of N uptake by plants–EcM associations increased the overall availability of mineral N in the soil and opened a niche for saprotrophs. This led to higher relative abundance of SAP fungi and increased saprotrophic activity, which was manifested by the increased production of extracellular enzymes, mainly C-mining enzymes, and phosphatases. Specific enzyme activity increased by 2–5 times, indicating a substantial increase in the activity of the saprotrophic community. This together with reduced TOC concentration also indicated a deepening of microbial C limitation compared to the initial soil conditions, caused by the elimination of exudation and depletion of the most readily available organic C sources in the soil during incubation.
In addition to the increase in C-mining enzymes, we observed a significant increase in acid phosphatase activity releasing phosphates from organics, which is consistent with field measurements from forests shortly after tree dieback [17]. This, in combination with the lack of P immobilization by the plant–EcM associations, was accompanied by a huge P allocation in the microbial biomass and a concurrent increase in concentrations of available P (SRP, P-ORG) and bound P forms (RP-OX, P-OX) in the soils. The excess P conditions resulted in an increased leaching of P-PO4 from the boxes into the ion-exchange resin traps. Our results suggest that saprotrophs may be largely responsible for the mobilization of organic P from soil organic matter under certain environmental conditions, as noticed by others [68,69]. We clearly show that when the niche for saprotrophs is released after the EcM retreat, the activity of hydrolytic enzymes, not only those that break down C but also nutrients, is triggered by the increased decomposition of organic matter. The interaction between EcM fungi and saprotrophs thus appears to control not only the C and N cycles, as is commonly reported, but also P, which has been less studied to date. This means that EcM fungi likely limit the production of phosphatases by saprotrophs to some extent. However, as EcM fungi (and roots themselves, [70]) are also capable of P hydrolysis from organic substrates, the potential contribution of both groups, EcM fungi and saprotrophs, remains under debate [26].
The change in microbial community composition towards the dominance of saprotrophs was associated with a considerable change in microbial elemental stoichiometry (reviewed in [71]). In our experiment, the molar NMB/PMB ratio decreased from 8–13 at the beginning of the experiment to very low values of about 1–3 at the end, indicating an enormous allocation of P to the microbial biomass. In line with our results, Zhang and Elser [72] pointed out the generally lower N/P ratio of saprotrophic compared to mycorrhizal fungal biomass in their meta-analysis across various microbiomes. Mouginot, et al. [73] reported a minimum value of 7 for the N/P ratio in microbial biomass when the nucleic acid content of the microbial cell was about 50%. A lower NMB/PMB ratio <5 can theoretically be achieved if the cell accumulates P-storage compounds such as polyphosphates that can represent up to 20% of cellular dry weight under P-rich conditions [74]. Čapek, et al. [75] have demonstrated a presence of polyphosphates reaching up to half of the PMB in soils from the PL and CT catchments (at our research sites) and have shown that the NMB/PMB ratio can even drop to 3 when polyphosphates are formed by soil microbial biomass. We thus suggest that the observed increase in PMB and a drop in the NMB/PMB ratios below 3 in both soils after soil incubation indicate that the microbiome accumulated large amounts of polyphosphates under conditions of high P availability and the P content of the microbial biomass had probably reached its maximum. Polyphosphates can also serve as metal ions chelators [74], being formed, for example, in conditions of increased aluminium toxicity [76]. However, we have no direct evidence for this mechanism running in our experiment except the significantly increased concentrations of oxalate-extractable aluminium in the soils at the end of the experiment (~16 vs. 25 µmol g−1, initial vs. final, respectively, in both soils on average).
Either way, the results show that under conditions of root environment interruption, e.g., due to harvesting or stand-replacing disturbance, the microbial investment in the P recovery increases, and therefore, the removal of root activity may lead not only to an increase in N but also P mobility and its potential losses, as was shown in our previous studies [23,77]. The increased decomposition and mineralization activity of the saprotrophs could be one of the most important mechanisms behind this phenomenon.
We are aware that our experiment is a simplification of the conditions that occur after a disturbance in the forest. Our results from boxes incubated in the field refer to extreme conditions in which the roots, and their activity, are severely limited. They show that this situation leads to increased P loss from the soil. However, the disturbance regimes create a broad mosaic of abiotic and biotic soil conditions. As has been shown, trees that remain alive after the disturbance are an important source of habitats that supports mycorrhizal survival and activity even within a few meters of the tree [78]. Thus, the heterogeneity of the post-disturbance soil environment and the surviving trees could reduce P losses from soils.

5. Conclusions

Our experiment with the long-term field incubation of coniferous forest soils without root access led to an intensification of soil P cycling. P availability increased in both the labile and bound fractions, and phosphates were leached from the soils. This was probably the effect of increased enzymatic mining of soil organic matter by surviving microorganisms, including SAP fungi. The change in the microbiome composition towards a dominance of saprotrophs was associated with a significant change in elemental stoichiometry, consisting of a high allocation of P in the microbial biomass and possibly the formation of polyphosphates. In the context of our results, partial harvesting in contrast to clearcut seems meaningful in terms of preventing P losses from the soil and reducing the risk of water bodies eutrophication.

Supplementary Materials

The following supporting information can be downloaded at: https://www.mdpi.com/article/10.3390/f15081378/s1, Figure S1: Location of Plešné and Čertovo lakes in Europe and maps of their catchments; Figure S2: Photo of incubation boxes and the preparation of ion exchange traps; Table S1: Initial chemical characteristics of litter and topsoil composite samples; Table S2: Initial concentrations of P forms of litter and topsoil composite samples; Table S3: Initial hydrolytic enzyme activity of litter and topsoil composite samples; Figure S3: Relative change (%) in the concentration of total soil carbon (TC), nitrogen (TN) and phosphorus (TP); Figure S4: Changes in relative proportion of enzyme activity. Soil microbiome response in xls format: alpha_div, datasec_bac_litter, datasec_bac_topsoil, datasec_fun_litter, datasec_fun_topsoil, permanovy, datasec_bac_genus. Reference [79] is cited in the supplementary materials.

Author Contributions

J.K. (Jiří Kopáček), P.Č., M.C., K.T. and J.K. (Jiří Kaňa) designed the study. K.T., M.C., J.K. (Jiří Kaňa), P.Č. and E.K. provided data and interpretation with J.K. (Jiří Kopáček) contribution. K.T. and M.C. performed the data analyses. K.T. and M.C. wrote the original draft with the input and editing of all co-authors. All authors have read and agreed to the published version of the manuscript.

Funding

This study was financed by the Czech Science Foundation project number: GA22-05421S.

Data Availability Statement

The data that support the finding of this study are available within this article and its supplementary material. Raw sequence data are openly deposited at the European Nucleotide Archive (https://www.ebi.ac.uk/ena, accessed on 6 August 2024) under the study accession number PRJEB72305. All other raw data are available from the corresponding author (KT) upon reasonable request.

Acknowledgments

We are grateful to the Šumava National Park officials for their helpfulness and long-term cooperation, and Ryan Ainsley Scott and Gabriela Scott Zemanová for the language corrections.

Conflicts of Interest

The authors declare no conflicts of interest.

References

  1. Bödeker, I.T.M.; Lindahl, B.D.; Olson, Å.; Clemmensen, K.E. Mycorrhizal and saprotrophic fungal guilds compete for the same organic substrates but affect decomposition differently. Funct. Ecol. 2016, 30, 1967–1978. [Google Scholar] [CrossRef]
  2. Hobbie, E.A. Carbon allocation to ectomycorrhizal fungi correlates with belowground allocation in culture studies. Ecology 2006, 87, 563–569. [Google Scholar] [CrossRef]
  3. Lindahl, B.D.; Tunlid, A. Ectomycorrhizal fungi—Potential organic matter decomposers, yet not saprotrophs. New Phytol. 2015, 205, 1443–1447. [Google Scholar] [CrossRef]
  4. Zak, D.R.; Pellitier, P.T.; Argiroff, W.A.; Castillo, B.; James, T.Y.; Nave, L.E.; Averill, C.; Beidler, K.V.; Bhatnagar, J.; Blesh, J.; et al. Exploring the role of ectomycorrhizal fungi in soil carbon dynamics. New Phytol. 2019, 223, 33–39. [Google Scholar] [CrossRef]
  5. Averill, C.; Turner, B.L.; Finzi, A.C. Mycorrhiza-mediated competition between plants and decomposers drives soil carbon storage. Nature 2014, 505, 543–545. [Google Scholar] [CrossRef] [PubMed]
  6. Smith, G.R.; Wan, J. Resource-ratio theory predicts mycorrhizal control of litter decomposition. New Phytol. 2019, 223, 1595–1606. [Google Scholar] [CrossRef] [PubMed]
  7. Fernandez, C.W.; Kennedy, P.G. Revisiting the ‘Gadgil effect’: Do interguild fungal interactions control carbon cycling in forest soils? New Phytol. 2016, 209, 1382–1394. [Google Scholar] [CrossRef]
  8. LeBauer, D.S.; Treseder, K.K. Nitrogen limitation of net primary productivity in terrestrial ecosystems is globally distributed. Ecology 2008, 89, 371–379. [Google Scholar] [CrossRef] [PubMed]
  9. Gadgil, R.L.; Gadgil, P.D. Mycorrhiza and Litter Decomposition. Nature 1971, 233, 133. [Google Scholar] [CrossRef]
  10. Boberg, J.B.; Finlay, R.D.; Stenlid, J.; Ekblad, A.; Lindahl, B.D. Nitrogen and Carbon Reallocation in Fungal Mycelia during Decomposition of Boreal Forest Litter. PLoS ONE 2014, 9, e92897. [Google Scholar] [CrossRef]
  11. Averill, C.; Hawkes, C.V. Ectomycorrhizal fungi slow soil carbon cycling. Ecol. Lett. 2016, 19, 937–947. [Google Scholar] [CrossRef]
  12. Gadgil, P.D. Suppression of Litter Decomposition by Mycorrhizal Roots of Pinus radiata/Ruth L. Gadgil and P.D. Gadgil; New Zealand Forest Service: Wellington, New Zealand, 1975. [Google Scholar]
  13. Tedersoo, L.; Bahram, M. Mycorrhizal types differ in ecophysiology and alter plant nutrition and soil processes. Biol. Rev. 2019, 94, 1857–1880. [Google Scholar] [CrossRef]
  14. Högberg, M.N.; Högberg, P. Extramatrical ectomycorrhizal mycelium contributes one-third of microbial biomass and produces, together with associated roots, half the dissolved organic carbon in a forest soil. New Phytol. 2002, 154, 791–795. [Google Scholar] [CrossRef] [PubMed]
  15. Phillips, L.A.; Ward, V.; Jones, M.D. Ectomycorrhizal fungi contribute to soil organic matter cycling in sub-boreal forests. Isme J. 2014, 8, 699–713. [Google Scholar] [CrossRef]
  16. Čada, V.; Morrissey, R.C.; Michalová, Z.; Bače, R.; Janda, P.; Svoboda, M. Frequent severe natural disturbances and non-equilibrium landscape dynamics shaped the mountain spruce forest in central Europe. For. Ecol. Manag. 2016, 363, 169–178. [Google Scholar] [CrossRef]
  17. Štursová, M.; Šnajdr, J.; Cajthaml, T.; Bárta, J.; Šantrůčková, H.; Baldrian, P. When the forest dies: The response of forest soil fungi to a bark beetle-induced tree dieback. ISME J. 2014, 8, 1920–1931. [Google Scholar] [CrossRef] [PubMed]
  18. Griffin, J.M.; Turner, M.G. Changes to the N cycle following bark beetle outbreaks in two contrasting conifer forest types. Oecologia 2012, 170, 551–565. [Google Scholar] [CrossRef] [PubMed]
  19. Griffin, J.M.; Turner, M.G.; Simard, M. Nitrogen cycling following mountain pine beetle disturbance in lodgepole pine forests of Greater Yellowstone. For. Ecol. Manag. 2011, 261, 1077–1089. [Google Scholar] [CrossRef]
  20. Huber, C. Long lasting nitrate leaching after bark beetle attack in the highlands of the Bavarian Forest National Park. J Environ. Qual. 2005, 34, 1772–1779. [Google Scholar] [CrossRef]
  21. Cigan, P.W.; Karst, J.; Cahill, J.F.; Sywenky, A.N.; Pec, G.J.; Erbilgin, N. Influence of bark beetle outbreaks on nutrient cycling in native pine stands in western Canada. Plant Soil 2015, 390, 29–47. [Google Scholar] [CrossRef]
  22. Norton, U.; Ewers, B.E.; Borkhuu, B.; Brown, N.R.; Pendall, E. Soil Nitrogen Five Years after Bark Beetle Infestation in Lodgepole Pine Forests. Soil Sci. Soc. Am. J. 2015, 79, 282–293. [Google Scholar] [CrossRef]
  23. Kaňa, J.; Tahovská, K.; Kopáček, J. Response of soil chemistry to forest dieback after bark beetle infestation. Biogeochemistry 2013, 113, 369–383. [Google Scholar] [CrossRef]
  24. Du, E.; van Doorn, M.; de Vries, W. Spatially divergent trends of nitrogen versus phosphorus limitation across European forests. Sci. Total Environ. 2021, 771, 145391. [Google Scholar] [CrossRef] [PubMed]
  25. Clarholm, M.; Skyllberg, U.; Rosling, A. Organic acid induced release of nutrients from metal-stabilized soil organic matter—The unbutton model. Soil Biol. Biochem. 2015, 84, 168–176. [Google Scholar] [CrossRef]
  26. Jansa, J.; Finlay, R.; Wallander, H.; Smith, F.A.; Smith, S.E. Role of Mycorrhizal Symbioses in Phosphorus Cycling. In Phosphorus in Action: Biological Processes in Soil Phosphorus Cycling; Bünemann, E., Oberson, A., Frossard, E., Eds.; Springer: Berlin/Heidelberg, Germany, 2011; pp. 137–168. [Google Scholar]
  27. Kopáček, J.; Čapek, P.; Choma, M.; Cudlín, P.; Kaňa, J.; Kopáček, M.; Porcal, P.; Šantrůčková, H.; Tahovská, K.; Turek, J. Long-term changes in soil composition in unmanaged central European mountain spruce forests after decreased acidic deposition and a bark beetle outbreak. Catena 2023, 222, 106839. [Google Scholar] [CrossRef]
  28. Kopáček, J.; Hejzlar, J.; Kaňa, J.; Porcal, P.; Turek, J. The sensitivity of water chemistry to climate in a forested, nitrogen-saturated catchment recovering from acidification. Ecol. Indic. 2016, 63, 196–208. [Google Scholar] [CrossRef]
  29. Kaňa, J.; Kopáček, J.; Tahovská, K.; Šantrůčková, H. Tree dieback and related changes in nitrogen dynamics modify the concentrations and proportions of cations on soil sorption complex. Ecol. Indic. 2019, 97, 319–328. [Google Scholar] [CrossRef]
  30. Matějka, K. Disturbance-induced changes in the plant biomass in forests near Plešné and Čertovo Lakes. J. For. Sci. 2015, 61, 156–168. [Google Scholar] [CrossRef]
  31. Tahovská, K.; Čapek, P.; Šantrůčková, H.; Kaňa, J.; Kopáček, J. Measurement of in situ Phosphorus Availability in Acidified Soils using Iron-Infused Resin. Commun. Soil Sci. Plant Anal. 2016, 47, 487–494. [Google Scholar] [CrossRef]
  32. Kopáček, J.; Borovec, J.; Hejzlar, J.; Porcal, P. Spectrophotometric determination of iron, aluminum, and phosphorus in soil and sediment extracts after their nitric and perchloric acid digestion. Commun. Soil Sci. Plant Anal. 2001, 32, 1431–1443. [Google Scholar] [CrossRef]
  33. Cappo, K.A.; Blume, L.J.; Raab, G.A.; Bartz, J.K.; Engels, J.L. Analytical Methods Manual for the Direct/Delayed Response Project Soil Survey; US EPA: Las Vegas, NV, USA, 1987. [Google Scholar]
  34. Kopáček, J.; Kaňa, J.; Šantrůčková, H.; Picek, T.; Stuchlík, E. Chemical and Biochemical Characteristics of Alpine Soils in the Tatra Mountains and their Correlation with Lake Water Quality. Water Air Soil Pollut. 2004, 153, 307–328. [Google Scholar] [CrossRef]
  35. Wolf, A.M.; Baker, D.E. Colorimetric method for phosphorus measurement in ammonium oxalate soil extracts. Commun. Soil Sci. Plant Anal. 1990, 21, 2257–2263. [Google Scholar] [CrossRef]
  36. Vance, E.D.; Brookes, P.C.; Jenkinson, D.S. Microbial biomass measurements in forest soils—Determination of Kc values and tests of hypotheses to explain the failure of the chloroform fumigation incubation method in acid soils. Soil Biol. Biochem. 1987, 19, 689–696. [Google Scholar] [CrossRef]
  37. Brookes, P.C.; Landman, A.; Pruden, G.; Jenkinson, D.S. Chloroform fumigation and the release of soil-nitrogen—A rapid direct extraction method to measure microbial biomass nitrogen in soil. Soil Biol. Biochem. 1985, 17, 837–842. [Google Scholar] [CrossRef]
  38. Brookes, P.C.; Powlson, D.S.; Jenkinson, D.S. Measurement of microbial biomass phosphorus in soil. Soil Biol. Biochem. 1982, 14, 319–329. [Google Scholar] [CrossRef]
  39. Bárta, J.; Šlajsová, P.; Tahovská, K.; Picek, T.; Šantrůčková, H. Different temperature sensitivity and kinetics of soil enzymes indicate seasonal shifts in C, N and P nutrient stoichiometry in acid forest soil. Biogeochemistry 2014, 117, 525–537. [Google Scholar] [CrossRef]
  40. Tahovská, K.; Choma, M.; Kaštovská, E.; Oulehle, F.; Bárta, J.; Šantrůčková, H.; Moldan, F. Positive response of soil microbes to long-term nitrogen input in spruce forest: Results from Gårdsjön whole-catchment N-addition experiment. Soil Biol. Biochem. 2020, 143, 107732. [Google Scholar] [CrossRef]
  41. Caporaso, J.G.; Lauber, C.L.; Walters, W.A.; Berg-Lyons, D.; Lozupone, C.A.; Turnbaugh, P.J.; Fierer, N.; Knight, R. Global patterns of 16S rRNA diversity at a depth of millions of sequences per sample. Proc. Natl. Acad. Sci. USA 2011, 108, 4516–4522. [Google Scholar] [CrossRef]
  42. White, T.J.; Bruns, T.; Lee, S.; Taylor, J. Amplification and direct sequencing of fungal ribosomal RNA genes for phylogenetics. In PCR Protocols; Innis, M.A., Gelfand, D.H., Sninsky, J.J., White, T.J., Eds.; Academic Press: San Diego, CA, USA, 1990; pp. 315–322. [Google Scholar]
  43. Choma, M.; Tahovská, K.; Kaštovská, E.; Bárta, J.; Růžek, M.; Oulehle, F. Bacteria but not fungi respond to soil acidification rapidly and consistently in both a spruce and beech forest. Fems Microbiol. Ecol. 2020, 96, fiaa174. [Google Scholar] [CrossRef]
  44. Edgar, R.C. Search and clustering orders of magnitude faster than BLAST. Bioinformatics 2010, 26, 2460–2461. [Google Scholar] [CrossRef]
  45. Schmieder, R.; Edwards, R. Quality control and preprocessing of metagenomic datasets. Bioinformatics 2011, 27, 863–864. [Google Scholar] [CrossRef]
  46. Edgar, R. UNOISE2: Improved error-correction for Illumina 16S and ITS amplicon sequencing. BioRxiv 2016, 081257. [Google Scholar] [CrossRef]
  47. Altschul, S.F.; Gish, W.; Miller, W.; Myers, E.W.; Lipman, D.J. Basic local alignment search tool. J. Mol. Biol. 1990, 215, 403–410. [Google Scholar] [CrossRef]
  48. Caporaso, J.G.; Kuczynski, J.; Stombaugh, J.; Bittinger, K.; Bushman, F.D.; Costello, E.K.; Fierer, N.; Peña, A.G.; Goodrich, J.K.; Gordon, J.I.; et al. QIIME allows analysis of high-throughput community sequencing data. Nat. Methods 2010, 7, 335. [Google Scholar] [CrossRef]
  49. Quast, C.; Pruesse, E.; Yilmaz, P.; Gerken, J.; Schweer, T.; Yarza, P.; Peplies, J.; Glöckner, F.O. The SILVA ribosomal RNA gene database project: Improved data processing and web-based tools. Nucleic Acids Res. 2013, 41, 590–596. [Google Scholar] [CrossRef]
  50. Rivers, A.R.; Weber, K.C.; Gardner, T.G. ITSxpress: Software to rapidly trim internally transcribed spacer sequences with quality scores for marker gene analysis. F1000Research 2018, 7, 1418. [Google Scholar] [CrossRef]
  51. Abarenkov, K.; Nilsson, R.H.; Larsson, K.H.; Taylor, A.F.; May, T.W.; Frøslev, T.G.; Pawlowska, J.; Lindahl, B.; Põldmaa, K.; Truong, C.; et al. The UNITE database for molecular identification and taxonomic communication of fungi and other eukaryotes: Sequences, taxa and classifications reconsidered. Nucleic Acids Res. 2024, 52, D791–D797. [Google Scholar] [CrossRef]
  52. Põlme, S.; Abarenkov, K.; Henrik Nilsson, R.; Lindahl, B.D.; Clemmensen, K.E.; Kauserud, H.; Nguyen, N.; Kjøller, R.; Bates, S.T.; Baldrian, P.; et al. FungalTraits: A user-friendly traits database of fungi and fungus-like stramenopiles. Fungal Divers. 2020, 105, 1–16. [Google Scholar] [CrossRef]
  53. McMurdie, P.J.; Holmes, S. phyloseq: An R Package for Reproducible Interactive Analysis and Graphics of Microbiome Census Data. PLoS ONE 2013, 8, e61217. [Google Scholar] [CrossRef]
  54. R Core Team. R: A Lanaguage and Environment for Statistical Computing; R Foundation for Statistical Computing: Vienna, Austria, 2019. [Google Scholar]
  55. McMurdie, P.J.; Holmes, S. Waste Not, Want Not: Why Rarefying Microbiome Data Is Inadmissible. PLoS Comput. Biol. 2014, 10, e1003531. [Google Scholar] [CrossRef]
  56. Oksanen, J.; Blanchet, F.G.; Michael, K.; Kindt, R.; Legendre, P.; McGlinn, D.; Minchin, P.; O’Hara, R.B.; Simpson, G.; Solymos, P.; et al. Vegan Community Ecology Package Version 2.5-7 November 2020. 2020. Available online: https://cran.r-project.org/web/packages/vegan/index.html (accessed on 6 August 2024).
  57. Lenth, R.V. Emmeans: Estimated Marginal Means, aka Least-Squares Means. 2022. [Google Scholar]
  58. Love, M.I.; Huber, W.; Anders, S. Moderated estimation of fold change and dispersion for RNA-seq data with DESeq2. Genome Biol. 2014, 15, 550. [Google Scholar] [CrossRef]
  59. Choma, M.; Šamonil, P.; Kaštovská, E.; Bárta, J.; Tahovská, K.; Valtera, M.; Šantrůčková, H. Soil Microbiome Composition along the Natural Norway Spruce Forest Life Cycle. Forests 2021, 12, 410. [Google Scholar] [CrossRef]
  60. Nierman, W.C.; Feldblyum, T.V.; Laub, M.T.; Paulsen, I.T.; Nelson, K.E.; Eisen, J.; Heidelberg, J.F.; Alley, M.R.K.; Ohta, N.; Maddock, J.R.; et al. Complete genome sequence of Caulobacter crescentus. Proc. Natl. Acad. Sci. USA 2001, 98, 4136–4141. [Google Scholar] [CrossRef]
  61. Nixon, S.L.; Daly, R.A.; Borton, M.A.; Solden, L.M.; Welch, S.A.; Cole, D.R.; Mouser, P.J. Genome-Resolved Metagenomics Extends the Environmental Distribution of the Verrucomicrobia Phylum to the Deep Terrestrial Subsurface. Msphere 2019, 4, 10-1128. [Google Scholar] [CrossRef]
  62. Kulichevskaya, I.S.; Suzina, N.E.; Liesack, W.; Dedysh, S.N. Bryobacter aggregatus gen. nov., sp. nov., a peat-inhabiting, aerobic chemo-organotroph from subdivision 3 of the Acidobacteria. Int. J. Syst. Evol. Microbiol. 2010, 60, 301–306. [Google Scholar] [CrossRef]
  63. Petters, S.; Söllinger, A.; Bengtsson, M.M.; Urich, T. The soil microbial food web revisited with metatranscriptomics—Predatory Myxobacteria as keystone taxon? bioRxiv 2018, 373365. [Google Scholar] [CrossRef]
  64. Yu, F.; Liang, J.-F.; Song, J.; Wang, S.-K.; Lu, J.-K. Bacterial Community Selection of Russula griseocarnosa Mycosphere Soil. Front. Microbiol. 2020, 11, 347. [Google Scholar] [CrossRef]
  65. Peeters, C.; De Canck, E.; Cnockaert, M.; De Brandt, E.; Snauwaert, C.; Verheyde, B.; Depoorter, E.; Spilker, T.; LiPuma, J.J.; Vandamme, P. Comparative Genomics of Pandoraea, a Genus Enriched in Xenobiotic Biodegradation and Metabolism. Front. Microbiol. 2019, 10, 2556. [Google Scholar] [CrossRef]
  66. Ofek, M.; Hadar, Y.; Minz, D. Ecology of Root Colonizing Massilia (Oxalobacteraceae). PLoS ONE 2012, 7, e40117. [Google Scholar] [CrossRef]
  67. Uroz, S.; Oger, P.; Morin, E.; Frey-Klett, P. Distinct Ectomycorrhizospheres Share Similar Bacterial Communities as Revealed by Pyrosequencing-Based Analysis of 16S rRNA Genes. Appl. Environ. Microbiol. 2012, 78, 3020–3024. [Google Scholar] [CrossRef]
  68. Talbot, J.M.; Bruns, T.D.; Smith, D.P.; Branco, S.; Glassman, S.I.; Erlandson, S.; Vilgalys, R.; Peay, K.G. Independent roles of ectomycorrhizal and saprotrophic communities in soil organic matter decomposition. Soil Biol. Biochem. 2013, 57, 282–291. [Google Scholar] [CrossRef]
  69. Kleber, M.; Lehmann, J. Humic Substances Extracted by Alkali Are Invalid Proxies for the Dynamics and Functions of Organic Matter in Terrestrial and Aquatic Ecosystems. J. Environ. Qual. 2019, 48, 207–216. [Google Scholar] [CrossRef]
  70. Firsching, B.-M.; Claassen, N. Root phosphatase activity and soil organic phosphorus utilization by Norway spruce [Picea abies (L.) Karst.]. Soil Biol. Biochem. 1996, 28, 1417–1424. [Google Scholar] [CrossRef]
  71. Mooshammer, M.; Wanek, W.; Zechmeister-Boltenstern, S.; Richter, A. Stoichiometric imbalances between terrestrial decomposer communities and their resources: Mechanisms and implications of microbial adaptations to their resources. Front. Microbiol. 2014, 5, 22. [Google Scholar] [CrossRef]
  72. Zhang, J.; Elser, J.J. Carbon:Nitrogen:Phosphorus Stoichiometry in Fungi: A Meta-Analysis. Front Microbiol 2017, 8, 1281. [Google Scholar] [CrossRef]
  73. Mouginot, C.; Kawamura, R.; Matulich, K.L.; Berlemont, R.; Allison, S.D.; Amend, A.S.; Martiny, A.C. Elemental stoichiometry of Fungi and Bacteria strains from grassland leaf litter. Soil Biol. Biochem. 2014, 76, 278–285. [Google Scholar] [CrossRef]
  74. Kornberg, A. Inorganic polyphosphate: Toward making a forgotten polymer unforgettable. J. Bacteriol. 1995, 177, 491–496. [Google Scholar] [CrossRef]
  75. Čapek, P.; Tupá, A.; Choma, M. Exploring polyphosphates in soil: Presence, extractability, and contribution to microbial biomass phosphorus. Biol. Fertil. Soils 2024, 60, 667–680. [Google Scholar] [CrossRef]
  76. Gerlitz, T.G.M. Effects of aluminium on polyphosphate mobilization of the ectomycorrhizal fungus Suillus bovinus. Plant Soil 1996, 178, 133–140. [Google Scholar] [CrossRef]
  77. Kopáček, J.; Bače, R.; Choma, M.; Hejzlar, J.; Kaňa, J.; Oulehle, F.; Porcal, P.; Svoboda, M.; Tahovská, K. Carbon and nutrient pools and fluxes in unmanaged mountain Norway spruce forests, and losses after natural tree dieback. Sci. Total Environ. 2023, 903, 166233. [Google Scholar] [CrossRef] [PubMed]
  78. Choma, M.; Bače, R.; Čapek, P.; Kaňa, J.; Kaštovská, E.; Tahovská, K.; Kopáček, J. Surviving trees are key elements in the fate of ectomycorrhizal community after severe bark-beetle forest disturbance. FEMS Microbiol. Ecol. 2023, 99, fiad082. [Google Scholar] [CrossRef]
  79. Kopáček, J.; Bače, R.; Hejzlar, J.; Kaňa, J.; Kučera, T.; Matějka, K.; Porcal, P.; Turek, J. Changes in microclimate and hydrology in an unmanaged mountain forest catchment after insect-induced tree dieback. Sc. Total Environ. 2020, 720, 137518. [Google Scholar] [CrossRef]
Figure 1. Relative abundance (in % of all fungal ITS amplicons) of fungal lifestyles (EcM—ectomycorrhizal, SAP—saprotrophic) in the litter and topsoil samples from PL and CT before (initial) and after (final) soil incubation. Asterisks denote significant difference at p < 0.05.
Forests 15 01378 g001
Figure 2. Relative abundance (in % of all fungal ITS amplicons) of the most abundant fungal genera and OTUs with uncertain genus assignment in PL and CT soils (at least 0.5% in one of the litter (A) or topsoil (B) variants). Fungal genera grouped according to lifestyle (EcM—ectomycorrhizal, SAP—saprotrophic). Point size is scaled to relative abundance, colour denotes significant differential abundance after incubation (green—increase, red—decrease). A red cross denotes absence in all post-incubation samples in the respective site and horizon combination.
Forests 15 01378 g002
Figure 3. Relative abundance (in % of all bacterial V4 amplicons) of the most abundant bacterial orders in PL and CT soils (at least 1% in one of all soil variants). Point size is scaled to relative abundance, colour denotes significant differential abundance after incubation (green—increase, red—decrease).
Forests 15 01378 g003
Figure 4. Changes in the activity of hydrolytic enzymes (PME, phosphatase activity; C-enz, a sum of beta-glucosidase and cellobiosidase activity; N-enz, a sum of leucinaminopeptidase and chitinase activity) before (initial) and after (final) soil incubation in PL and CT soils. Asterisks mark significant differences in the post-hoc comparison of individual horizons.
Forests 15 01378 g004
Figure 5. Changes in the concentration of P forms (water-soluble reactive P, SRP; water-soluble organic P, P-ORG, oxalate-extractable reactive P, RP-OX; total oxalate-extractable P, P-OX) before (initial) and after (final) soil incubation in PL and CT. Asterisks denote significant differences between initial and final samples (Tukey HSD test).
Forests 15 01378 g005
Figure 6. Cumulative leaching of P-PO4 collected via ion exchange resin traps from the incubated soils (box) and adjacent soils (control) throughout the study period. The boxes show the 25th and 75th percentiles. The whiskers extend the boxes by 1.5 times the inter-quantile range. The dots denote outliers. The horizontal line is the median. The differences between the control and the box are significant at the p < 0.01 at both sites (asterisks).
Forests 15 01378 g006
Table 1. Soil biochemistry in the litter and topsoil samples from PL and CT before (initial) and after (final) soil incubation. Asterisks denote significant differences between initial and final samples, while letters indicate the initial difference in soils between sites at p < 0.05 (Tukey HSD test). Means (sd) are given (n = 5). ns = not significant.
PLCTInitial Site
Difference
Incubation
Effect
LitterTopsoilLitterTopsoil
InitialFinalInitialFinalInitialFinalInitialFinalFpFp<
CMB µmol g−1841 (116)354 (65) *223 (31)151 (2.7) *696 (65)331 (28) *319 (138)127 (14) *ns1720.001
NMB µmol g−168 (6.0)30 (6.2) *16 (2.0)14 (0.69)51 (2.4)28 (3.6) *24 (12)10 (2.1) *900.001
PMB µmol g−15.4 (0.23)12 (3.4) *2.0 (0.22)8.1 (1.7) *4.6 (0.19)10 (1.3) *2.4 (0.20)7.3 (1.2) *3950.001
CMB/NMB ratio12 (1.2)12 (0.7)14 (0.6)10 (0.5)14 (1.5)12 (0.7)14 (1.2)13 (1.4)ns240.001
NMB/PMB ratio12 (1.2)3 (0.6)8 (0.4)2 (0.4)11 (0.9)3 (0.7)10 (4.2)1 (0.3)ns6130.001
specific ENZ activity nmol substrate (µmol CMB)−1 h−13.0 (0.27)17 (4.8)6.6 (2.3)16 (3.6)6.1 (1.1)14 (1.6)4.4 (0.9)18 (2.7)ns1850.001
fungal 18S rDNA
108 copies g−1
6.4 (2.0)6.5 (4.9)1.1 (0.16)1.6 (0.68)4.3 (1.8)8.1 (2.1)1.3 (0.45)2.0 (0.45)ns7.50.01
bacterial 16S rDNA
109 copies g−1
6.7 (2.5)3.9 (0.67)6.1 (1.0)5.8 (1.2)4.7 (0.57)5.9 (1.0)4.7 (0.91)4.4 (1.1)8.90.01ns
bacteria/fungi ratio128.55539127.53923ns6.40.02
TOC µmol g−188 (4.9) c38 (6.2) *39 (2.5) a27 (1.8) *65 (3.6) b42 (4.1) *43 (8.1) b33 (3.2)26<0.0011820.001
N-NH4 (H2O) nmol g−1481 (105) b910 (771)147 (23) a1523 (965) *579 (185) b1435 (444)191 (23) a3066 (1611) *4.90.0421000.001
N-NO3 (H2O) nmol g−1213 (47) a48 (19) *170 (48) a58 (29) *300 (16)13 (3.3) *328 (8.4) b26 (9.0) *46<0.0015010.001
Disclaimer/Publisher’s Note: The statements, opinions and data contained in all publications are solely those of the individual author(s) and contributor(s) and not of MDPI and/or the editor(s). MDPI and/or the editor(s) disclaim responsibility for any injury to people or property resulting from any ideas, methods, instructions or products referred to in the content.

