Article

Inter- and Intra-Specific Variation in Leaf Functional Traits at Different Maturity Levels in a Tropical Monsoon Forest

1
College of Forestry and Landscape Architecture, South China Agricultural University, Guangzhou 510507, China
2
Faculty of Geographical Science, Beijing Normal University, Beijing 100875, China
3
Guangdong Provincial Key Laboratory of Silviculture, Protection and Utilization, Guangdong Academy of Forestry, Guangzhou 510520, China
4
CFERN Guangdong E’ huangzhang National Field Observation and Research Station, Yangjiang 529631, China
*
Author to whom correspondence should be addressed.
These authors contributed equally to this work.
Forests 2024, 15(8), 1383; https://doi.org/10.3390/f15081383
Submission received: 6 July 2024 / Revised: 5 August 2024 / Accepted: 6 August 2024 / Published: 7 August 2024
(This article belongs to the Special Issue Biodiversity in Forests: Management, Monitoring for Conservation)

Abstract

:
Plant functional traits are an important indicator for the comprehensive evaluation of community stability and resilience. Therefore, exploring the variations and relationships among leaf functional traits at different maturity levels during forest restoration can deepen the understanding of plant adaptation strategies and community assembly. In this study, we measured the leaf area (LA), specific leaf area (SLA), photosynthetic pigments, non-structural carbohydrates (NSCs), leaf nitrogen content (LNC), and leaf phosphorus content (LPC) of dominant tree species in three communities with different maturity levels (defined by species composition, biodiversity and spatial structure) in a monsoon forest located in the northern margin of the tropics in China, and explored the variation and relationships among different leaf traits at individual, species, and community scales. The results showed that maturity levels significantly affected leaf functional traits. With the increase in maturity levels, SLA increased, and leaf SS and NSCs decreased, while other leaf functional traits did not show a consistent pattern. In different communities, NSCs, Chl (a:b), SS:St or Car had a trade-off or synergistic relationship with leaf economic spectrum. Additionally, the LPC, LNC, and starch were the key traits in response to selection pressure at maturity levels, inter-specific and intra-specific scales, respectively, and the trait–trait relationships were stronger or more extreme as the scale was narrowed. Therefore, when evaluating the development and succession of tropical monsoon forest communities, the selection of leaf functional characteristics and the determination of the research scale should be comprehensively and systematically considered.

1. Introduction

Plant functional traits refer to a series of plant attributes that have potentially significant effects on plant colonization, survival, growth, and death. These attributes can individually or jointly reflect the response of the ecosystem to environmental changes, and have strong impacts on ecosystem functioning [1,2]. As the most sensitive organ of plants in response to environmental changes [3], leaves can more accurately reflect the adaptation and regulation mechanisms of plant physiological and ecological functions in response to a specific environment [4]. Leaf structural traits such as leaf area (LA) and chemical traits such as photosynthetic pigments, non-structural carbohydrates (NSCs), and nitrogen (N) and phosphorus (P) contents can characterize plant morphological construction, carbon (C) assimilation, stress defense, and nutrient cycling capacity [5,6,7], and develop varying degrees of variation as environmental gradients change, eventually adjusting to synergistic or trade-off relationships [8] to form multiple resource use efficiency [9] and survival adaptation strategies [6]. Studying the variation in leaf functional traits in heterogeneous habitats contributes to understanding the main ecological processes under environmental changes [10].
The variation in leaf functional traits is mainly affected by environmental factors, inter-specific, and intra-specific variation [11,12]. For instance, dominant species in early successional savannas were constrained by low soil nutrients and low water availability to adopt trait strategies that resist herbivores and water loss [13]. Dominant tree species in early successional subtropical forests tend to achieve higher photosynthetic rates and higher reproductive rates, while investing less resources in competitiveness and maintaining defense strategies [14]. As succession proceeds, increasing soil fertility and decreasing understory light availability [15,16] lead to changes or even the opposite of the functional strategies of the dominant tree species [17]. In this process, habitat filters will screen species through the abiotic environment, resulting in the convergence of traits in the habitat [18]; simultaneously, limiting similarity makes coexisting species enhance niche differentiation through intraspecific variation, so that trait divergence reduces competition [19]. However, previous studies investigated the relationships between the environment factors and the functional traits based on species level, ignoring the differences in individual traits within species [20], which cannot truly reflect the response of species to environmental changes and resource competition [21,22]. The latest studies have shown that intra-specific variation is conducive to species coexistence [23,24] and is as important as inter-specific variation [25]. A global meta-analysis showed that intra-specific trait variation accounted for an average of 25% of the total trait variations within the community and 32% of the total trait variations across communities [26]. Therefore, combining the environmental factors and inter-specific and intra-specific variation to study the relationships among leaf functional traits can help to better understand the mechanisms of multi-species coexistence and community assembly under environmental change [27,28]. The leaf economics spectrum (LES) has been extensively studied on various scales around the world [7,29,30], but the research on the relationships between LES and other major ecological strategy dimensions of foliar traits is limited [31]. Moreover, the leaf traits vary jointly as trait syndromes rather than varying independently [7]. With the emphasis on intra-specific variation, the relationships of LES traits at the global scale have been shown to be weakened or even reversed at a smaller scale, limiting the utility of existing leaf economics theories within species and across communities [32]. Therefore, the study of trait–trait relationship at different scales is helpful to reflect plant strategies of resource acquisition and allocation in different taxa and habitats [30,33], and to reveal the potential evolutionary, physiological, and ecological mechanisms among traits [32].
The E’ huangzhang monsoon forest is located in Yangchun City, Guangdong Province, in the northern margin of the tropics, which plays the role of a watershed between the monsoon tropics and the southern tropics in China. It is described as ‘the first rainfall center’ of Guangdong Province, with an average annual rainfall of 3428.9 mm and a maximum value of 5521 mm. The region has been disturbed by long-term human activities without the distribution of primary forest communities. The existing vegetation types are composed of secondary forest communities at various succession stages. However, the soil total phosphorus (P) content in this region is only 0.12 g·kg−1 [34], which is far lower than the average level in China. The response mechanism of leaf functional traits to the succession process under a long-term low soil P environment and high precipitation is still unknown. In the preliminary study, we defined the concept of ‘maturity level’ through species composition, biodiversity and spatial structure in forests at the same succession stage according to the previous studies [35]. The community with higher maturity levels would be more stable in community structure, richer in species diversity and have a more ideal stand spatial structure; thus, they may experience a faster process in terms of forest recovery. Moreover, since species dominance in community is mainly determined by species adaptation to the local environment and the biotic interactions, the ecosystem functions are largely driven by the characteristics of dominant species [36]. Therefore, in this study, the dominant tree species with the top five importance values (IVs) of three communities with different maturity levels were taken as the research objects, and a series of key leaf functional traits were measured, including leaf economic traits (leaf area (LA), specific leaf area (SLA), leaf nitrogen content (LNC) and leaf phosphorus content (LPC)), photosynthetic pigments (chlorophyll (Chl) and carotenoids (Car)), and traits indicating the plant response to environmental stress (soluble sugars (SS) and starch (St)) (Table 1). The study aims to analyze the variations in the leaf functional traits of dominant tree species in the communities at the scales of maturity level, inter-species and intra-species, and further deepen the understanding of plant adaptation strategies and community assembly mechanisms in tropical monsoon forests. We hypothesized that (1) leaf functional traits would differ significantly among different communities and regularly change along with the maturity levels of communities. (2) Leaf functional traits were affected by maturity levels, inter-species and intra-species variation, etc., resulting in convergence or vergence, which ultimately led to trade-offs between LES traits and other functional traits. Moreover, the most affected functional traits existed at different scales.

2. Materials and Methods

2.1. Site Description

The study region is located in the E’ huangzhang Provincial Nature Reserve in Yangchun, Guangdong Province, China (111°21′29″–111°36′03″ E, 21°50′36″–21°58′40″ N). It is the largest and only tropical northern climate type reserve in the southwest coastal area of Guangdong Province, with a total area of 14,751 hm2. The region belongs to the middle mountainous topography, with the highest mountain of E’ huangzhang at an altitude of 1337.6 m. Most of the soil-forming parent materials in the region are composed of granite. The soil is mainly red soil, lateritic red soil and mountain yellow soil. The soil pH range is 4~6, the soil organic matter is 39.19 g·kg1, the total N is 0.95 g·kg1, the total P is 0.12 g·kg1, the available P is 2.62 g·kg1, and the total potassium (K) is 9.04 g·kg1. The average annual temperature is 22.1 °C, the average annual rainfall is 3428.9 mm, and the highest record is 5521 mm (recorded by Xianjiadong Reservoir Meteorological Station). The rainfall is large with a long period. It is considered to be ‘the first rainfall center in Guangdong’. The region has been disturbed by human activities for a long time, thus without any original forest community. The existing vegetation types are secondary forest communities at various succession stages, including secondary montane rainforest and evergreen monsoon forest. Fagaceae, Lauraceae, Myrtaceae and Theaceae are the main dominant families. The representative plants are Polyspora axillaris, Adinandra hainanensis, Diplopanax stachyanthus, Machilus foonchewii, etc.

2.2. Leaf Collection

Based on three long-term fixed monitoring plots (30 m × 40 m) established in 2020, three kinds of monsoon forest communities with different maturity levels are represented (coexisting in the same succession stage with different restoration processes, Table 2; Figure 1), and the recovery period is 30~40 years, mainly growing arbores and small arbores. The plant community investigation was carried out on all individuals with a diameter at breast height (DBH) larger than or equal to 1 cm, and the species name, relative coordinate position, DBH, tree height, crown width, and branch height were recorded. The leaf selection and sampling was carried out based on the importance values (IVs; one third of the total sum of relative abundance, relative frequency, and relative significance) of tree species in each community, whose IV was in the top five (Table 3). According to the growth status and relative coordinate position of each dominant tree species, five individuals were sampled for each tree species. From each sample tree, four healthy and mature terminal branches on the east, south, west, and north of the outer canopy of the target individual were collected by lopping shears and brought back to the laboratory in ziploc bags. About 25~30 healthy and complete leaves were collected and washed for the determination of leaf functional traits. Then, leaf samples were oven-dried and ground through a sieve of 0.25 mm aperture and stored in ziploc bags for testing other traits.

2.3. Measurement of Leaf Functional Traits

The completely mature and healthy leaves were selected and used to determine the leaf area (LA) using the Leaf Area Meter (LI-3000A, LI-COR Biosciences, Lincoln, NE, USA), and the specific leaf area (SLA) was calculated after oven-drying at 70 degrees celsius for 72 h and weighing with a one over ten-thousand analytical balance. Leaf Chl was extracted by the acetone immersion method [51]. Modified from the previous methods [52], soluble sugar (SS) in leaf samples were extracted with anhydrous ethanol, and starch (St) was extracted with the perchloric acid, and the contents of SS and St were determined using the anthrone-concentrated sulphuric acid colorimetric method [46]. NSCs were the sum of SS content and St content. Leaf nitrogen content (LNC) was determined by the Kjeldahl method [34], and leaf phosphorus content (LPC) was determined by acid dissolution-molybdenum antimony colorimetric method [12].

2.4. Determination of Soil Physical and Chemical Properties

Topsoil layer (0~10 cm) samples were collected from the three evenly distributed sample points in each communities using an auger (diameter of 6 cm) and were sealed in the ziploc bags. In each sample point, the mixed soil sample was composed of 6–8 cores. Soil total nitrogen content (TN) was determined by the acid-soluble-indophenol blue colorimetric method, soil total phosphorus content (TP) was determined by the Kjeldahl method, available phosphorus (AP) was determined by the Bray1 method, soil moisture content was determined by the oven-drying method, and soil pH was determined by the potentiometric method (soil–water ratio of 1:2.5) [25,34]. The results are shown in Table 4.

2.5. Data Analysis

After the logarithmic transformation of all data, one-way ANOVA (LSD method for multiple comparisons) was used. In order to study the co-variation in traits at the inter-species and intra-species scales, the Pearson coefficient was used to test the trait–trait correlation. The coefficient of variation CV = (standard deviation (SD)/mean value (M)) × 100% was used to calculate the degree of intra-specific variation in leaf functional traits based on the individual level. The coefficient of variation of each species was used to calculate the mean value and SD between species, so as to obtain the inter-specific coefficient of variation. In order to study the variation source and relative contribution of leaf functional traits, the mixed effects model was used to decompose the explanatory variance of trait variation at three nested scales (maturity levels, inter-species and intra-species) [20]. There were three communities with different maturity levels in the E’ huangzhang monsoon forest. Each community contained a variety of dominant tree species, and each dominant tree species contained multiple individuals. Thus, the nested scale of maturity–species–individual was constituted. The maturity levels scale represented the effect of habitat heterogeneity caused by community structure and soil nutrients on leaf functional traits, which could indicate the effect of abiotic factors on trait variance. The species scale was used to reflect the effects of inter-specific variance, and the individual scale was used to reveal intra-specific variance. The ‘lme’ function based on restricted maximum likelihood estimation (REML) was used to fit the mixed effects model using the ‘nlme’ package of R v.4.1.2 software [53]. Then, the variance decomposition of functional traits at the three nested scales of maturity, species, and individual levels was performed using the ‘ape’ package [54]. In order to explore whether there was a coordinated relationship between LES traits and other functional traits, principal component analysis was used for multi-trait analysis. In order to determine whether the functional traits could distinguish the dominant tree species in the same community, Ward’s hierarchical clustering was used to cluster the average value of the functional traits of each species [7]. All statistical analyses and plotting were performed in R v.4.1.2, SPSS 22.0 and Origin 2021 software.

3. Results

3.1. Leaf Functional Traits in Three Maturity Levels

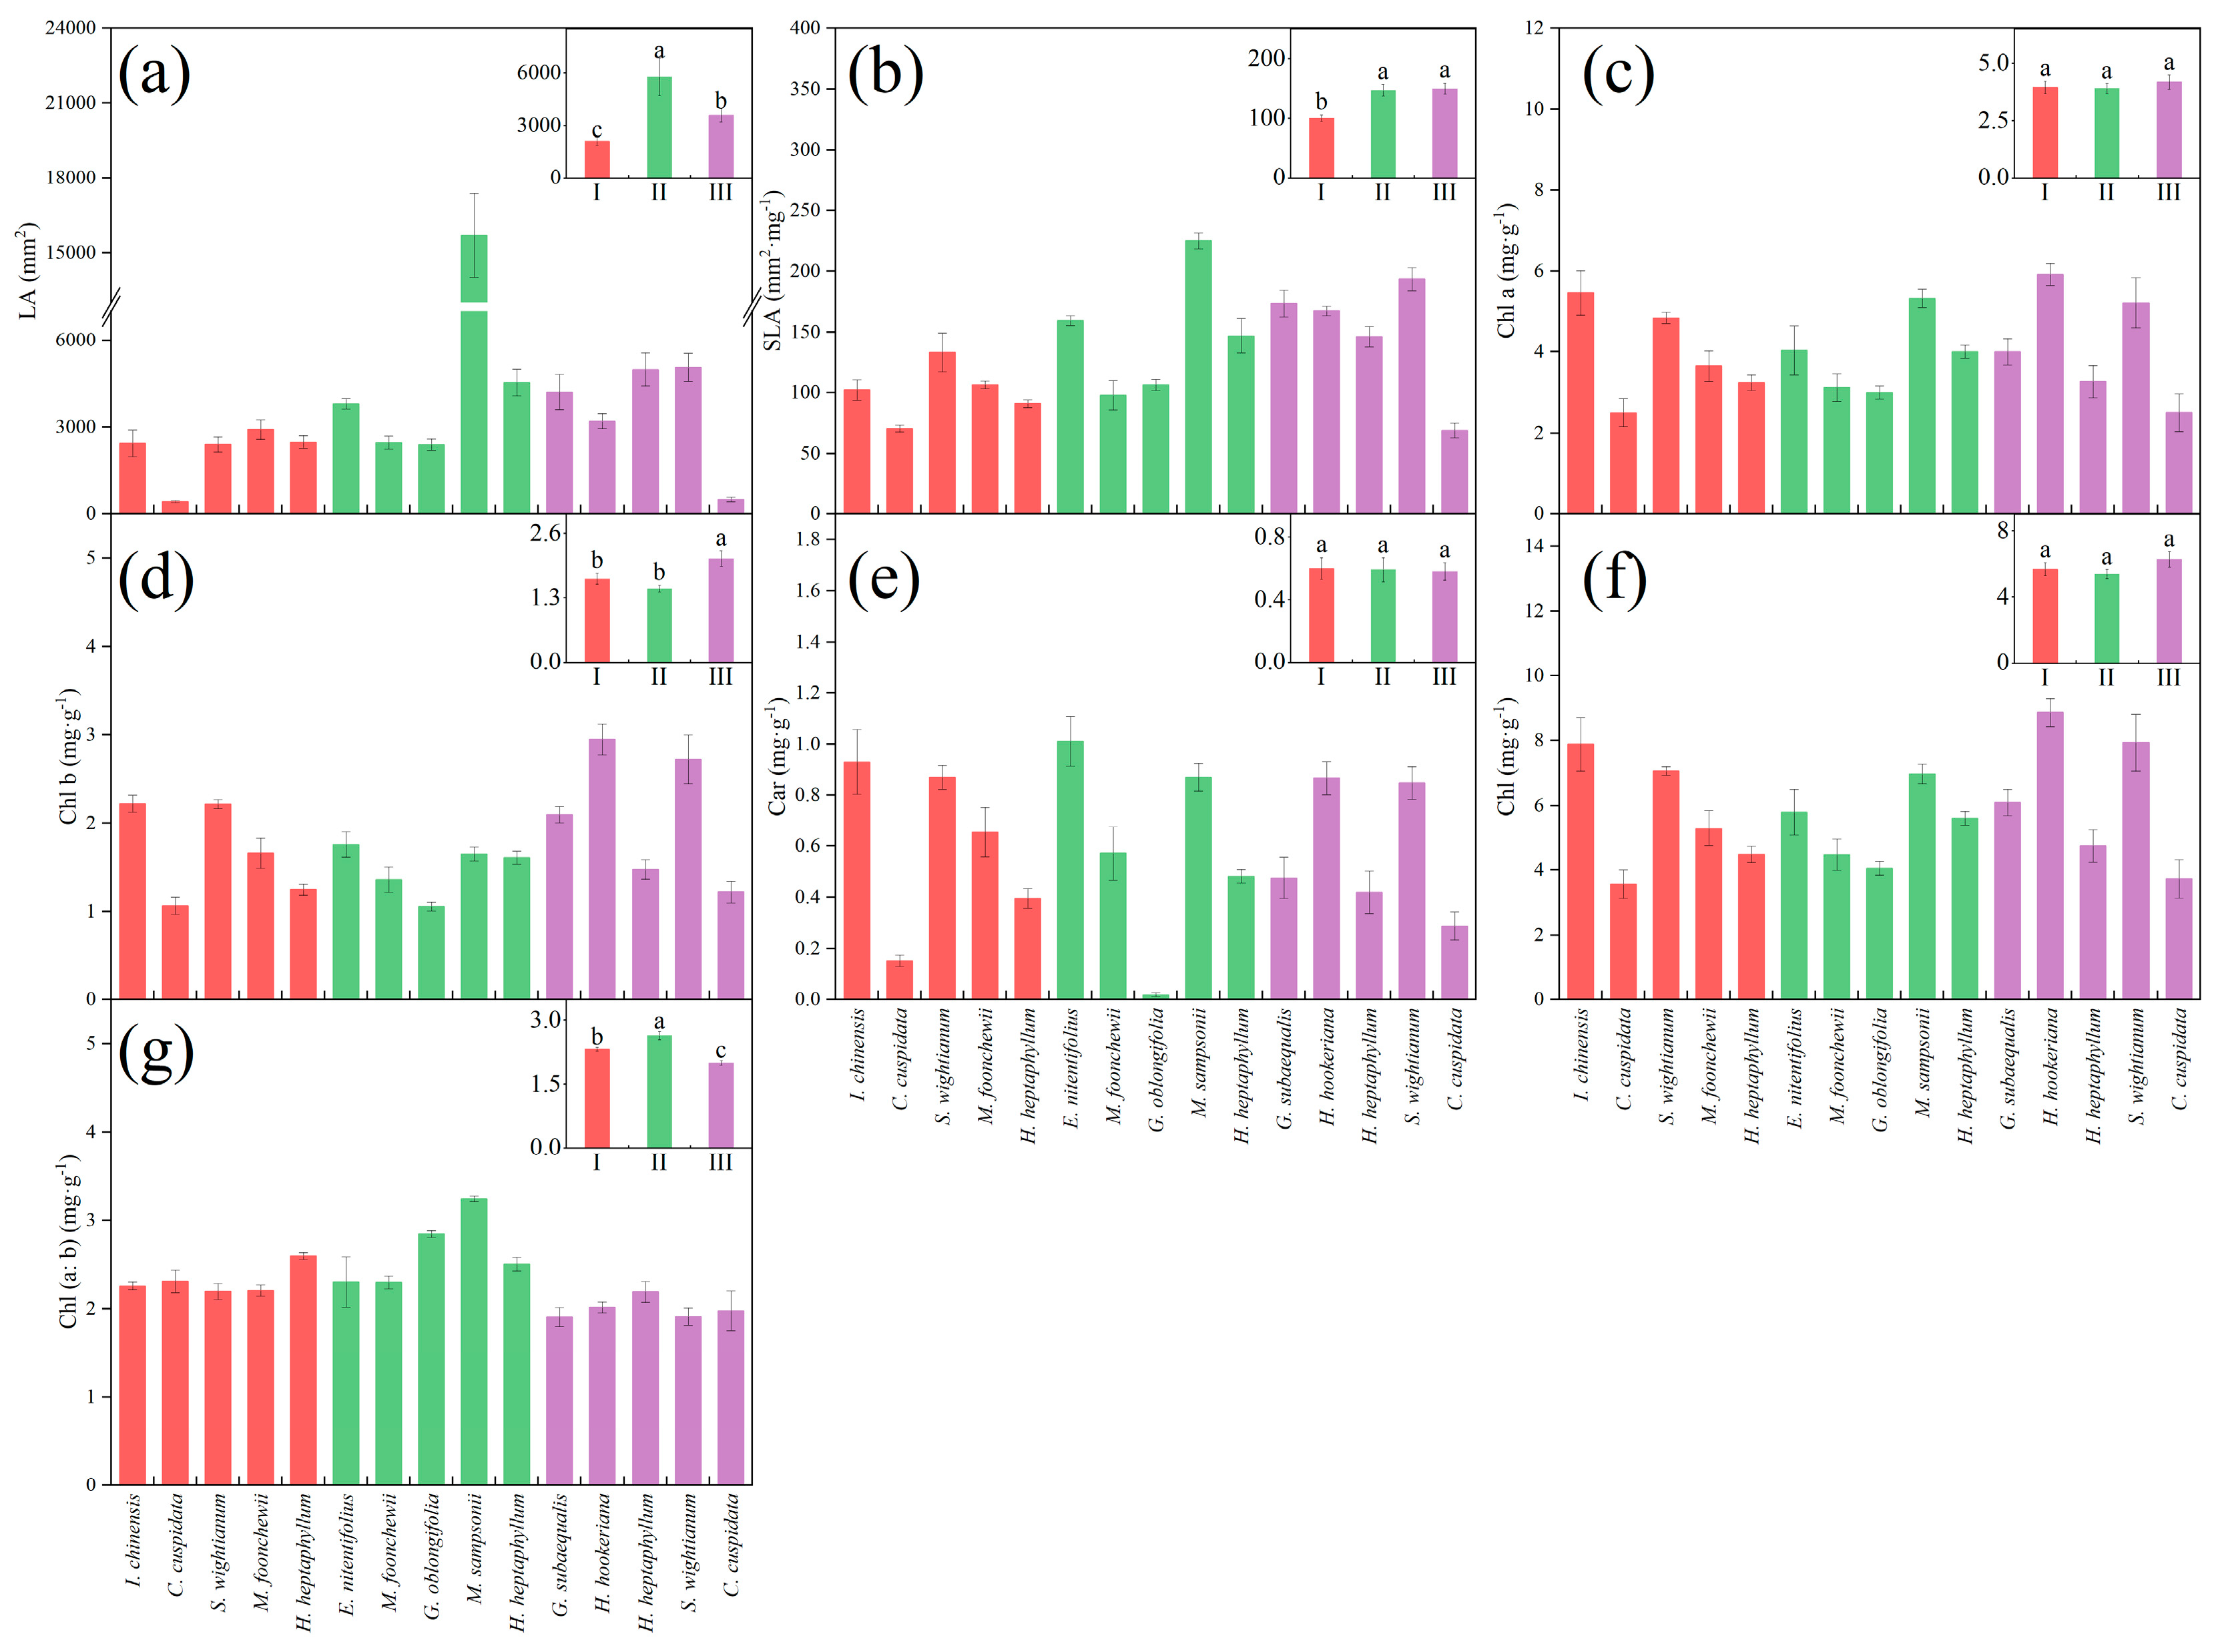
There were significant differences in LA among the three maturity levels (p < 0.05, Figure 2a), which were shown as II > III > I, and M. sampsonii in the maturity level II had the highest LA. However, the SLA in the maturity levels II and III was significantly higher than that in maturity level I (Figure 2b). Additionally, S. wightianum in maturity level III and M. sampsonii in maturity level II had the highest SLA, while C. cuspidata in maturity level III had the lowest SLA (Figure 2b). The chlorophyll b (Chl b) of maturity level III was significantly higher than that of the maturity levels I and II (Figure 2d). Besides, H. heptaphyllum and S. wightianum in maturity level III had the highest Chl b. There were significant differences in Chl (a:b) among the three maturity levels, indicating a ranking of II > I > III (Figure 2g).
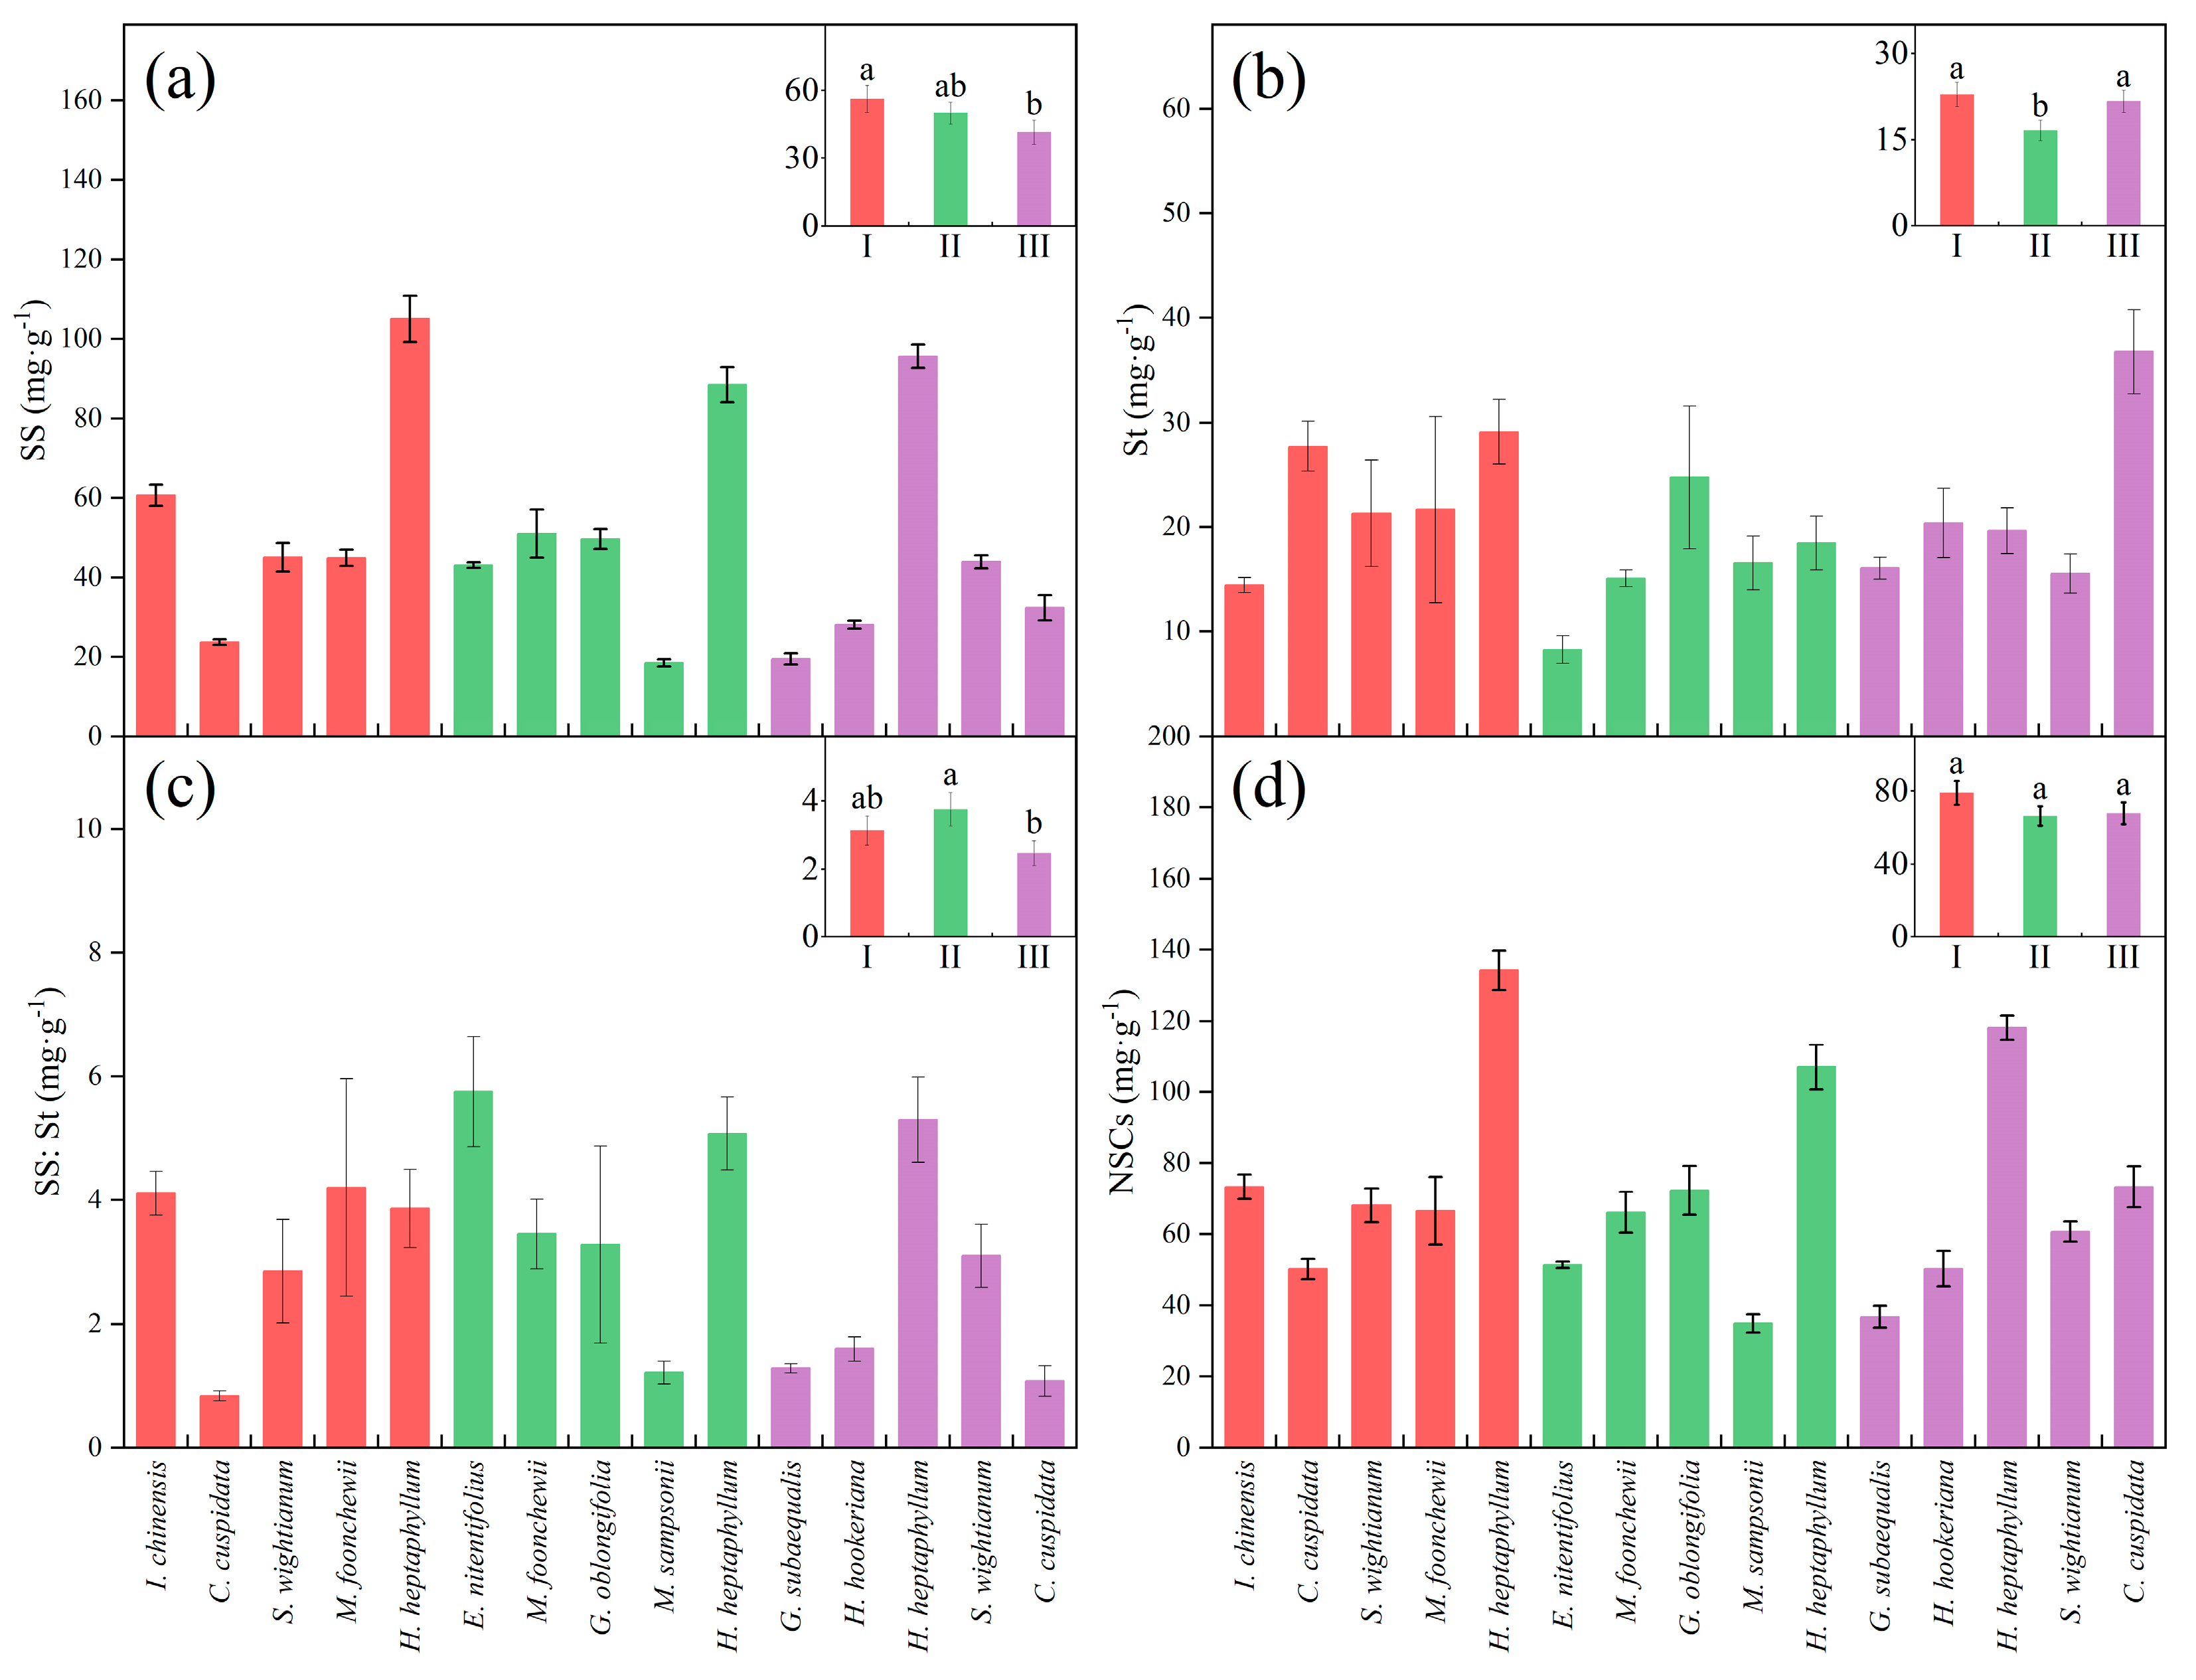
The SS of maturity level I was significantly higher than that of maturity level III (p < 0.05, Figure 3a), and the difference between the maturity levels I and II was eliminated by C. cuspidata in maturity level I. The St of the maturity levels I and III was significantly higher than that of maturity level II (Figure 3b). The SS:St of maturity level II was significantly higher than that of maturity level III (Figure 3c). However, there was no significant difference in NSCs among the three maturity levels (Figure 3d). H. heptaphyllum had the highest SS and St in the three maturity levels.
The LNC of maturity level III was significantly higher than that of maturity level II (p < 0.05, Figure 4a). G. subaequalis and S. wightianum in maturity level III were the main contributors of the LNC of maturity level III, while S. wightianum in maturity level I eliminated the differences with maturity levels II and III. The LPC of maturity level II was significantly higher than that of the maturity levels I and III (Figure 4b). There were significant differences in LNC:LPC among the three maturity levels, showing a trend of III > I > III (Figure 4c).

3.2. Leaf Functional Traits’ Variation Coefficient and Variance Source

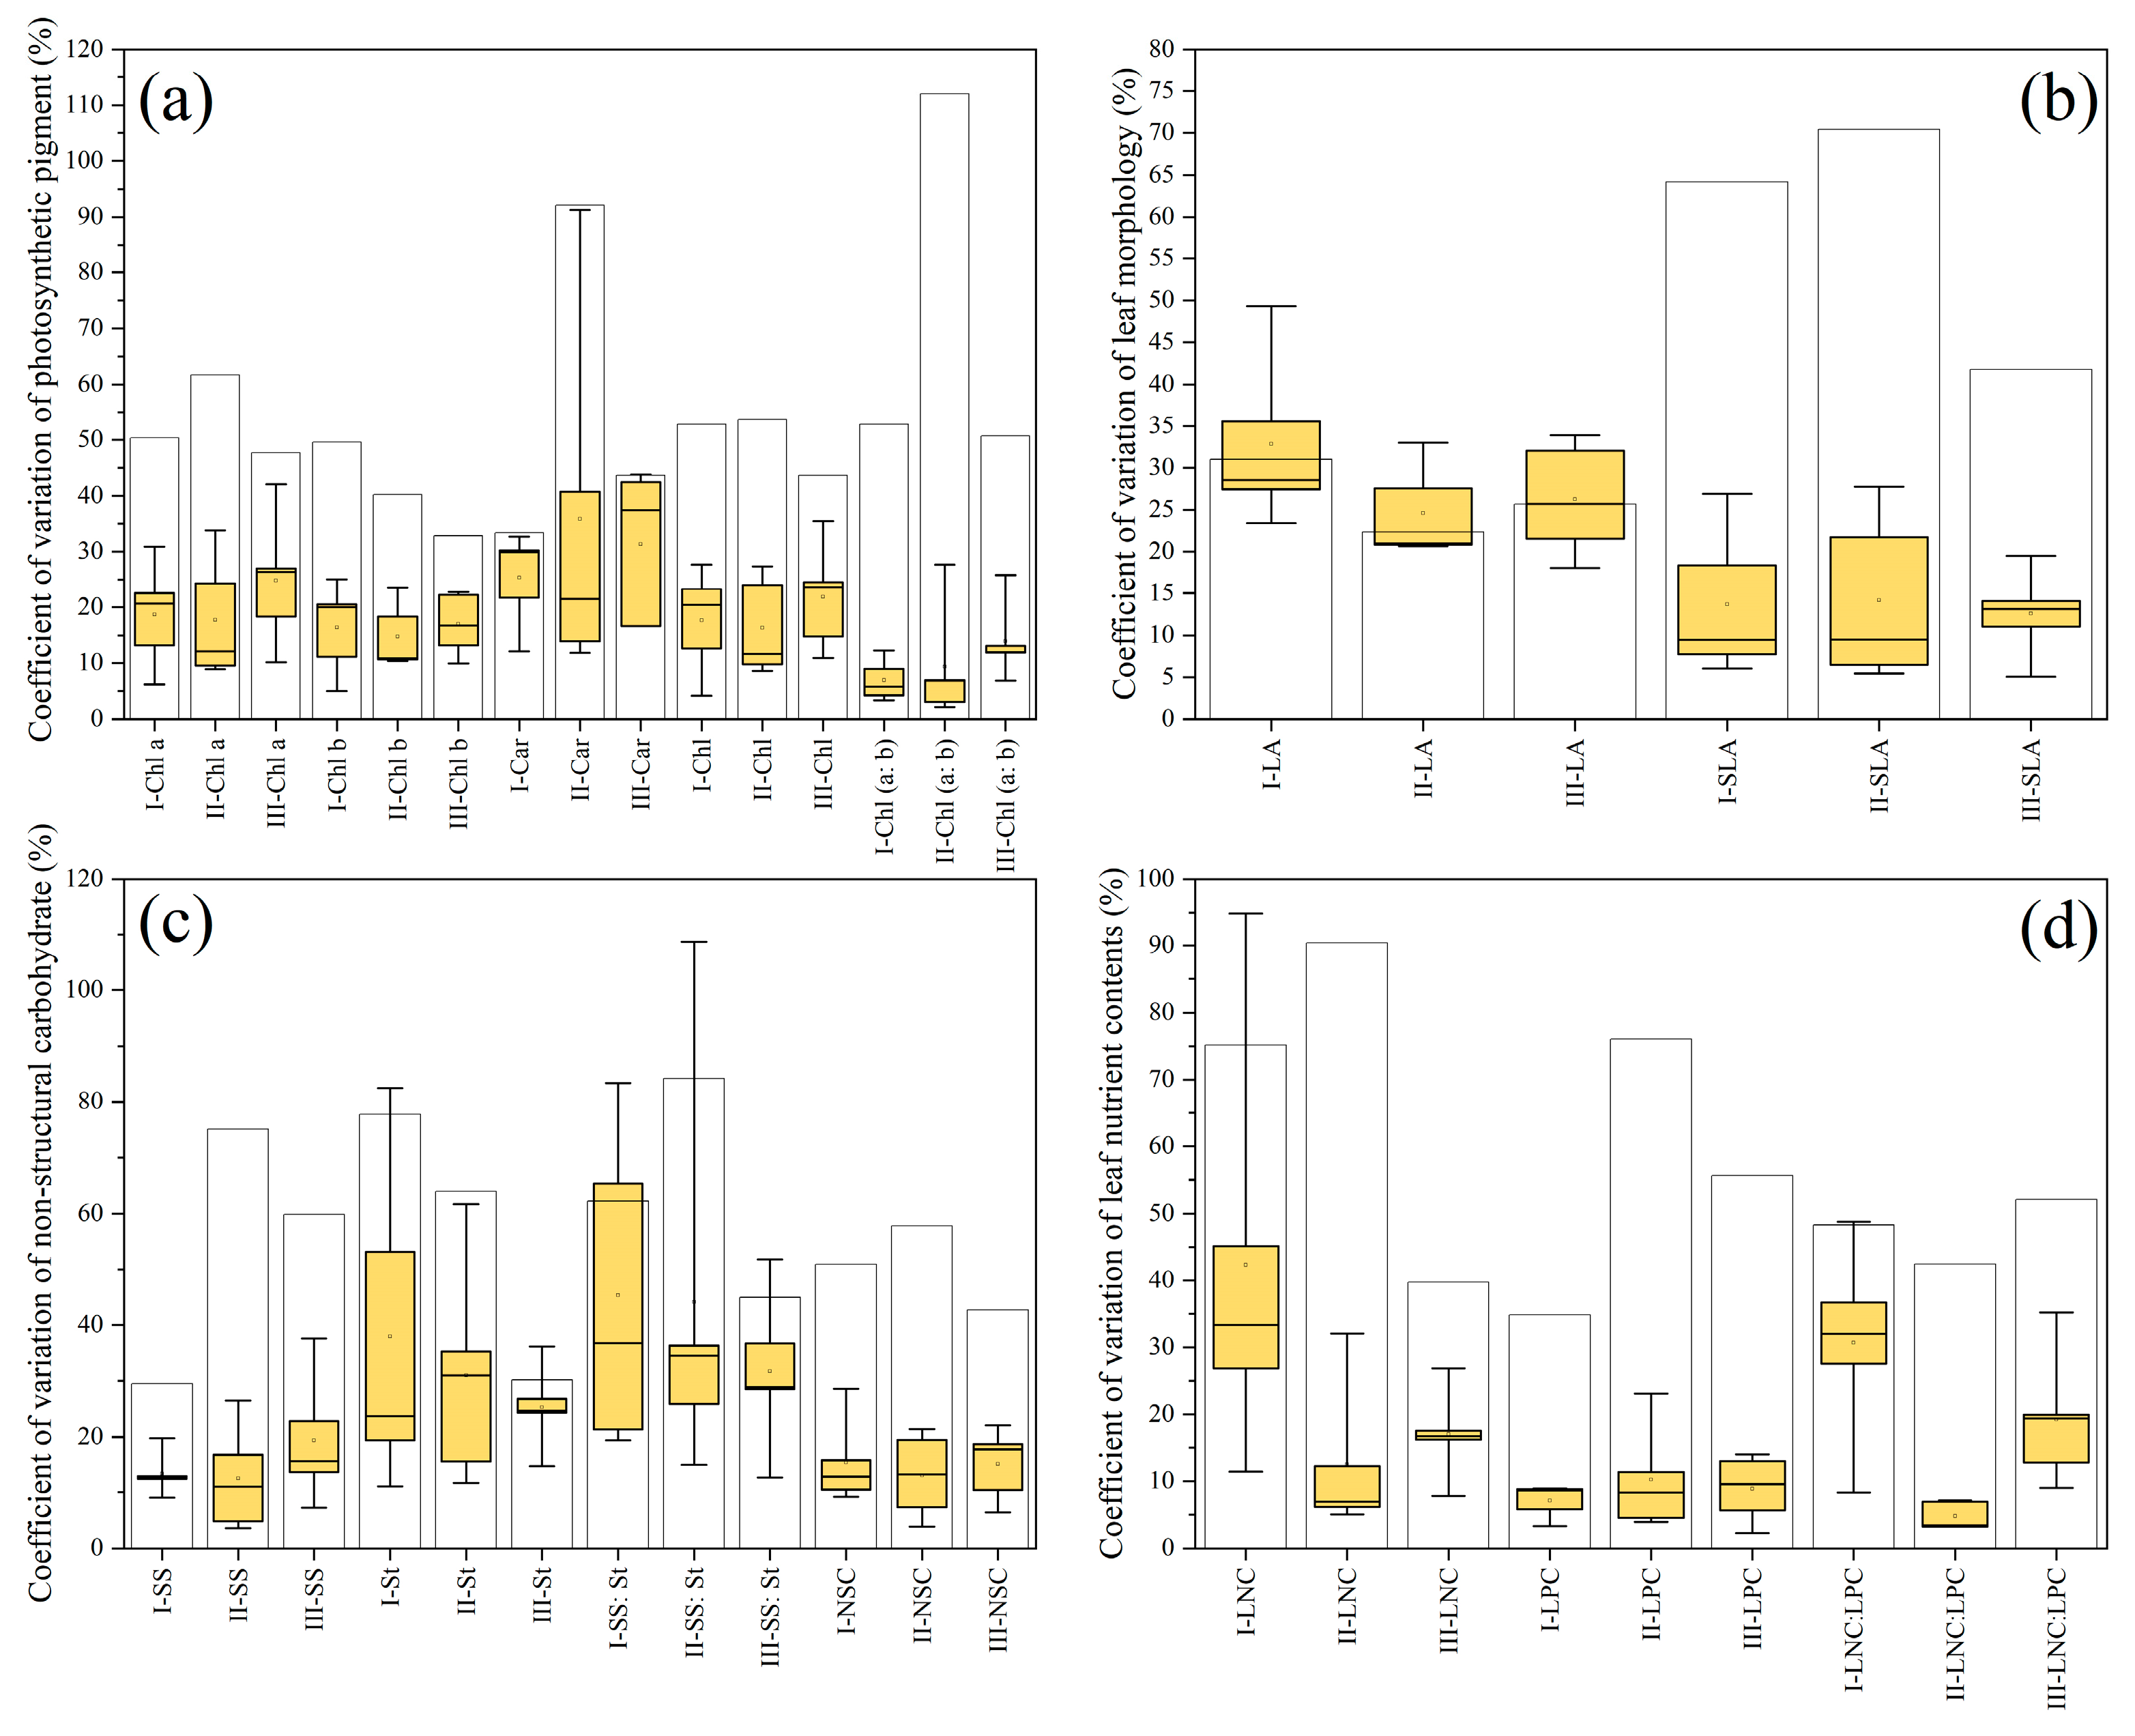
At the scale of a single maturity level, except for LA, the inter-specific variation in other functional traits was higher than that of intra-specific variation in different maturity levels (Figure 5). However, the intra-specific and inter-specific variation in each functional trait was not consistent with the change in maturity levels.
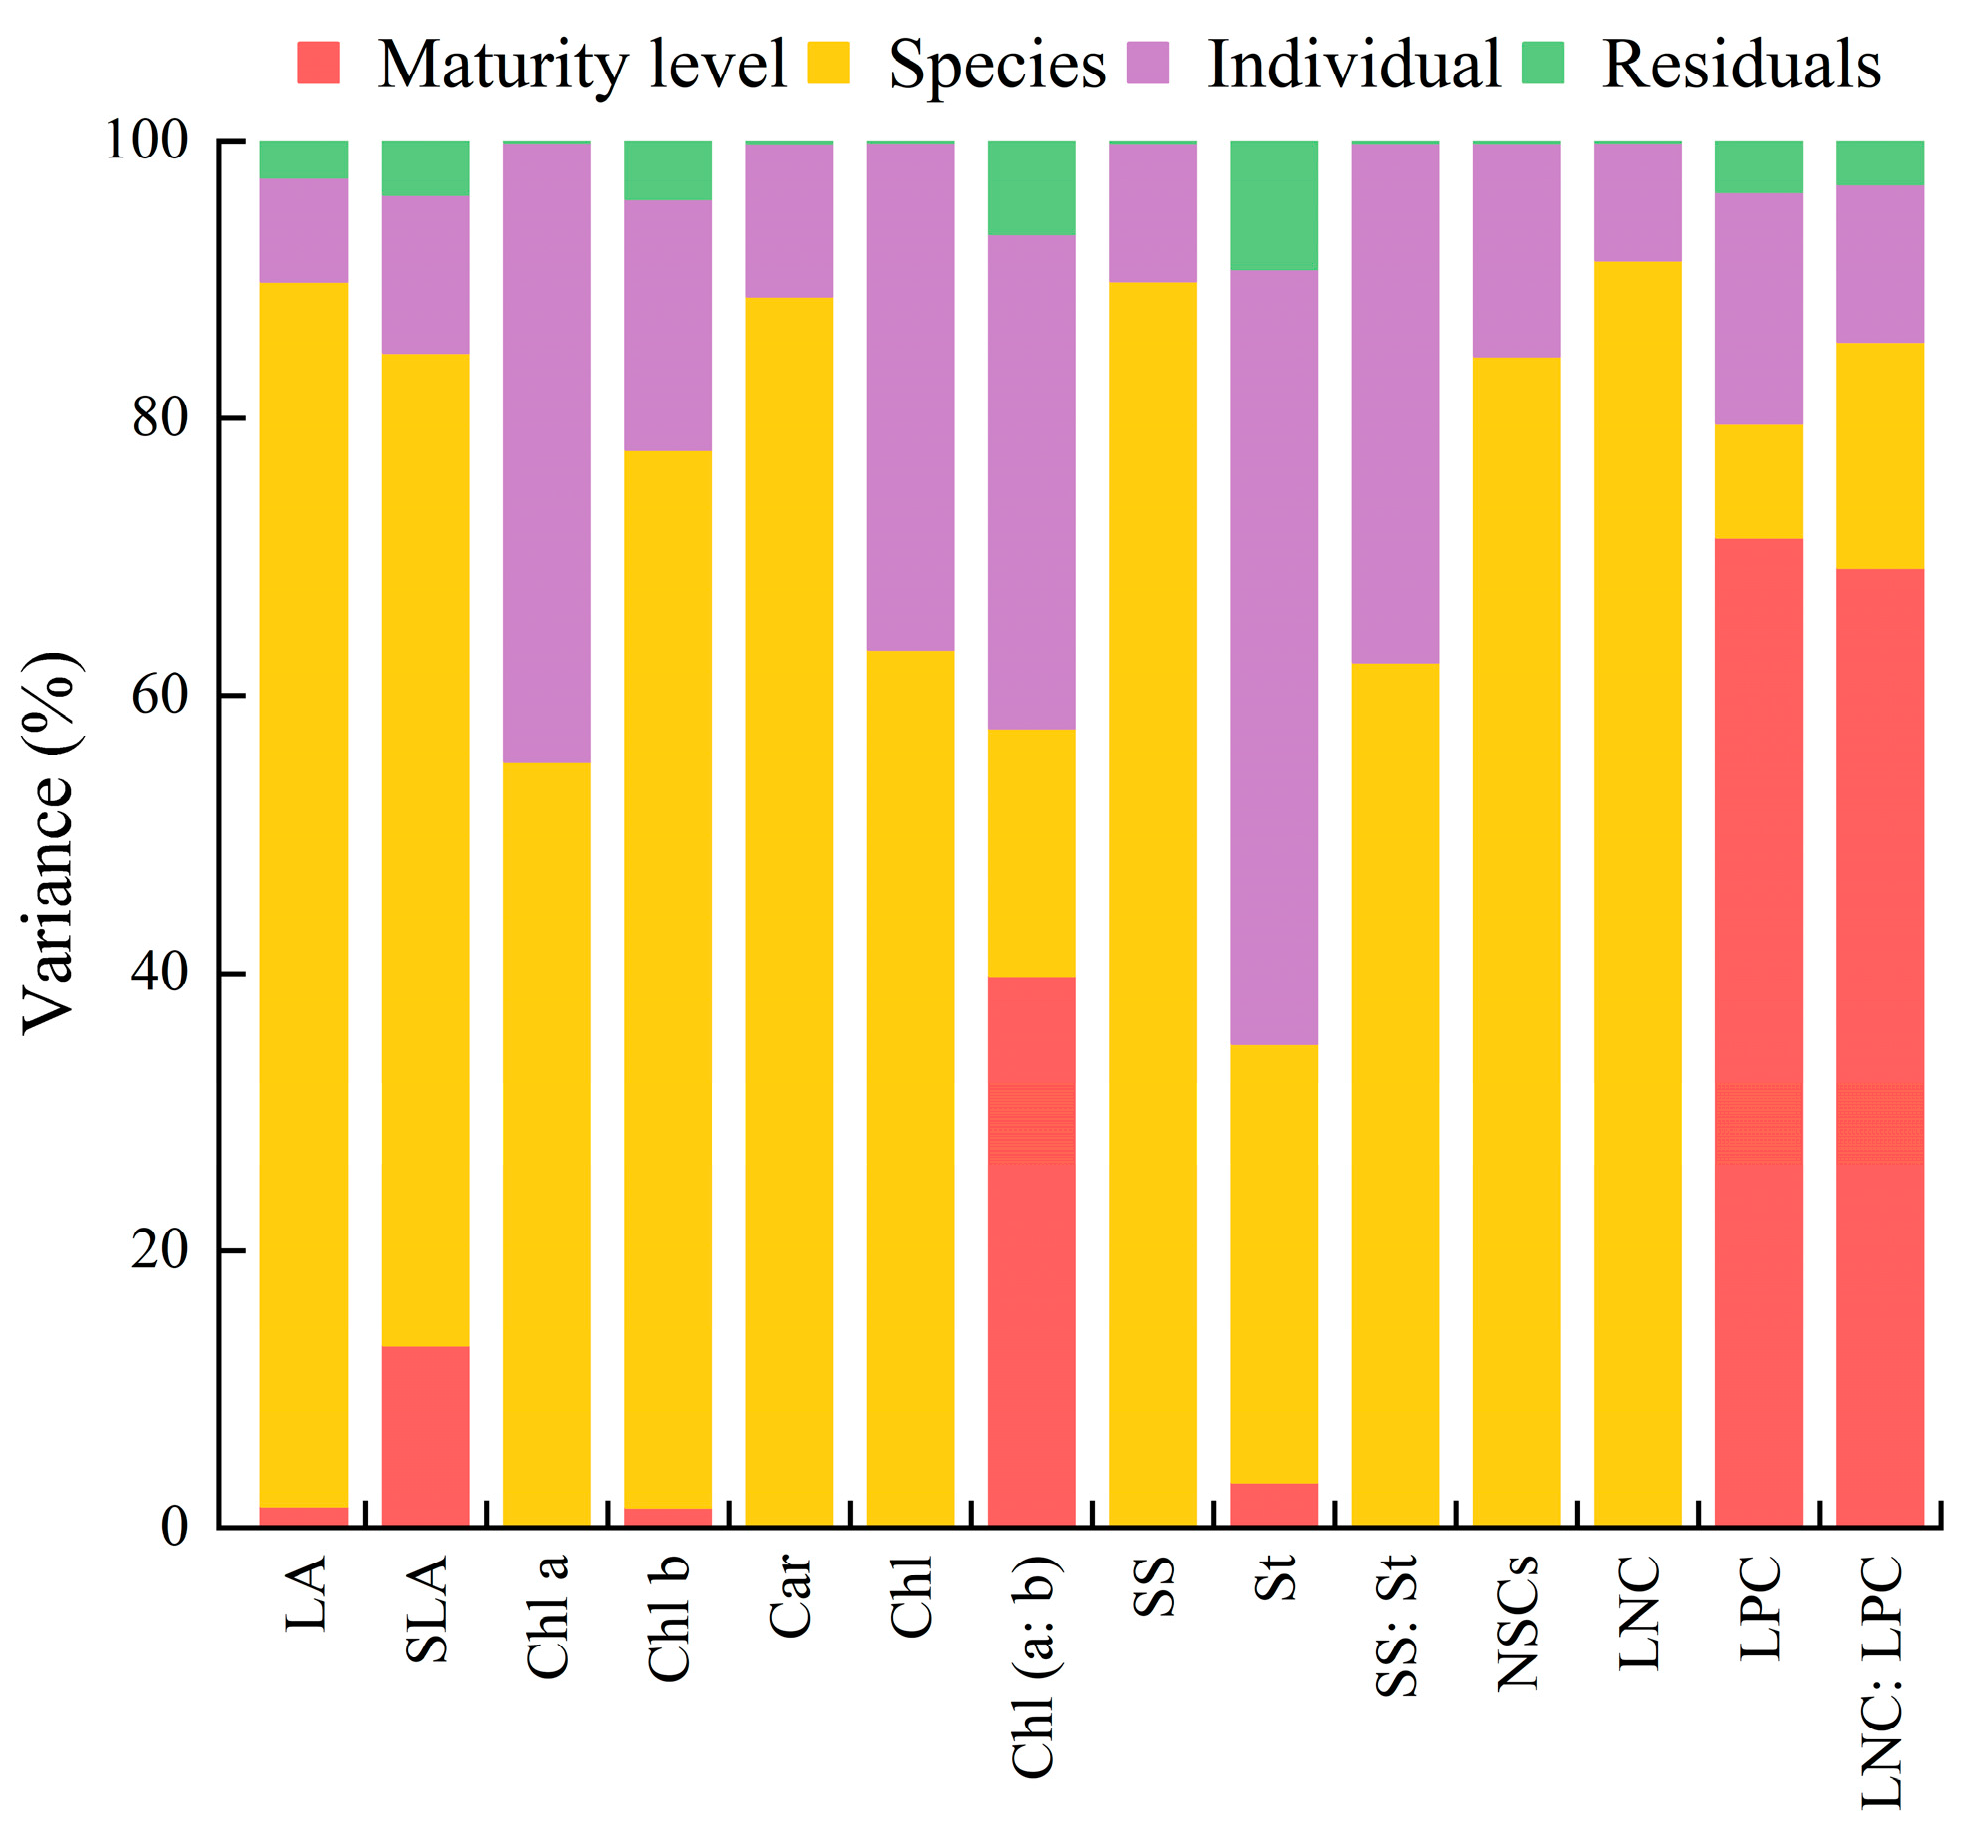
With the scale of three maturity levels, the variance in different leaf functional traits fluctuated (Figure 6), which could be divided into four scenarios. The first scenario was dominated by maturity levels, mainly contained LPC and LNC:LPC, and the variance from maturity levels reached 71.45% and 69.28%, respectively. The second scenario was dominated by inter-specific variation, mainly including LA (88.32%, represented inter-specific variance and the same below), SLA (71.55%), Chl b (76.31%), Car (88.80%), SS (89.89%), SS:St (62.39%), NSCs (84.47%), LNC (91.39%). The third scenario was dominated by inter-specific and intra-specific variation, such as Chl a (55.28% and 44.62% represented inter-species and intra-species variance, respectively, with the same below), Chl (63.38%, 36.53%), St (31.69%, 55.84%). The fourth scenario was dominated by maturity levels and intra-specific variation, only contained Chl (a:b), and the variance from maturity levels and intra-species were 39.86% and 35.65%, respectively.

3.3. Trait–Trait Relationship and Multi-Trait Relationship

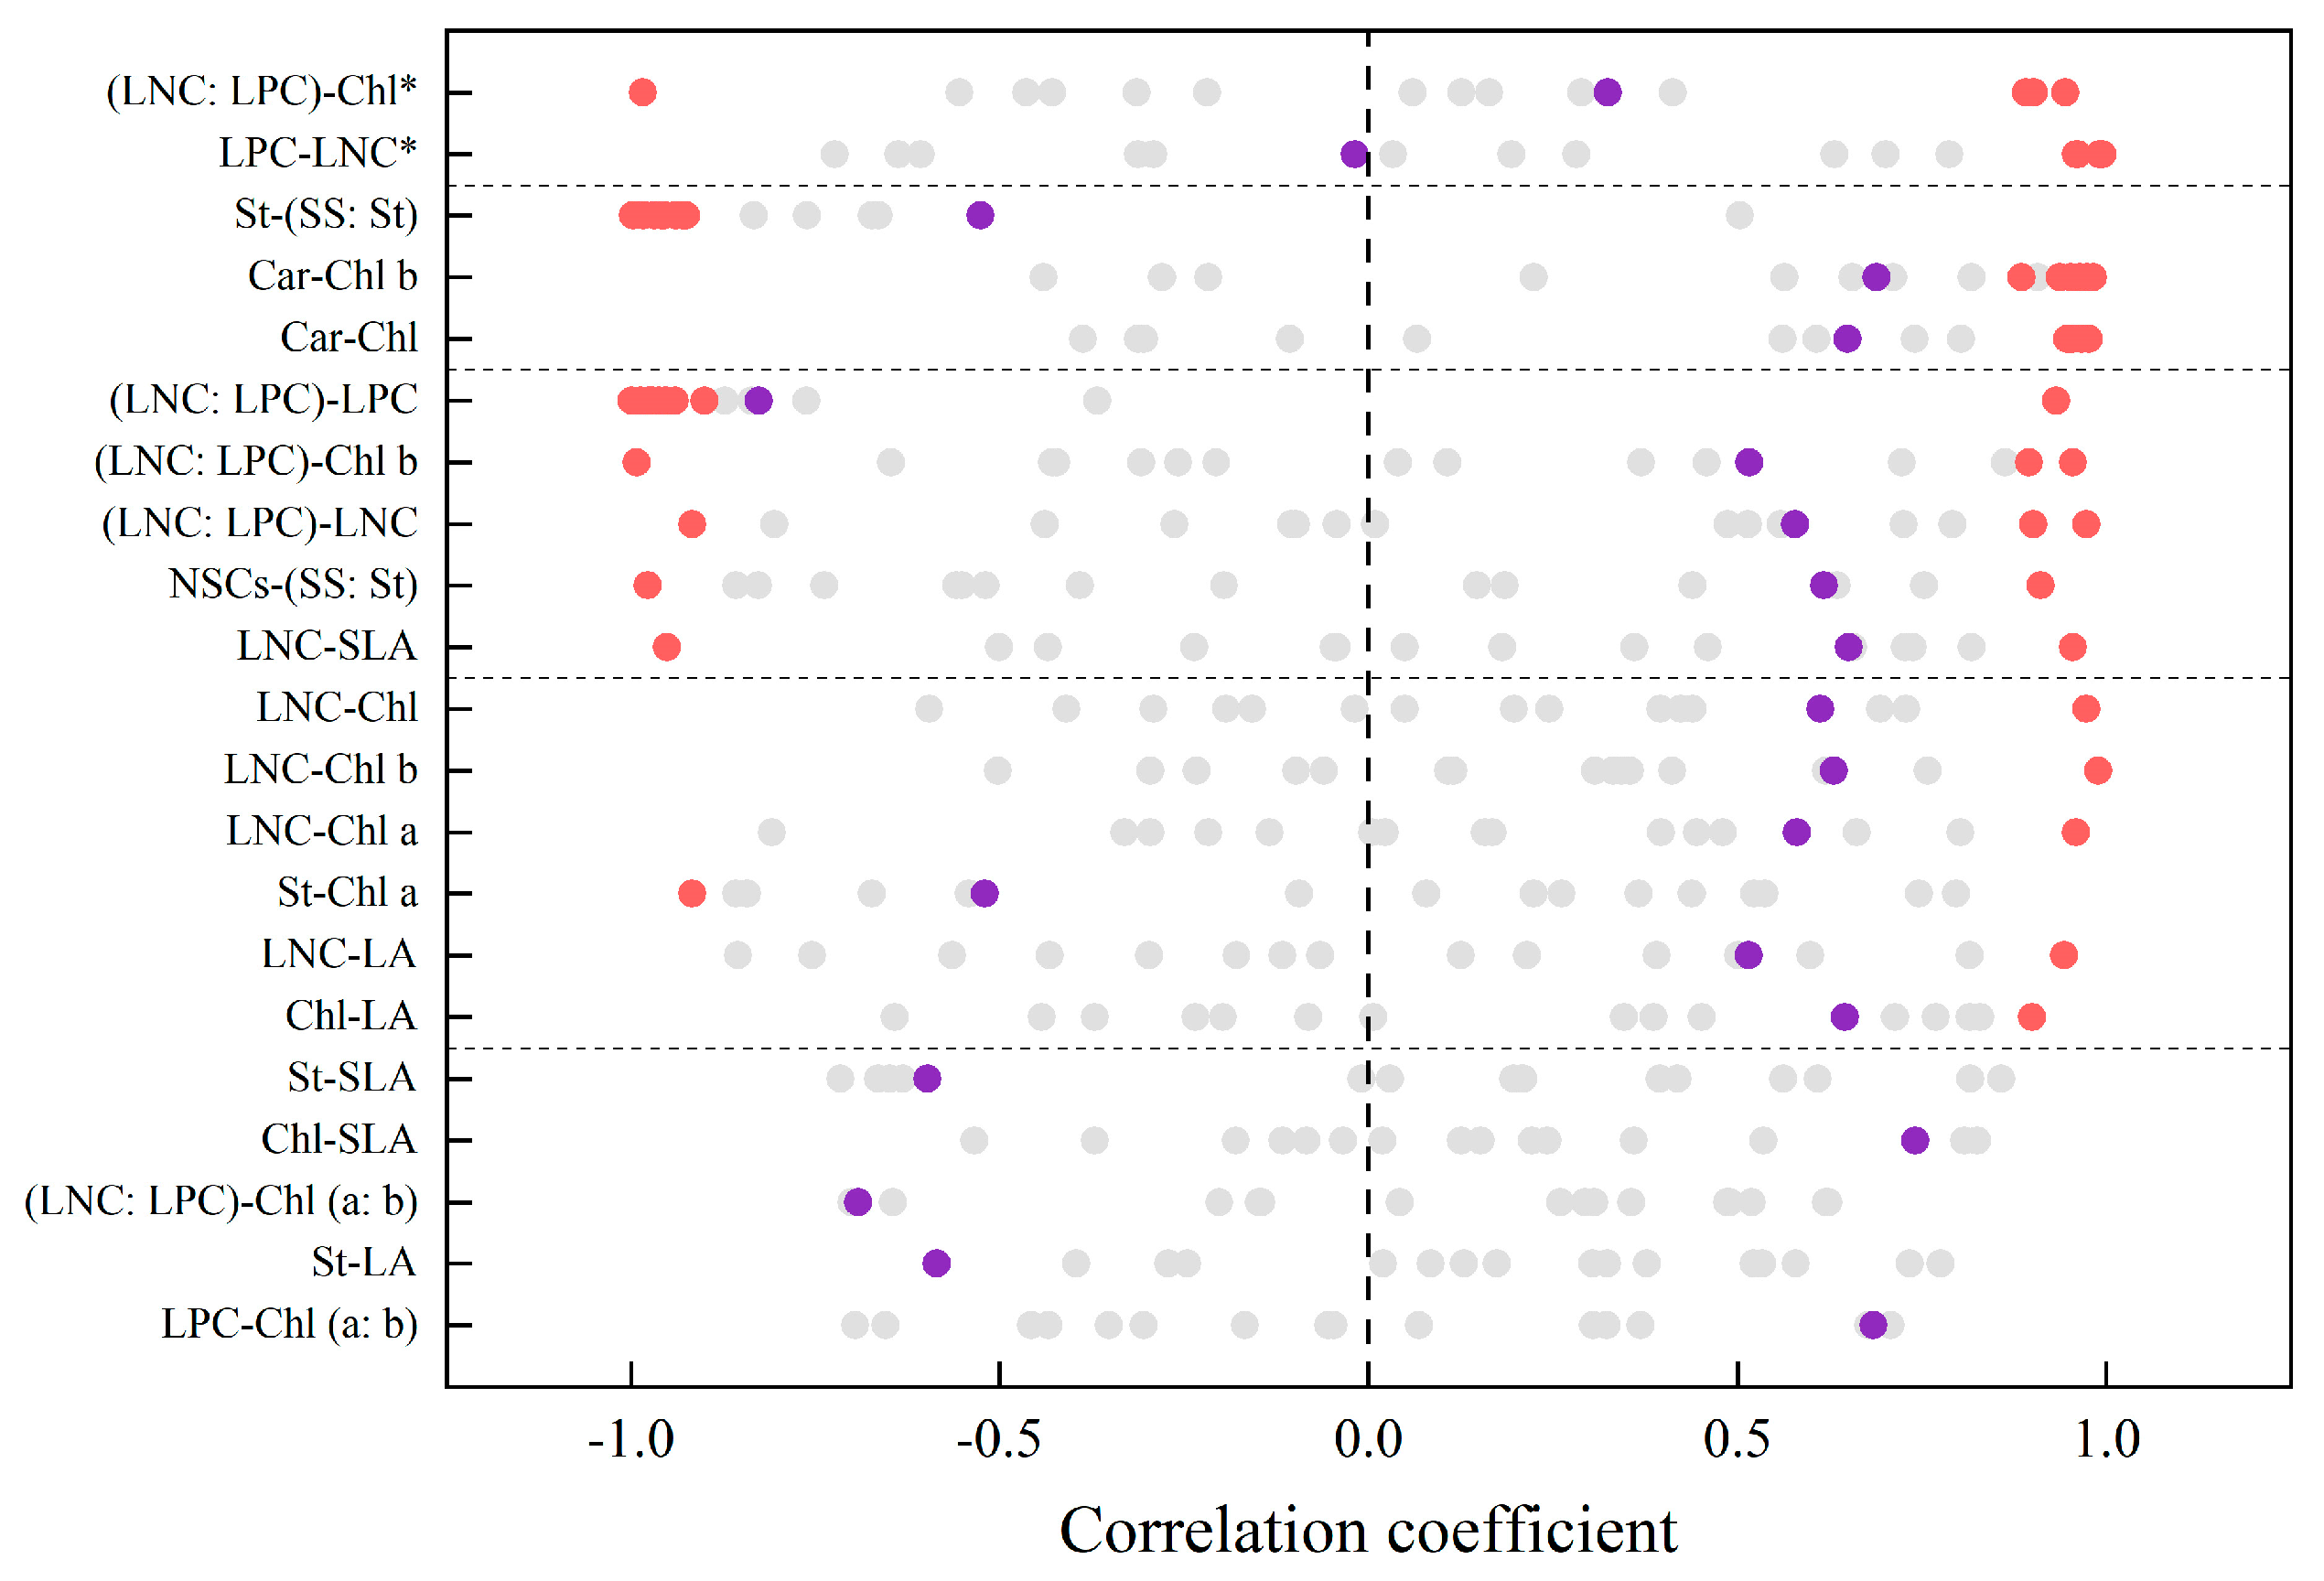
The correlation analysis showed that there were five scenarios of trait–trait relationship (Figure 7). Scenario 1 showed that there was no significant intra-specific trait–trait correlation, but there was a significant inter-specific trait–trait correlation. Scenario 2 indicated that only one species had a significant trait–trait correlation, and there was a significant inter-specific correlation. Scenario 3 showed that at least one species’ trait–trait relationship was significantly positively correlated, while at least one species was significantly negatively correlated, and there was a significant inter-specific correlation. Scenario 4 indicated that there was a significant positive correlation or a significant negative correlation at the inter-species and intra-species (at least two species) scales. Scenario 5 showed that there was a significant intra-specific trait–trait correlation, but there was no significant inter-specific correlation. In general, there was no significant trait–trait correlation in most species. The intra-specific trait–trait relationship in a few species was significantly correlated, and |r| > 0.90. When there was a significant inter-specific trait–trait correlation, 0.02 < |r| < 0.83.
The first principal component (PC1) explained 33.6% of the trait variation (Figure 8). LES traits and the functional traits related to metabolic rate (SS:St) were concentrated in the positive half axis, and the NSCs related to drought tolerance was distributed in the negative half axis. The second principal component (PC2) explained 25.8% of the trait variation, in which Chl (a:b) related to shade tolerance was distributed on the positive axis, and LNC:LPC, reflecting nutrient limitation, was distributed on the negative axis.
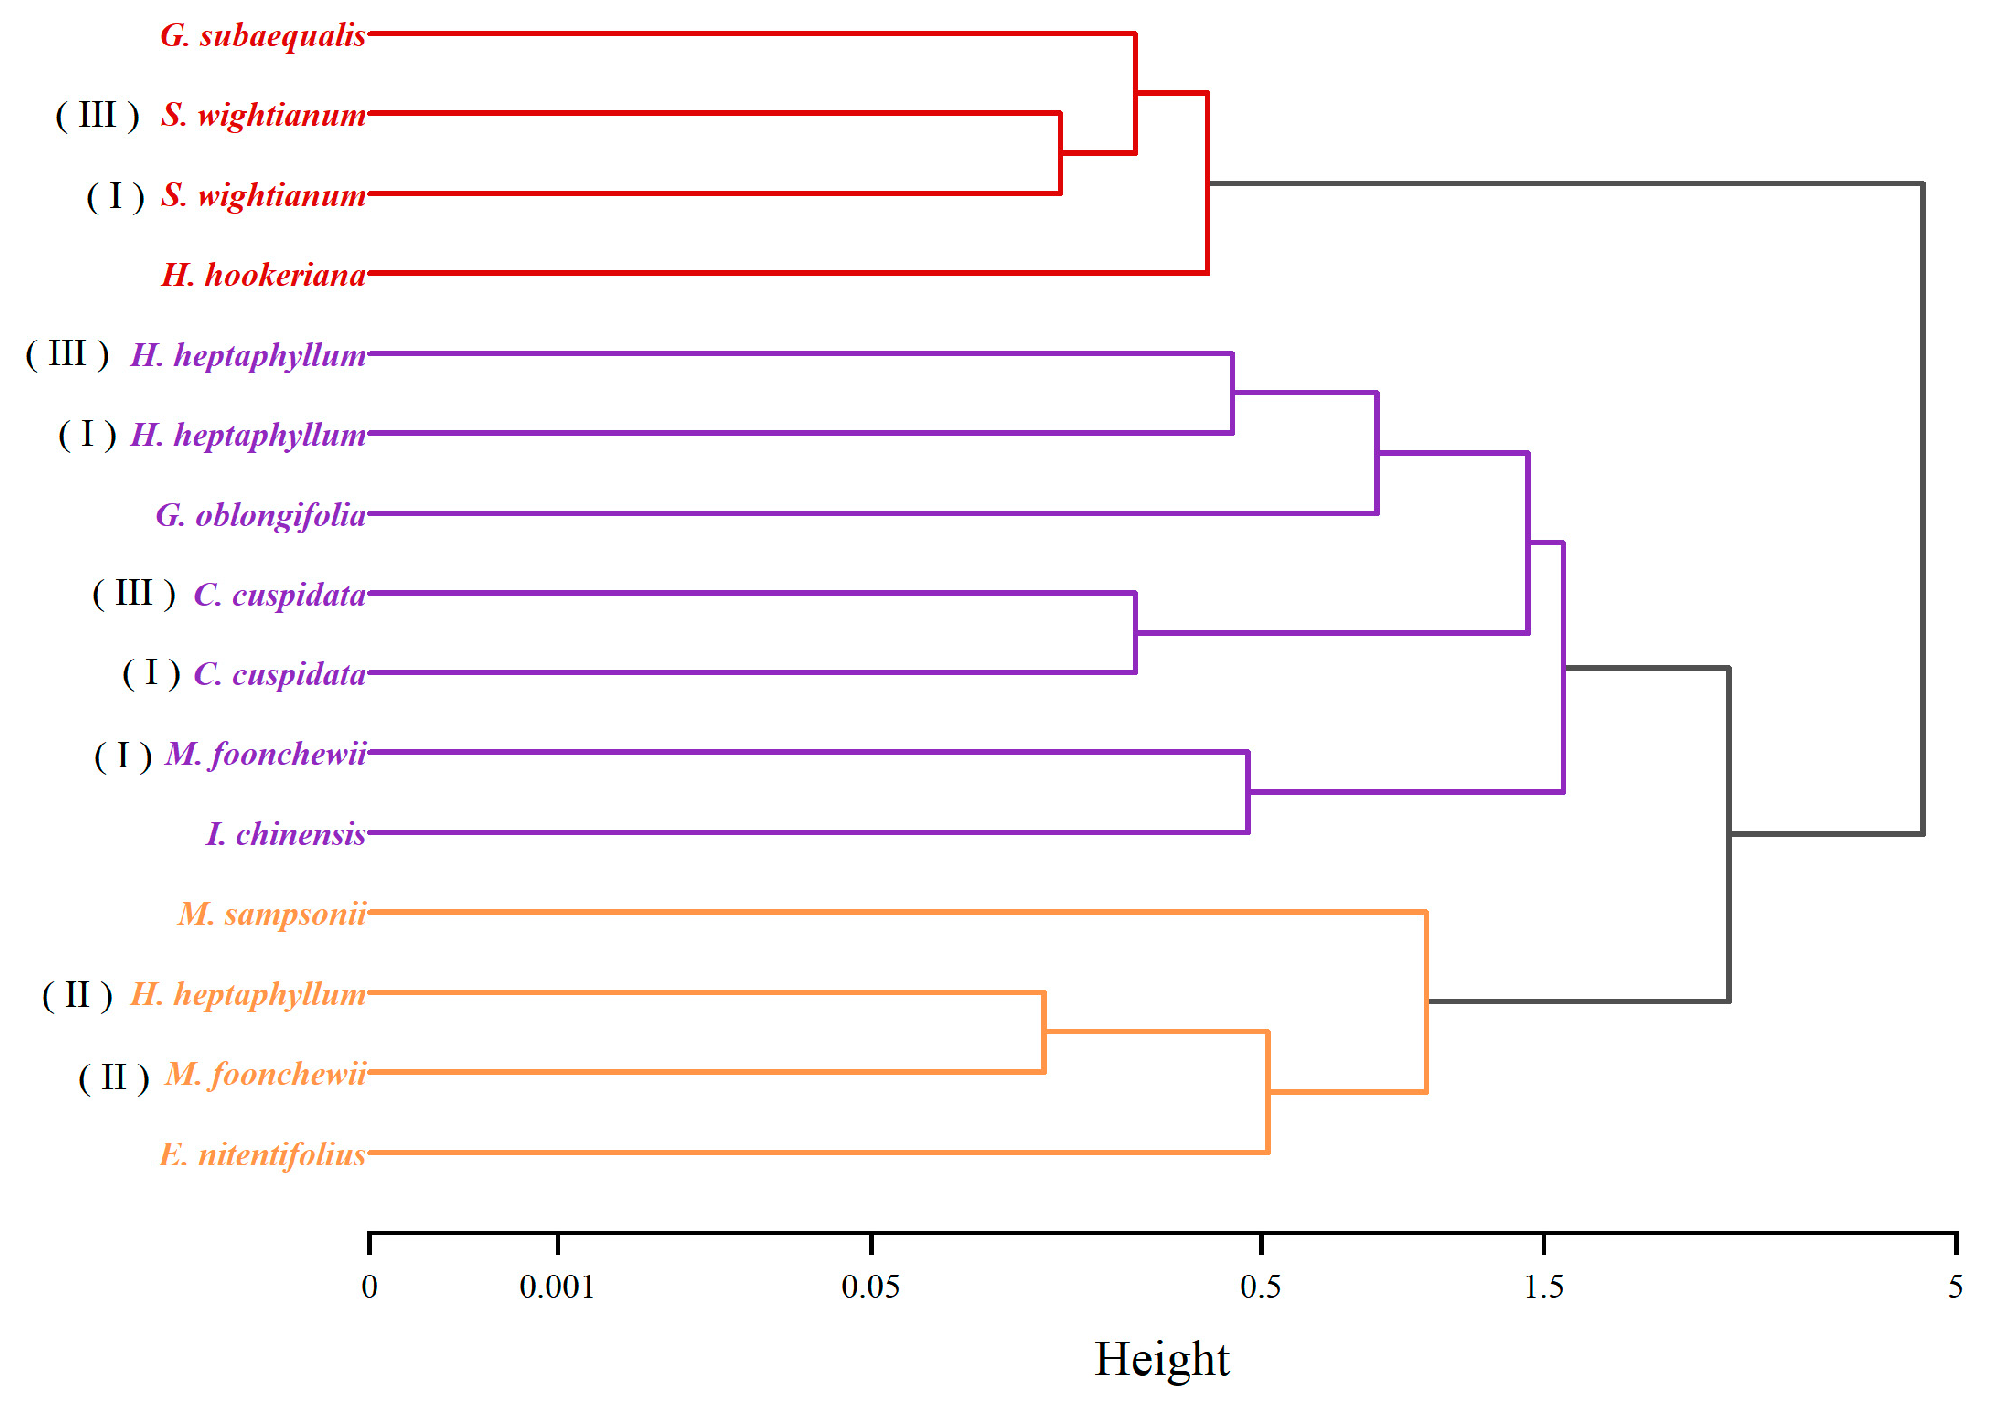
Leaf functional traits of 15 dominant tree species were clustered into three categories (Figure 9). In the first category, there were three species of maturity level III and one species of maturity level I. There were two species of maturity level III, four species of maturity level I and one species of maturity level II in the second category. There were four species of maturity level II in the third category. Moreover, the same tree species were more likely to be divided into the same category.

4. Discussion

4.1. Difference in Leaf Functional Traits among the Three Maturity Levels

Among the three maturity levels, there were significant differences in resource acquisition and photosynthetic capacity (e.g., LA, SLA, Chl b, Chl), stress tolerance (e.g., SS, St, SS:St), and leaf nutrient content (e.g., LNC, LPC, LNC:LPC) (Figure 2, Figure 3 and Figure 4). Previous studies have shown that forest secondary succession was usually characterized by an increase in soil fertility and a decrease in understory light availability [15,16]. These developed the environmental filters associated with changes in the availability of light, water and soil nutrients [55], thus led to the adaptive changes in leaf traits, and therefore resulted in differences in leaf functional traits in three maturity levels in our studied monsoon forest [9,17]. However, the variation in leaf functional traits was not always consistent with the maturity levels, which did not support our first hypothesis. Previous studies have shown that as the succession proceeds, plants gradually shift the growth strategies from quick returns on investments in nutrients and carbon to a conservative approach [9,17]. For instance, SLA, LNC, and LPC, etc., were gradually reduced as the succession proceededd [56,57]. In addition, a lower level of solar radiation was received by the plants in the late successional stage [15], which led to an increase in the shade tolerance of the plants, thus resulting in an increase in NSCs [58]. However, our results showed that LA, SLA, and Chl b increased while leaf SS and St decreased with maturity levels, which suggested that the monsoon forest was still experiencing the early stage of the succession in our studied region. Moreover, most of the trees in three maturity levels were fast-growing species, whose resource availability was not yet saturated [59], allowing those trees to continue to develop traits associated with high metabolic rate and capacity for light and nutrient acquisition. However, for the traits including leaf NSCs, Chl, and Car, etc., there were no significant differences among the three maturity levels, probably because of the great similarity of the dominant tree species [60]. However, leaf Chl (a:b), SS:St, LNC, LPC, and LNC:LPC in maturity level I were median, which was between those of the maturity levels II and III. The authors of previous studies commented that different phenotypic arrangements of species along environmental gradients may lead to rugged landscapes, but they are not typically considered unimodal landscapes [61]. In the three maturity levels, species composition and community structure interacted with environment factors [62], resulting in differences in the availability of resources, such as light, space, water, and soil nutrients [57,63,64], which allowed the dominant tree species to respond to the ecological requirements imposed by the environment through trait combinations [65,66]. Therefore, this led to the inconsistent responses of different traits to different maturity levels. Moreover, H. heptaphyllum was the only dominant tree species that was present in all three maturity levels, indicating that the species had high phenotypic plasticity and was able to adapt to the changing successional environment [22,67].
According to principal component analysis (PCA), the partial overlap of confidence ellipses indicated that the changes in traits were continuous among the three maturity levels, which was supported by the previous findings [68]. The species in maturity level II were concentrated on the positive half axis of PC2, indicating that the five dominant tree species in this maturity level were convergent on LPC and Chl (a:b). However, there was a trade-off between stress tolerance (NSCs) and metabolic capacity (SS:St), resource acquisition (LA, SLA), and photosynthetic capacity (Chl, LNC), which suggested that there was a tight relationship between LES traits and the other major ecological strategy dimensions of leaf functional traits (such as stress tolerance traits). Similarly, most of the traits of trees in maturity level III were distributed in quadrant IV, indicating that the dominant tree species (except for C. cuspidata, etc.) had invested their traits in increasing resource acquisition (LA, SLA), photosynthetic capacity (Chl, LNC), and shade tolerance (Chl (a:b)), and these species in maturity level III might be limited by nutrient limitation (LNC:LPC). Additionally, the special position of the C. cuspidata in maturity level III (higher abundance but smaller DBH) had allowed it to adapt to the understory shade environment using a relatively conservative strategy (such as producing more NSCs). However, the leaf traits of maturity level I mainly showed convergence in shade tolerance (Chl (a:b)) and stress tolerance (NSCs), and were more deficient in resource acquisition strategies, which may be related to the more infertile soil environment and supported by the previous results [6]. Long-term field-based studies have shown that tropical trees under phosphorus-deficient conditions tend to store higher NSCs and maintain lower levels of LPC [69] and lower SLA, tending to better adapt to arid and resource-poor habitats [40]. Moreover, plants in low-nutrient environments tend to adopt conservative strategies, such as accumulating more NSCs and maintaining lower Chl (a:b) to survive under environmental stresses. In contrast, plants in environments with high resource availability tend to adopt resource acquisition strategies, and leaves usually have the characteristics of promoting quick returns on investments in nutrients and carbon, such as high SLA, high Chl, and high LNC and LPC to increase photosynthetic rate [9,17], and high SS:St to increase metabolic rate, as well as increased Car to improve the photoprotection of the photosynthetic system [70]. In conclusion, our results demonstrate that there is indeed a trade-off between stress tolerance and shade tolerance with resource acquisition, photosynthetic capacity and leaf nutrient cycling.
In previous studies, forest structure (canopy height, tree density, basal area, and richness) and species composition were commonly used to judge the success of vegetation restoration [71,72]. Recently, many studies have shown that the restoration methods based on plant functional traits were important for judging forest restoration [55,73,74], because the regeneration of ecosystem function may be slower than the recovery of forest structure and species composition [55]. Therefore, incorporating plant functional traits into the evaluation system can provide a more comprehensive assessment of community restoration and stability [55,73,74]. Our results indicated that the leaf functional traits in the E’ huangzhang monsoon forest did not show a unimodal curve with maturity level gradients, which supported the above viewpoint. There may be decoupling between the function regeneration and the recovery of forest structure and species composition in the studied monsoon forest [55]. Finally, Ward’s hierarchical clustering can group species living in similar environments together, and we verified the traits to be used as a basis for the rough division of maturity levels. Our results showed that at least three species of each maturity level were clustered into one group, but the species of the maturity levels I and III were not well distinguished. Although this may be due to the fact that community assembly was largely neutral [75], differences in landscape configuration, edaphic conditions, biotic interactions, and initial colonization patterns also significantly affected community assembly [60]. It is a pity that the above factors were not completely addressed in this study. Therefore, relying only on the LES, shade tolerance, and stress tolerance of dominant tree species, the ecosystem function cannot be assessed integrally. We recommend the combination of more dimensional functional traits to measure community stability and restoration, so we can better understand the community assembly process [76].

4.2. Trait Variation and Trait–Trait Relationships at Different Scales

The first scenario of traits’ variance (e.g., LPC and LNC:LPC) were mainly affected by the maturity levels at the scale of all three maturity levels (Figure 6). Studies have shown that LPC was mainly derived from the absorption of soil phosphorus [37]. It is believed that phosphorus is the main limiting nutrient element for tree growth in the tropical and subtropical forests of southern China [77]. The soil available phosphorus in our studied forest was only 2.76~7.49 mg·kg−1, which was much lower than the average level of 27.9 mg·kg−1 in China [77]. This indicates that soil phosphorus may play the role of environmental filter [12]. The significant differences in soil phosphorus supplement among three communities (Table 4) resulted in the variation in LPC and LNC:LPC, which was greatly affected by the maturity levels (Figure 6). The inter-specific variance of most traits (such as the second scenario of traits) was greater than the intra-specific variance, whether at a scale of a single maturity level or a scale of three maturity levels (Figure 5 and Figure 6). Moreover, Ward’s hierarchical clustering showed that the same species were more inclined to be divided into the same group (compared to being grouped into the same maturity level; Figure 9), such as S. wightianum, H. heptaphyllum, and C. cuspidata. Thus, at the scale of three maturity levels, the inter-specific variation in traits was stronger than maturity levels’ effect. In fact, many previous studies have shown that the variation in most functional traits under the successional gradient was explained by inter-specific variation rather than intra-specific variation [60]. These traits were mainly affected by genetic factors, and then had stable variation characteristics [2]. The importance of intra-specific variation was highlighted by the third scenario of traits co-dominated by inter-specific and intra-specific variation, and the fourth scenario of traits co-dominated by maturity levels and intra-specific variation, where the intra-specific variation in St was as high as 55.84%. Studies have shown that the intra-specific variation in traits may exceed inter-specific variation at smaller spatial scales [78,79]. Differences in microenvironments at region scales [65] may lead to adaptive changes in intra-specific traits by different individuals within a species in response to local selection pressures through genetic variation and phenotypic plasticity [25]. Thus, the intra-specific variation in traits may be a major factor affecting the ability of species to settle in new environments or resist environmental changes [80,81], and St may be the most sensitive trait in the studied monsoon forest (Figure 6).
The results of our study indicated that there was a deviation in the trait–trait relationship at different scales. The trait–trait relationship reflected the covariation of the two traits at the inter-specific and intra-specific scales. Studies have shown that leaf Chl and Car were the most convergent pair of traits, and their trait correlation coefficients were significant and greater than 0.8 at inter-species and all intra-species scales [7]. However, in our studied monsoon forest, a highly significant correlation was found within only a part of intra-species and this trait–trait relationship was weakened when the scales increased to inter-species (scenario 4). Moreover, the relationship of LNC:LPC in a previous study showed a highly significant correlation in inter-species and most of the intra-species scales [7], but our results indicated that only a small proportion of intra-species scales were significantly highly correlated, while inter-species and most of the intra-species scales showed no significant correlation (scenario 5). This suggests that the decoupling of trait relationships may be common [82,83] and that LES needs to be applied with caution while being widely used [32]. In addition, SLA and LNC in this study were significantly positively correlated at the inter-species scale (r = 0.65, p < 0.01), whereas they showed either a significant high correlation (|r| > 0.95, p < 0.05) or no significant correlation (p > 0.05) at intra-species scales. These results indicated that the trait–trait relationship at the intra-specific levels was often stronger or more extreme (Figure 7), while the relationship was generally weakened at the scale of the three maturity levels. This is similar to the previous findings from Anderegg, et al. [32] and Fajardo and Siefert [52]. Related to the leaf life span, genetic differences, and phenotypic plasticity, trait–trait relationships at global scales tend to break down or even reverse at region scales, inter-species scales or intra-species scales [32,52]. The sample sizes of an individual of a single tree species in this study were small, and the range of variation in leaf life span covered by a single species might not be sufficient to indicate traits’ trade-offs. The principal component analysis reflected the inter- and intra-specific multi-trait relationships in different maturity levels. The three maturity levels spanned a greater range on PC1 (which largely reflected the traits of LES, metabolic rate, and stress tolerance), compared to the traits of shade tolerance and leaf nutrient content. This result suggests that species respond to environmental filters and species competition by changing traits mainly on PC1 at the scales of each maturity level. Moreover, the intra-specific variation in LA was slightly larger than the inter-specific variation at the scales of the singe maturity level (Figure 5b), but the inter-specific variation was much larger than the intra-specific variation at the scale of three maturity levels (Figure 6). These results indicated that there might be differences in selection pressures at different scales [32]. We highlight the need to increase the sample size of communities, species, and individuals in future studies, for an in-depth exploration of the trait–covariation relationship and the environment–trait relationship at different scales, and in order to deepen the understanding of the mechanism of community assembly in E’ huangzhang monsoon forests.

5. Conclusions

Our results corroborated that maturity levels significantly affected leaf functional traits. With the increase in maturity levels, SLA increased, and leaf SS and NSCs decreased, while other leaf functional traits did not show a consistent pattern. Additionally, there were functional traits that showed trade-off or synergistic relationships with LES in the E’ huangzhang monsoon forest. The dominant tree species in low nutrient environments tended to adopt a conservative strategy by accumulating higher NSCs and maintaining lower Chl (a:b) to survive under environmental stresses; and the dominant tree species in high resource availability environments adopted a resource acquisition strategy by possessing higher levels of LES, and maintained a high SS:St to support higher metabolic rates and more Car to improve photoprotection. At the three maturity levels scale, variance in LPC and LNC:LPC was mainly influenced by maturity levels. LA, SLA, Chl b, Car, SS, SS:St, NSCs, LNC varied mainly due to inter-specific variation. Chl a, Chl varied mainly due to interspecific and intraspecific variation. Chl (a:b) varied mainly due to maturity levels and intra-specific variation. LPC, LNC, and St were the key traits in response to selection pressure at maturity levels, inter-specific and intra-specific scales, respectively. There were differences in trait–trait relationships at different scales. The trait–trait relationships were stronger or more extreme as the scale was narrowed. Overall, we highlight the need to increase the sample size of communities, species, and individuals in subsequent studies, and should combine community structure, species composition, community habitat and more dimensions of functional traits to explore the trait–covariation relationship and the environment–trait relationship at different scales, in order to deepen the understanding of the mechanism of community assembly in E’ huangzhang monsoon forests, and to measure the community stability, recovery and ecosystem function.

Author Contributions

Conceptualization, M.W., Y.L. and Q.M.; methodology, M.W. and Y.L.; software, Y.L.; validation, Y.L., Y.Y., Z.H. and X.G.; formal analysis, Y.L., Z.H., X.G. and M.W.; investigation, M.W. and Z.H.; resources, Z.H. and Y.T.; data curation, Z.H.; writing—original draft preparation, M.W., Y.L. and Q.M.; writing—review and editing, Q.Z. and Q.M.; visualization, Y.L., Y.Y. and Z.H.; supervision, Q.M.; project administration, Q.M.; funding acquisition, Q.M. All authors have read and agreed to the published version of the manuscript.

Funding

This research was funded by Guangdong Basic and Applied Basic Research Foundation, China (2023A1515012129), and the Innovation Foundation of Guangdong Forestry (2022KJCX017).

Data Availability Statement

All data relevant to the study are included in the article.

Conflicts of Interest

The authors declare no conflicts of interest.

References

  1. Liu, X.; Ma, K. Plant Functional Traits-Concepts, Applications and Future Directions. Sci. Sin. Vitae 2015, 45, 325–339. [Google Scholar] [CrossRef]
  2. Tang, Q.; Huang, Y.; Ding, Y.; Zang, R. Interspecific and Intraspecific Variation in Functional Traits of Subtropical Evergreen and Deciduous Broad-Leaved Mixed Forests. Biodivers. Sci. 2016, 24, 262–270. [Google Scholar] [CrossRef]
  3. Qin, J.; Shangguan, Z. Effects of Forest Types on Leaf Functional Traits and their Interrelationships of Pinus massoniana Coniferous And Broad-Leaved Mixed Forests in the Subtropical Mountain, Southeastern China. Ecol. Evol. 2019, 9, 6922–6932. [Google Scholar] [CrossRef] [PubMed]
  4. Huang, L.; Yu, Y.; An, X.; Yu, L.; Xue, Y. Leaf Functional Traits, Species Diversity and Functional Diversity of Plant Community in Tiankeng Forests. Acta Ecol. Sin. 2022, 42, 10264–10275. [Google Scholar] [CrossRef]
  5. Liu, W.; Li, J.; Gong, J.; Zhao, L.; Xiang, W.; Cheng, X.; Wang, W.; Zhang, Y. Variation in Leaf Functional Traits and Adaptation Strategies of Dominant Tree Species in a Lithocarpus glaber-Cyclobalanopsis glauca Evergreen Broad-Leaved Forest. Acta Ecol. Sin. 2022, 42, 7256–7265. [Google Scholar] [CrossRef]
  6. Pan, Y.; Chen, X.; Jiang, Y.; Liang, S.; Lu, Z.; Huang, Y.; Ni, M.; Qin, C.; Liu, R. Changes in leaf functional traits and soil environmental factors in response to slope gradient in Karst hills of Guilin. Acta Ecol. Sin. 2018, 38, 1581–1589. [Google Scholar] [CrossRef]
  7. Wang, Z.; Townsend, P.A.; Kruger, E.L. Leaf Spectroscopy Reveals Divergent Inter- and Intra-Species Foliar Trait Covariation and Trait-Environment Relationships across Neon Domains. New Phytol. 2022, 235, 923–938. [Google Scholar] [CrossRef]
  8. Yin, Q.; Wang, L.; Lei, M.; Dang, H.; Quan, J.; Tian, T.; Chai, Y.; Yue, M. The Relationships between Leaf Economics and Hydraulic Traits of Woody Plants Depend on Water Availability. Sci. Total Environ. 2018, 621, 245–252. [Google Scholar] [CrossRef] [PubMed]
  9. Lohbeck, M.; Lebrija-Trejos, E.; Martinez-Ramos, M.; Meave, J.A.; Poorter, L.; Bongers, F. Functional Trait Strategies of Trees in Dry and Wet Tropical Forests are Similar but Differ in their Consequences for Succession. PLoS ONE 2014, 10, e0123741. [Google Scholar] [CrossRef]
  10. Shipley, B.; De Bello, F.; Cornelissen, J.H.; Laliberte, E.; Laughlin, D.C.; Reich, P.B. Reinforcing Loose Foundation Stones in Trait-Based Plant Ecology. Oecologia 2016, 180, 923–931. [Google Scholar] [CrossRef]
  11. Diaz, S.; Hodgson, J.G.; Thompson, K.; Cabido, M.; Cornelissen, J.H.C.; Jalili, A.; Montserrat-Martí, G.; Grime, J.P.; Zarrinkamar, F.; Asri, Y.; et al. The Plant Traits that Drive Ecosystems: Evidence from Three Continents. J. Veg. Sci. 2004, 15, 295–304. [Google Scholar] [CrossRef]
  12. Jiang, L.; Wei, C.; He, Z.; Zhu, J.; Xing, C.; Wang, X.; Liu, J.; Shen, C.; Shi, Y. Functional Trait Variation of Plant Communities in Canopy Gaps of Castanopsis kawakamii Natural Forest. Chin. J. Plant Ecol. 2022, 46, 267–279. [Google Scholar] [CrossRef]
  13. Maracahipes, L.; Carlucci, M.B.; Lenza, E.; Marimon, B.S.; Marimon, B.H.; Guimarães, F.A.G.; Cianciaruso, M.V. How to Live in Contrasting Habitats? Acquisitive and Conservative Strategies Emerge at Inter- and Intraspecific Levels in Savanna and Forest Woody Plants. Perspect. Plant Ecol. Evol. Syst. 2018, 34, 17–25. [Google Scholar] [CrossRef]
  14. Han, T.; Lu, H.; Ren, H.; Wang, J.; Song, G.; Hui, D.; Guo, Q.; Zhu, S. Are Reproductive Traits of Dominant Species Associated with Specific Resource Allocation Strategies during Forest Succession in Southern China? Ecol. Indic. 2019, 102, 538–546. [Google Scholar] [CrossRef]
  15. Lebrija-Trejos, E.; Meave, J.A.; Poorter, L.; Pérez-García, E.A.; Bongers, F. Pathways, Mechanisms and Predictability of Vegetation Change during Tropical Dry Forest Succession. Perspect. Plant. Ecol. Evol. Syst. 2010, 12, 267–275. [Google Scholar] [CrossRef]
  16. Becknell, J.M.; Powers, J.S. Stand Age and Soils as Drivers of Plant Functional Traits and Aboveground Biomass in Secondary Tropical Dry Forest. Can. J. For. Res. 2014, 44, 604–613. [Google Scholar] [CrossRef]
  17. Lohbeck, M.; Poorter, L.; Lebrija-Trejos, E.; Martinez-Ramos, M.; Meave, J.A.; Paz, H.; Perez-Garcia, E.A.; Romero-Perez, I.E.; Tauro, A.; Bongers, F. Successional Changes in Functional Composition Contrast for Dry and Wet Tropical Forest. Ecology 2013, 94, 1211–1216. [Google Scholar] [CrossRef] [PubMed]
  18. Baraloto, C.; Hardy, O.J.; Paine, C.E.T.; Dexter, K.G.; Cruaud, C.; Dunning, L.T.; Gonzalez, M.-A.; Molino, J.-F.; Sabatier, D.; Savolainen, V.; et al. Using Functional Traits and Phylogenetic Trees to Examine the Assembly of Tropical Tree Communities. J. Ecol. 2012, 100, 690–701. [Google Scholar] [CrossRef]
  19. Jung, V.; Violle, C.; Mondy, C.; Hoffmann, L.; Muller, S. Intraspecific Variability and Trait-Based Community Assembly. J. Ecol. 2010, 98, 1134–1140. [Google Scholar] [CrossRef]
  20. Messier, J.; McGill, B.J.; Lechowicz, M.J. How do Traits Vary across Ecological Scales? A Case for Trait-Based Ecology. Ecol. Lett. 2010, 13, 838–848. [Google Scholar] [CrossRef]
  21. Albert, C.H.; Thuiller, W.; Yoccoz, N.G.; Douzet, R.; Aubert, S.; Lavorel, S. A Multi-Trait Approach Reveals the Structure and the Relative Importance of Intra- Vs. Interspecific Variability in Plant Traits. Funct. Ecol. 2010, 24, 1192–1201. [Google Scholar] [CrossRef]
  22. Plourde, B.T.; Boukili, V.K.; Chazdon, R.L.; Anten, N. Radial Changes in Wood Specific Gravity of Tropical Trees: Inter- and Intraspecific Variation during Secondary Succession. Funct. Ecol. 2014, 29, 111–120. [Google Scholar] [CrossRef]
  23. Su, C.; Duan, Y.; Zhenying, G.; Zheng, P.; HUang, X.; Fei, Y.; Zhou, M. Effects of Water Stress on the Physiological and Photosynthetic Characteristics of Phoebe bournei Seedlings. J. Cent. South Univ. For. Technol. 2022, 42, 85–92. [Google Scholar] [CrossRef]
  24. Li, X.; Pan, P.; Zang, H.; Ning, J.; Ouyang, X.; Li, X.; Gui, Y.; Wu, Z. Study on Factors Affecting Natural Regeneration of Natural Secondary Phoebe bournei Forest. For. Res. 2017, 30, 701–708. [Google Scholar] [CrossRef]
  25. He, Y.; Yao, Y.; Yao, Y.; Jiang, Y.; Liang, S.; Li, Y.; Liang, H.; Zhao, Q.; Huang, Y.; Ling, C. Interspecific and Intraspecific Variation of Functional Traits of Woody Species in the Dominant Cyclobalanopsis glauca Community in the Karst Area of Guilin City, Southwest China. Acta Ecol. Sin. 2021, 41, 8237–8245. [Google Scholar] [CrossRef]
  26. Siefert, A.; Violle, C.; Chalmandrier, L.; Albert, C.H.; Taudiere, A.; Fajardo, A.; Aarssen, L.W.; Baraloto, C.; Carlucci, M.B.; Cianciaruso, M.V.; et al. A Global Meta-Analysis of the Relative Extent of Intraspecific Trait Variation in Plant Communities. Ecol. Lett. 2015, 18, 1406–1419. [Google Scholar] [CrossRef] [PubMed]
  27. Violle, C.; Enquist, B.J.; McGill, B.J.; Jiang, L.; Albert, C.H.; Hulshof, C.; Jung, V.; Messier, J. The Return of the Variance: Intraspecific Variability in Community Ecology. Trends Ecol. Evol. 2012, 27, 244–252. [Google Scholar] [CrossRef] [PubMed]
  28. Kang, M.; Chang, S.X.; Yan, E.-R.; Wang, X.-H.; Bartha, S. Trait Variability Differs between Leaf and Wood Tissues across Ecological Scales in Subtropical Forests. J. Veg. Sci. 2014, 25, 703–714. [Google Scholar] [CrossRef]
  29. Wright, I.J.; Reich, P.B.; Westoby, M.; Ackerly, D.D.; Baruch, Z.; Bongers, F.; Cavender-Bares, J.; Chapin, T.; Cornelissen, J.H.; Diemer, M.; et al. The worldwide leaf economics spectrum. Nature 2004, 428, 821–827. [Google Scholar] [CrossRef]
  30. Diaz, S.; Kattge, J.; Cornelissen, J.H.; Wright, I.J.; Lavorel, S.; Dray, S.; Reu, B.; Kleyer, M.; Wirth, C.; Prentice, I.C.; et al. The Global Spectrum of Plant Form and Function. Nature 2016, 529, 167–171. [Google Scholar] [CrossRef]
  31. Chauvin, K.M.; Asner, G.P.; Martin, R.E.; Kress, W.J.; Wright, S.J.; Field, C.B. Decoupled Dimensions of Leaf Economic and Anti-Herbivore Defense Strategies in a Tropical Canopy Tree Community. Oecologia 2018, 186, 765–782. [Google Scholar] [CrossRef] [PubMed]
  32. Anderegg, L.D.L.; Berner, L.T.; Badgley, G.; Sethi, M.L.; Law, B.E.; HilleRisLambers, J. Within-Species Patterns Challenge Our Understanding of the Leaf Economics Spectrum. Ecol. Lett. 2018, 21, 734–744. [Google Scholar] [CrossRef]
  33. Reich, P.B.; Cornelissen, H. The World-Wide ‘Fast-Slow’ Plant Economics Spectrum: A Traits Manifesto. J. Ecol. 2014, 102, 275–301. [Google Scholar] [CrossRef]
  34. Yu, Y.; Liu, Y.; Wang, Y.; Zhou, Q.; Long, F.; Zhao, Q.; He, Q.; Mo, Q. Distribution of Soil Cation Exchange Capacity and Exchangeable Based Cations of E’ huangzhang Montane Rain Forest. Chin. J. Soil Sci. 2022, 53, 1–9. [Google Scholar] [CrossRef]
  35. Liu, Y.; Yu, Y.; Wu, M.; Wang, Y.; Tao, Y.; Lin, Z.; Zhou, Q.; Mo, Q. Characteristics and maturity level analysis of four communities in E’ huangzhang tropical monsoon forests of northern edge. Guihaia 2024, 44, 815–828. [Google Scholar] [CrossRef]
  36. Smith, M.D.; Knapp, A.K. Dominant Species Maintain Ecosystem Function with Non-Random Species Loss. Ecol. Lett. 2003, 6, 509–517. [Google Scholar] [CrossRef]
  37. Hao, M.; Dai, Y.; Yue, Q.; Fan, C.; Zhang, C. Relationship between Functional Diversity of Broadleaved Korean pine Forest and Forest Carbon Sink Function. J. Beijing For. Univ. 2022, 44, 68–76. [Google Scholar] [CrossRef]
  38. Zhang, Y.; Wang, K.; Song, Y.; Su, M.; Li, X.; Li, X. C, N and P Stoichiometric Characteristics of Leaf, Litter and Soil for Subalpine Forests in Central Yunnan, China. Acta Ecol. Sin. 2020, 40, 7648–7658. [Google Scholar] [CrossRef]
  39. Poorter, L. Growth Responses of 15 Rain-Forest Tree Species to a Light Gradient: The Relative Importance of Morphological and Physiological Traits. Funct. Ecol. 2002, 13, 396–410. [Google Scholar] [CrossRef]
  40. Liu, J.; Zeng, D.; LEE, D.K. Leaf Traits and their Interrelationships of Main Plant Species in Southeast Horqin Sandy Land. Chin. J. Ecol. 2006, 25, 921–925. [Google Scholar] [CrossRef]
  41. He, C.; Sun, J.; Chen, Y.; Wang, L.; Shi, S.; Qiu, F.; Wang, S.; Tagesson, T. A New Vegetation Index Combination for Leaf Carotenoid-To-Chlorophyll Ratio: Minimizing the Effect of Their Correlation. Int. J. Digit. Earth 2023, 16, 272–288. [Google Scholar] [CrossRef]
  42. Alvarez-Anorve, M.Y.; Quesada, M.; Sanchez-Azofeifa, G.A.; Avila-Cabadilla, L.D.; Gamon, J.A. Functional Regeneration and Spectral Reflectance of Trees During Succession in a Highly Diverse Tropical Dry Forest Ecosystem. Am. J. Bot. 2012, 99, 816–826. [Google Scholar] [CrossRef] [PubMed]
  43. Alvarenga, A.A.d.; Castro, E.M.d.; Lima Junior, É.d.C.; Magalhães, M.M. Effects of Different Light Levels on the Initial Growth and Photosynthesis of Croton Urucurana Baill. in Southeastern Brazil. Rev. Árvore 2003, 27, 53–57. [Google Scholar] [CrossRef]
  44. Dias, J.; Pimenta, J.A.; Medri, M.E.; Boeger, M.R.T.; Freitas, C.T.d. Physiological Aspects of Sun and Shade Leaves of Lithraea Molleoides (Vell.) Engl. (Anacardiaceae). Braz. Arch. Biol. Technol. 2007, 50, 91–99. [Google Scholar] [CrossRef]
  45. Richardson, A.D.; Carbone, M.S.; Huggett, B.A.; Furze, M.E.; Czimczik, C.I.; Walker, J.C.; Xu, X.; Schaberg, P.G.; Murakami, P. Distribution and Mixing of Old and New Nonstructural Carbon in Two Temperate Trees. New Phytol. 2015, 206, 590–597. [Google Scholar] [CrossRef]
  46. Li, N.; He, N.; Yu, G.; Wang, Q.; Sun, J. Leaf Non-Structural Carbohydrates Regulated by Plant Functional Groups and Climate: Evidences from A Tropical to Cold-Temperate Forest Transect. Ecol. Indic. 2016, 62, 22–31. [Google Scholar] [CrossRef]
  47. Signori-Muller, C.; Oliveira, R.S.; Barros, F.V.; Tavares, J.V.; Gilpin, M.; Diniz, F.C.; Zevallos, M.J.M.; Yupayccana, C.A.S.; Acosta, M.; Bacca, J.; et al. Non-Structural Carbohydrates Mediate Seasonal Water Stress Across Amazon Forests. Nat. Commun. 2021, 12, 2310. [Google Scholar] [CrossRef]
  48. Gusewell, S. N:P Ratios in Terrestrial Plants: Variation and Functional Significance. New Phytol. 2004, 164, 243–266. [Google Scholar] [CrossRef] [PubMed]
  49. Chen, Y.; Wang, Y.; Yu, Y.; Wen, Z.; Peng, Z.; Zhou, Q.; Mo, Q. Seasonal Changes of Leaf Non-Structural Carbohydrate of Plants in Different Layers and its Responses to Nitrogen and Phosphorus Additions in a Secondary Tropical Forest. Acta Ecol. Sin. 2022, 42, 255–265. [Google Scholar] [CrossRef]
  50. Liu, W.; Su, J.; Li, S.; Lang, X.; Huang, X.; Zhang, Z. Variation of Non-Structural Carbonhydrates for the Dominant Species in a Monsoon Broad-Leaved Evergreen Forest in Pu’ Er, Yunnan Province. Sci. Silvae Sin. 2017, 53, 1–9. [Google Scholar] [CrossRef]
  51. Porra, R.J.; Thompson, W.A.; Kriedemann, P.E. Determination of Accurate Extinction Coefficients and Simultaneous Equations for Assaying Chlorophylls A and B Extracted with Four Different Solvents: Verification of the Concentration of Chlorophyll Standards by Atomic Absorption Spectroscopy. BBA-Bioenerg. 1989, 975, 384–394. [Google Scholar] [CrossRef]
  52. Jan, B.; Roel, M. An Improved Colorimetric Method to Quantify Sugar Content of Plant Tissue. J. Exp. Bot. 1993, 44, 1627–1629. [Google Scholar] [CrossRef]
  53. Pinheiro, J.; Bates, D.; R Core Team. nlme: Linear and Nonlinear Mixed Effects Models. R Package Version 3.1-162. 2023. Available online: https://CRAN.R-project.org/package=nlme (accessed on 15 May 2023).
  54. Paradis, E.; Schliep, K. Ape 5.0: An Environment for Modern Phylogenetics and Evolutionary Analyses in R. Bioinformatics 2019, 35, 526–528. [Google Scholar] [CrossRef] [PubMed]
  55. Faccion, G.; Alves, A.M.; do Espírito-Santo, M.M.; Silva, J.O.; Sanchez-Azofeifa, A.; Ferreira, K.F. Intra- and Interspecific Variations on Plant Functional Traits along a Successional Gradient in a Brazilian Tropical Dry Forest. Flora 2021, 279, 151815. [Google Scholar] [CrossRef]
  56. Xi, X.; Zhao, Y.; Liu, Y.; Wang, X.; Gao, X. Variation and Correlation of Plant Functional Traits in Karst Area of Central Guizhou Province, China. Chinese J. Plant Ecol. 2011, 35, 1000–1008. [Google Scholar] [CrossRef]
  57. Bu, W.; Zang, R.G.; Ding, Y.; Zhang, J.; Ruan, Y. Relationships between Plant Functional Traits at the Community Level and Environmental Factors during Succession in a Tropical Lowland Rainforest on Hainan Island, South China. Biodivers. Sci. 2013, 21, 278–287. [Google Scholar] [CrossRef]
  58. Poorter, L.; Kitajima, K. Carbohydrate Storage and Light Requirements of Tropical Moist and Dry Forest Tree Species. Ecology 2007, 88, 1000–1011. [Google Scholar] [CrossRef]
  59. Tor-ngern, P.; Chart-asa, C.; Chanthorn, W.; Rodtassana, C.; Yampum, S.; Unawong, W.; Nathalang, A.; Brockelman, W.; Srinoppawan, K.; Chen, Y.; et al. Variation of Leaf-Level Gas Exchange Rates and Leaf Functional Traits of Dominant Trees across Three Successional Stages in A Southeast Asian Tropical Forest. Forest. Ecol. Manag. 2021, 489, 119101. [Google Scholar] [CrossRef]
  60. Boukili, V.K.; Chazdon, R.L. Environmental Filtering, Local Site Factors and Landscape Context Drive Changes in Functional Trait Composition during Tropical Forest Succession. Perspect. Plant Ecol. Evol. Syst. 2017, 24, 37–47. [Google Scholar] [CrossRef]
  61. Laughlin, D.C. Rugged Fitness Landscapes and Darwinian Demons in Trait-Based Ecology. New Phytol. 2018, 217, 501–503. [Google Scholar] [CrossRef]
  62. Lebrija-Trejos, E.; Perez-Garcia, E.A.; Meave, J.A.; Bongers, F.; Poorter, L. Functional Traits and Environmental Filtering Drive Community Assembly in a Species-Rich Tropical System. Ecology 2010, 91, 386–398. [Google Scholar] [CrossRef]
  63. Ordoñez, J.C.; van Bodegom, P.M.; Witte, J.-P.M.; Wright, I.J.; Reich, P.B.; Aerts, R. A Global Study of Relationships between Leaf Traits, Climate and Soil Measures of Nutrient Fertility. Global. Ecol. Biogeogr. 2009, 18, 137–149. [Google Scholar] [CrossRef]
  64. Vile, D.; Shipley, B.; Garnier, E. A Structural Equation Model to Integrate Changes in Functional Strategies during Old-Field Succession. Ecology 2006, 87, 504–517. [Google Scholar] [CrossRef] [PubMed]
  65. Albert, C.H.; Thuiller, W.; Yoccoz, N.G.; Soudant, A.; Boucher, F.; Saccone, P.; Lavorel, S. Intraspecific Functional Variability: Extent, Structure and Sources of Variation. J. Ecol. 2010, 98, 604–613. [Google Scholar] [CrossRef]
  66. Fajardo, A.; Siefert, A. Intraspecific Trait Variation and the Leaf Economics Spectrum across Resource Gradients and Levels of Organization. Ecology 2018, 99, 1024–1030. [Google Scholar] [CrossRef]
  67. Fang, S.; Cadotte, M.W.; Yuan, Z.; Lin, F.; Ye, J.; Hao, Z.; Wang, X. Intraspecific Trait Variation Improves the Detection of Deterministic Community Assembly Processes in Early Successional Forests, but not in Late Successional Forests. J. Plant Ecol. 2019, 12, 593–602. [Google Scholar] [CrossRef]
  68. Wright, S.J.; Kitajima, K.; Kraft, N.J.; Reich, P.B.; Wright, I.J.; Bunker, D.E.; Condit, R.; Dalling, J.W.; Davies, S.J.; Diaz, S.; et al. Functional Traits and the Growth-Mortality Trade-Off in Tropical Trees. Ecology 2010, 91, 3664–3674. [Google Scholar] [CrossRef] [PubMed]
  69. Mo, Q.; Chen, Y.; Yu, S.; Fan, Y.; Peng, Z.; Wang, W.; Li, Z.; Wang, F. Leaf Nonstructural Carbohydrate Concentrations of Understory Woody Species Regulated by Soil Phosphorus Availability in a Tropical Forest. Ecol. Evol. 2020, 10, 8429–8438. [Google Scholar] [CrossRef] [PubMed]
  70. Favaretto, V.F.; Martinez, C.A.; Soriani, H.H.; Furriel, R.P.M. Differential Responses of Antioxidant Enzymes in Pioneer and Late-Successional Tropical Tree Species Grown Under Sun and Shade Conditions. Environ. Exp. Bot. 2011, 70, 20–28. [Google Scholar] [CrossRef]
  71. Brancalion, P.H.S.; Campoe, O.; Mendes, J.C.T.; Noel, C.; Moreira, G.G.; van Melis, J.; Stape, J.L.; Guillemot, J. Intensive Silviculture Enhances Biomass Accumulation and Tree Diversity Recovery in Tropical Forest Restoration. Ecol. Appl. 2019, 29, e01847. [Google Scholar] [CrossRef]
  72. Kollmann, J.; Meyer, S.T.; Bateman, R.; Conradi, T.; Gossner, M.M.; de Souza Mendonça, M.; Fernandes, G.W.; Hermann, J.-M.; Koch, C.; Müller, S.C.; et al. Integrating Ecosystem Functions into Restoration Ecology-Recent Advances and Future Directions. Restor. Ecol. 2016, 24, 722–730. [Google Scholar] [CrossRef]
  73. Laughlin, D.C. Applying Trait-Based Models to Achieve Functional Targets for Theory-Driven Ecological Restoration. Ecol. Lett. 2014, 17, 771–784. [Google Scholar] [CrossRef] [PubMed]
  74. Carlucci, M.B.; Brancalion, P.H.S.; Rodrigues, R.R.; Loyola, R.; Cianciaruso, M.V. Functional Traits and Ecosystem Services in Ecological Restoration. Restor. Ecol. 2020, 28, 1372–1383. [Google Scholar] [CrossRef]
  75. Emerson, B.C.; Gillespie, R.G. Phylogenetic Analysis of Community Assembly and Structure Over Space and Time. Trends Ecol. Evol. 2008, 23, 619–630. [Google Scholar] [CrossRef] [PubMed]
  76. Yang, J.; Cao, M.; Swenson, N.G. Why Functional Traits Do Not Predict Tree Demographic Rates. Trends Ecol. Evol. 2018, 33, 326–336. [Google Scholar] [CrossRef] [PubMed]
  77. Zhang, J.; Zhang, J.; Shen, J.; Tian, J.; Jin, K.; Zhang, F. Soil Health and Agriculture Green Development: Opportunities and Challenges. Acta Pedol. Sin. 2020, 57, 783–796. [Google Scholar] [CrossRef]
  78. Hulshof, C.M.; Swenson, N.G. Variation in Leaf Functional Trait Values within and Across Individuals and Species: An Example from a Costa Rican Dry Forest. Funct. Ecol. 2010, 24, 217–223. [Google Scholar] [CrossRef]
  79. Messier, J.; McGill, B.J.; Enquist, B.J.; Lechowicz, M.J. Trait Variation and Integration across Scales: Is the Leaf Economic Spectrum Present at Local Scales? Ecography 2017, 40, 685–697. [Google Scholar] [CrossRef]
  80. Silva, M.C.; Teodoro, G.S.; Bragion, E.F.A.; van den Berg, E. The Role of Intraspecific Trait Variation in the Occupation of Sharp Forest-Savanna Ecotones. Flora 2019, 253, 35–42. [Google Scholar] [CrossRef]
  81. Benito Garzón, M.; Alía, R.; Robson, T.M.; Zavala, M.A. Intra-Specific Variability and Plasticity Influence Potential Tree Species Distributions under Climate Change. Global. Ecol. Biogeogr. 2011, 20, 766–778. [Google Scholar] [CrossRef]
  82. Funk, J.L.; Cornwell, W.K. Leaf Traits within Communities: Context May Affect the Mapping of Traits to Function. Ecology 2013, 94, 1893–1897. [Google Scholar] [CrossRef]
  83. Mason, C.M.; Donovan, L.A. Evolution of the Leaf Economics Spectrum in Herbs: Evidence from Environmental Divergences in Leaf Physiology across Helianthus (Asteraceae). Evolution 2015, 69, 2705–2720. [Google Scholar] [CrossRef] [PubMed]
Figure 1. Three communities’ geographic location in E’ huangzhang monsoon forest.
Forests 15 01383 g001
Figure 2. Leaf area, specific leaf area and photosynthetic pigment of the different communities in the monsoon forest. The larger plots represent the mean of the leaf functional traits at the species levels, and the smaller plots represent the mean of leaf functional traits in the maturity levels. The red color represents maturity level I, the green color represents maturity level II, and the purple color represents maturity level III. The vertical bars represent the standard error of the mean (n = 5). Different lowercase letters above the vertical bars indicate the significant difference between the two maturity levels (p < 0.05). The graphic (a) is leaf area, (b) is specific leaf area, (c) is chlorophyll a, (d) is chlorophyll b, (e) is carotenoids, (f) is the sum of Chl a and Chl b, and (g) is Chl a divided by Chl b.
Forests 15 01383 g002
Figure 3. Leaf nonstructural carbohydrate concentrations of the different communities in the monsoon forest. The larger plots represent the mean of the leaf functional traits at the species levels, and the smaller plots represent the mean of leaf functional traits in the maturity levels. The red color represents maturity level I, green color represents maturity level II, and purple color represents maturity level III. The vertical bars represent the standard error of the mean (n = 5). Different lowercase letters above the vertical bars indicate the significant difference between the two maturity levels (p < 0.05). The graphic (a) is soluble sugars, (b) is starch, (c) is SS divided by St, and (d) is the sum of SS and St.
Forests 15 01383 g003
Figure 4. Leaf nutrients concentrations of the different communities in the tropical monsoon forest. The larger plots represent the mean of the leaf functional traits at the species levels, and the smaller plots represent the mean of leaf functional traits in the maturity levels. The red color represents maturity level I, the green color represents maturity level II, and the purple color represents maturity level III. The vertical bars represent the standard error of the mean (n = 5). Different lowercase letters above the vertical bars indicate the significant difference between the two maturity levels (p < 0.05). The graphic (a) is leaf nitrogen content, (b) is leaf phosphorus content, and (c) is LNC divided by LPC.
Forests 15 01383 g004
Figure 5. Leaf functional traits’ coefficient of variation of different communities in the tropical monsoon forest. The yellow box plots represent the distribution of intraspecific variation coefficient, and the histograms represent the interspecific variation coefficient. The graphic (a) is coefficient of variation of Chl a, Chl b, Car and Chl (a:b), (b) is coefficient of variation of LA and SLA, (c) is coefficient of variation of SS, St, SS:St and NSCs, and (d) is coefficient of variation of LNC, LPC and LNC:LPC.
Forests 15 01383 g005
Figure 6. The variance of leaf functional traits of the different communities in the tropical monsoon forest.
Forests 15 01383 g006
Figure 7. Pearson correlation coefficients for pairs of the leaf functional traits of different communities in the tropical monsoon forest. The red dots indicate intra-species with significant correlation (p < 0.05). The gray dots indicate intra-species with no significant correlation (p > 0.05). The purple dots indicate inter-species’ correlation coefficient, and ‘*’ in the y-axis indicates no significant inter-species correlation (p > 0.05), while no ‘*’ in the y-axis indicates a significant inter-species correlation (p < 0.05).
Forests 15 01383 g007
Figure 8. Principal component analysis of multiple leaf functional traits of different communities in tropical monsoon forest.
Forests 15 01383 g008
Figure 9. Ward’s hierarchical clustering of fifteen dominant species in tropical monsoon forest. The parentheses before the species name indicate which maturity levels the species belongs to. For example, ‘(III) S. wightianum’ represents S. wightianum of maturity level III. Species with the same color indicate that they may have grown in the similar environments.
Forests 15 01383 g009
Table 1. Biological and ecological significance of leaf functional traits.
Functional TraitUnitBiological and Ecological Significance
LAmm2Leaf area (LA) reflects the ability of plants to capture light [37]. When suffering drought resistance, it first adapts to the environment by reducing leaf area and reducing leaf width. In wet years, leaf area will increase and leaf length will increase [38]
SLAmg·g−1Specific leaf area (SLA) is one of the leaf economic spectrum traits, reflecting the investment made by plants to capture light per unit area and the plants’ shade tolerance [37]. It reflects the ability of plants to capture resources, and is related to plant growth rate and photosynthetic rate [39]. Plants with larger SLA have a larger resource capture area in their leaves, and thus have a higher net photosynthetic rate. Plants with lower SLA can better adapt to resource-poor and drought environments [40].
Chlmg·g−1Chlorophyll (Chl), the main pigment in plant photosynthesis, converts absorbed light energy into stored chemical energy [41].
Chl (a:b)/Chlorophyll (a:b) is an acquisition strategy related to light capture [42]. The smaller the value, the stronger the shade tolerance of plants [43,44].
Carmg·g−1Carotenoids (Car) are photoprotective to chlorophyll and transfer absorbed light energy to chlorophyll, playing an auxiliary role in plant photosynthesis [41].
NSCsmg·g−1Non-structural carbohydrates (NSCs), which include soluble sugars and starch, reflects the adaptability of plants to environmental stresses [45] and may be a promising criterion for successional classification [46].
SSmg·g−1Soluble sugars (SS) provides immediate energy substrates for respiration, defense, plant stress signaling, phloem transport and osmoregulation [47]. It is also associated with cold tolerance, and the accumulation of soluble sugars helps to stop intracellular ice from harming the plant [48].
Stmg·g−1Starch (St) represents a transient or long-term energy store that plants can convert to SS for use when carbon demand exceeds supply [47].
SS:St/SS:St reflects the plant’s carbon utilization strategy, with higher values indicating that the plant converts more photosynthetic products into soluble sugars to supply vigorous life activities and growth, and lower values indicating that the plant converts more carbon into starch for long term storage and adaptation to a shaded environment [49,50].
LNCmg·g−1Leaf nitrogen content (LNC) is one of the leaf economic spectrum traits, reflecting the ability of plants to acquire nitrogen as well as the maximum photosynthetic rate [37], which is mainly fixed by plants from the atmosphere [29].
LPCmg·g−1Leaf phosphorus content (LPC) is one of the leaf economic spectrum traits and is mainly absorbed from weathering of soil minerals [29].
LNC:LPC/LNC:LPC reflects plant nutrient limitation, when LNC:LPC < 14 for N limitation, LNC:LPC > 16 for P limitation, and 14 < LNC:LPC < 16a for N and P co-limitation [48].
Table 2. Three communities’ vegetational information in E’ huangzhang monsoon forest.
CommunityLatitude and LongitudeAltitudeStand Density/(Stems hm−2)Average DBH/(cm)Average Height/(m)Simpson IndexPielou Evenness IndexMaturity Level
A111°31′25″ E, 21°55′11″ N1006391.674.66 ± 0.15 a5.675 ± 0.10 a0.94 ± 0.02 a0.87 ± 0.03 aIII
B111°33′51″ E, 21°54′55″ N15011,558.333.68 ± 0.09 b4.934 ± 0.07 c0.90 ± 0.02 b0.74 ± 0.03 cI
C111°32′8″ E, 21°55′4″ N1206500.004.48 ± 0.13 a5.063 ± 0.08 b0.94 ± 0.01 a0.84 ± 0.03 bII
Different lowercase letters indicate the significant difference among plots in the same column (p < 0.05).
Table 3. Three communities’ importance value (IV) of dominant species in E’ huangzhang monsoon forest.
CommunitySpeciesAbbreviationIVIV in Total
ASinosideroxylon wightianumS. wightianum11.0735.74
AHeptapleurum heptaphyllumH. heptaphyllum8.27
ACamellia cuspidataC. cuspidata7.39
AHancea hookerianaH. hookeriana5.40
AGironniera subaequalisG. subaequalis3.62
BSinosideroxylon wightianumS. wightianum13.2949.88
BItea chinensisI. chinensis11.51
BCamellia cuspidataC. cuspidata10.02
BHeptapleurum heptaphyllumH. heptaphyllum9.12
BMachilus foonchewiiM. foonchewii5.94
CHeptapleurum heptaphyllumH. heptaphyllum11.9633.19
CMachilus foonchewiiM. foonchewii6.04
CGarcinia oblongifoliaG. oblongifolia6.01
CMacaranga sampsoniiM. sampsonii5.52
CElaeocarpus nitentifoliusE. nitentifolius3.65
Table 4. Soil physicochemical properties of different communities in E’ huangzhang monsoon forest.
CommunityMaturity LevelAPTPTNpH
AIII4.53 ± 0.45 b0.1 ± 0.00 b2.77 ± 0.04 b5.06 ± 0.04 a
BI2.76 ± 0.59 c0.08 ± 0.01 b1.91 ± 0.01 c4.78 ± 0.02 b
CII7.49 ± 0.55 a0.16 ± 0.04 a3.42 ± 0.26 a4.83 ± 0.04 b
AP represents soil available phosphorus, TP represents soil total phosphorus, TN represents soil total nitrogen. Different lowercase letters indicate the significant difference among plots in the same column (p < 0.05).
Disclaimer/Publisher’s Note: The statements, opinions and data contained in all publications are solely those of the individual author(s) and contributor(s) and not of MDPI and/or the editor(s). MDPI and/or the editor(s) disclaim responsibility for any injury to people or property resulting from any ideas, methods, instructions or products referred to in the content.