Article

Homogeneous Selection Mediated by Nitrate Nitrogen Regulates Fungal Dynamics in Subalpine Forest Soils Subjected to Simulated Restoration

1
Engineering Research Center of Chuanxibei RHS Construction at Mianyang Normal University of Sichuan Province, Mianyang Normal University, Mianyang 621000, China
2
Ecological Security and Protection Key Laboratory of Sichuan Province, Mianyang Normal University, Mianyang 621000, China
*
Author to whom correspondence should be addressed.
Forests 2024, 15(8), 1385; https://doi.org/10.3390/f15081385
Submission received: 25 June 2024 / Revised: 22 July 2024 / Accepted: 5 August 2024 / Published: 7 August 2024
(This article belongs to the Special Issue Fungal Dynamics and Diversity in Forests)

Abstract

:
Subalpine forests provide crucial ecosystem services and are increasingly threatened by human alterations like bare-cut slopes from highway construction. External soil spray seeding (ESSS) is often employed to restore these slopes, but the cement it introduces can negatively affect soil fungi, which are vital for the ecological sustainability of restored slopes. Despite previous extensive discussions about ESSS-restored slopes, fungal dynamics and their underlying ecological mechanisms during ESSS-based restorations still remain elusive. Here, we conducted a 196-day simulation experiment using natural soils from a subalpine forest ecosystem. By using nuclear ribosomal internal transcribed spacer (ITS) sequencing, we revealed soil fungal dynamics and their ecological mechanisms during simulated ESSS-based restorations. Results showed a decline in fungal α-diversity and significant shifts in community structures from the initial day to day 46, followed by relative stabilities. These dynamics were mainly characterized by ectomycorrhizal, plant pathogenic, and saprotrophic fungi, with ectomycorrhizal fungi being depleted, while saprotrophic and pathogenic fungi showed enrichment over time. Shifts in nitrate nitrogen ( NO 3 −N) content primarily regulated these dynamics via mediating homogeneous selections. High NO 3 −N levels at later stages (days 46 to 196, especially day 46) might exclude those poorly adapted fungal species, resulting in great diversity loss and community shifts. Despite reduced homogeneous selections and NO 3 −N levels after day 46, fungal communities did not show a recovery but continued to undergo changes compared to their initial states, suggesting the less resilient of fungi during ESSS-based restorations. This study highlights the need to manage soil NO 3 −N levels for fungal communities during ESSS-based restorations. It provides novel insights for maintaining the ecological sustainability of ESSS-restored slopes and seeking new restoration strategies for cut slopes caused by infrastructure in subalpine forests.

1. Introduction

Subalpine forests provide various ecosystem benefits, such as watershed protection, erosion control, and carbon sequestration [1,2]. However, human alterations to land surfaces, particularly highway construction, pose great threats to these ecosystems by creating a lot of bare-cut slopes that lead to biodiversity loss and decreases in ecosystem quality [3,4]. Many initiatives have aimed to stabilize these cut slopes and recover above-ground plants, with external soil spray seeding (ESSS) being widely used [5], which involves spraying a mixture of cement, backfill soils, inorganic fertilizers, plant seeds, and composite materials like soil hydrates onto cut slopes [6,7]. While the cement can stabilize slopes [8], it also affects soil microbes and nutrient cycling and even above-ground plants [9,10]. Fungi are key for soil nutrient cycling and plant health [1,11,12,13], and several studies have demonstrated the central roles of fungal diversity and functional guilds in indicating soil restorations in open-cut areas [14,15]. This highlights the necessity to pay attention to soil fungal dynamics during ESSS-based restorations. Yet, previous studies primarily focus on above-ground plants [7,16], soil qualities [17], substrates [5,18,19], extracellular enzymes [10], bacteria [20,21] or fungi [1] through field investigations in ESSS-restored slopes. Our recent study has revealed the brief fungal dynamics during a simulated ESSS-based restoration [9]; however, their underlying ecological mechanisms still remain largely unclear.
It is reported that above-ground plants in cut slopes are prone to degradation [22]. This suggests an unsustainable ecosystem, mostly because of reduced soil nutrients over time or negative impacts of cement on soils [9], in addition to local abiotic conditions. Evidence also indicates that nutrient contents required for plants are higher in 7-year ESSS-restored slope soils with low plant diversity than those in natural soils [7]. This implies that restoring above-ground plants involves more than just increasing soil nutrients but should also focus on maintaining the ecological sustainability of ESSS-restored slopes. Some soil fungi play key roles in maintaining the sustainability of an ecosystem due to their involvement in both aboveground-belowground linkages and nutrient cycling [23], likely affecting the health of plants in ESSS-restored slopes. For example, as the key decomposer [24], saprotrophic fungi can accelerate nutrient returning from litter to soil since they excel at breaking down complex substances from plant litter [25]. Mycorrhizal fungi, such as arbuscular mycorrhizal and ectomycorrhizal fungi, can form symbiotic associations with plant roots, enhancing the uptake of nutrients for plants [26]. However, several fungi also have detrimental impacts on plants. For instance, pathogenic fungi can result in plant diseases [27] despite the fact that some of them likely play vital roles in the initial stages of plant–fungus interactions or contribute to the construction of symbiotic interfaces [25]. Evidence also shows that saprophytic fungi can increase seed mortality [28], thereby impacting the germination rate of plant seeds or the persistence of seed banks in ESSS-restored slopes. Under such a scenario, the dynamics of soil fungal taxonomic composition during ESSS-based restorations may be closely connected to above-ground plant health and even the ecological sustainability of ESSS-restored slopes. Our recent study shows that ectomycorrhizal fungi are depleted, whereas arbuscular mycorrhizal and plant pathogenic fungi are enriched in cut slope soils subjected to about 3 years of ESSS-based restorations, compared to natural subalpine forest soils [1]. However, we still know little about their shifting patterns over time.
While ESSS is a common technique for the ecological restoration of bare-cut slopes [5], the cement it introduces can significantly alter soil conditions, such as alkalization [29] and soil hardening [9]. This may further influence soil fungal communities since they are closely associated with soil properties like pH, total carbon and nitrogen, and ammonium and nitrate nitrogen [1,30]. A recent study suggests that even minimal levels of 2% cement can significantly reduce soil fungal diversity [9]. This highlights the sensitivity of soil fungal communities to cement addition, posing challenges for their restoration after ESSS and highlighting the need to delve into the dynamics of soil fungal diversity during ESSS-based restorations, especially their responses to cement. Our ESSS simulation experiment indicates that using 11% cement can maintain both high soil strength and ecosystem multifunctionality, despite that fungal diversity decreased from the initial day to day 16 before retaining relatively stable, with this trend being negatively correlated with nitrate nitrogen content [9]. Yet, the mechanisms for such a trend still need to be resolved. Ecologically, shifts in microbial community could be attributed to environmental selection, biotic interaction, and/or stochastic events such as dispersal and drift [31]. However, we lack data to determine which of these factors mainly regulate fungal dynamics during ESSS-based restorations. Previous studies show that nitrate serves as a critical nutrient and electron acceptor for microorganisms [32]. Yet, high nitrate levels could also be toxic for fungi [33], which may homogeneously select individuals that are well-adapted to high nitrate environments and exclude those unable to tolerate elevated nitrate levels. In this context, we hypothesize that homogeneous selection mediated by nitrate nitrogen mainly regulates fungal dynamics during the ESSS-based restoration of bare-cut slopes in the subalpine forest ecosystem.
To test our hypothesis, we performed a 196-day simulation experiment by using natural soils from a subalpine forest ecosystem in Miyaluo, Lixian County, Sichuan Province, Southwest China (31°38′37″ N–31°47′54″ N, 102°41′41″ E–102°49′25″ E). Our previous study has demonstrated that using 11% cement in ESSS-simulation experiments can maintain both high soil strength and ecosystem multifunctionality, thereby identifying it as an underlying optimal cement content for the ESSS technique in our study regions [9]. Hence, the present study focused on soil fungal communities under the 11% cement treatment to ensure the practical relevance of our findings as far as possible. Because the brief dynamics of soil fungal diversity and taxonomic composition over time have been reported [9], we primarily address two unresolved questions in this study: (i) how soil fungal communities, particularly their functional guilds, shift over restoration time and (ii) the ecological mechanisms driving these shifts. Despite immediate application challenges in construction, this study highlights the importance of incorporating soil fungal communities into ESSS-based restoration strategies for bare-cut slopes in subalpine forests. It also provides new insights for designing in situ experiments, maintaining ESSS-restored slopes, and seeking new ecological restoration strategies for future infrastructure-induced cut slopes in this ecosystem.

2. Materials and Methods

2.1. Site Description and Natural Soil Sampling

Four altitudinal sites (2702 m a.s.l., 2900 m a.s.l., 3102 m a.s.l., and 3194 m a.s.l.) along the Wenma Highway in Miyaluo, Lixian County, Sichuan Province, Southwest China (31°38′37″ N–31°47′54″ N, 102°41′41″ E–102°49′25″ E), were selected for natural soil collection. The study areas experience a mean annual temperature of about 8.9 °C, with monthly averages ranging from about −8.0 °C in January to 12.6 °C in July. Mean annual precipitation ranges from 600 to 1100 mm. Plant growth period extends from late April to October each year. Soils in our study areas are typical brown forest soils [34]. The construction of the Wenma Highway resulted in numerous bare-cut slopes, which were subsequently restored by using the ESSS-based strategy between June and October 2015, according to our surveys. By the soil sampling date, these slopes had undergone about three years of restoration. In October 2018, we collected 24 soil samples from natural environments adjacent to these ESSS-restored cut slopes using an “S-shaped” sampling strategy [10]. At each altitudinal site, six plots along an “S” route were first identified for sampling. Then, five soil cores per plot were collected at a depth of about 0–10 cm using a quadrat sampling method. After removing visible rocks, plant roots, and residues, five soil cores from each plot were blended thoroughly to ensure maximum uniformity. Mixed soil from each sampling plot was conserved as an independent sample, resulting in six soil samples per altitudinal site. These soil samples were immediately brought to the laboratory, sieved through a 2 mm mesh, and then immediately applied for ESSS-simulation experiments. More details about the sampling methods of natural soils are available in our previously published study [1].

2.2. Experimental Procedures and Cultivated Soil Sampling

Experimental procedures have been described in our previously published study [9]. Here, our primary focus was fungal dynamics over time under the 11% cement treatment; hence, we only provided details relevant to the scientific questions addressed in this study. A simulation experiment was conducted using four planting pots containing natural subalpine forest soils, plant seeds, polyacrylamide, inorganic fertilizers, and cement in an artificial climatic chamber. The composition of cement is available in Table S1. Detailed experimental procedures were as follows: (i) the surface of Tall fescue (Festuca elata) seeds were sterilized by using 7% sodium hypochlorite (NaClO) for 3 min; (ii) the gauze was cut into squares to match the bottom size of planting pots (length × width × height: 17.00 cm × 17.00 cm × 11.50 cm) and sterilize at 120 °C for 30 min; (iii) natural soils (24 soil samples) were mixed thoroughly and then mixed with 0.5% polyacrylamide (PAM; pH: 5.0), 0.4% inorganic fertilizer (N-P2O5-K2O), and 11% cement (P.O42.5; Chinese national standard GB 175–2007 [35] and Chinese industry standard NB/T 35082–2016 [36]) based on the total weight; (iv) mixed soils were placed into each planting pot, with two layers of sterile gauze at the bottom, in which soil substrate thickness was about 10 cm; (v) 40 sterilized Festuca elata seeds were sown (a cool-season, long-lived and perennial species) in each pot at a depth of about 1 cm; and (vi) planting pots were placed on a wooden frame with a 45° slope for 196 days of cultivation (room temperature: 18 ± 2 °C [37]; humidity: 60%–80%; illumination from the LED plant-growth lamps with a full spectrum at 5000 lux for 10 h per day; watering frequency: 2 days) [9,38]. No additional nutrients were added during the cultivations aside from those initially provided. Experimental conditions, including the climate, illumination, and plant species, were designed to simulate those of our study areas. Soils were collected at five stages: on the initial day (day 0) and after 16, 46, 106, and 196 days of cultivation, resulting in a total of 20 soil samples. Soil samples were divided into two parts: one stored at 4 °C for soil property analysis and the other stored at −20 °C for genomic DNA extraction. All soils were collected prior to the watering to reduce the potential bias as much as possible.

2.3. Soil Property Measurement

Soil conductivity (CD) and pH were assessed in a soil–water slurry (1:5, w/v) using a conductivity meter and a pH meter, respectively. Soil moisture content (MC) was assessed by oven-drying soils at 105 °C until a constant weight was achieved [39]. Total soil organic carbon (TOC) was measured using a dichromate method [40], and total soil nitrogen (TN) was assessed using the Kjeldahl method [41]. Nitrate ( NO 3 −N) and ammonium nitrogen ( NH 4 + −N) were assessed by using a phenol disulfonic acid method and an indophenol blue method, respectively [42]. Available phosphorus (AP) in the soil was determined by using a molybdenum antimony anti-colorimetric method (sodium bicarbonate extraction) [43].

2.4. DNA Extraction, Amplification, and Sequencing

Genomic DNA was extracted from 0.25 g of fresh soil using a PowerSoil® DNA Isolation Kit (MO BIO Laboratories, Inc., Carlsbad, CA, USA) and then checked through using a Nano-Drop ND-1000 Spectrophotometer (Nano-Drop Technologies Inc., Wilmington, DE, USA). High-quality DNA was used for polymerase chain reaction (PCR) amplification with the primers gITS7F/ITS4R [9]. PCR reaction system contained 1 μL of DNA (about 20 ng), 1 μL each of 10 μM forward and reverse primers, 9.5 μL of H2O, and 12.5 μL of MasterMix (CWBIO, Beijing, China), which includes PCR buffer, DNA polymerase, dNTPs, and Mg2+. The ITS sequences were amplified with an initial denaturation at 94 °C for 5 min, followed by 35 cycles of 94 °C for 30 s, 56 °C for 30 s, and 68 °C for 45 s, with a final extension at 72 °C for 10 min. All PCR products were then purified using electrophoresis with a low-melting agarose gel, and their qualities (260/230 and 260/280 ratios) were assessed using a spectrophotometer (Nano-Drop Technologies Inc., Wilmington, DE, USA), followed by the high-throughput sequencing on an Illumina NovoSeq platform.

2.5. Bioinformatics Analysis

Raw sequences were processed using the QIIME 2 [44] (version 2018.6), including assembling with the VSEARCH algorithm [45], quality filtering with the default parameters, and denoising with the DADA2 algorithm [46]. During the denoising, sequences were initially trimmed to 235 bp, followed by removing the first 35 bp from the 5′ end, resulting in a final sequence length of 200 bp [1]. Such a trimming was employed to reduce sequencing errors since the longer sequences are more prone to errors, which can potentially lead to data loss. Meanwhile, evidence also shows that a sequence length of 90 bps is adequate to capture microbial composition and detect diversity differences among groups [47]. After the denoising, amplicon sequence variants (ASVs) were then taxonomically annotated using the UNITE v2019.02.02 database [48] and the classify-sklearn algorithm. ASVs that appeared only once across all samples (also referred to as singletons) or could not be annotated at the kingdom level were excluded. Given differences in sequencing depth, each sample was rarefied to a sequence number of 9628. The phylogenetic tree was constructed using the built-in tools of QIIME 2. Briefly, ASV sequences were aligned using the MAFFT v7.310 first [49], and then, the FastTree v2.1.10 [50,51] was applied for phylogenetic tree construction. Observed ASVs (α-diversity metric) and Bray–Curtis distances (β-diversity metric) were calculated using the microgeo R package v0.1.2 [52]. The standardized effect size measurement of the mean nearest taxon distance (ses.MNTD) was inferred with 999 iterations using the picante R package v1.8.2 [53]. A ses.MNTD significantly less than zero denotes a more phylogenetically clustered community [54]. β–nearest taxon index (βNTI) and community assembly processes were inferred by using the iCAMP R package v1.5.12 [55]. A βNTI above +2 or below −2 suggests that the community assembly is significantly greater or less than the null expectation, respectively, and more impacted by deterministic processes of heterogeneous selection or homogeneous selection, respectively [56].

2.6. Statistical Analysis

The compositions of class-level lineages and fungal functional guilds, as well as the contribution of assembly processes, were visualized using the stacked bar chart. Fungal functional guilds were predicted using the microeco R package v0.1.2 [57] based on a database of FungalTraits (version: 1.2_ver_16Dec_2020V.1.2) [58]. Differential abundance analyses based on the Random Forest algorithm were utilized to reveal the ASVs significantly varied over time (p < 0.05). Significant ASVs were then mapped to predicted fungal functional guilds and class-level taxonomy according to their IDs. Overall differences in soil properties over time were visualized by using a principal coordinates analysis (PCoA) and then tested using the analysis of similarity (ANOSIM) based on Euclidean distances. Regarding fungal communities, same analyses were performed based on Bray–Curtis distances. Individual soil properties, the Euclidean distances of soil properties, observed ASVs (α–diversity metric), the Bray–Curtis distances (β-diversity metric) of fungal communities, the relative abundances of differential lineages, ses.MNTD, and βNTI were compared using a Wilcoxon rank sum test. Unique ASV numbers in each group and shared ASV numbers between or among groups were visualized using a Venn diagram. Spearman rank correlation analyses were used to reveal the relationships between soil properties and observed ASVs, the relative abundances of differential lineages, and ses.MNTD and p-values were adjusted using the false discovery rate (FDR). To identify key factors influencing fungal communities, a redundancy analysis (RDA) based on Bray–Curtis distances was performed, and the relative contributions of variables to fungal community shifts were estimated using the envfit() function of vegan R package v2.6.4 [59]. Partial Mantel test was utilized to reveal the relationships between soil properties and βNTI. Those soil properties with significant (p < 0.05) and relatively high correlations with observed ASVs, community structures, ses.MNTD, or βNTI were further verified using a quadratic polynomial fit. In the present study, our research focuses on DNA, and hence, fungal communities in soils from the initial day largely represent those in natural soils. The disturbances resulting from ESSS may be detected at least after day 16. This probably leads to biases when performing correlation or regression analysis. Therefore, several regression and correlation analyses were also performed after removing samples from the initial day. Statistical analyses were conducted in R v4.1.2, and the R packages primarily included vegan v2.6.4 [59], microeco v0.1.2 [57], ggpubr v0.6.0 (https://github.com/kassambara/ggpubr, accessed on 24 June 2024), and ggplot2 v3.5.0 [60].

3. Results

3.1. Shifts in Soil Conditions during the Simulated ESSS-Based Restoration

Overall soil conditions shifted significantly over time, with the exception of the periods between days 46, 106, and 196 (Figure S1A, Table S2). The within-stage Euclidean distances for soil properties did not show significant changes over time (Figure S1B). Instead, the Euclidean distances between each stage and the initial day initially declined and subsequently increased, with the minimum occurring between day 46 and the initial day and the maximum occurring between day 16 and the initial day (Figure S1C). Specifically, soil pH declined from the initial day to day 16 and then remained relatively consistent before a decrease from days 106 to 196. Soil conductivity (CD) decreased from the initial day to day 16 and then generally increased up to day 196. NH 4 + −N increased from the initial day to day 16 and thereafter decreased before remaining relatively stable on days 46, 106, and 196. NO 3 −N increased from the initial day to day 46 and then slightly decreased from days 46 to 196 (Figure S1D). MC, TOC, TN, and AP did not exhibit significant differences across the temporal gradient of our simulation experiment (p > 0.05) (Figure S1D).

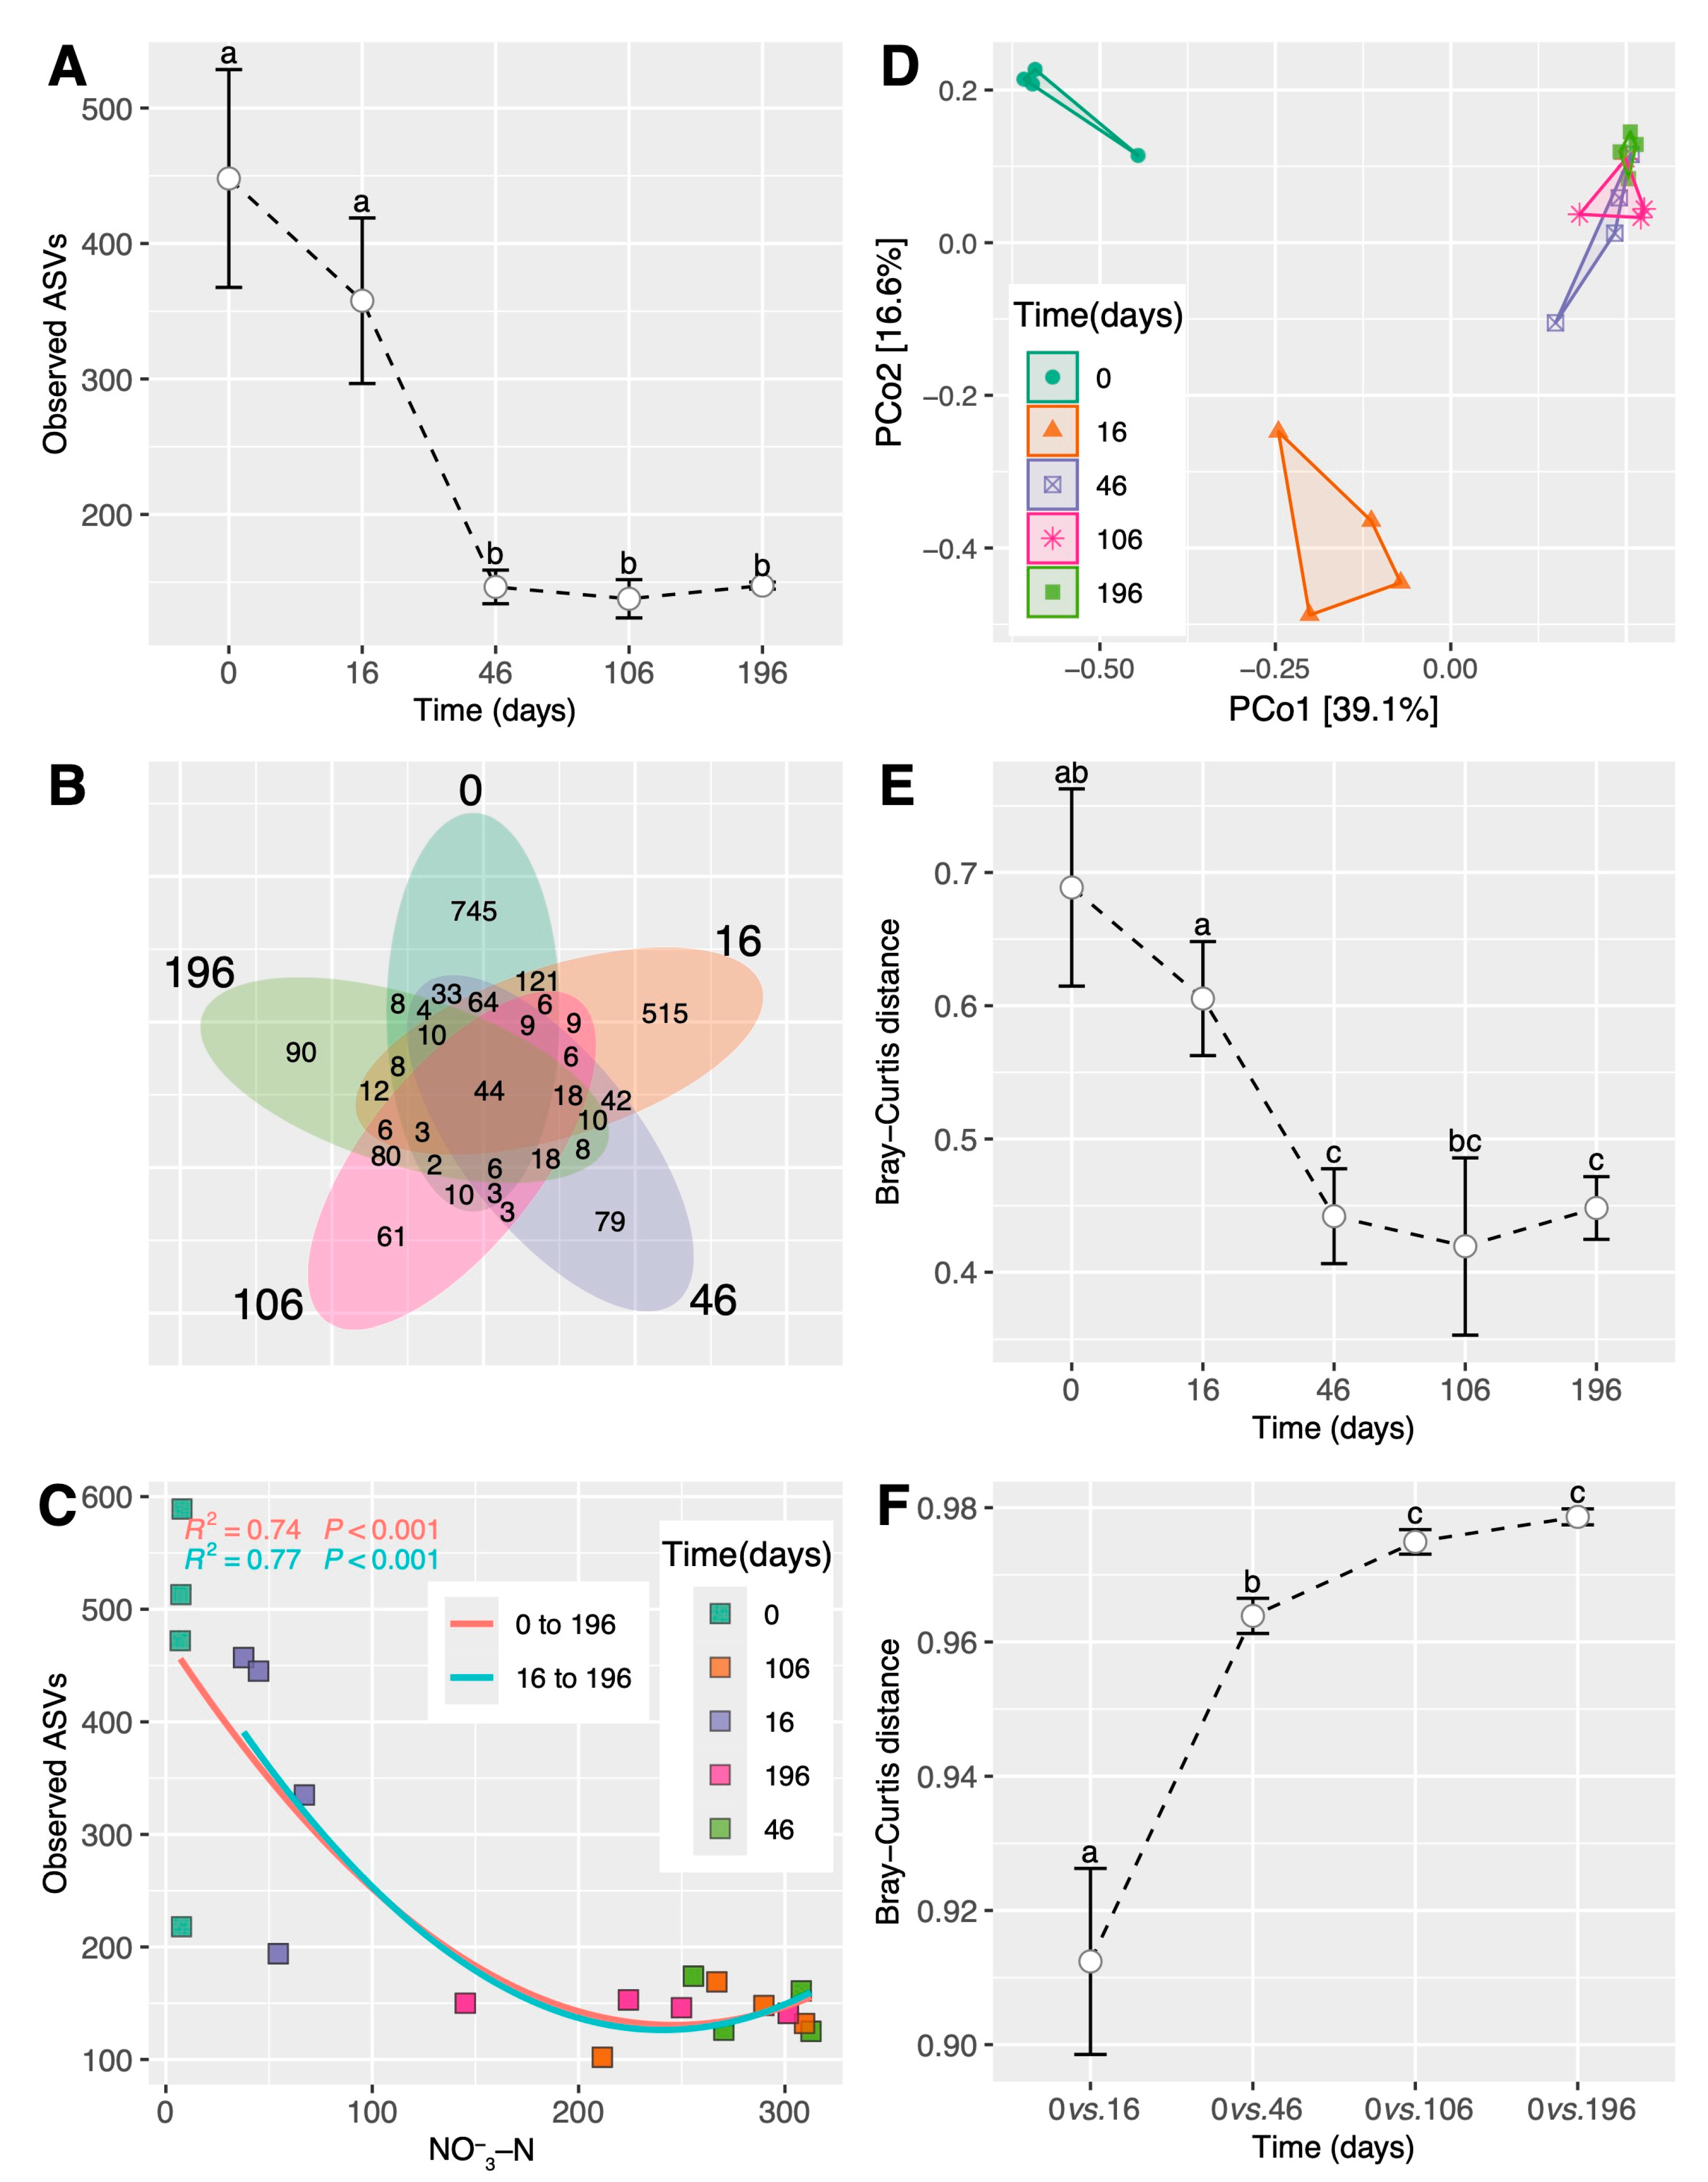
3.2. Shifts in Fungal Diversity and Community during the Simulated ESSS-Based Restoration

Observed fungal ASVs declined from the initial day to day 46 and then remained relatively consistent up to day 196, and the unique ASV numbers showed the same pattern (Figure 1A,B). NO 3 −N exhibited the strongest correlation with observed fungal ASVs (R2 ≥ 0.74, p < 0.001) (Figure 1C and Figure S2A,B). Fungal communities changed significantly over time, with the exception of the periods between days 46, 106, and 196 (Figure 1D, Table S3). The within-stage Bray–Curtis distances of fungal communities declined significantly (p < 0.05) from the initial day to day 46 and then remained relatively consistent up to day 196 (Figure 1E). The Bray–Curtis distances between each stage and the initial day showed an increasing trend (Figure 1F). Soil pH (R2 = 0.94, p < 0.001) and NO 3 −N (R2 = 0.88, p < 0.001) showed relatively high correlations with the shifts in fungal communities over time (Figures S3A,B and S4A,C). After removing samples from the initial day, soil pH (R2 = 0.18, p > 0.05) became nonsignificant, with NO 3 −N emerging as the variable with the highest correlation coefficient (R2 = 0.8, p < 0.001) (Figures S3C,D and S4B,D). Taxonomic composition analysis showed that fungal communities were predominated by Sordariomycetes, Agaricomycetes, Leotiomycetes, Pezizomycetes, Dothideomycetes, Eurotiomycetes, and Tremellomycetes (Figure 2A). The relative abundances of Sordariomycetes generally increased, while the Agaricomycetes and Leotiomycetes generally decreased over time, especially from the initial day to day 46; the Pezizomycetes and Dothideomycetes relatively prevailed at later stages, especially from days 46 to 106. The relative abundance of Eurotiomycetes peaked on day 16, while that of Tremellomycetes was highest on day 46 (Figure 2A).

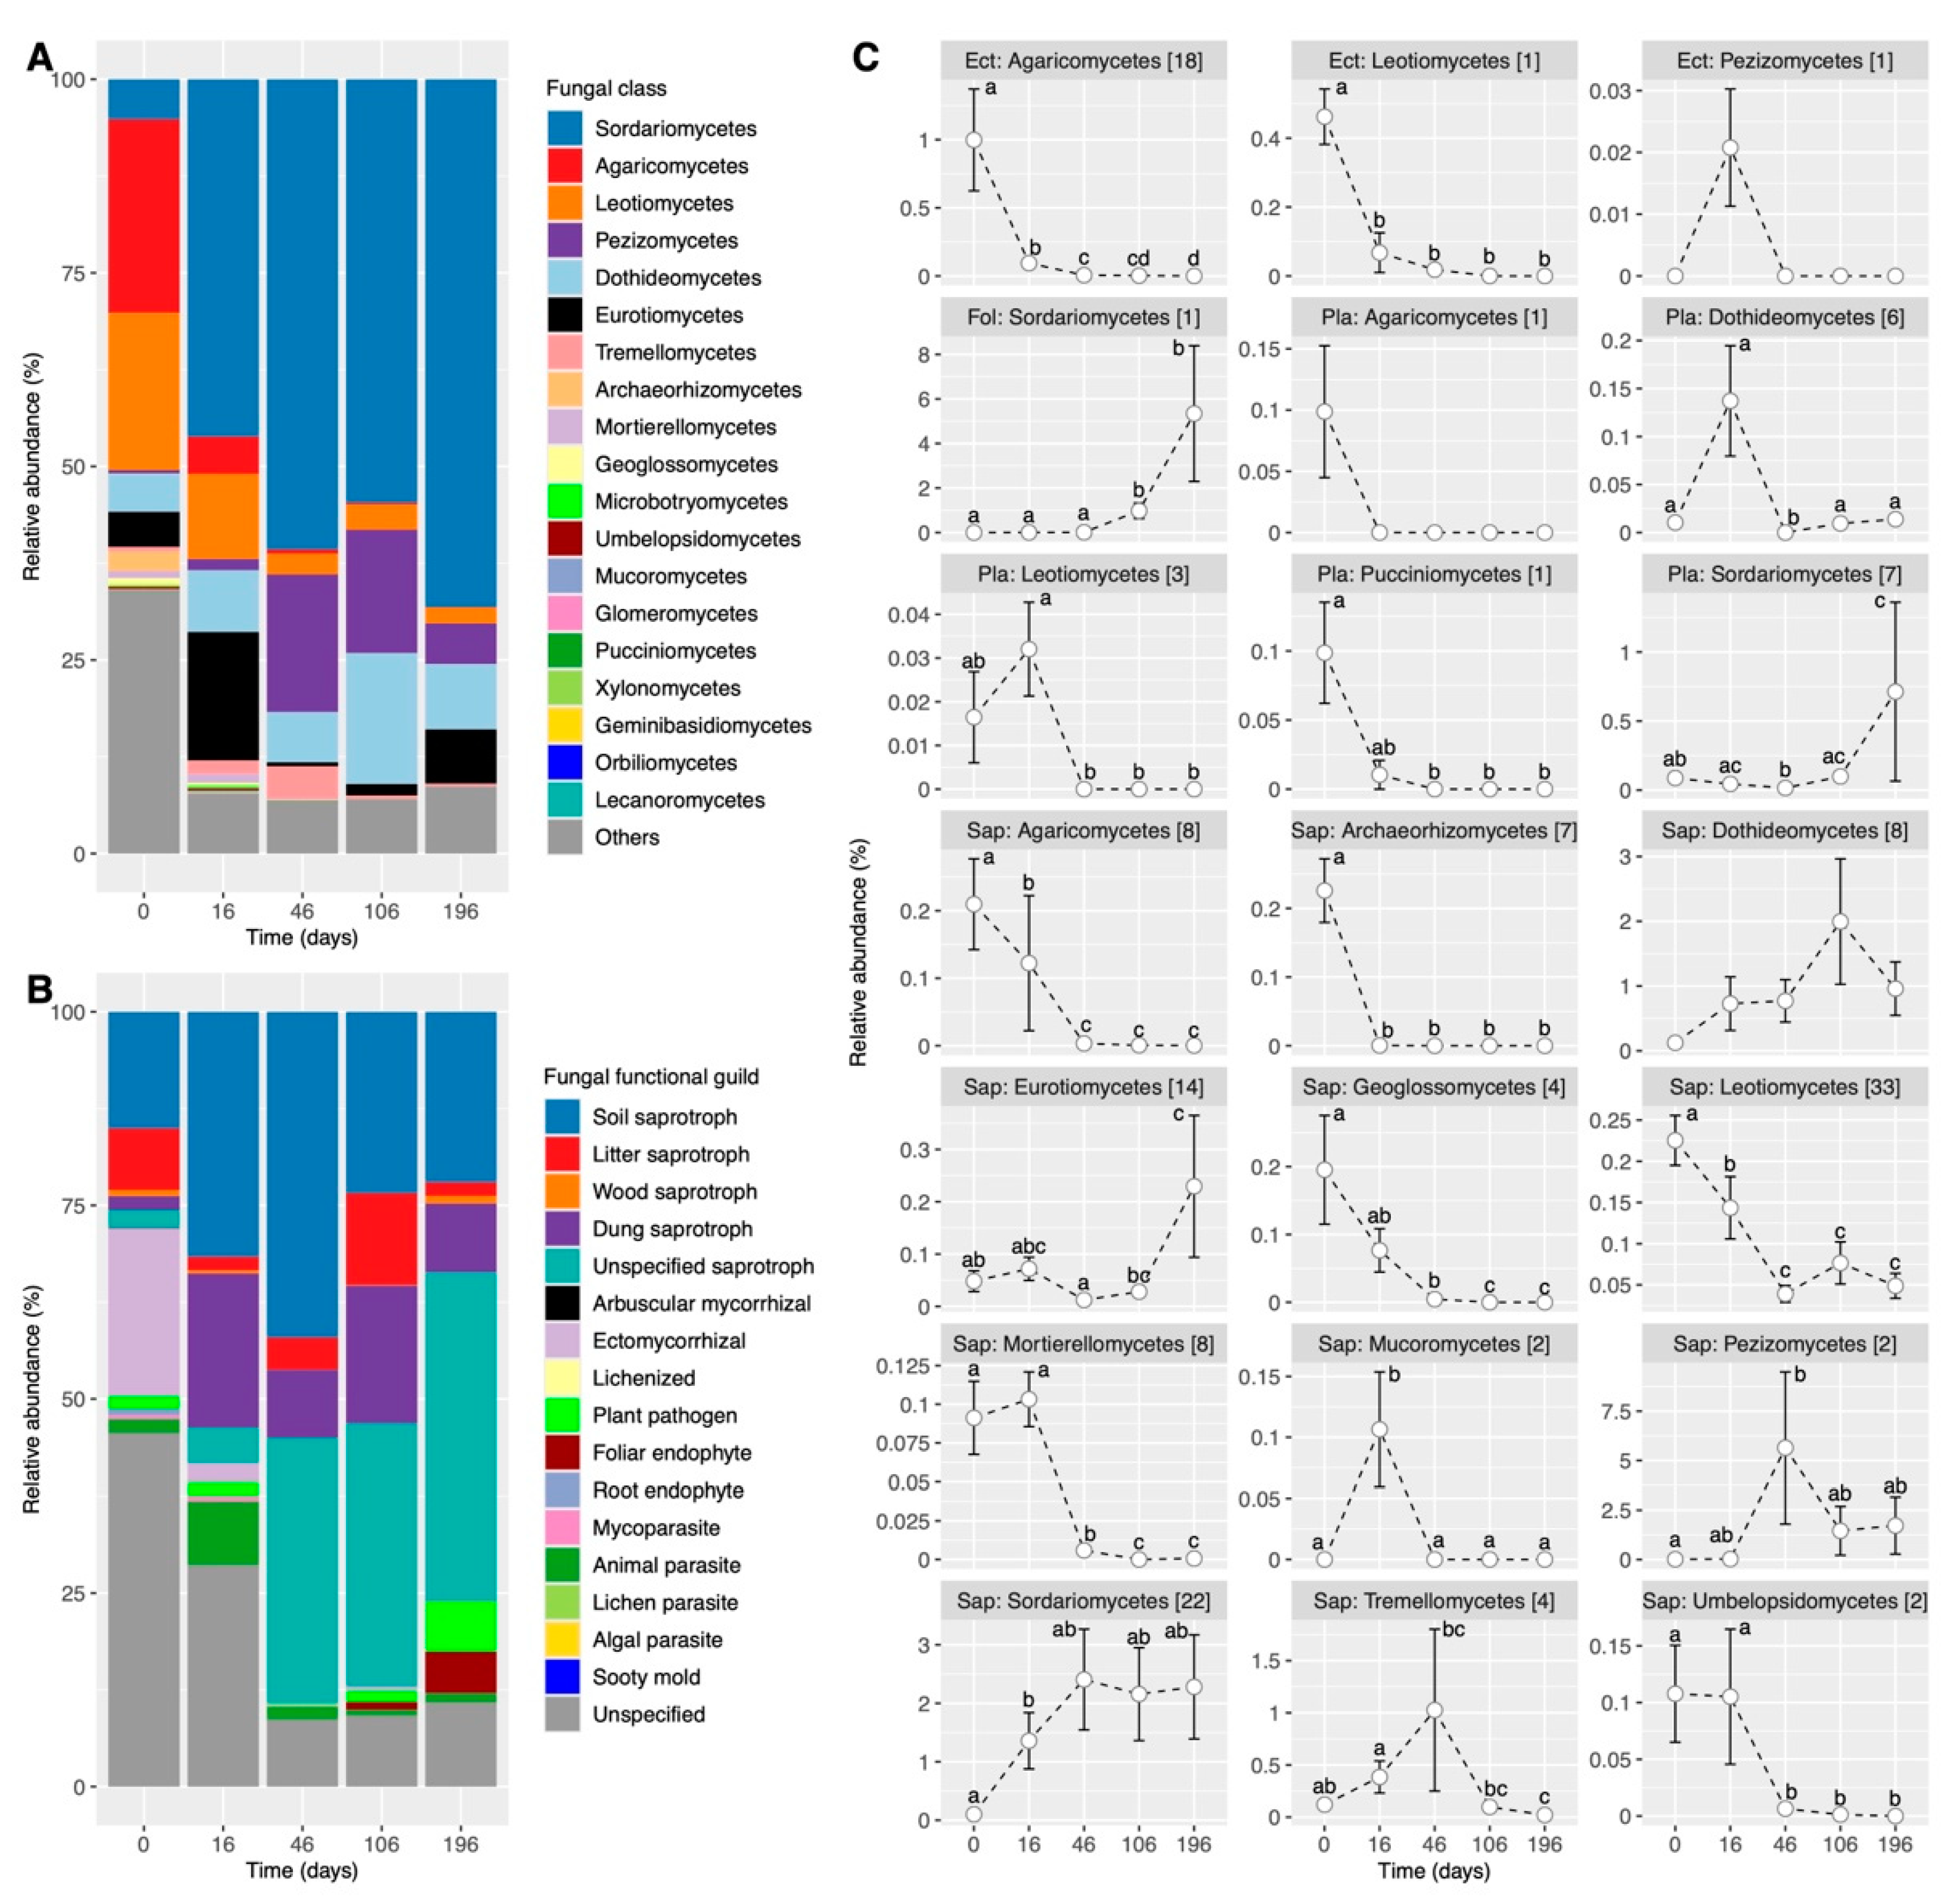
3.3. Shifts in the Composition of Functional Guilds during the Simulated ESSS-Based Restoration

The relative abundances of soil saprotrophic fungi increased until day 46 and subsequently declined until day 196. Litter saprotrophic fungi showed higher prevalence at the initial day and day 106, while wood saprotrophic fungi were more prevalent at both the initial day and day 196. Dung saprotrophic fungi were more abundant from day 16 to 196, compared to the initial day, especially on days 16 and 106. Unspecified saprotrophic fungi generally increased over time (Figure 2B). Ectomycorrhizal fungi declined from the initial day to day 46 and remained scarce thereafter. Plant pathogenic fungi initially decreased until day 46 and then increased up to day 196. Foliar endophytic fungi appeared after day 46, and their abundance increased from days 106 to 196. The animal parasites peaked in abundance on day 16. Other fungal functional guilds like arbuscular mycorrhizal and root endophytic fungi were very scarce (Figure 2B). By mapping differential ASVs to ectomycorrhizal, foliar endophytic, plant pathogenic, and saprotrophic fungi (including soil, litter, wood, dung, and unspecified saprotroph), we identified five distinct trends of temporal dynamics. Ectomycorrhizal fungi from the classes Agaricomycetes and Leotiomycetes, plant pathogenic fungi from Agaricomycetes and Pucciniomycetes, and saprotrophic fungi from Agaricomycetes, Archaeorhizomycetes, Geoglossomycetes, Leotiomycetes, and Umbelopsidomycetes generally declined in their relative abundances from the initial day to day 16 or 46 and then showed slight changes until day 196 (Figure 2C). Ectomycorrhizal fungi from Pezizomycetes, plant pathogenic fungi from Dothideomycetes and Leotiomycetes, and saprotrophic fungi from Mucoromycetes, Mortierellomycetes, Pezizomycetes, and Tremellomycetes possessed the highest relative abundances at days 16 or 46 (Figure 2C). Foliar endophytic fungi from Sordariomycetes, plant pathogenic fungi from Sordariomycetes, and saprotrophic fungi from Eurotiomycetes increased in prevalence from the initial day to day 196, with a notable increase from day 46 to 196 (Figure 2C). Saprotrophic fungi from Dothideomycetes increased in prevalence from the initial day to day 106 and subsequently decreased, while those from Sordariomycetes increased in relative abundance from the initial day to day 46 and then changed slightly (Figure 2C). Most of these fungal populations significantly correlated with NO 3 −N, with the majority showing a strong negative correlation (Figure 3).

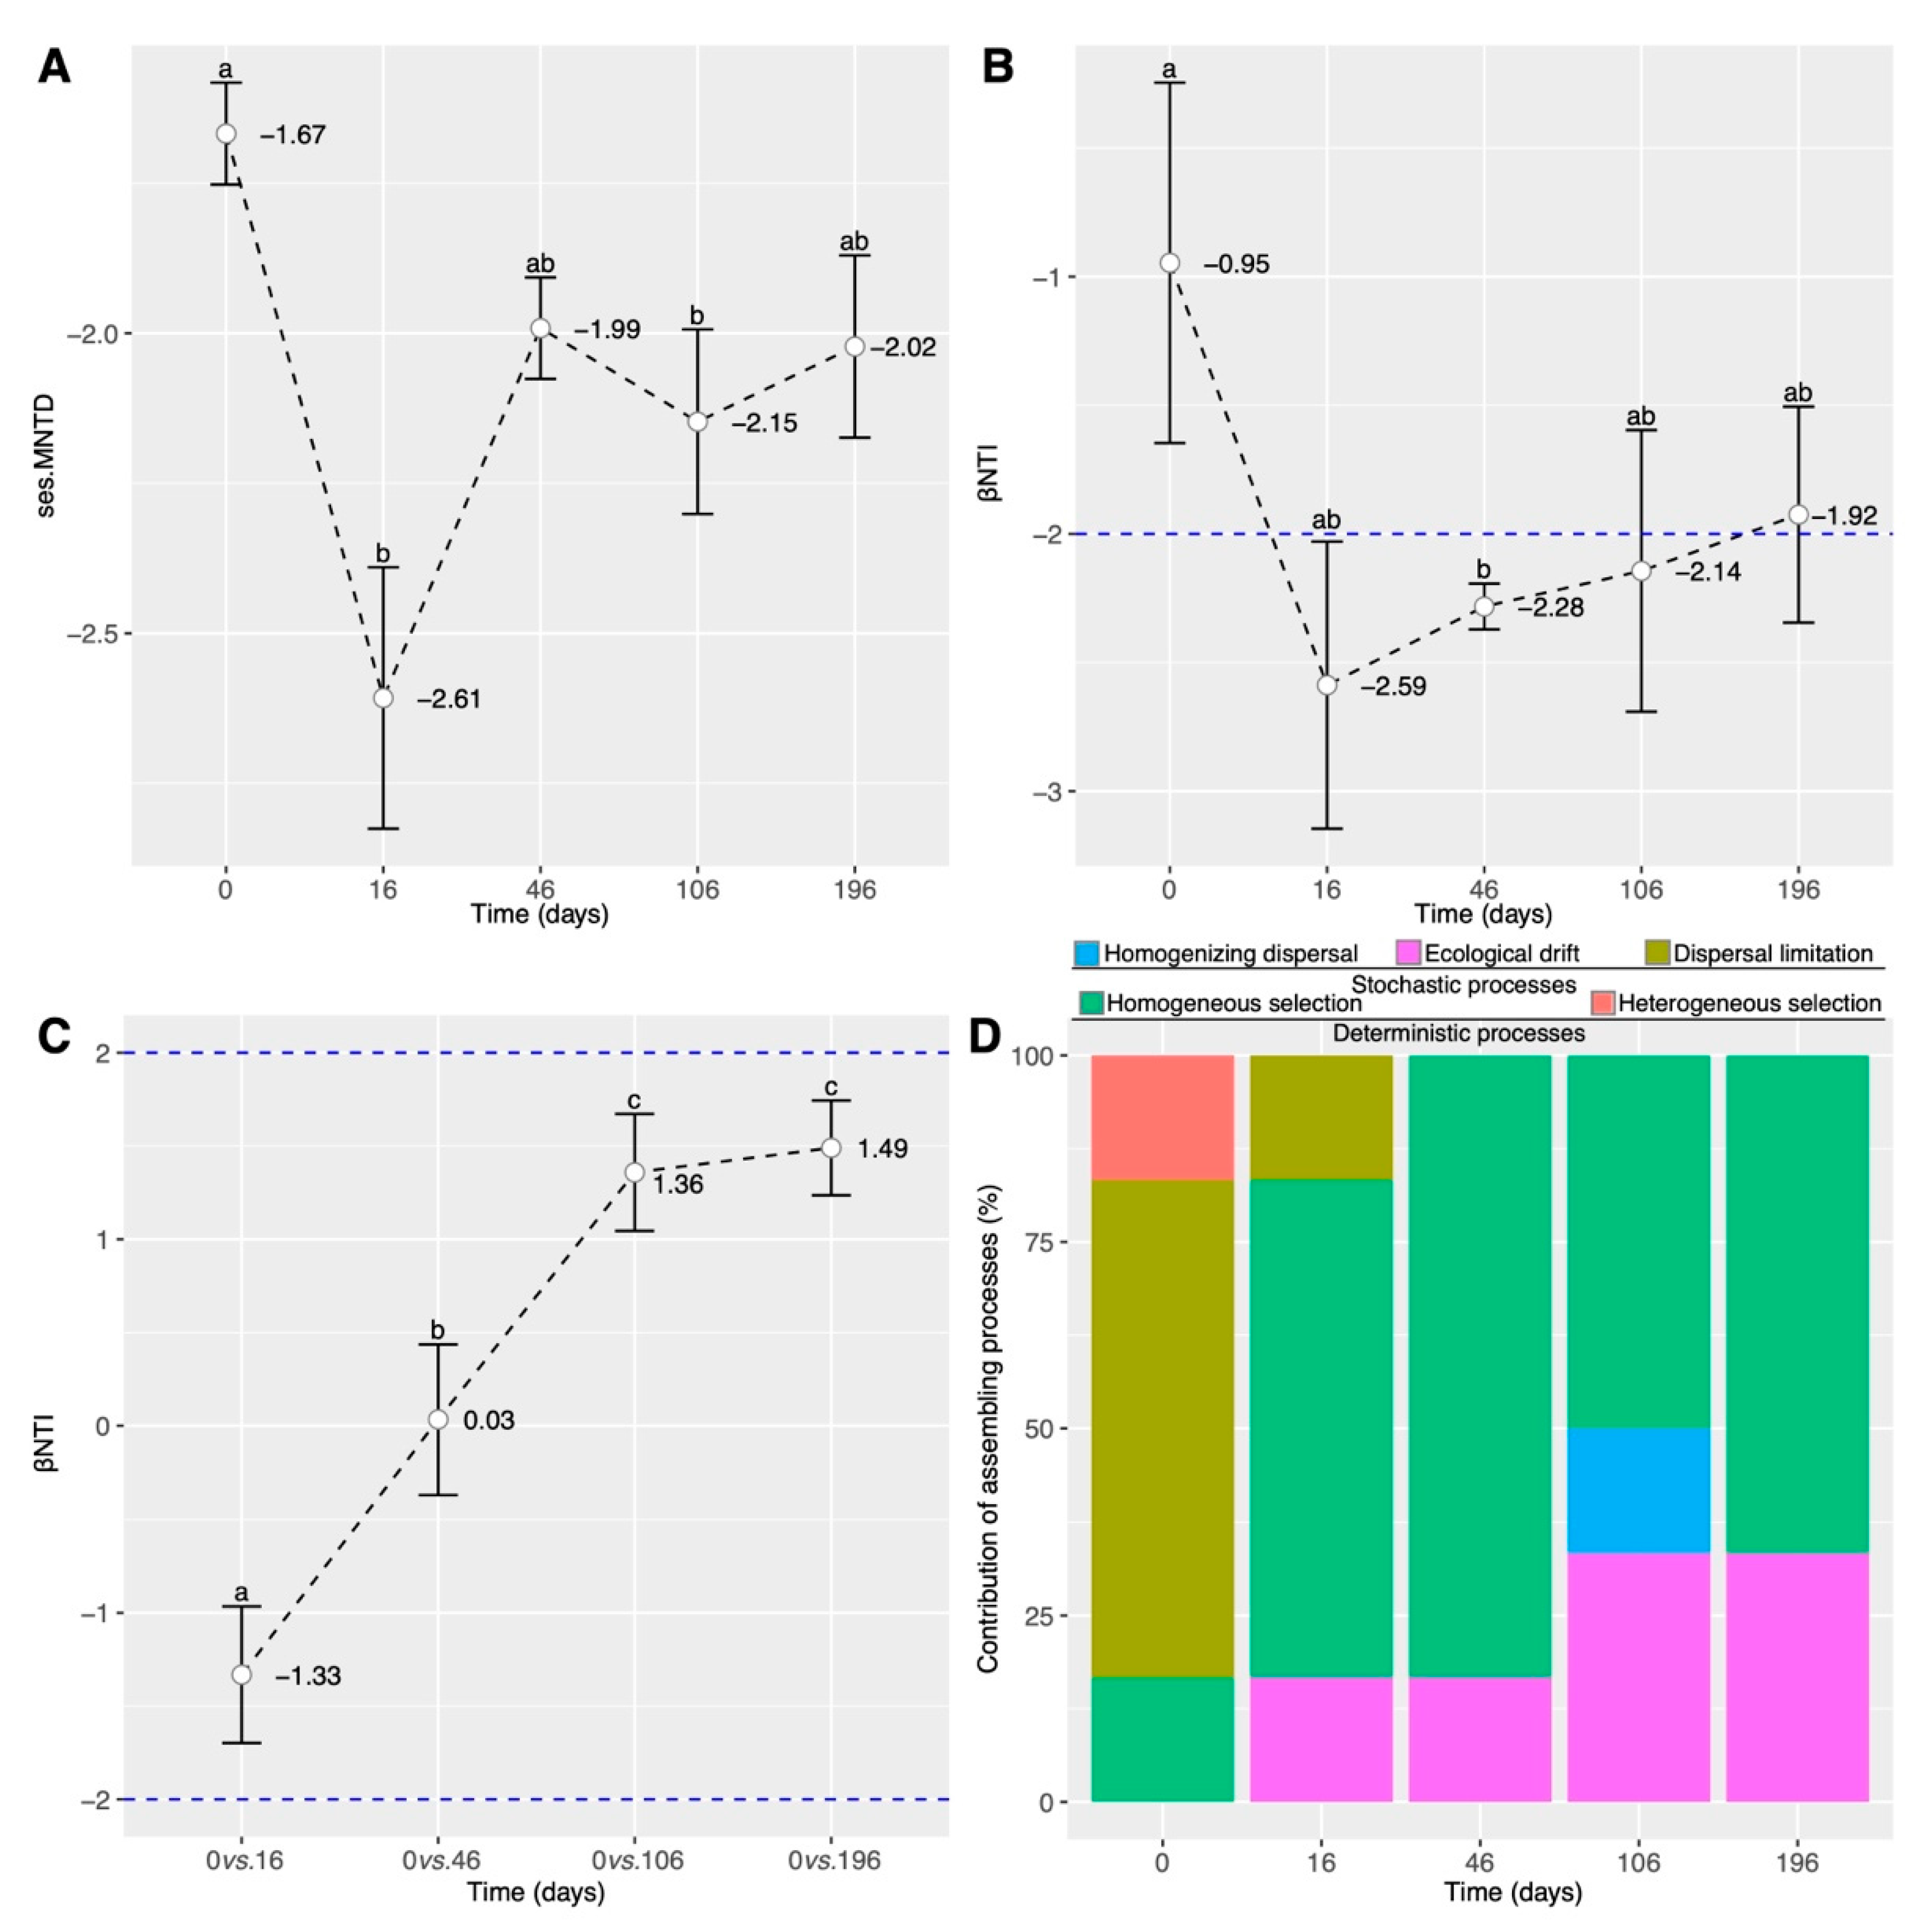
3.4. Shifts in Fungal Community Assembly Processes during the Simulated ESSS-Based Restoration

ses.MNTD (all ses.MNTD values were less than zero) declined from the initial day to day 16, then increased to day 46, followed by slight shifts (Figure 4A). NH 4 + −N showed the highest negative correlation with ses.MNTD (R2 = 0.52, p = 0.002), whereas NO 3 −N did not show a significant correlation with ses.MNTD (R2 = 0.26, p = 0.076) (Figure 5A,B and Figure S5A) when conserving all soil samples. However, both two soil metrics significantly correlated with ses.MNTD after removing soil samples from the initial day ( NH 4 + −N: R2 = 0.38, p = 0.045; NO 3 −N: R2 = 0.55, p = 0.005) (Figure 5A,B and Figure S5B). The βNTI within each stage decreased from the initial day (−2 < βNTI < 2) to day 16 (βNTI < −2) and then showed a slight increase from day 16 to day 196 (−2 < βNTI < 2) (Figure 4B). Also, the βNTI between each stage and the initial day showed an increasing trend (−2 < βNTI < 2) (Figure 4C). NO 3 −N exhibited the highest correlation with βNTI (R2 = 0.09, p < 0.001) (Figure 5C, Table S4). Further analysis indicated that fungal communities on the initial day were less affected by homogeneous selection, with the dispersal limitation playing a more critical role. Yet, the contribution of homogeneous selection in shaping soil fungal communities increased from the initial day to day 46, followed by a slight decrease, accounting for at least 50% of the forces driving fungal community assembly from day 16 to day 196 (Figure 4D).

4. Discussion

4.1. Fungal Dynamics Are Mainly Characterized by Ectomycorrhiza, Pathogens, and Saprotrophs

Fungi play vital roles in soil nutrient cycling and plant health [1,11,12,13], but they are sensitive to cement introduced by ESSS [9]. Revealing their dynamics over time is critical for maintaining plant health and the ecological sustainability of ESSS-restored slopes, especially in fragile subalpine forest ecosystems. Yet, few studies have addressed this to the best of our knowledge. In this study, the temporal dynamics of total fungal communities were mainly characterized by ectomycorrhizal, plant pathogenic, and saprotrophic fungi (Figure 1A,B,D and Figure 2C). This suggests a high sensitivity of these fungi to disturbances, which is in line with some studies about fungal functional guilds in forest ecosystems. For example, previous studies reveal the depletion of ectomycorrhizal fungi and the enrichment of saprotrophic and plant pathogenic fungi in forest soils subjected to disturbances caused by clear-cut logging [61,62]. Likewise, a study focusing on disturbances caused by open-cut mining on soil fungal communities also demonstrates a parallel trend for ectomycorrhizal fungi [14]. Evidence indicates that the cement introduced by ESSS can significantly alter soil conditions, e.g., resulting in alkalization [29] and soil hardening [9]. This may impose more stress on these fungal functional guilds compared to disturbances resulting from the destruction of native vegetation or soils alone, such as clear-cut logging, open-cut mining, or highway construction. Under such a scenario, our findings highlight a necessity to particularly pay greater attention to ectomycorrhizal, plant pathogenic, and saprotrophic fungi during the ESSS-based restoration of bare-cut slopes in subalpine forest ecosystems. While our previous studies have touched on this [1,9], this study specifically reveals the dynamics of these guilds over time in subalpine forest soils subjected to a simulated ESSS-based restoration with 11% cement—identified as the optimal cement content for ESSS in subalpine forest ecosystems [9]. Given that a fungal community often operates through diverse functional guilds, such as saprotrophic, ectomycorrhizal, and plant pathogenic fungi [63], the present study provides more relevant and critical insights into soil fungal dynamics during the ESSS-based restoration of bare-cut slopes in subalpine forests, emphasizing the key focus on addressing soil fungal community restoration in these areas.

4.2. Ectomycorrhiza Are Depleted, but Saprotrophs and Pathogens Are Enriched over Time

Given the critical roles of saprotrophic, ectomycorrhizal, and plant pathogenic fungi in regulating plant health and soil nutrient cycling [24,25,26,27,28], it is key to elucidate their dynamics during ESSS-based restorations despite the current lack of comprehensive understanding. We found that ectomycorrhizal fungi were depleted, while saprotrophic, plant pathogenic, and some foliar endotrophic fungi were enriched at the later stages of simulated ESSS-based restoration (Figure 2B). This confirms our previous finding that ectomycorrhizal fungi are depleted, while plant pathogenic and saprotrophic fungi are enriched in cut slope soils after three years of ESSS-based restorations, compared to natural soils in a subalpine forest ecosystem [1]. However, we found that arbuscular mycorrhizal fungi, previously shown to be enriched in ESSS-restored soils [1], were extremely scarce at every stage of the simulation experiment (Figure 2B). Evidence implies that arbuscular mycorrhizal fungi are more abundant in early successional soils, while ectomycorrhizal fungi proliferate with the accumulation of soil organic matter [64], which appears contrary to our findings in the present study. Actually, soils used in our simulation experiment were collected from a naturally mature forest, where ectomycorrhizal fungi are expected to be more prevalent than arbuscular mycorrhizal fungi [1,64]. Evidence also shows that ectomycorrhizal and arbuscular mycorrhizal fungi often compete with each other [65,66]. Hence, it is reasonable that ectomycorrhizal fungi were abundant, whereas arbuscular mycorrhizal fungi were scarce at the initial stage of the simulation experiment (Figure 2B). Notably, the relative abundance of ectomycorrhizal fungi declined from the initial day to day 16 and remained relatively stable from days 16 to 196, especially those belonging to Agaricomycetes and Leotiomycetes (Figure 2B,C). Previous studies have implied that both arbuscular mycorrhizal and ectomycorrhizal fungi can facilitate plant nutrient uptake [26]. Ectomycorrhizal fungi can also mineralize nutrients from organic matter, thereby accessing several forms of organic nitrogen [67]. In this context, the decreased prevalence of ectomycorrhizal fungi over time and their continued scarcity in soils subjected to three years of ESSS-based restorations [1] underscore the need for greater attention to them compared to arbuscular mycorrhizal fungi. We also detected increased patterns for the relative abundances of saprotrophic and plant pathogenic fungi over time (Figure 2B). Previous studies indicate that these two guilds may have positive [25] or negative [27,28] impacts on plant health. However, our data are insufficient to differentiate between the guilds that are detrimental to plants and those that are beneficial since their dynamics vary among class-level lineages (Figure 2C). Nevertheless, the present study demonstrates that ectomycorrhizal, saprotrophic, and plant pathogenic fungi are likely impacted by ESSS-induced disturbances at very early stages after ESSS in subalpine forest ecosystems, thereby emphasizing the key time points we should focus on when addressing soil fungal community restoration in these areas.

4.3. Homogeneous Selection Driven by Nitrate Nitrogen Content Regulates Soil Fungal Dynamics

Revealing the ecological mechanism driving soil fungal dynamics during ESSS-based restorations is critical to understanding why the major functional guilds shift significantly at early stages. However, few studies have addressed this. Our previous study has revealed a decline in fungal α-diversity from the initial day to day 46, followed by relative stabilities up to day 196; α-diversity negatively correlated with NO 3 −N, and the changes in community structure over time were primarily driven by the same factor [9]. In this study, we demonstrate that fungal dynamics during the ESSS-based restoration are primarily regulated by homogeneous selection mediated by NO 3 −N, which supports our hypothesis. We found that ses.MNTD values were less than zero, showing an overall decline pattern from the initial day to day 196, although the minimum was detected at day 16 (Figure 4A). This suggests that soil fungal communities at the later stages of simulated restorations are more phylogenetically clustered than those at the initial day [54]. Evidence shows that phylogenetic clustering occurs because of the local extinction of species that are phylogenetically different from those in the community or the colonization of species that are similar in phylogeny to the residents [68]. In this study, observed ASVs (α-diversity), unique ASV numbers, and within-stage Bray–Curtis distances (β-diversity) significantly declined from the initial day to day 46, stabilized thereafter up to day 196; both α- (negative correlation) and β-diversity significantly correlated with NO 3 −N (Figure 1A–E and Figures S2–S4), and most functional guilds showed the strongest negative correlation with NO 3 −N (Figure 3). While nitrate serves as a crucial nutrient and electron acceptor for microorganisms [32], high concentrations of nitrate could also be toxic for fungi [33]. In the natural soils of our study areas, NO 3 -N ranges from 1.26 to 8.48 mg/kg [10]. Consistently, on the initial day of our simulation experiment, NO 3 -N levels remained relatively low, ranging from 6.99 to 7.81 mg/kg, but it increased to approximately 200 to 300 mg/kg at later stages (days 46 to 196) (Figure S1D). In this context, the decrease in α-diversity, depletion of several functional guilds, and altered community structures at later stages probably resulted from the selections from high levels of NO 3 −N, leading to the exclusion of several species from initial communities. This is supported by our findings about βNTI and the community assembly process, showing the strongest correlation between βNTI and NO 3 −N (Figure 5C, Table S4) and an increase in homogeneous selection from the initial day to day 46, followed by a slight decline from days 46 to 196 (Figure 4B,D). Notably, despite slightly reduced NO 3 −N and homogeneous selection after day 46 (Figure 4B,D and Figure S1D), fungal communities did not show recovering trends (Figure 1A,D) but continuously shifted compared to the initial day (Figure 1F and Figure 4C). This confirms a notion that fungi are less resilient [69], highlighting the challenge of restoring fungal communities in subalpine forest soils disturbed by ESSS. Overall, these results suggest that homogeneous selections from NO 3 −N shape fungal dynamics during ESSS-based restorations in subalpine forests, stressing the need to manage soil NO 3 −N levels at the early-stage restoration.

5. Conclusions

This study reveals that ESSS greatly impacts soil fungal communities, with ectomycorrhizal fungi being depleted while saprotrophic and plant pathogenic fungi become enriched over time. These trends are mainly shaped by homogeneous selection due to the increased NO 3 -N levels at later stages. Our findings highlight the importance of managing soil NO 3 -N content to maintain fungal diversity and ecosystem health during ESSS-based restorations and the need for targeted management practices to facilitate ecological restoration and resilience in disturbed subalpine forests. Despite that the immediate application of our findings still remains challenging, this study provides valuable insights for designing in situ experiments, maintaining ESSS-restored cut slopes, and developing innovative restoration strategies for bare-cut slopes caused by infrastructure construction in subalpine forest ecosystems. Given that our simulation experiment lasted only 196 days, further studies are needed to reveal how fungal dynamics evolve beyond this timeframe. Moreover, since our simulation was conducted in a phytotron, some key conclusions in the study may require further validation through a long-term in situ monitoring experiment.

Supplementary Materials

The following supporting information can be downloaded at: https://www.mdpi.com/article/10.3390/f15081385/s1.

Author Contributions

H.L. and C.L. conceived the ideas, designed the methodology, and wrote the manuscript; D.L. contributed to the discussion; C.L. revised the manuscript and contributed to the discussion. All authors have read and agreed to the published version of the manuscript.

Funding

This research was funded by the Sichuan Science and Technology Program (2024NSFSC0849), the Natural Science Foundation of Sichuan Province (2022NSFSC1175), and the Scientific Research Initiation Project of Mianyang Normal University (QD2023A01).

Data Availability Statement

Raw reads are available in the Sequence Read Archive (SRA) via accession number PRJNA1127272.

Conflicts of Interest

The authors declare no conflicts of interest.

References

  1. Li, C.; Liao, H.; Li, D.; Jing, Y. The fungal functional guilds at the early-stage restoration of subalpine forest soils disrupted by highway construction in Southwest China. Forests 2024, 15, 636. [Google Scholar] [CrossRef]
  2. Meyer, M.D. Natural Range of Variation of Subalpine Forests in the Bioregional Assessment Area; US Forest Service, Pacific Southwest Region: Washington, DC, USA, 2013. [Google Scholar]
  3. Banerjee, P.; Ghose, M.K.; Pradhan, R. Analytic hierarchy process based spatial biodiversity impact assessment model of highway broadening in Sikkim Himalaya. Geocarto Int. 2020, 35, 470–493. [Google Scholar] [CrossRef]
  4. Van Der Ree, R.; Smith, D.J.; Grilo, C. The ecological effects of linear infrastructure and traffic: Challenges and opportunities of rapid global growth. In Handbook of Road Ecology; Wiley: Hoboken, NJ, USA, 2015. [Google Scholar]
  5. Xu, H.; Li, T.B.; Chen, J.N.; Liu, C.N.; Zhou, X.h.; Xia, L. Characteristics and applications of ecological soil substrate for rocky slope vegetation in cold and high-altitude areas. Sci. Total Environ. 2017, 609, 446–455. [Google Scholar] [CrossRef] [PubMed]
  6. Ai, S.; Chen, J.; Gao, D.; Ai, Y. Distribution patterns and drivers of artificial soil bacterial community on cut-slopes in alpine mountain area of southwest China. Catena 2020, 194, 104695. [Google Scholar] [CrossRef]
  7. Fu, D.; Yang, H.; Wang, L.; Yang, S.; Li, R.; Zhang, W.; Ai, X.; Ai, Y. Vegetation and soil nutrient restoration of cut slopes using outside soil spray seeding in the plateau region of southwestern China. J. Environ. Manag. 2018, 228, 47–54. [Google Scholar] [CrossRef] [PubMed]
  8. Ramaji, A.E. A review on the soil stabilization using low-cost methods. J. Appl. Sci. Res. 2012, 8, 2193–2196. [Google Scholar]
  9. Liao, H.; Li, C.; Ai, S.; Li, X.; Ai, X.; Ai, Y. A simulated ecological restoration of bare cut slope reveals the dosage and temporal effects of cement on ecosystem multifunctionality in a mountain ecosystem. J. Environ. Manag. 2023, 325, e116672. [Google Scholar] [CrossRef] [PubMed]
  10. Liao, H.; Sheng, M.; Liu, J.; Ai, X.; Li, C.; Ai, S.; Ai, Y. Soil N availability drives the shifts of enzyme activity and microbial phosphorus limitation in the artificial soil on cut slope in southwestern China. Environ. Sci. Pollut. Res. 2021, 28, 33307–33319. [Google Scholar] [CrossRef] [PubMed]
  11. Chen, W.; Wang, J.; Meng, Z.; Xu, R.; Chen, J.; Zhang, Y.; Hu, T. Fertility-related interplay between fungal guilds underlies plant richness–productivity relationships in natural grasslands. New Phytol. 2020, 226, 1129–1143. [Google Scholar] [CrossRef]
  12. Li, J.; Delgado Baquerizo, M.; Wang, J.T.; Hu, H.W.; Cai, Z.J.; Zhu, Y.N.; Singh, B.K. Fungal richness contributes to multifunctionality in boreal forest soil. Soil Biol. Biochem. 2019, 136, 107526. [Google Scholar] [CrossRef]
  13. Delgado-Baquerizo, M.; Maestre, F.T.; Reich, P.B.; Jeffries, T.C.; Gaitan, J.J.; Encinar, D.; Berdugo, M.; Campbell, C.D.; Singh, B.K. Microbial diversity drives multifunctionality in terrestrial ecosystems. Nat. Commun. 2016, 7, 10541. [Google Scholar] [CrossRef] [PubMed]
  14. Ngugi, M.R.; Fechner, N.; Neldner, V.J.; Dennis, P.G. Successional dynamics of soil fungal diversity along a restoration chronosequence post-coal mining. Restor. Ecol. 2020, 28, 543–552. [Google Scholar] [CrossRef]
  15. Wang, K.; Bi, Y.; Cao, Y.; Peng, S.; Christie, P.; Ma, S.; Zhang, J.; Xie, L. Shifts in composition and function of soil fungal communities and edaphic properties during the reclamation chronosequence of an open-cast coal mining dump. Sci. Total Environ. 2021, 767, 144465. [Google Scholar] [CrossRef] [PubMed]
  16. Li, C.; Jia, Z.; Yuan, Y.; Cheng, X.; Shi, J.; Tang, X.; Wang, Y.; Peng, X.; Dong, Y.; Ma, S.; et al. Effects of mineral-solubilizing microbial strains on the mechanical responses of roots and root-reinforced soil in external-soil spray seeding substrate. Sci. Total Environ. 2020, 723, 138079. [Google Scholar] [CrossRef] [PubMed]
  17. Huang, Z.; Chen, J.; Ai, X.; Li, R.; Ai, Y.; Li, W. The texture, structure and nutrient availability of artificial soil on cut slopes restored with OSSS–Influence of restoration time. J. Environ. Manag. 2017, 200, 502–510. [Google Scholar] [CrossRef] [PubMed]
  18. Gao, G.; Li, Z.; Han, R. Statistical evaluation of sprayed synthetic soils amended with four additive factors used in high- and cut rock slopes. Environ. Eng. Sci. 2016, 34, 281–290. [Google Scholar] [CrossRef]
  19. Zhao, X.; Li, Z.; Robeson, M.D.; Hu, J.; Zhu, Q. Application of erosion-resistant fibers in the recovery of vegetation on steep slopes in the Loess Plateau of China. Catena 2018, 160, 233–241. [Google Scholar] [CrossRef]
  20. Liao, H.; Li, C.; Ai, Y.; Li, X. Soil bacterial responses to disturbance are enlarged by altitude in a mountain ecosystem. J. Soils Sediments 2023, 23, 3820–3831. [Google Scholar] [CrossRef]
  21. Li, C.; Liao, H.; Li, D.; Jing, Y. Abundant species govern the altitude patterns of bacterial community in natural and disturbed subalpine forest soils. Diversity 2024, 16, 242. [Google Scholar] [CrossRef]
  22. Zhu, Z.; Zhao, Q.; Lai, Q.; Xu, G.; Chen, X. Cognition and practice on technological innovation of ecological restoration of engineering slope soil in South China. Soils 2017, 49, 643–650. [Google Scholar]
  23. Jin, X.; Liu, Y.; Hu, W.; Wang, G.; Kong, Z.; Wu, L.; Ge, G. Soil bacterial and fungal communities and the associated nutrient cycling responses to forest conversion after selective logging in a subtropical forest of China. For. Ecol. Manag. 2019, 444, 308–317. [Google Scholar] [CrossRef]
  24. Bardgett, R.D.; Van Der Putten, W.H. Belowground biodiversity and ecosystem functioning. Nature 2014, 515, 505–511. [Google Scholar] [CrossRef] [PubMed]
  25. Bonfante, P.; Genre, A. Mechanisms underlying beneficial plant-fungus interactions in mycorrhizal symbiosis. Nat. Commun. 2010, 1, 48. [Google Scholar] [CrossRef] [PubMed]
  26. van der Heijden, M.G.A.; Martin, F.M.; Selosse, M.A.; Sanders, I.R. Mycorrhizal ecology and evolution: The past, the present, and the future. New Phytol. 2015, 205, 1406–1423. [Google Scholar] [CrossRef] [PubMed]
  27. García-Guzmán, G.; Heil, M. Life histories of hosts and pathogens predict patterns in tropical fungal plant diseases. New Phytol. 2013, 201, 1106–1120. [Google Scholar] [CrossRef] [PubMed]
  28. Wagner, M.; Mitschunas, N. Fungal effects on seed bank persistence and potential applications in weed biocontrol: A review. Basic Appl. Ecol. 2008, 9, 191–203. [Google Scholar] [CrossRef]
  29. Mahedi, M.; Cetin, B.; White, D.J. Cement, lime, and fly ashes in stabilizing expansive soils: Performance evaluation and comparison. J. Mater. Civ. Eng. 2020, 32, 04020177. [Google Scholar] [CrossRef]
  30. Větrovský, T.; Kohout, P.; Kopecký, M.; Machac, A.; Man, M.; Bahnmann, B.D.; Brabcová, V.; Choi, J.; Meszárošová, L.; Human, Z.R.; et al. A meta-analysis of global fungal distribution reveals climate-driven patterns. Nat. Commun. 2019, 10, 5142. [Google Scholar] [CrossRef] [PubMed]
  31. Wang, Y.; Li, C.; Tu, B.; Kou, Y.; Li, X. Species pool and local ecological assembly processes shape the β-diversity of diazotrophs in grassland soils. Soil Biol. Biochem. 2021, 160, 108338. [Google Scholar] [CrossRef]
  32. Meiying, X.; Qin, Z.; Chunyu, X.; Yuming, Z.; Sun, G.; Jun, G.; Yuan, T.; Jizhong, Z.; Zhili, H. Elevated nitrate enriches microbial functional genes for potential bioremediation of complexly contaminated sediments. ISME J. 2014, 8, 1932–1944. [Google Scholar]
  33. Nygren, C.M.R.; Eberhardt, U.; Karlsson, M.; Parrent, J.L.; Lindahl, B.D.; Taylor, A.F.S. Growth on nitrate and occurrence of nitrate reductase-encoding genes in a phylogenetically diverse range of ectomycorrhizal fungi. New Phytol. 2008, 180, 875–889. [Google Scholar] [CrossRef]
  34. Zhang, Z.; Yuan, Y.; Zhao, W.; He, H.; Li, D.; He, W.; Liu, Q.; Yin, H. Seasonal variations in the soil amino acid pool and flux following the conversion of a natural forest to a pine plantation on the eastern Tibetan Plateau, China. Soil Biol. Biochem. 2017, 105, 1–11. [Google Scholar] [CrossRef]
  35. GB 175–2007; Common Portland Cement. Standards Press of China: Beijing, China, 2007.
  36. NB/T 35082-2016; Technical Code for Eco-restoration of Vegetation Concrete On Steep Slope of Hydropower Projects. China Electric Power Press: Beijing, China, 2016.
  37. Chunjuan, G.; Lihua, J.; Guangning, W.; Jing, l.; Qiuyue, H.; Guizhai, Z.; Huiqun, R.; Cong, W. Effects of different fungicides on seed germination of tall fescue in slope plants and soil properties. J. Shandong Agric. Eng. Univ. 2024, 41. [Google Scholar] [CrossRef]
  38. He, H.; Yu, L.; Yang, X.; Luo, L.; Liu, J.; Chen, J.; Kou, Y.; Zhao, W.; Liu, Q. Effects of different soils on the biomass and photosynthesis of rumex nepalensis in Subalpine Region of Southwestern China. Forests 2022, 13, 73. [Google Scholar] [CrossRef]
  39. Bao, S. Soil and Agricultural Chemistry Analysis; China Agriculture Press: Beijing, China, 2000. [Google Scholar]
  40. Nelson, D.W.; Sommers, L.E. Total Carbon, Organic Carbon, and Organic Matter; Soil Science Society of America, American Society of Agronomy: Washington, DC, USA, 1996. [Google Scholar]
  41. Bremner, J.M. Total Nitrogen. In Methods of Soil Analysis: Part 2. Chemical and Microbiological Properties; Black, C.A., Evans, D.D., Dinauer, R.C., Eds.; American Society of Agronomy, Soil Science Society of America: Washington, DC, USA, 1965. [Google Scholar]
  42. Wang, Y.; Li, C.; Kou, Y.; Wang, J.; Tu, B.; Li, H.; Li, X.; Wang, C.; Yao, M. Soil pH is a major driver of soil diazotrophic community assembly in Qinghai-Tibet alpine meadows. Soil Biol. Biochem. 2017, 115, 547–555. [Google Scholar] [CrossRef]
  43. Olsen, S.R. Estimation of Available Phosphorus in Soils by Extraction with Sodium Bicarbonate; U.S. Department of Agriculture: Washington, DC, USA, 1954. [Google Scholar]
  44. Bolyen, E.; Rideout, J.R.; Dillon, M.R.; Bokulich, N.A.; Abnet, C.C.; Al-Ghalith, G.A.; Alexander, H.; Alm, E.J.; Arumugam, M.; Asnicar, F.; et al. Reproducible, interactive, scalable and extensible microbiome data science using QIIME 2. Nat. Biotechnol. 2019, 37, 852–857. [Google Scholar] [CrossRef] [PubMed]
  45. Rognes, T.; Flouri, T.; Nichols, B.; Quince, C.; Mahé, F. VSEARCH: A versatile open source tool for metagenomics. PeerJ 2016, 4, e2584. [Google Scholar] [CrossRef]
  46. Callahan, B.; McMurdie, P.J.; Rosen, M.J.; Han, A.W.; Johnson, A.J.; Holmes, S. DADA2: High resolution sample inference from Illumina amplicon data. Nat. Methods 2016, 13, 581–583. [Google Scholar] [CrossRef]
  47. Thompson, L.R.; Sanders, J.G.; McDonald, D.; Amir, A.; Ladau, J.; Locey, K.J.; Prill, R.J.; Tripathi, A.; Gibbons, S.M.; Ackermann, G.; et al. A communal catalogue reveals Earth's multiscale microbial diversity. Nature 2017, 551, 457–463. [Google Scholar] [CrossRef]
  48. Nilsson, R.H.; Larsson, K.; Taylor, A.F.S.; Bengtsson-Palme, J.; Jeppesen, T.; Schigel, D.; Kennedy, P.; Picard, K.T.; Glöckner, F.; Tedersoo, L.; et al. The UNITE database for molecular identification of fungi: Handling dark taxa and parallel taxonomic classifications. Nucleic Acids Res. 2018, 47, D259–D264. [Google Scholar] [CrossRef]
  49. Katoh, K.; Misawa, K.; Kuma, K.; Miyata, T. MAFFT: A novel method for rapid multiple sequence alignment based on fast Fourier transform. Nucleic Acids Res. 2002, 30, 3059–3066. [Google Scholar] [CrossRef]
  50. Price, M.N.; Dehal, P.S.; Arkin, A.P. FastTree: Computing large minimum evolution trees with profiles instead of a distance matrix. Mol. Biol. Evol. 2009, 26, 1641–1650. [Google Scholar] [CrossRef]
  51. Price, M.N.; Dehal, P.S.; Arkin, A.P. FastTree 2–approximately maximum-likelihood trees for large alignments. PLoS ONE 2010, 5, e9490. [Google Scholar] [CrossRef]
  52. Li, C.; Liu, C.; Li, H.; Liao, H.; Xu, L.; Yao, M.; Li, X. The microgeo: An R package rapidly displays the biogeography of soil microbial community traits on maps. FEMS Microbiol. Ecol. 2024, 100, fiae087. [Google Scholar] [CrossRef]
  53. Kembel, S.W.; Cowan, P.D.; Helmus, M.R.; Cornwell, W.K.; Morlon, H.; Ackerly, D.D.; Blomberg, S.P.; Webb, C.O. Picante: R tools for integrating phylogenies and ecology. Bioinformatics 2010, 26, 1463–1464. [Google Scholar] [CrossRef] [PubMed]
  54. Tripathi, B.M.; Stegen, J.C.; Kim, M.; Dong, K.; Adams, J.M.; Lee, Y.K. Soil pH mediates the balance between stochastic and deterministic assembly of bacteria. ISME J. 2018, 12, 1072–1083. [Google Scholar] [CrossRef] [PubMed]
  55. Ning, D.L.; Yuan, M.T.; Wu, L.W.; Zhang, Y.; Guo, X.; Zhou, X.S.; Yang, Y.F.; Arkin, A.P.; Firestone, M.K.; Zhou, J.Z. A quantitative framework reveals ecological drivers of grassland microbial community assembly in response to warming. Nat. Commun. 2020, 11, e4717. [Google Scholar] [CrossRef] [PubMed]
  56. Stegen, J.C.; Lin, X.; Konopka, A.E.; Fredrickson, J.K. Stochastic and deterministic assembly processes in subsurface microbial communities. ISME J. 2012, 6, 1653–1664. [Google Scholar] [CrossRef]
  57. Liu, C.; Cui, Y.; Li, X.; Yao, M. microeco: An R package for data mining in microbial community ecology. FEMS Microbiol. Ecol. 2021, 97, fiaa255. [Google Scholar] [CrossRef]
  58. Põlme, S.; Abarenkov, K.; Henrik Nilsson, R.; Lindahl, B.D.; Clemmensen, K.E.; Kauserud, H.; Nguyen, N.; Kjøller, R.; Bates, S.T.; Baldrian, P.; et al. FungalTraits: A user-friendly traits database of fungi and fungus-like stramenopiles. Fungal Divers. 2020, 105, 1–16. [Google Scholar] [CrossRef]
  59. Dixon, P. VEGAN, a package of R functions for community ecology. J Veg. Sci. 2003, 14, 927–930. [Google Scholar] [CrossRef]
  60. Wickham, H. ggplot2: Elegant Graphics for Data Analysis; Online Library, Springer: Berlin/Heidelberg, Germany, 2016. [Google Scholar]
  61. Rodriguez Ramos, J.C.; Cale, J.A.; Cahill, J.F.; Simard, S.W.; Karst, J.; Erbilgin, N. Changes in soil fungal community composition depend on functional group and forest disturbance type. New Phytol. 2020, 229, 1105–1117. [Google Scholar] [CrossRef]
  62. Rähn, E.; Tedersoo, L.; Adamson, K.; Drenkhan, T.; Sibul, I.; Lutter, R.; Anslan, S.; Pritsch, K.; Drenkhan, R. Rapid shift of soil fungal community compositions after clear-cutting in hemiboreal coniferous forests. For. Ecol. Manag. 2023, 544, 121211. [Google Scholar] [CrossRef]
  63. Nguyen, N.H.; Song, Z.; Bates, S.T.; Branco, S.; Tedersoo, L.; Menke, J.; Schilling, J.S.; Kennedy, P.G. FUNGuild: An open annotation tool for parsing fungal community datasets by ecological guild. Fungal Ecol. 2016, 20, 241–248. [Google Scholar] [CrossRef]
  64. Fernández, N.; Knoblochová, T.; Kohout, P.; Janoušková, M.; Cajthaml, T.; Frouz, J.; Rydlová, J. Asymmetric interaction between two mycorrhizal fungal guilds and consequences for the establishment of their host plants. Front. Plant Sci. 2022, 13, 873204. [Google Scholar] [CrossRef]
  65. Tedersoo, L.; Bahram, M. Mycorrhizal types differ in ecophysiology and alter plant nutrition and soil processes. Biol. Rev. 2019, 94, 1857–1880. [Google Scholar] [CrossRef] [PubMed]
  66. Peay, K.G. The mutualistic niche: Mycorrhizal symbiosis and community dynamics. Annu. Rev. Ecol. Evol. Syst. 2016, 47, 143–164. [Google Scholar] [CrossRef]
  67. Dong, Y.; Wang, Z.; Sun, H.; Yang, W.; Xu, H. The response patterns of arbuscular mycorrhizal and ectomycorrhizal symbionts under elevated CO2: A meta-analysis. Front. Microbiol. 2018, 9, 1248. [Google Scholar] [CrossRef]
  68. Li, S.p.; Cadotte, M.W.; Meiners, S.J.; Hua, Z.s.; Jiang, L.; Shu, W.S. Species colonisation, not competitive exclusion, drives community overdispersion over long-term succession. Ecol. Lett. 2015, 18, 964–973. [Google Scholar] [CrossRef]
  69. Shade, A.; Peter, H.; Allison, S.D.; Baho, D.L.; Berga, M.; Burgmann, H.; Huber, D.H.; Langenheder, S.; Lennon, J.T.; Martiny, J.B.; et al. Fundamentals of microbial community resistance and resilience. Front. Microbiol. 2012, 3, 417. [Google Scholar] [CrossRef]
Figure 1. Shifts in observed fungal ASVs over time (A), the unique ASV numbers at each stage and shared ASV numbers between or among stages (B), the relationships between nitrate nitrogen content ( NO 3 −N) and observed fungal ASVs (C), the principal coordinates analysis (PCoA) for soil fungal communities based on Bray–Curtis distances (D), the shifting pattern of within-stage Bray–Curtis distances over time (E), and the shifting pattern of Bray–Curtis distances between each stage and the initial day (F). White points in panels (A,E,F) denote average values, and the length of error bars in these panels represent standard errors (SE). Lowercase letters in panels (A,E,F) show significance among groups, with no significant differences (p > 0.05) between two groups sharing the same letter. Small numbers in panel (B) represent the unique or shared ASV counts, while the large numbers denote sampling stages (days 0, 16, 46, 106, and 196). R-squared values and p-values in panel (C) derive from quadratic polynomial fits.
Forests 15 01385 g001
Figure 2. The compositions of class-level fungal lineages (A) and predicted fungal functional guilds (B) and the shifting patterns of significantly varied ASVs (identified by a Random Forest algorithm) matched to functional guilds at class-level (C). The height of bars with the same color represents the relative abundance of a class-level fungal lineage or a functional guild in panels (A,B), respectively. White points represent the average relative abundances in panel (C), with error bars indicating standard errors (SE). Lowercase letters in panel (C) indicate significance among groups, with no significant differences (p > 0.05) between two groups sharing the same letter. If a subpanel in panel (C) does not contain lowercase letters, it represents that there are no significant differences (p > 0.05) between any two stages. The numbers in the title of subpanels in panel (C), e.g., “Ect: Agaricomycetes [18]”, represent ASV counts for current group (e.g., “Ect: Agaricomycetes”). Abbreviations before the semicolon in subpanel titles represent functional guilds, while those after indicate class-level names. For example, the “Ect: Agaricomycetes [18]” represents ectomycorrhizal fungi in the class Agaricomycetes, comprising 18 fungal ASVs that significantly shift over time (identified by the Random Forest; p < 0.05). Ect: ectomycorrhizal fungi; Fol: foliar endophytic fungi; Pla: plant pathogenic fungi; Sap: saprotrophic fungi including soil saprotroph, litter saprotroph, wood saprotroph, dung saprotroph, and unspecified saprotroph in the present study.
Forests 15 01385 g002
Figure 3. Spearman rank correlations between soil properties and the relative abundances of fungal functional guilds consisting of significant ASVs identified by the Random Forest (p < 0.05). Numbers in the cells represent correlation coefficients, and they are marked with an “×” if the p-value is greater than 0.05. Numbers in y-axis labels, e.g., “Ect: Agaricomycetes [18]”, represent the ASV counts for that group (e.g., “Ect: Agaricomycetes”). Abbreviations before the semicolon in y-axis labels denote fungal functional guilds, while those after indicate class-level names. For example, the “Ect: Agaricomycetes [18]” refers to ectomycorrhizal fungi in the class Agaricomycetes, comprising 18 fungal ASVs that significantly shift over time (identified by the Random Forest; p < 0.05). Ect: ectomycorrhizal fungi; Fol: foliar endophytic fungi; Pla: plant pathogenic fungi; Sap: saprotrophic fungi including soil saprotroph, litter saprotroph, wood saprotroph, dung saprotroph, and unspecified saprotroph in the present study; CD: soil conductivity; MC: soil moisture content; TOC: total soil organic carbon; TN: total soil nitrogen; NH 4 + −N: ammonium nitrogen; NO 3 −N: nitrate nitrogen; AP: available phosphorus.
Forests 15 01385 g003
Figure 4. The standardized effect size measurement of the mean nearest taxon distance (ses.MNTD) over time (A), the β–nearest taxon index (βNTI) within each stage over time (B), the βNTI between each stage and the initial day (C), and the relative contribution of each community assembly process over time (D). White points and the numbers alongside them in panels (AC) indicate the mean values, while the length of the error bars represents standard errors (SE). Lowercase letters in panels (AC) represent the significance of differences among groups, with no significant difference (p > 0.05) between two groups sharing the same letter. Height of bars with the same color in panel (D) represents the relative contribution of each community assembly process.
Forests 15 01385 g004
Figure 5. Relationships between ses.MNTD and ammonium nitrogen ( NH 4 + −N) (A), nitrate nitrogen ( NO 3 −N) (B), and between βNTI and NO 3 −N (C). R-squared values and p-values are calculated based on the quadratic polynomial fits. The ses.MNTD means standardized effect size measurement of the mean nearest taxon distance, and the βNTI denotes β–nearest taxon index.
Forests 15 01385 g005
Disclaimer/Publisher’s Note: The statements, opinions and data contained in all publications are solely those of the individual author(s) and contributor(s) and not of MDPI and/or the editor(s). MDPI and/or the editor(s) disclaim responsibility for any injury to people or property resulting from any ideas, methods, instructions or products referred to in the content.

