Abstract
In this thesis, wood loaded with a silica–titanium (Si-Ti) composite film was prepared using the sol–gel method in order to achieve improved wood with high hydrophobicity and photocatalytic activity under visible light. The factors affecting the structure and properties of the composite film, as well as the optimization process, were discussed. Infrared analysis revealed that the vibrational intensity of Si-O-Si, Ti-O-Ti, and Ti-O-Si telescopic vibration peaks increased with an increase in vinyltriethoxysilane (VETS). Additionally, the number of Ti-O-Ti telescopic vibration peaks also increased with an increase in VETS. Furthermore, the intensity of -NO3, Si-O-Si, and Ti-O-Ti telescopic vibrational peaks was enhanced with a higher dosage of nitric acid. Conversely, the intensity of -OH telescopic vibrational peaks decreased with an increase in drying temperature. XRD analysis showed that nitric acid could promote the transformation of TiO2 from amorphous to anatase, while SiO2 would reduce the grain size of anatase TiO2 and promote the growth of rutile TiO2. Additionally, wood surfaces loaded with Si-Ti composite film changed from hydrophilic to hydrophobic, with significant differences observed between different levels of each factor. The photocatalytic activity of surface-loaded Si-Ti composite films on wood was most affected by the amount of nitric acid, which influenced crystallinity of TiO2 and thus impacted the photocatalytic activity. Furthermore, changes in VTES dosage not only affected the crystalline phase of TiO2 and the grain size of Si-Ti composite film but also influenced the crystallinity of TiO2 through generating SiO2. Finally, based on optimal preparation process (titanium–alcohol ratio of 1:5, titanium–silicon ratio of 1:0.2, titanium–acid ratio of 1:0.5, and drying temperature of 100 °C), wood surfaces loaded with Si-Ti composite film achieved a contact angle up to 125.9° and exhibited a decolorization rate for rhodamine B under UV light reaching 94% within 180 min.
1. Introduction
Wood, as a renewable resource, is primarily composed of cellulose, hemicellulose, and lignin. Due to the advantages of good thermal insulation, easy processing, high strength-to-weight ratio, and environmental friendliness, biomass raw materials such as wood and bamboo are widely used in furniture [], construction, and other functional composites [,]. However, the high amount of hydrophilic hydroxyl groups in cellulose and hemicellulose makes the wood surface highly hygroscopic []. As a result, wood is prone to drying, shrinking, and wetting during actual use, leading to dimensional deformation or even structural defects such as warping and cracking []. In addition, the wood surface easily becomes contaminated after moisture absorption, resulting in mold growth or decay degradation, which seriously affects the durability and service life of wood []. Therefore, scholars have conducted functional modifications on the wood surface to improve its dimensional stability and endow it with properties such as flame retardancy, self-cleaning ability, and anticorrosion resistance. This has become one of the research hotspots in the field of wood applications.
Previous studies have shown that more than 90% of the variation in wood properties is related to moisture []. Therefore, hydrophobic modification of wood surfaces can reduce the hygroscopicity of wood. Currently, the reported methods for hydrophobic modification of wood include wood heat treatment [], surface coating [], the sol–gel method [], grafting modification [], impregnation treatment [], chemical vapor deposition [], and stencil printing [], etc. Among them, the sol–gel method is a technique where a chemically active component acts as a reaction precursor to form a sol though hydrolysis and condensation under the influence of water and catalyst (H+ or OH−). Subsequently, after aging, drying, and heat treatment, a gel is obtained. Due to its advantages such as simplicity in process, controllable reaction process, and no special requirements on wood material or area size, the sol–gel method is widely employed in research aimed at improving wood surface properties [].
Due to their excellent usability, non-toxic, and environmentally harmless ecological properties, SiO2 and TiO2 are more frequently applied to enhance the surface properties of wood [,]. Liao et al. [] generated anatase-type TiO2 nanospheres with a diameter of approximately 300–600 nm in situ on the wood surface using the cosolvent-controlled hydrothermal method, which improved the contact angle of the wood surface from 46.5° before treatment to 136.8°. However, simply using nanoparticles to improve the hydrophobicity of the wood surface resulted in limited improvement due to the presence of -OH groups on their surfaces. Therefore, researchers introduced low surface free energy substances to further enhance hydrophobicity. Wu et al. [] used inorganic nanoparticles (SiO2, TiO2) composited with vinyltriethoxysilane (VTES) to construct robust organic/inorganic composite superhydrophobic coatings on cellulosic materials’ surface such as wood and bamboo, achieving a water contact angle exceeding 150° and a rolling angle of less than 4.5°. Liu et al. [,] constructed TiO2 nanofilms on the surface of wood using the sol–gel method, modifying them with stearic acid and cetyltrimethoxysilane (HDTMS), respectively. The results demonstrated that the TiO2 nanoparticles loaded onto stearic acid-modified wood were evenly distributed, resulting in a water contact angle of 130°. Furthermore, when the wood specimens were co-treated with HDTMS and TiO2, the contact angle could reach 140° due to stronger covalent bonds formed between HDTMS’s long-chain alkanes and TiO2, compared to hydrogen bonding between stearic acid and TiO2. Additionally, it is worth noting that there has been limited research on the slab titania (Brookite) form of TiO2 as it is commonly classified into anatase and rutile forms. Moreover, being an n-type semiconductor, TiO2 exhibits high reactivity when irradiated by light at λ < 387.5 nm leading to the formation of highly active electron–hole pairs as well as free radicals and reactive oxygen species through complexation inhibition with adsorbed H2O, OH− ions, and O2 molecules on its surface []. These properties make it possible to load photocatalytic TiO2 onto wood surfaces. To enhance weatherability of hydrophobic surfaces further, Wang et al. [] initially developed a sol–gel-based nanocoating consisting of TiO2 on wood surfaces followed by modification with HDTMS resulting in a highly hydrophobic surface exhibiting a water contact angle up to 138° along with good photostability.
In order to reduce the hygroscopicity of wood and to endow it with self-cleaning and photocatalytic degradation properties, a silicon and titanium (Si-Ti) composite film was added to the surface of wood by sol–gel method in this study, using titanium butyl ester of titanate (TBOT) and VTES as titanium and silicon sources. The effects of four factors (molar ratio of TBOT to anhydrous ethanol (EtOH), molar ratio of TBOT to VTES, molar ratio of TBOT to nitric acid, and drying temperature) on the structure and properties of the Si-Ti composite film on the wood surface were investigated. Surface contact angle and photocatalytic degradation performance were also measured as indicators. By conducting orthogonal experiments based on one-way experiments, the optimal preparation process for a silica–titania composite film was determined, providing scientific references for hydrophobic and photocatalytic modification of wood surfaces.
2. Materials and Methods
2.1. Materials and Chemicals
In this experiment, Tsoongiodendron odorum was selected as the wood raw material, which was harvested from Liangfengjiang National Forest Park, Nanning, Guangxi. The air-dried specimens were processed into 40 mm (L) × 40 mm (T) × 5 mm (R) dimensions. Then, specimens with smooth surface and no defects were carefully selected and cleaned using distilled water. Finally, they were air-dried in a room (with a moisture content of about 15%) and set aside. Butyl titanate (analytically pure) and anhydrous ethanol (analytically pure) were purchased from Tianjin Damao Chemical Reagent Factory (Tianjin, China). Vinyltriethoxysilane (chemically pure) was purchased from Guangdong Wengjiang Chemical Reagent Co. (Shaoguan, China), while nitric acid (analytically pure) was purchased from Chengdu Jinshan Chemical Reagent Co. (Chengdu, China) Distilled water was prepared in the laboratory.
2.2. Preparation of Si-Ti Composite Film on Wood Surface
Si-Ti composite films were applied to the wood surface using the sol–gel method, with TBOT and VTES as titanium and silicon sources, respectively. Ethanol and water were used as solvent and initiator, while nitric acid was used to adjust the pH. The mixture of VETS and 1/3 EtOH was added to the mixture of TBOT and 1/3 EtOH under magnetic stirring. Then, a mixture of 1/3 EtOH, H2O, and HNO3 was added, followed by vigorous stirring for 1 h. The sol was formed by standing at room temperature before being uniformly coated on the wood surface for a second time after an hour. After aging for 24 h, the modified wood was dried at a constant temperature in a drying oven for 6 h, cooled to room temperature, and stored in a desiccator until needed [,]. The effects of different molar ratios of TBOT to EtOH, TBOT to VTES, TBOT to nitric acid, as well as drying temperatures on the structure of Si-Ti composite film on the wood surface along with its hydrophobicity and photocatalytic properties were discussed.
2.3. Optimization of the Preparation Process of Si-Ti Composite Film on Wood Surface
Based on the results of the one-way experiments, the molar ratios of TBOT to EtOH, TBOT to VTES, TBOT to nitric acid, and the drying temperature were selected as the factors. The surface contact angle and photocatalytic degradation efficiency were used as assessment indexes to conduct orthogonal experiments in order to investigate the significance of each factor’s effects on the assessment indexes and to obtain an optimized process. The orthogonal table L9 (34) was used for experimental design without considering interaction. The level values of each factor are shown in Table 1.

Table 1.
Orthogonal test design table.
2.4. Structural and Performance Characterization
2.4.1. Infrared Spectral
The KBr pressing method was adopted in this thesis. Firstly, a certain amount of Si-Ti composite film and wood powder were scraped and ground through a 100-mesh sieve, then dried to adiabatic conditions. They were mixed with KBr at a volume ratio of 1:100 and pressed into transparent circular thin films using a pressing machine. Afterwards, the chemical structure of SiO2 and TiO2 in the composite film and their combination with the wood surface were analyzed by measuring the infrared spectra using a Nicolet iS 50 FTIR spectrometer (Anton Paar GmbH, Graz, Austria). The scanning range was 4000~400 cm−1 and the number of scans was 32 times.
2.4.2. Crystal Structure
A DX-2700A high power (4 kW) polycrystalline X-ray diffractometer was used to analyze the crystallinity and crystal structure of SiO2 and TiO2 in silicon and titanium composite film on the surface of wood. The X-ray source used was a metal body ceramic insulated Cu target with a rated output power of 4 kW, and step measurement was adopted with a scanning range of 10°~70° and a step angle of 0.02°.
2.4.3. Wettability of Wood Surface
The static contact angle of distilled water on the surface of wood was determined using a DSA100E Kreuz Contact Angle Measuring Instrument (KRüSS Ltd., Hamburg, Germany) with a droplet volume of 5 μL. The contact angle value of a water droplet remaining on the wood surface for 10 s was measured at a test temperature of 20 ± 1 °C and a relative humidity of 65 ± 3%. Five points were tested for each sample, and three samples were tested for each treatment. The final average value was taken as the contact angle measurement for the wood surface. Finally, the results of the one-factor experiments on hydrophobicity of modified wood were analyzed using ANOVA to discuss the significance of the effects of the four factors on the surface contact angle of the modified wood, and the degree of difference in the effects between levels was compared by Fisher’s least significant difference (LSD) test.
2.4.4. Photocatalytic Properties of Wood Surfaces
In this experiment, the photocatalytic activity of the obtained wood samples was evaluated through the degradation of rhodamine B aqueous solution using photocatalysis. Figure 1 shows the standard curve depicting the variation in absorbance of rhodamine B aqueous solution with concentration.
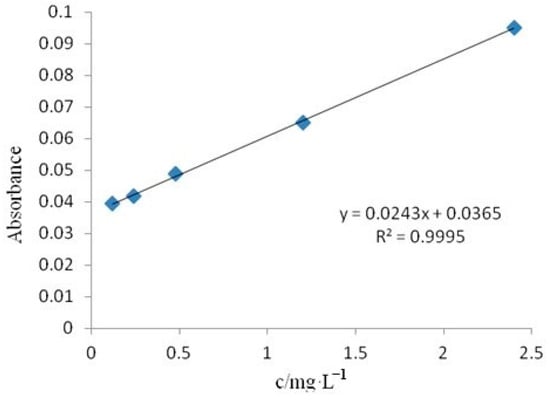
Figure 1.
The standard curve of Rhodamine B aqueous solution.
Using a 30 W UV lamp with a wavelength of 254 nm as the light source, a wood sample loaded with a Si-Ti composite membrane was immersed in 30 mL of a 10 mg/L solution of rhodamine B. It was left in the dark for 30 min to reach adsorption equilibrium, and the concentration of rhodamine B was measured as the initial concentration C0. Then, the lamp was turned on, and the surface of the wood with the composite film was placed vertically against the light source. The effective area of the wood sample was 40 mm × 40 mm, located at a distance of 10 cm from the center of the light source, and maintained at a reaction temperature between 20 and 30 °C. The total illumination time lasted for 180 min, during which samples were taken every 30 min. The absorbance at 554 nm was measured using a fully automated full-wavelength enzyme labeling instrument and converted to concentration C in order to calculate the percentage degradation rate of rhodamine B [,]. Untreated wood served as blank control group (CK). The decolorization rate D can be calculated as follows:
3. Results and Discussion
3.1. Effect of Titanium–Alcohol Molar Ratio on the Structure and Properties of Si-Ti Composite Film on Wood Surface
The infrared spectra of wood specimens with different molar ratios of TBOT to EtOH are shown in Figure 2. The modified specimen exhibited a new peak compared to CK, as depicted in the figure. The broad peak near 3417 cm−1 corresponded to the stretching vibration of -OH groups originating from wood cellulose and generated through the hydrolysis of TBOT and VETS during the reaction process. Notably, the intensity of this vibrational peak decreased with increasing ethanol dosage. The peaks observed within the range of 2981 cm−1–2829 cm−1 represented stretching vibrations of C-H bonds in -CH3 and -CH2-, which could be attributed to cellulose, TBOT, as well as EtOH. Additionally, these peaks might arise from cellulose and incompletely hydrolyzed residues present in TBOT and VETS. The peak around 1600 cm−1 likely indicated a stretching vibration associated with C=C bonds, while the vibrational band near 3052 cm−1 suggested a stretching vibration related to C-H bonds in -CH=CH2 groups. Furthermore, the vibrational feature near 1272 cm−1 may represent a bending vibration of C-H bonds in -CH=CH2 moieties. By considering these three vibrational bands at 1600 cm−1, 3052 cm−1, and 1272 cm−1 collectively, it can be hypothesized that -CH=CH2 groups from VTES were successfully immobilized onto the wood surface. Moreover, the sharp peak centered around 1374 cm−1 was assigned to telescopic vibrations arising from -NO3 [], whereas another band near 1000 cm−1 may correspond to asymmetric telescopic vibrations associated with Si-O-Si linkages [,,]. Additionally, the peak at approximately 958 cm−1 suggests Ti-O-Si vibrations while another absorption band at around 782 cm−1 corresponds to Ti-O-Ti vibrations. Considering these three vibrational features located at approximately 1000 cm−1, 958 cm−1, and 782 cm−1, respectively, it can be inferred that both TiO2 and SiO2 were successfully loaded onto the wood surface forming bonded structures such as Ti-O-Si.
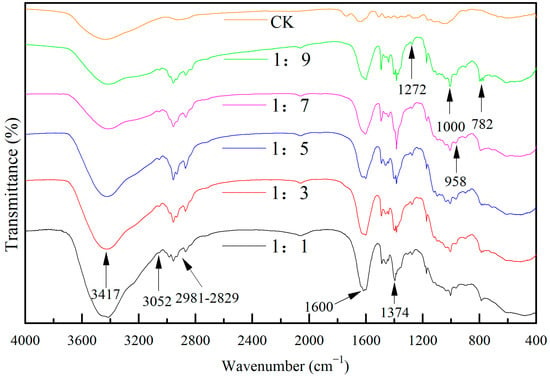
Figure 2.
The FTIR spectrum of Si-Ti composite film prepared at different ratios of n(TBOT) to n(EtOH).
The XRD patterns of Si-Ti composite films with varying molar ratios of TBOT to EtOH are presented in Figure 3. It is evident from the figure that different molar ratios did not influence the crystallization behavior of the Si-Ti composite film on the wood surface. Notably, a broad amorphous peak corresponding to SiO2 was observed at approximately 21° (2θ angle) [], while no characteristic diffraction peaks associated with TiO2 anatase or rutile phases were detected, indicating that both SiO2 and TiO2 existed in an amorphous state within the experimental conditions.

Figure 3.
The XRD spectrum of Si-Ti composite film prepared at different ratios of n(TBOT) to n(EtOH).
The contact angles of Si-Ti composite films prepared with different molar ratios of TBOT to EtOH are presented in Figure 4. It is evident from the figure that the modified test materials exhibited significantly increased contact angles, all above 110°, indicating a transition from hydrophilic to hydrophobic wettability on the modified wood surface. Within the range of n(TBOT) to n(EtOH) ratio between 1:1 and 1:9, it was observed that the contact angle tended to increase with higher ethanol dosage, reaching a maximum value of 118.6°. However, this increase was relatively small, with a marginal difference of only 6.5°. Ethanol played a crucial role as a re-reaction solvent and facilitated solute dispersion. Inadequate ethanol content resulted in non-uniform dispersion of TBOT and VTES, while excessive ethanol prolonged solute formation time due to its inhibitory effect on VTES silane hydrolysis as it is one of its hydrolysis products. Therefore, an optimal amount of ethanol proved beneficial for promoting the reaction process.
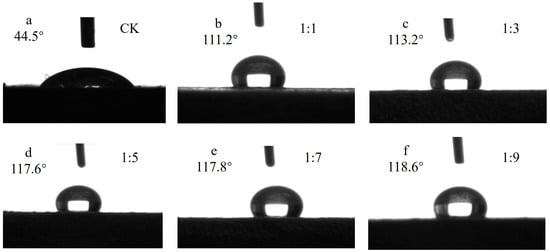
Figure 4.
The contact angle of Si-Ti composite film prepared at different ratios of n(TBOT) to n(EtOH).
In order to investigate the impact of TBOT on the wettability of Si-Ti composite films on wood surfaces, an analysis of variance (ANOVA) was conducted for different levels of molar ratio between TBOT and EtOH. The results are presented in Table 2. Based on the significance level values provided in the table, it is evident that the molar ratio of TBOT to EtOH has a highly significant effect on the wettability of Si-Ti composite films on wood surfaces. Subsequently, Fisher’s least significant difference (LSD) test was performed to compare the extent of variation among different levels, and these outcomes are illustrated in Figure 5. According to multiple comparisons using Fisher LSD test, there exists a highly significant difference between n(TBOT)/n(EtOH) ratios at 1:1 and those at 1:5, 1:7, and 1:9; meanwhile, a significant difference can be observed between n(TBOT)/n(EtOH) ratios at 1:3 and those at 1:5, 1:7, and 1:9. No differences were detected among other levels.

Table 2.
The variance analysis of wettability of Si-Ti composite film on wood surface prepared at different ratios of n(TBOT) to n(EtOH).
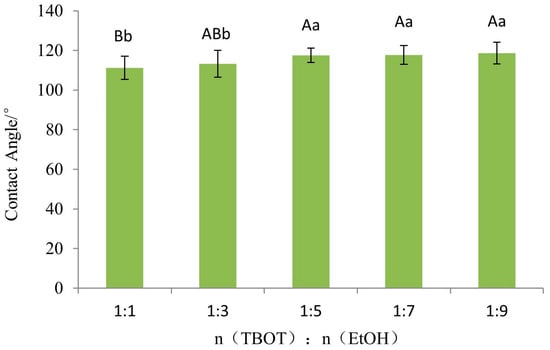
Figure 5.
The Fisher LSD multiple comparison of wettability of Si-Ti composite film prepared at different ratios of n(TBOT) to n(EtOH). Note: The lowercase and uppercase letters indicate the significance at p < 0.05, p < 0.01, respectively. The error bars show the mean ± standard deviation.
Figure 6 illustrates the decolorization curves of rhodamine B on a Si-Ti composite membrane over time under varying molar ratios of TBOT to EtOH. From the figure, it is evident that the decolorization of rhodamine B on the Si-Ti composite membrane initially increased and then decreased with an increase in ethanol dosage. The highest decolorization rate observed was 47.4% when the molar ratio of TBOT to EtOH was 1:5. XRD results indicated that TiO2 loaded onto the wood surface did not crystallize under these reaction conditions, which primarily accounted for its low phase catalytic activity. The ethanol dosage influenced both the hydrolysis reaction rate and cross-linking of hydrolyzed monomers. When ethanol dosage was low, rapid hydrolysis increased chances of cross-linking among hydrolyzed monomers, accelerating polymerization reactions and facilitating agglomeration of TiO2 particles generated by this process. Conversely, higher ethanol dosages resulted in slower rates for both hydrolysis and polymerization reactions, leading to reduced TiO2 particle size and subsequently affecting its photocatalytic activity [].
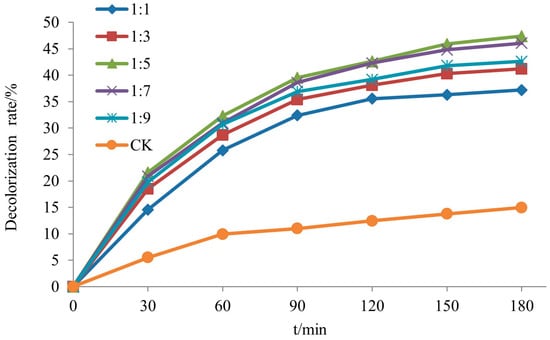
Figure 6.
The decolorization rate of RhB of Si-Ti composite film prepared at different ratios of n(TBOT) to n(EtOH).
3.2. Effect of Titanium–Silicon Molar Ratio on the Structure and Properties of Silicon and Titanium Composite Films on Wood Surfaces
Figure 7 shows the IR spectra of wood specimens with different molar ratios of TBOT to VTES. From the figure, it can be seen that the broad blunt peak near 3400 cm−1 was the stretching vibration peak of -OH. The intensity of the -OH vibration peaks decreased and then increased with the increase in the dosage of VTES. The peaks appearing in the range of 2990 cm−1 to 2830 cm−1 were the C-H expansion vibration peaks in -CH3, -CH2-, which may come from lignocellulose and the residual portion of TBOT and VETS in incomplete hydrolysis, but the intensity of the vibration peaks was weak, which demonstrated that the residual dosage of -CH3, -CH2- was very small in the re-reaction and the hydrolysis reaction was relatively complete. The peak near 1594 cm−1 may be the stretching vibration peak of C=C, while the peaks at 3056 cm−1 and 1276 cm−1 may be the deformation vibration peak of C-H in -CH=CH2 detected from the samples with ratio of n(TBOT) to n(VETS) at 1:0.6 and 1:0.4, and the intensity of the three vibration peaks was enhanced with the increase in the dosage of VETS. The sharp peak appearing near 1382 cm−1 was the telescopic vibrational peak of -NO3. The peak near 1130 cm−1 may be the asymmetric telescopic vibrational peak of Si-O-Si [,], and the intensity of the vibrational peaks increased with the increase in the content of VETS, which indicated that the more the surface of the wood is loaded with SiO2. The peaks near 760 cm−1, 640 cm−1, 534 cm−1, and 437 cm−1 may be the Ti-O-Ti telescopic vibrational peaks [,,], and the intensity of the Ti-O-Ti telescopic vibrational peaks enhanced with the increase in the dosage of VETS, which was hypothesized that the increase in the dosage of generated SiO2 promoted the generation of TiO2. Meanwhile, the peaks detected near 962 cm−1 may be the vibrational peaks of Ti-O-Si, and the vibrational intensities are all enhanced with the increase in VETS content.
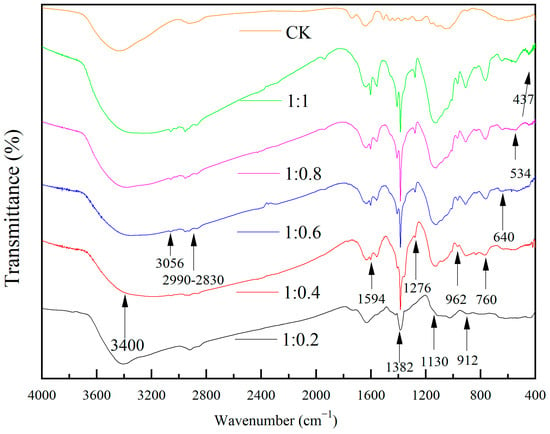
Figure 7.
The FTIR spectrum of Si-Ti composite film prepared at different ratios of n(TBOT) to n(VETS).
Figure 8 shows the XRD patterns of wood specimens with different molar ratios of TBOT to VTES. From the figure, it can be seen that the crystalline structure of TiO2 in the Si-Ti composite film on the surface of wood was mainly anatase when the ratio of n(TBOT) to n(VETS) was 1:0.2. With the increase in the dosage of VTES, the crystalline structure of TiO2 was gradually changed from anatase to rutile, and it was hypothesized that SiO2 promoted the transformation of TiO2 from anatase to rutile. The relative content of these two phases can be calculated from the quantitative formula [] (2), and the results are shown in Table 3.
where IA and IR were the relative intensities of the diffraction peaks of anatase (101) and rutile (110) crystal faces, respectively, and XR denoted the mass percentage of the rutile phase. The grain sizes of the TiO2 anatase (101) and rutile (110) crystal faces were calculated by Scherrer’s formula [] (3), and the results are shown in Table 3.
where D denotes the grain size; K was Scherrer’s constant, taken as 0.89; λ was the X-ray wavelength, taken as 0.154056; and β was the half peak width at 2θ.
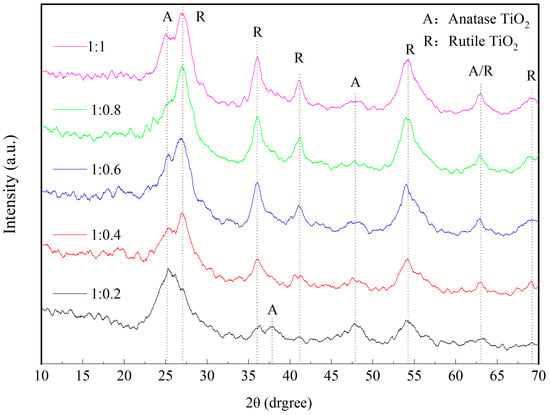
Figure 8.
The XRD spectrum of Si-Ti composite film prepared at different ratios of n(TBOT) to n(VETS).

Table 3.
The crystalline phase and crystal particle size of Si-Ti composite film prepared at different ratios of n(TBOT) to n(VETS).
As shown in Table 3, the grain size of anatase TiO2 decreased with the increase in the ratio of n(TBOT) to n(VETS), while the grain size of rutile phase increases instead, and it was hypothesized that SiO2 inhibits the growth of anatase TiO2 grains in the composite film and promoted the growth of rutile phase TiO2. The forbidden band width of anatase TiO2 is 3.2 eV, while that of rutile was 3.0 eV, so the electron-hole of anatase TiO2 had a more positive or more negative potential. In addition, anatase had a higher oxidizing ability, and also its ability to adsorb H2O and O2 was stronger than that of rutile TiO2, so it had a higher photocatalytic activity. And, when the ratio of anatase to rutile was in the range of (7~8): (3~2), the mixed crystals had higher photocatalytic activity than pure anatase TiO2 []. Moreover, as the ratio of n(TBOT) to n(VETS) increased, the mass fraction of rutile phase was above 40%, which was lower than the photocatalytic activity of pure anatase, suggesting that the increase in SiO2 would reduce the photocatalytic activity of Si-Ti composite film on the surface of the wood, which was consistent with the results of photocatalytic degradation of rhodamine B.
Figure 9 illustrates the contact angles of Si-Ti composite films prepared with varying molar ratios of TBOT to VTES. As depicted in the figure, the modified test materials exhibited significantly increased contact angles compared to the control group, all exceeding 110°, indicating a shift from hydrophilic to hydrophobic on wood surfaces. The contact angle of silicon and titanium composite film on wood surfaces displayed an increasing trend followed by a decreasing trend as the molar ratio changed, which may be attributed to more -CH=CH2 replacing -OH on TiO2 and SiO2 particle surfaces with higher dosages of VTES resulting in increased contact angles. However, further increases in VTES dosage generated more SiO2 particles with -OH present on their surface leading to decreased contact angles. An analysis of variance (ANOVA) was conducted to investigate wettability effects between different levels of TBOT-to-VTES molar ratios for Si-Ti composite films on wood surfaces and the results are presented in Table 4.
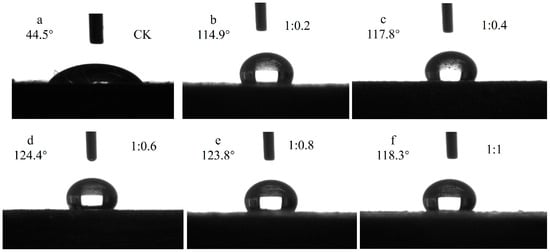
Figure 9.
The contact angle of Si-Ti composite film prepared at different ratios of n(TBOT) to n(VETS).

Table 4.
The variance analysis of wettability of Si-Ti composite film on wood prepared at different ratios of n(TBOT) to n(VETS).
The wettability of the Si-Ti composite film on the wood surface is significantly influenced by the titanium–silicon molar ratio, as is evident from Table 4. To compare the differences in effect between different levels, Fisher’s least significant difference (LSD) test was conducted and the results are presented in Figure 10. According to Fisher LSD multiple comparisons, both ratios of n(TBOT) to n(VETS) at 1:0.6 and 1:0.8 exhibited highly significant differences compared to molar ratios of 1:1, 1:0.4, and 1:0.2. Furthermore, the ratio of n(TBOT) to n(VETS) at 1:1 showed a significant difference from that at 1:0.2; however, no significant difference was observed among other levels.
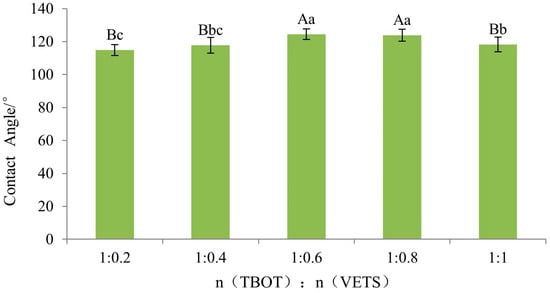
Figure 10.
The Fisher LSD multiple comparison of Si-Ti composite film prepared at different ratios of n(TBOT) to n(VETS). Note: The lowercase and uppercase letters indicate the significance at p < 0.05, p < 0.01, respectively. The error bars show the mean ± standard deviation.
The decolorization rate of rhodamine B by the Si-Ti composite membrane with different molar ratios of TBOT to VTES as a function of time is presented in Figure 11. It can be observed from the figure that the decolorization rate decreases with an increase in VTES, exhibiting values of 94.7%, 82.1%, 71.7%, 63.4%, and 59.6% in ascending order of VTES concentration. XRD analysis reveals that the increased presence of SiO2 promotes the transformation of TiO2 from anatase to rutile phase, resulting in a decrease in photocatalytic activity on the wood surface due to lower efficiency exhibited by rutile phase TiO2 compared to anatase phase.
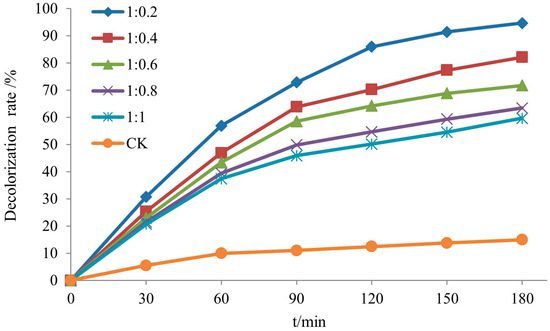
Figure 11.
The decolorization rate of RhB of Si-Ti composite film prepared at different ratios of n(TBOT) to n(VETS).
3.3. Effect of Titanium–Acid Molar Ratio on the Structure and Properties of Silicon and Titanium Composite Films on Wood Surfaces
Figure 12 shows the IR spectra of wood specimens with different molar ratios of TBOT to nitric acid. It can be seen that the broad blunt peak near 3415 cm−1 was the stretching vibration peak of -OH, the peaks in the range of 2983 cm−1–2827 cm−1 were the stretching vibration peaks of C-H in -CH3, -CH2-, and the peaks near 1598 cm−1 may be the stretching vibration peaks of C=C, the peaks near 3062 cm−1 and the peaks near 1274 cm−1 may be the stretching vibration peaks of C-H in -CH=CH2. The peaks appearing at 1370 cm−1 and 1390 cm−1 with similar intensities were the bending vibration peaks of -CH3, and with the increase in nitric acid dosage, the sharp telescopic vibration peaks of -NO3 appeared at 1380 cm−1 and gradually strengthened. It was presumed that the higher the dosage of nitric acid was, the more residual -NO3 remained on the surface of the wood specimen. The peaks near 1004 cm−1 and 1124 cm−1 were probably the Si-O-Si asymmetric telescoping vibration peaks, and the intensity of the vibration peak at 1124 cm−1 increased with the increase in the nitric acid content, which was hypothesized to promote the formation of SiO2. The vibration peak at 781 cm−1 may be the Ti-O-Ti telescopic vibration peak, and with the increase in nitric acid dosage, it gradually moved to the low frequency of 568 cm−1, and the intensity was enhanced, so it was presumed that nitric acid can promote the generation of TiO2. At the same time, the vibrational peaks that may be Ti-O-Si were detected near 960 cm−1.
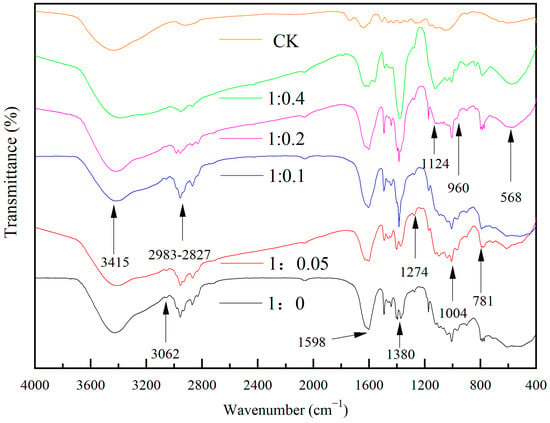
Figure 12.
The FTIR spectrum of Si-Ti composite film prepared at different ratios of n(TBOT) to n(HNO3).
The XRD patterns of wood specimens with different molar ratios of TBOT to nitric acid are presented in Figure 13. As depicted in the figure, a broad amorphous peak corresponding to SiO2 is observed around 21° for all specimens. Notably, when the ratio of n(TBOT) to n(HNO3) is 1:0.2 and 1:0.4, anatase TiO2 exhibits a characteristic peak near 48°, with the latter also displaying the main characteristic peak at 25.281°, indicating successful generation of anatase TiO2 within the Si-Ti composite film on the wood surface. These findings further underscore that nitric acid plays a crucial role in determining whether or not crystallization of generated TiO2 occurs.
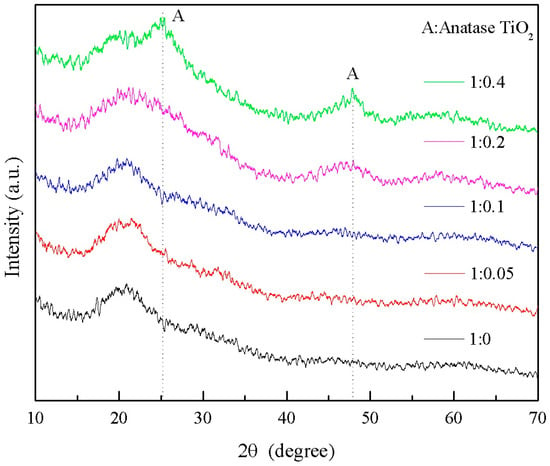
Figure 13.
The XRD spectrum of Si-Ti composite film prepared at different ratios of n(TBOT) to n(HNO3).
The contact angles for different molar ratios of titanate to nitric acid are presented in Figure 14. As depicted in the figure, the modified treated wood surface exhibited a significant increase in contact angle compared to the control group, indicating a transition from hydrophilic to hydrophobic behavior. With an increase in nitric acid concentration, the contact angle initially increased and then decreased, reaching its maximum value (129°) at a ratio of n(TBOT) to n(HNO3) of 1:0.2. To investigate the impact of TBOT and nitric acid at various molar ratios on the wettability of Si-Ti composite film on wood surfaces, an analysis of variance (ANOVA) was conducted and is summarized in Table 5.
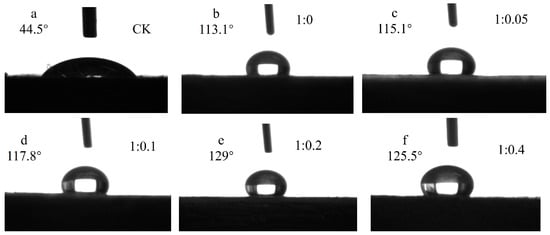
Figure 14.
The contact angle of Si-Ti composite film prepared at different ratios of n(TBOT) to n(HNO3).

Table 5.
The variance analysis of wettability of Si-Ti composite film on wood prepared at different ratios of n(TBOT) to n(HNO3).
The impact of the titanate molar ratio on the wettability of Si-Ti composite film on wood surface is highly significant, as indicated in Table 5. To compare the degree of difference between levels, Fisher’s least significant difference (LSD) test was conducted and results are presented in Figure 15. According to Fisher’s LSD multiple comparisons, there was a significant difference between n(TBOT) to n(HNO3) ratios at 1:0.2 and 1:0.4, with both showing highly significant differences from molar ratios of 1:0.1, 1:0.05, and 1:0. Additionally, there was also a highly significant difference between molar ratios of 1:0.1 and 1:0 while no differences were observed among other levels.
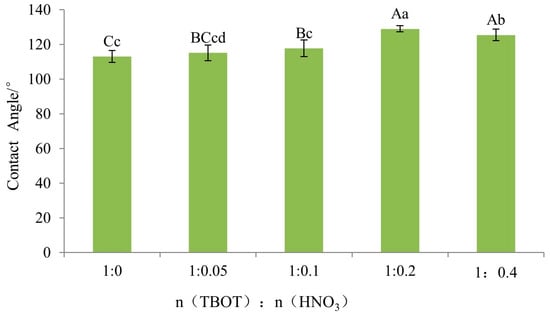
Figure 15.
The Fisher LSD multiple comparison of wettability of Si-Ti composite film prepared at different ratios of n(TBOT) to n(HNO3). Note: The lowercase and uppercase letters indicate the significance at p < 0.05, p < 0.01, respectively. The error bars show the mean ± standard deviation.
The decolorization rate of rhodamine B by Si-Ti composite membrane with different molar ratios of benzyl titanate to nitric acid over time is presented in Figure 16. As depicted in the figure, the decolorization rate of rhodamine B exhibited an increasing trend with higher dosages of nitric acid, namely 39.5%, 47.3%, 52.1%, 55.2%, and 61.4%. Furthermore, XRD analysis results indicated that as the dosage of nitric acid increased, the crystal structure of TiO2 generated during the reaction transitioned into anatase phase, thereby enhancing the photocatalytic activity of the Si-Ti composite film on wood surfaces.
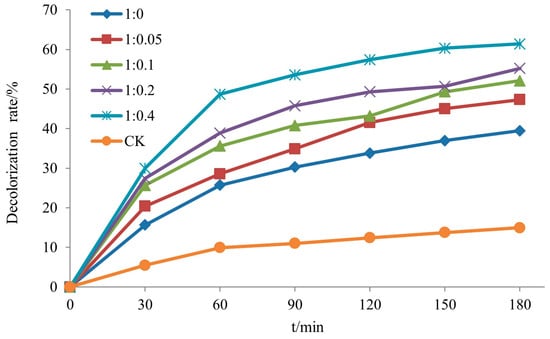
Figure 16.
The decolorization rate of RhB of Si-Ti composite film prepared at different ratios of n(TBOT) to n(HNO3).
3.4. Effect of Drying Temperature on the Structure and Properties of Si-Ti Composite Film on Wood Surface
Figure 17 shows the infrared spectra of wood specimens with different drying temperatures. From the figure, it can be seen that the broad and blunt peak near 3400 cm−1 is the expansion and vibration peak of -OH, and the intensity of the vibration peak decreases with the increase in drying temperature. The 2983 cm−1–2829 cm−1 range of peaks indicate -CH3, -CH2- in the expansion and vibration of C-H peaks. The peak near 1600 cm−1 may be the telescopic vibrational peak of C=C, the peak near 3058 cm−1 may be the telescopic vibrational peak of C-H in -CH=CH2, and the peak near 1274 cm−1 may be the deformation vibrational peak of C-H in -CH=CH2. The peak near 1382 cm−1 may be the telescopic vibrational peak of -NO3. The peak near 1004 cm−1 may be the asymmetric telescopic vibrational peak of Si-O-Si, while the peak detected near 782 cm−1 may be the telescopic vibrational peak of Ti-O-Ti. Meanwhile, the peak detected near 964 cm−1 may be the vibrational peak of Ti-O-Si. With the appearance of Si-O-Si, Ti-O-Ti, and Ti-O-Si, it can be hypothesized that the surface of the wood has been loaded with TiO2 and SiO2, and bonded together with Ti-O-Si.
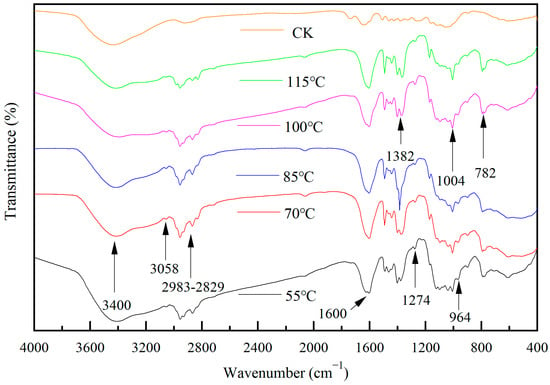
Figure 17.
The FTIR spectrum of Si-Ti composite film prepared at different drying temperatures.
The XRD patterns of wood specimens with different drying temperatures are presented in Figure 18. Generally, achieving high crystallinity in TiO2 necessitates high-temperature calcination. However, due to the risk of carbonization or combustion and potential damage to the wood, the drying temperature can only be selected within a range suitable for wood-drying purposes. As depicted in Figure 18, variations in drying temperatures did not induce changes in the crystallization of Si-Ti composite film on the wood surface. Notably, amorphous broad peaks of SiO2 were observed near 21° [], while characteristic diffraction peaks corresponding to TiO2 anatase or rutile phases were absent. This suggests that under these experimental conditions, both SiO2 and TiO2 present in the Si-Ti composite film on the wood surface exist in an amorphous state.
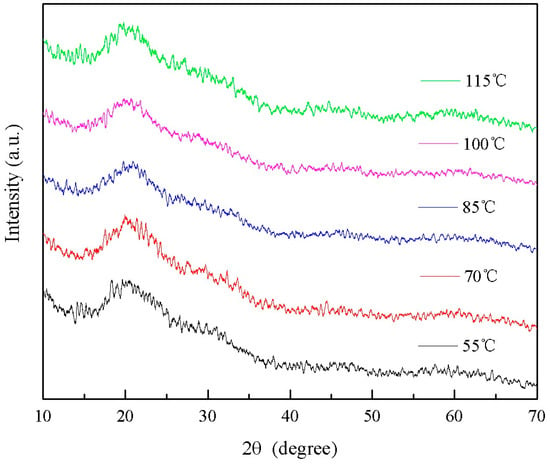
Figure 18.
The XRD spectrum of Si-Ti composite film prepared at different drying temperatures.
The contact angle of the silicon–titanium composite film at different drying temperatures is presented in Figure 19. As depicted, compared to the control group, the contact angle on the wood surface exhibited a significant increase, surpassing 100° and indicating a certain level of hydrophobicity achieved through wood surface modification. Moreover, it was observed that the contact angle increased with higher drying temperatures, reaching up to 127.3°. This suggests that elevated drying temperatures contribute to enhancing the hydrophobic properties of the silica–titanium composite film on wood surfaces. Based on FTIR analysis results, it can be hypothesized that a reduction in -OH groups present on the Si-Ti composite film’s surface may have contributed to its enhanced hydrophobicity.
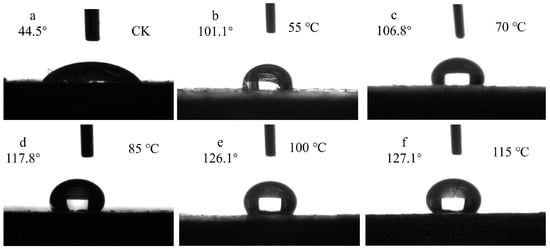
Figure 19.
The contact angle of Si-Ti composite film prepared at different drying temperatures.
In order to investigate the effect of different drying temperatures on the wettability of Si-Ti composite film on the surface of wood between different levels of molar ratio of titanate to EtOH, an analysis of variance (ANOVA) was performed, and the results are shown in Table 6.

Table 6.
The variance analysis of wettability of Si-Ti composite film on wood prepared at different drying temperatures.
The influence of drying temperature on the wettability of the Si-Ti composite film on wood surfaces is found to be highly significant, as indicated in Table 6. To assess the differences between levels, Fisher’s least significant difference (LSD) test was conducted and the results are presented in Figure 20. According to Fisher LSD multiple comparisons, there is no statistically significant distinction between drying temperatures of 100 °C and 115 °C; however, both exhibits significantly different effects compared to drying temperatures of 85 °C, 70 °C, and 55 °C. Furthermore, these three levels demonstrate highly significant differences among themselves.
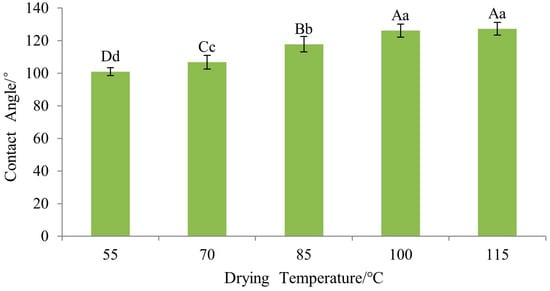
Figure 20.
The Fisher LSD multiple comparison of Si-Ti composite film prepared at different drying temperatures. Note: The lowercase and uppercase letters indicate the significance at p < 0.05, p < 0.01, respectively. The error bars show the mean ± standard deviation.
The decolorization rate of rhodamine B by the Si-Ti composite membrane at different drying temperatures is depicted in Figure 21. It can be observed that the decolorization rate slightly increased as the drying temperature rose from 55 °C to 100 °C, with values of 47.2%, 46.1%, 45.7%, and 44.9%, respectively, in ascending order. However, a significant drop occurred when the drying temperature reached 115 °C, resulting in a decolorization rate of only 34.9%. This decline could potentially be attributed to a reduction in surface -OH groups on the silica–titanium composite membrane, leading to diminished photocatalytic activity.
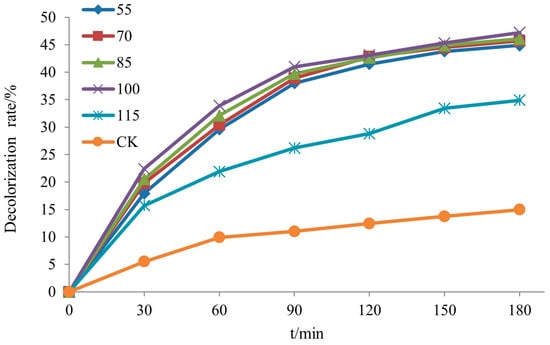
Figure 21.
The decolorization rate of RhB of Si-Ti composite film prepared at different drying temperatures.
3.5. Preparation Process Optimization Results Analysis
Orthogonal tests were conducted using the contact angle size of Si-Ti composite film on the wood surface and its decolorization rate for photocatalytic degradation of rhodamine B under UV light as indicators, and the results are shown in Table 7 and Table 8, respectively.

Table 7.
The orthogonal test results of contact angle.

Table 8.
The orthogonal test results of photocatalytic activity.
The calculation results from the above table reveal that the size of the contact angle of silicon titanium composite film on the surface of wood is influenced by various factors in the order of their polar differences, namely D > C > B > A. Notably, among these factors, drying temperature exhibits the most significant impact.
The calculation results from the aforementioned table reveal that the factors influencing the photocatalytic degradation and rhodamine B decolorization rate of Si-Ti composite film on wood surface follow the order of polar deviation magnitude: C > B > A > D. Among these factors, the molar ratio of TBOT to nitric acid exhibits the most significant effect, followed by the molar ratio of TBOT to VTES, then the molar ratio of TBOT to EtOH; whereas drying temperature has a comparatively lesser impact.
Based on the results of orthogonal tests on contact angle and photocatalytic properties, and with the aim of simultaneously achieving enhanced hydrophobicity and photocatalytic activity, we optimized the process by selecting molar ratios of TBOT to EtOH (1:5), TBOT to VTES (1:0.2), TBOT to nitric acid (1:0.5), and a drying temperature of 100 °C. The surface contact angle of the modified wood prepared by this optimized process was 125.9°, and its hydrophobicity without deep superhydrophobic modification was better than that reported in the literature []. Meanwhile, the wood showed 94% decolorization of rhodamine B within 180 min under UV irradiation.
4. Conclusions
In this paper, Si-Ti composite film on wood surface was prepared by the sol–gel method; the effects of different factors on the chemical groups, crystal structure, wettability, and photocatalytic activity of Si-Ti composite film were investigated; and the optimized treatment process was derived by orthogonal test. The infrared spectra showed that Ti-O-Ti, Si-O-Si, and Ti-O-Si absorption peaks appeared in the modified wood, which were enhanced with the increase in VETS and nitric acid, and it was presumed that TiO2 and SiO2 were successfully loaded on the wood surface. In addition, the surface of wood loaded with Si-Ti composite film changed from hydrophilic to hydrophobic with highly significant differences among the factors, and the contact angle increased with the increase in ethanol dosage and drying temperature and showed a tendency to increase firstly and then decrease with the increase in the dosage of VTES and nitric acid. Furthermore, the dosage of nitric acid and VTES had a greater effect on the photocatalytic activity of Si-Ti composite films on wood surface; the former affected the photocatalytic activity of Si-Ti composite films by influencing the crystallinity of TiO2, and the latter influenced the crystalline phase and grain size of TiO2 through the generation of SiO2, which in turn affects the photocatalytic activity of Si-Ti composite films. Finally, based on the results of orthogonal tests, considering the hydrophobicity and photocatalytic properties, the titanium–alcohol ratio of 1:5, titanium–silicon ratio of 1:0.2, titanium–acid ratio of 1:0.5, and the drying temperature of 100 °C were selected as the optimized process. The surface contact angle of the modified wood prepared under this optimized process was 125.9°, which is better than the previous studies, and the decolorization rate of rhodamine B under UV light reached 94% within 180 min. In order to further determine the practical application value of wood loaded with silica–titanium composite membranes, long-term durability tests, such as weathering and mechanical stress assessments, will be conducted in our future work.
Author Contributions
Z.L. and P.W. conceived and designed the experiments; S.C. and Q.L. drafted the manuscript; Y.F. and S.C. participated in data analysis; S.C. carried out the laboratory work. All authors have read and agreed to the published version of the manuscript.
Funding
The authors gratefully acknowledge financial support from the Special Fund of the National Natural Science Foundation of China (31560191) and Guangxi Forestry Science and Technology Promotion Program (gl2019kt02).
Data Availability Statement
Data are contained within the article.
Conflicts of Interest
The authors declare no conflict of interest.
References
- Kocaefe, D.; Huang, X.; Kocaefe, Y. Dimensional stabilization of wood. Curr. For. Rep. 2015, 1, 151–161. [Google Scholar] [CrossRef]
- Wei, S.; Tan, Z.; Liu, Z.; Zuo, H.; Xia, Y.; Zhang, Y. Removal of methyl orange dye by high surface area biomass activated carbon prepared from bamboo fibers. Ind. Crop. Prod. 2024, 218, 118991. [Google Scholar] [CrossRef]
- Xia, Y.; Zuo, H.; Lv, J.; Wei, S.; Yao, Y.; Liu, Z.; Lin, Q.; Yu, Y.; Yu, W.; Huang, Y. Preparation of multi-layered microcapsule-shaped activated biomass carbon with ultrahigh surface area from bamboo parenchyma cells for energy storage and cationic dyes removal. J. Clean. Prod. 2023, 396, 136517. [Google Scholar] [CrossRef]
- Jia, S.; Chen, H.; Luo, S.; Qing, Y.; Deng, S.; Yan, N.; Wu, Y. One-step approach to prepare superhydrophobic wood with enhanced mechanical and chemical durability: Driving of alkali. Appl. Surf. Sci. 2018, 455, 115–122. [Google Scholar] [CrossRef]
- Wang, X.Q.; Meng, J.W.; Cheng, Z.Y.; Guan, H. Research progress of durable superhydrophobic wood surface. J. For. Eng. 2020, 5, 13–20. [Google Scholar] [CrossRef]
- Da, S.; Meng, H.; Fan, X.; Zhao, Y.; Wang, Y.; Xiao, Z.; Wang, H.; Xie, Y. Superhydrophobic modification of wood by stearylated lignin composite coating. J. For. Eng. 2023, 8, 91–98. [Google Scholar] [CrossRef]
- Militz, H.; Lande, S. Challenges in wood modification technology on the way to practical applications. Wood Mater. Sci. Eng. 2009, 4, 23–29. [Google Scholar] [CrossRef]
- Liu, M.; Qing, Y.; Wu, Y.; Liang, J.; Luo, S. Facile fabrication of superhydrophobic surfaces on wood substrates via a one-step hydrothermal process. Appl. Surf. Sci. 2015, 330, 332–338. [Google Scholar] [CrossRef]
- Li, W.; Ni, X.; Zhang, X.; Lei, Y.; Guo, J.; Jin, J.; You, B. UV-NIR dual-responsive nanocomposite coatings with healable, superhydrophobic, and contaminant-resistant properties. ACS Appl. Mater. Inter. 2020, 12, 48101–48108. [Google Scholar] [CrossRef]
- Liu, Z.; Gan, L.; Cheng, S.; Fu, Y.; Wei, P. Hydrophobic modification of Bi2O3-doped Si-Ti composite film on a wood surface. Coatings 2024, 14, 371. [Google Scholar] [CrossRef]
- Wang, Y.; Yan, W.; Frey, M.; del Blanco, M.V.; Schubert, M.; Adobes-Vidal, M.; Cabane, E. Liquid-like SiO2-g-PDMS coatings on wood surfaces with underwater durability, antifouling, antismudge, and self-healing properties. Adv. Sustain. Syst. 2018, 3, 1800070. [Google Scholar] [CrossRef]
- Wang, Z.; Sun, Z.; Sun, D.; Zou, W.; Yu, M.; Yao, L. Thermally induced response self-healing superhydrophobic wood with self-cleaning and photocatalytic performance. Cellulose 2020, 29, 9407–9420. [Google Scholar] [CrossRef]
- Huang, J.; Lyu, S.; Fu, F.; Chang, H.; Wang, S. Preparation and superhydrophobic coating with excellent abrasion resistance and durability using nanofibrillated cellulose. RSC Adv. 2016, 6, 106194–106200. [Google Scholar] [CrossRef]
- Yang, Y.; He, H.; Li, Y.; Qiu, J. Using nanoimprint lithography to create robust, buoyant, superhydrophobic PVB/SiO2 coatings on wood surfaces inspired by red roses petal. Sci. Rep. 2019, 9, 9961. [Google Scholar] [CrossRef]
- Chen, H. Formation Mechanism and Construction of Organosilicon Hydrophobic/Superhydrophobic Coating on Chinese Fir Surface. Ph.D. Thesis, Fujian Agriculture and Forestry University, Fuzhou, China, August 2023. [Google Scholar]
- Wang, Z.; Han, X.; Pu, J. TiO2/graphene oxide and SiO2 nanocomposites based on poplar wood substrate under UV irradiation and negative oxygen ions generation. Bioresources 2019, 14, 1781–1793. [Google Scholar] [CrossRef]
- Liu, X.; Chen, S.; Fu, Y. Properties of Pinus yunnanensis modified with silicon-titanium binary oxides. Bioresources 2021, 16, 747–763. [Google Scholar] [CrossRef]
- Liao, S.X.; Zhang, P.; Li, K.; Sun, Q.F. In Situ Growth of hydrophobic TiO2 on Calocedrus macrolepis Kurz wood surface using a cosolvent-controlled hydrothermal method. Adv. Mater. Res. 2011, 150–151, 917–920. [Google Scholar]
- Wu, Y.; Jia, S.; Qing, Y.; Luo, S.; Liu, M. A versatile and efficient method to fabricate durable superhydrophobic surfaces on wood, lignocellulosic fiber, glass, and metal substrates. J. Mater. Chem. A 2016, 4, 14111–14121. [Google Scholar] [CrossRef]
- Chang, H.; Liu, S.; Wang, X.; Liu, J. Construction of hydrophobic nano-TiO2 on wood surface and analysis of its anti-photodiscoloration performance. J. Nanjing For. Univ. 2015, 39, 119–123. [Google Scholar] [CrossRef]
- Liu, S.; Xu, J.; Wang, X.; Chang, H.; Liu, J. Evaluation of surface hydrophobic performance of nano-TiO2 modified wood. China Wood Ind. 2014, 28, 28–31. [Google Scholar] [CrossRef]
- Xia, S.; Li, L.; Li, J. Research progress of anti-bacterium and degradation of formaldehyde by Nano-TiO2 photo-catalysis. Wood Process. Mach. 2007, 18, 36–40. [Google Scholar] [CrossRef]
- Wang, X.; Liu, S.; Chang, H.; Liu, J. Sol-gel deposition of TiO2 nanocoatings on wood surfaces with enhanced hydrophobicity and photostability. Wood Fiber Sci. 2014, 46, 109–117. [Google Scholar]
- Liu, Z.; Xu, J.; Cheng, S.; Qin, Z.; Fu, Y. Photocatalytic performance and kinetic studies of a wood surface loaded with Bi2O3-doped silicon–titanium composite film. Polymers 2023, 15, 25. [Google Scholar] [CrossRef] [PubMed]
- Hao, Z. Calculation and Measurement of the Vibration of Nitrate Ion. Master’s Thesis, Ocean University of China, Qingdao, China, 2011. [Google Scholar] [CrossRef]
- Lu, Y.; Feng, M.; Zhan, H. Preparation of SiO2–wood composites by an ultrasonic-assisted sol–gel technique. Cellulose 2014, 21, 4393–4403. [Google Scholar] [CrossRef]
- Lin, W.; Zhang, X.; Cai, Q.; Yang, W.; Chen, H. Dehydrogenation-driven assembly of transparent and durable superhydrophobic ORMOSIL coatings on cellulose-based substrates. Cellulose 2020, 27, 7805–7821. [Google Scholar] [CrossRef]
- Latthe, S.S.; Imai, H.; Ganesan, V.; Rao, A.V. Superhydrophobic silica films by sol–gel co-precursor method. Appl. Surf. Sci. 2009, 256, 217–222. [Google Scholar] [CrossRef]
- Li, Y.; Ma, J.; Wang, M. Study on preparation and properties of SiO2 high efficiency energy saving aerogel thermal insulation materials. J. Funct. Mater. 2024, 55, 7001–7007. [Google Scholar]
- Rodrigues, L.; Dias, C.; Ceragioli, H.; Rodas, A.; Monteiro, F.; Zavaglia, C.A. FTIR analysis and cytotoxicity test of titanium dioxide nanoparticles. Key Eng. Mater. 2012, 1463, 768–774. [Google Scholar] [CrossRef]
- Lv, Z.; Ma, Y.; Jia, S.; Qin, Y.; Li, L.; Chen, Y.; Wu, Y. Photocatalytic degradation of formaldhyde by TiO2/wood composites. J. Cent. South Univ. For. Technol. 2023, 43, 174–181. [Google Scholar] [CrossRef]
- Arconada, N.; Durán, A.; Suárez, S.; Portela, R.; Coronado, J.; Sánchez, B.; Castro, Y. Synthesis and photocatalytic properties of dense and porous TiO2-anatase thin films prepared by sol-gel. Appl. Catal. B Environ. Energy 2009, 86, 1–7. [Google Scholar] [CrossRef]
- Kim, C.-S.; Kwon, I.-M.; Moon, B.K.; Jeong, J.H.; Choi, B.-C.; Kim, J.H.; Choi, H.; Yi, S.S.; Yoo, D.-H.; Hong, K.-S.; et al. Synthesis and particle size effect on the phase transformation of nanocrystalline TiO2. Mater. Sci. Eng. C Mater. 2007, 27, 1343–1346. [Google Scholar] [CrossRef]
- Uvarov, V.; Popov, I. Metrological characterization of X-ray diffraction methods for determination of crystallite size in nano-scale materials. Mater. Charact. 2006, 58, 883–891. [Google Scholar] [CrossRef]
- Cui, X.; Shi, J.; Chen, S. Influence factors of TiO2 photocatalytic degradation of gaseous pollutants. Chem. Ind. Eng. Prog. 2013, 32, 2377–2386. [Google Scholar] [CrossRef]
- Gao, L.; Gan, W.; Xiao, S.; Zhan, X.; Li, J. A robust superhydrophobic antibacterial Ag–TiO2 composite film. Ceram. Int. 2016, 42, 2170–2179. [Google Scholar] [CrossRef]
Disclaimer/Publisher’s Note: The statements, opinions and data contained in all publications are solely those of the individual author(s) and contributor(s) and not of MDPI and/or the editor(s). MDPI and/or the editor(s) disclaim responsibility for any injury to people or property resulting from any ideas, methods, instructions or products referred to in the content. |
© 2024 by the authors. Licensee MDPI, Basel, Switzerland. This article is an open access article distributed under the terms and conditions of the Creative Commons Attribution (CC BY) license (https://creativecommons.org/licenses/by/4.0/).