Article

Improved Branch Volume Prediction of Multi-Stemmed Shrubs: Implications in Shrub Volume Inventory and Fuel Characterization

1
Chongqing Jinfo Mountain Karst Ecosystem National Observation and Research Station, School of Geographical Sciences, Southwest University, Chongqing 400715, China
2
College of Forestry and Biotechnology, Zhejiang A&F University, Hangzhou 311300, China
3
Faculty of Life Science and Technology, Central South University of Forestry and Technology, Changsha 410004, China
4
State Key Laboratory of Urban and Regional Ecology, Research Center for Eco-Environmental Sciences, Chinese Academy of Sciences, Beijing 100085, China
5
State Key Laboratory of Hydraulics and Mountain River Engineering, College of Water Resource and Hydropower, Sichuan University, Chengdu 610065, China
6
Institute of Resources and Environment, International Centre for Bamboo and Rattan, Key Laboratory of National Forestry and Grassland Administration/Beijing for Bamboo & Rattan Science and Technology, Beijing 100102, China
7
Fujian Academy of Forestry, Fuzhou 350012, China
8
National Observation and Research Station of Earth Critical Zone on the Loess Plateau in Shaanxi, Xi’an 710061, China
9
School of Resources and Environment, Southwest University, Chongqing 400715, China
10
Department of Earth, Environmental and Geographic Sciences, University of British Columbia (Okanagan), 1177 Research Road, Kelowna, BC V1V 1V7, Canada
*
Author to whom correspondence should be addressed.
These authors contributed equally to this work.
Forests 2024, 15(8), 1437; https://doi.org/10.3390/f15081437
Submission received: 20 July 2024 / Revised: 11 August 2024 / Accepted: 13 August 2024 / Published: 15 August 2024

Abstract

:
Accurately estimating the volume of woody vegetation is critical for assessing fuel characteristics and associated wildfire risks in shrublands. However, few studies have investigated the branch volume of multi-stemmed shrubs, a dominant life form in wildfire-prone drylands. This study predicts branch volume using the inflection point of branch diameter. This inflection point, identified using the “Segmented” package in R, marks the transition from a gradual decrease to a significant reduction in diameter along the stem. The volume of branch segment above this point is calculated as a cone, and below it, a cylinder. We validated this method on various species such as Caragana korshinskii, Salix psammophila, and Vitex negundo. Good estimations were achieved with an average 19.2% bias relative to reference branch volumes, outperforming conventional methods that subjectively treated the whole branch as either a cylinder (96.9% bias) or a cone (−34.4% bias). We tallied branches by basal diameter and provided inventories for easily locating the inflection point, as well as using two-way branch volume tables for rapid volume predictions in shrubland. In general, we developed an effective method for estimating branch volumes of multi-stemmed shrubs, enabling its application to larger-scale shrubland volumetric prediction. This advancement supports wildfire hazard assessment and informs decision-making in fuel treatments.

1. Introduction

Shrubland constitutes a main component of dryland biomes, distinguished by being one of the vegetation types most prone to fires. Its susceptibility to fire is determined by the unique structures of shrubs, such as their shape, size, and the organization of their multi-stemmed branches [1]. For instance, 265 km2 of dense shrublands in the United States were burnt within a single fire event in 1913 [2]. From 1975 to 1993, the shrublands took up the majority of burnt areas in northeastern Spain [3]. In the recent 2019–2020 Australian bushfire season, wildfires burned beyond 17,000 km2 of land, resulting in the deaths of 33 people and the loss of over a billion animals [4]. The increased frequency and magnitude of shrub-triggered wildfires, fueled by rising temperatures [5] and consequent droughts [6] and escalated by the growing human population, especially in the wildland–urban interface [7], necessitate a precise assessment of wildfire risk. This requires the accurate quantification of fuel flammability characterized by bulk density (i.e., the weight per unit volume) and the surface-area-to-volume ratio (i.e., the surface area per unit volume) [8]. Given the inverse relationship between volume-bounded bulk density and the intensity and rate of fire spread, and the positive effects of the surface-area-to-volume ratio on ignition time and combustion dynamics [9], fuel volume estimation centers precisely on quantifying fuel flammability. Moreover, given the increasing intensity and frequency of fires, particularly in water-stressed wildland–urban interfaces where more homes are being built among shrubs, it is crucial to include shrublands in fuel treatment and wildfire threat assessments for humans and their property, as well as for the natural resources [10].
Multi-stemmed shrubs, a dominant life form in drylands, present a challenge in volume estimation [11]. Conventionally, shrub volume has been calculated using the canopy area and height of individual shrubs [12], facilitating the prediction of the shrub biomass and fuel load [13]. While particularly for volume estimation at the stand scale, cutting-edge techniques such as Light Detection and Ranging (LiDAR) [14], terrestrial laser scanning [15], and Unmanned Aerial Vehicles (UAVs) [9] have been employed. Advances in sensors, modeling, and algorithms have significantly facilitated non-destructive methods for predicting volume and biomass at low cost and time requirements, despite still struggling to account for the variability in crown architecture and the complexities of species-rich understories [16]. Nevertheless, these approaches rarely address the accumulation of individual branch volumes to quantify the total volume of multi-stemmed shrubs. The mismatched scales greatly overestimate the fuel volume by including cubic meters of air within the canopy. The paucity of detailed information on branch volumes brings growing uncertainties in fuel management and the formulation of future climate policies [17]. This issue is particularly pressing considering the anticipated expansion of arid and semi-arid regions from approximately 40% [18] to 50% and 56% of the Earth’s surface by the end of the 21st century [19].
The most reliable volume prediction of woody frames can be obtained using water displacement techniques. This method is resistant to variations in stem form, yielding true volumes [20], albeit at the cost of extensive and laborious effort using xylometers. Consequently, previous studies have aimed at identifying an alternative method that is both precise and user-friendly. The Paracone method describes the geometrical form of a stem as being between a paraboloid and a cone [21], and predicts stem volume based on the diameter at a specific height along the stem. The Centroid method, developed as a modification of importance sampling, requires only one diameter of measurement at a specific height [22]. Both methods offer efficient predictions by typically considering the optimal relative height to be 30% of the total stem height [23].
Foresters and ecologists employ taper functions for predicting stem volume. These functions are physics-based and follow the branch shape [24], compared with the volume tables in forest inventory which neglects stem forms [25], and the conventional methods which over-simplify stem form as a cylinder or cone [26]. For instance, segmented taper models generally assumed the stem form as neiloid above the ground, conical at the tip, and paraboloid in between. However, the transition from one form to the next might be not as sharp as expected but continuous [27]. In contrast, the variable-exponent function, fitted as the “whole-bole system”, describes stem form with the single continuous polynomial based on empirical regression [28]. Nevertheless, this function is overwhelmingly data-driven, and quite variable with species and stem forms [29]. The alternative overlapping-bolts functions predict stem volume by aggregating the volumes of segmented bolts in various shapes, through different function calculations [30]. These functions yield good estimations, e.g., with relative differences of 3.96%–8.42%, 0.3%–1.7%, 3.75%, and 3.42% relative to water displacement volumes for Pinus elliottii [31], Pinus taeda [32], Abies cilicica, and Pinus brutia [33], respectively. Due to the scarcity of true stem volumes, the overlapping-bolts functions offer compatible estimates of stem volumes, that is, the reference volume.
Taper functions have rarely been used for multi-stemmed shrubs. This is partly due to their limited commercial values, similar to small-diameter trees [34], as forestry products, and the intensive labor required to measure complex basal ramification structures [11]. Additionally, the absence of standardized procedures for converting the measurements into model simulations has contributed to this lack [35]. Given the crucial link with fuel flammability, the largely unknown branch volume of multi-stemmed shrubs might leave wildfire risk assessments in the shrub-dominated arid regions with large uncertainty. Furthermore, by providing more information on the morphology and branch structure relative to the size and height of individual plants, the volume is of greater capability in providing an unbiased estimation of biomass (i.e., the fuel load) [36] and consequent carbon sequestration. Therefore, a standard procedure for measuring branch volume is greatly needed to accurately assess the fuel characteristics of multi-stemmed shrubs.
This study provides a standardized measurement for estimating the branch volume of multi-stemmed shrubs by referring to the established tree trunk volume estimations (e.g., the segmented bolts and volume tables). Via measuring branch diameter along the stem of individual branches (hereafter “branch diameter”) of dominant multi-stemmed shrubs on the semi-arid Loess Plateau in China, including Caragana korshinskii, Salix psammophila, and Vitex negundo, we introduce an improved method for volume prediction. Following the branch shape, this method automatically locates the inflection point of the branch diameter, enabling the division of the branch into a cone-shaped upper segment and a cylindric lower segment. This study specifically aims to (1) justify improved efficiency by addressing the inflection points of branch sizes, (2) validate increased accuracy over the conventional cylinder and cone methods, and (3) apply this method to build two-way volume tables and establish a future shrub volume inventory. Achieving these objectives could provide insights into developing standardized measurement procedures for predicting the branch volume of multi-stemmed shrubs, thus facilitating the analysis of fuel characteristics and serving our decision-making in wildfire prevention and climate policy formulation.

2. Materials and Methods

2.1. Study Sites and Experimental Species

This study was conducted at the Yangjuangou and Liudaogou (38°48′ N, 110°22′ E) catchments in the central Loess Plateau (Figure 1), the representative semi-arid regions of China. The Yangjuangou catchment covers an area of 2.1 km2, elevated between 1050 m and 1295 m above sea level. The mean annual precipitation (MAP) and mean air temperature (MAT) are 537 mm and 10 °C, based on data from 1961 to 2016 [37]. The soils are mainly Calcaric Cambisols, and a uniform soil texture was observed across the catchment [38]. The native shrub species, V. negundo, was measured in this catchment. Comparatively, the Liudaogou catchment expands over a larger area of 6.9 km2 and exhibits a similar altitude range of 1094 m to 1273 m. The climate here is comparatively drier and colder, with a MAP of 437 mm and a MAT of 8.9 °C (data from the period of 1973–2013) [39]. Ust-Sandiic Entisol and Aeolian sandy soil dominate this catchment [40]. The dominant shrub species of C. korshinskii and S. psammophila were measured in this catchment.
Caragana korshinskii, S. psammophila, and V. negundo are all deciduous and perennial shrubs characterized by multiple branches radiating from their bases. V. negundo, in particular, displays a unique self-organized pattern, forming distinctive clumped and scattered distributions [38] that result in both aggregated and isolated canopies (Figure 1). These species, due to their exceptional soil stabilization and drought resistance, are widely distributed across the arid and semi-arid regions in northwestern China. They produce a significant annual amount of litterfall by shedding leaves and twigs, making them susceptible to wildfire in water-stressed environments.

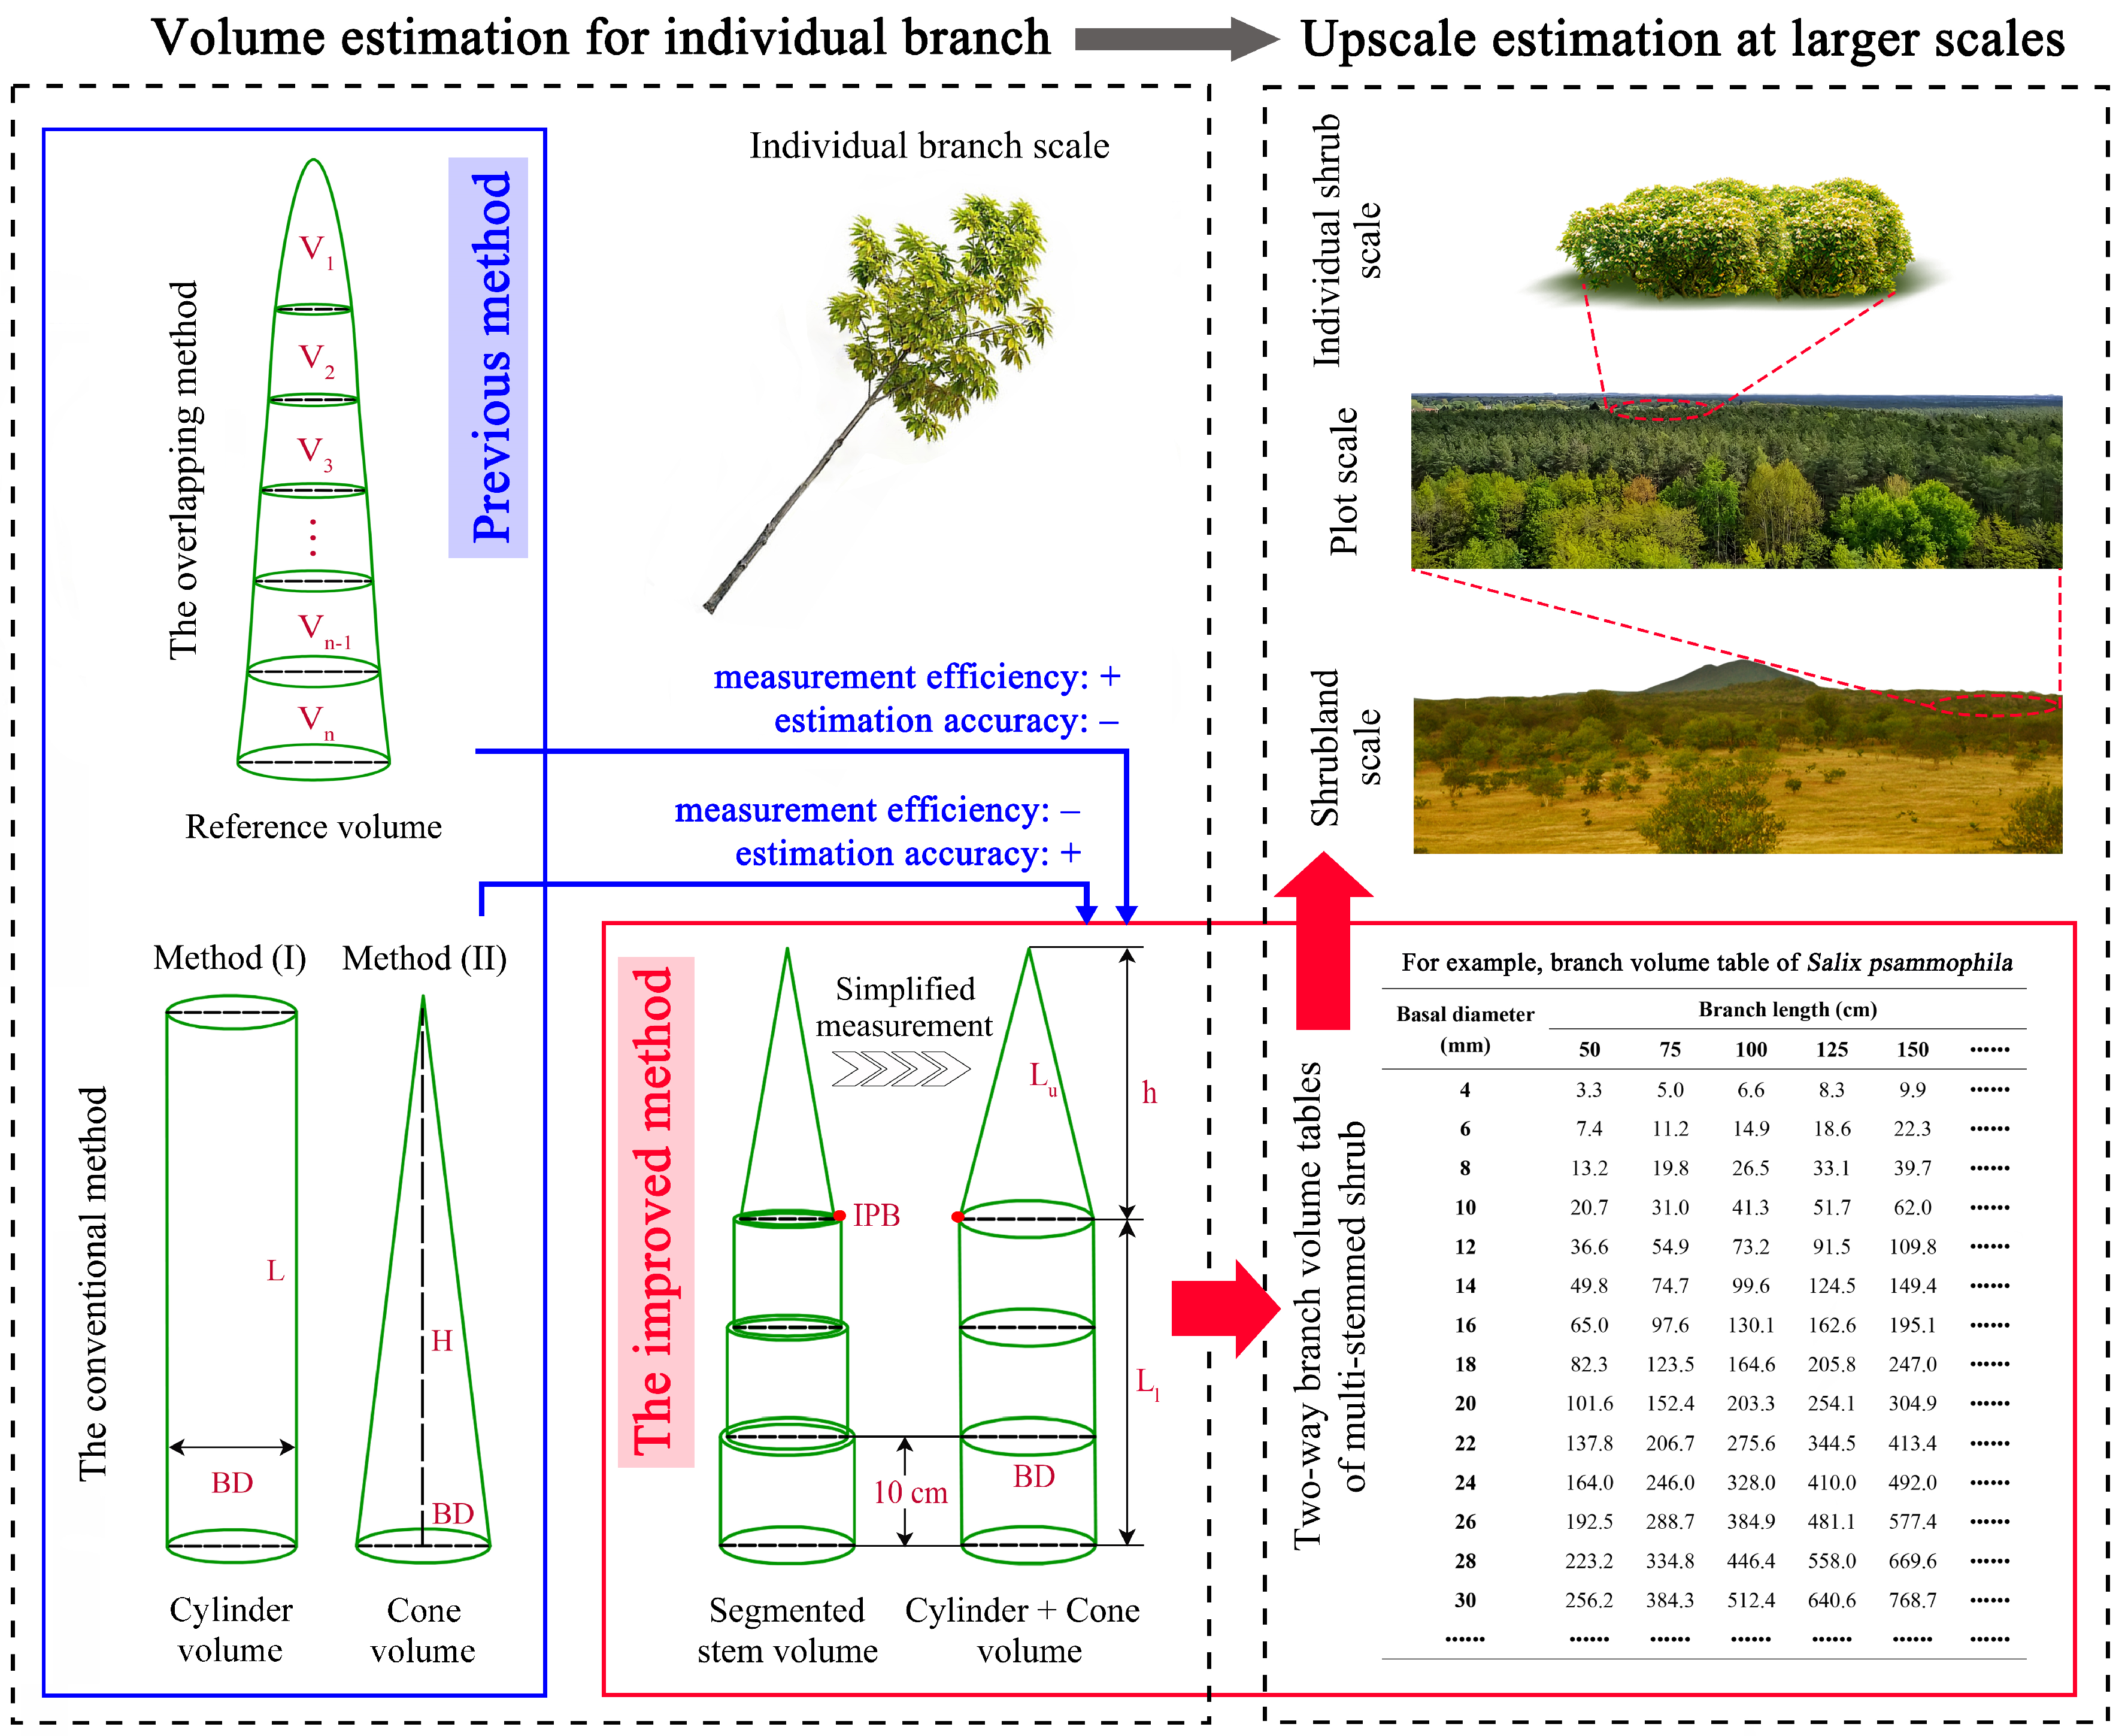
2.2. Methods of Estimating Branch Volume

A total of 163 branches were randomly selected to measure the branch length (BL, mm) using a measuring tape, the angle (BA, °) using a pocket geologic compass (Model DQL-8; Harbin Optical Instrument Factory, Harbin, China), and basal diameters (BD, mm, i.e., the branch diameter at 10 cm above the ground) using a vernier caliper (Model 7D-01150; Forgestar Inc., Tübingen, Germany), including 42, 53, and 68 branches of C. korshinskii, S. psammophila, and V. negundo, respectively. The experimental branches of V. negundo were further divided into two groups, scattered and clumped, with 35 and 33 branches, respectively. All experimental branches were then categorized based on their basal diameter into three groups, i.e., <10 mm, 10–20 mm, and >20 mm, respectively. Each group contained a minimum of five branches from each species.

2.2.1. Locating the Inflection Point of Branch Diameter

Branch diameters (D, mm) were determined as the average of two perpendicular diameters at the specific branch length (L, cm), taking measurements from the branch base to the tip at the interval of every 10 cm, and more frequently at every 5 cm for smaller branches under 5 mm in diameter. This measurement ceased when at least 75% of the branch’s length was measured due to their highly ramified twigs. Scatter plots of the relative diameter (D/BD, %) to relative length (L/BL, %) were drawn using the “LOESS” regression (smoothing factor 0.25) in R software (Figure 2), following the methodology of Bi (2000) [29]. This approach helped identify and remove any data anomalies caused by factors such as large knots, epicormic growth, or physical damage [41]. These anomalies accounted for 0.30%, 0.35%, and 1.42% of the total observations for C. korshinskii, S. psammophila, and V. negundo, respectively, and 1.09% and 1.80% for scattered and clumped V. negundo, respectively. Moreover, the relative diameter, signifying where the diameter’s mild decrease ends and significant shrinking begins along the stem, i.e., the inflection point of branch diameter (IPB, mm) (Figure 3), could be automatically located by inputting the data of scatter plot into R software by running “Segmented” package. The position of the IPB, identified in terms of scattered plots of relative diameter and relative length (Figure 2), was quantified as the distance above the ground along the stem, which was further determined as a percentage of branch length (PBL, %).

2.2.2. Predicting Branch Volume

The branch volume of multi-stemmed shrubs was predicted on the basis of the inflection point of branch diameter. Below this point, the volume of the lower segment ( V l ) was calculated as the cylinder (Equation (1)) (Figure 3), which indicated no significantly varied branch diameter along the stem (p > 0.05). For the upper segment above this point, the volume ( V u ) was computed in the form of a cone (Equation (2)), which had significantly decreased diameters along the stem (p < 0.05). The branch volume was finally predicted by adding the cylinder and cone volumes (hereafter referred to as the improved volume).
V l = π × B D 2 2 × L l / 100
V u = 1 3 × π × B D 2 2 × h / 100
where BD is the basal diameter (mm); V l (cm3) and L l (cm) are the volume and length of the cylindric lower segment, respectively; and V u (cm3) and h (cm) are the volume and height of the cone-shaped upper segment, respectively.

2.3. Methods of Validating Branch Volume

Given that the true branch volumes via water displacement techniques were rarely known, we followed the methodology of Bailey (1995) and He et al. (2021) to calculate the reference volume using the overlapping-bolts functions [30,41]. This method divided the branch into segmented bolts and estimated the branch volume by summing the volumes of all bolts (Figure 3). Specifically, the volume of the branch tip (i.e., the first bolt) was calculated as the cone (V1) (Equation (3)). We calculated the volume of the second bolt (V2) via Smalian’s equation (Equation (4)) [42], and the combined volumes of the second and third bolts (V2&3) via Newton’s equation (Equation (5)) [43]. Then, V3 could be computed, accordingly. These calculations via Newton’s formula were conducted iteratively, shifting one bolt down each time to determine the volume until all bolts had been accounted for (i.e., V3, …, Vn−1, and Vn). Finally, all the bolt volumes were summed to provide a reference volume, which was compatible with the true branch volume ( V t ) (Equations (6) and (7)) [44].
V 1 = 1 3 × π × d 1 2 2 × h 1 / 100
V 2 = L e × A 1 + A 2 2
V 2 & 3 = L e × A 1 + 4 A 2 + A 3 6
V i = V i 1 & i V i 1
V t = V 1 + V 2 + V 3 + , + V n
where d 1   (mm) and h 1 (cm) are the diameter and height of the first bolt; L e (cm) is the bolt length; A 1 , A 2 , and A 3 (cm2) are the cross-sectional areas of the bottom of the first, second, and third bolts, respectively; V i (cm3) is the volume of bolt i; V i 1 & i (cm3) is the volume of bolt i and bolt (i − 1); V n (cm3) is the butt bolt volume; and V t (cm3) is the true branch volume.
The validation of the improved method for estimating branch volume in multi-stemmed shrubs was performed by comparing the improved volume with the reference volume, as well as volumes derived through conventional cylinder and cone methods (Figure 3). This validation incorporated the median value and the interquartile range (IQR), in addition to goodness-of-fit metrics such as the coefficient of determination (R2), the relative difference (RD), and the root mean square error (RMSE) (Equations (8)–(10)) [45,46]. The precision of the estimation was indexed by a larger R2 and a p value of less than 0.05, along with smaller RD and RMSE values, indicating effectiveness and accuracy of the improved method.
R 2 = 1 i = 1 n y i y ^ i 2 / i = 1 n y i y ¯ 2
R D = y ^ i y i / y i × 100
R M S E = i = 1 n y i y ^ i 2 / n
where y i , y ^ i , and y ¯ are the measured, predicted and average values, respectively; n is the number of measurements.

2.4. Data Analysis

A local regression curve with a smoothing parameter of 0.25 was fitted using the “LOESS” function in R software [47], thus describing the decreasing trend of relative diameter with increasing relative length. The inflection points of branch diameter (i.e., IPB) were automatically identified via R software with the package “Segmented” [48]. We further quantified the relationship between the relative branch length of IPB (i.e., PBL) and basal diameter with the linear and quadratic functions. A one-way analysis of variance with the least significant difference post hoc test was coducted to determine whether branch morphology significantly differed among species and BD categories. In addition, we performed a rank-based nonparametric Kruskal–Wallis H test to examine the statistical significance of volume estimations predicted by different methods. If these differed significantly, a post-hoc Mann–Whitney U test was performed for further analysis. The significance level was set at 95% (α = 0.05). All statistical analyses were performed with SPSS statistics 21.0 (IBM Corporation, Armonk, NY, USA), Origin 2019 (Origin Lab Corporation, Northampton, MA, USA), and R software (version 4.2.0, R Core Team, Vienna, Austria).

3. Results

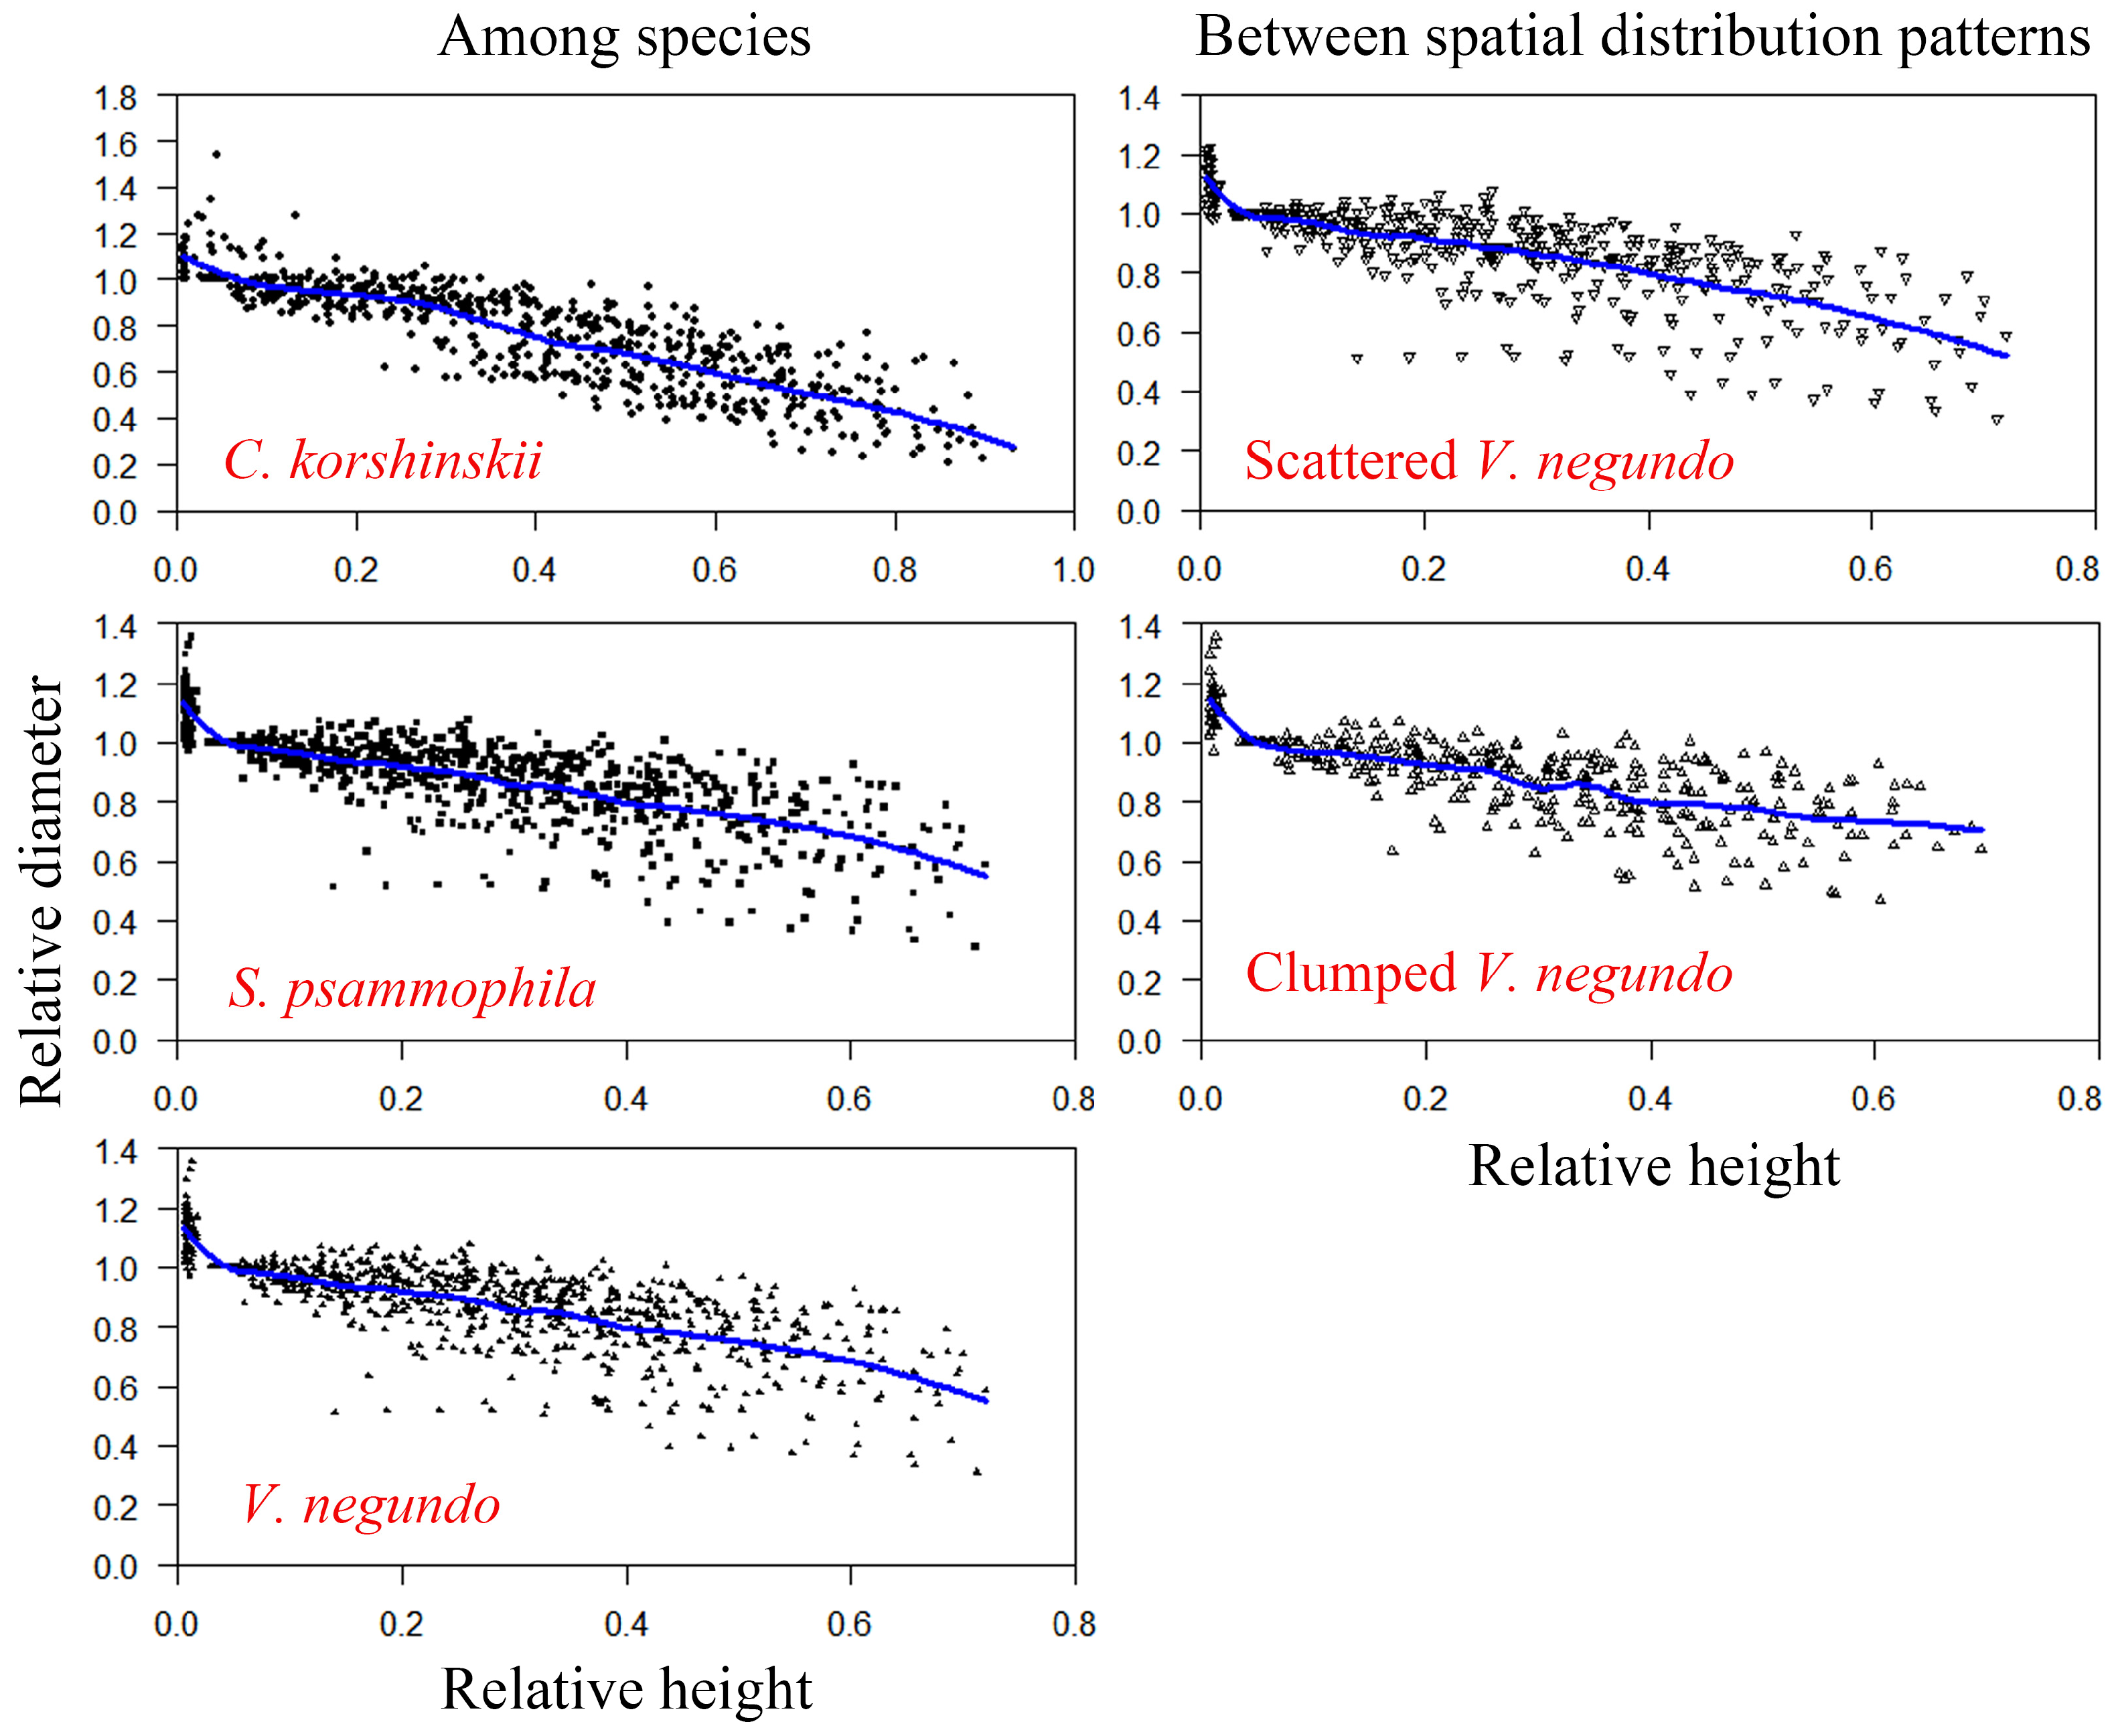
3.1. Comparison of Branch Morphology and Inflection Point

Compared with S. psammophila and V. negundo, C. korshinskii had a significantly smaller branch diameter (9.4 ± 3.8 vs. 13.1 ± 5.3 and 15.7 ± 6.0, mm) (p < 0.05), a shorter branch length (154.8 ± 29.0 vs. 229.8 ± 46.3 and 232.8 ± 63.5 cm), and a significantly more upright branch shape (64.2 ± 15.6° vs. 57.1 ± 16.9° and 49.8 ± 23.3°) (p < 0.05), respectively. In addition, the scattered V. negundo had longer (238.2 ± 68.7 vs. 213.1 ± 33.3 cm), larger (16.0 ± 6.1 vs. 14.4 ± 5.3 mm), and more upright (60.2 ± 15.9° vs. 56.2 ± 17.1°) branches than the clumped V. negundo. However, this branch morphology indicates no significant differences between spatial distribution patterns (p ≥ 0.05).
The positions of inflection points of branch diameter (PBL, %) demonstrated variability across different species. Specifically, S. psammophila, C. korshinskii, and V. negundo placed their inflection points at the positions that approximately accounted for a half (45.0%), a third (37.5%), and a quarter (29.7%) of the total branch length, respectively (Table 1). Moreover, the PBL changing trends also varied with species as the size of individual branches (hereafter “branch size”) grew (Figure 4). Both C. korshinskii (R2 = 0.75, p < 0.01) and V. negundo (R2 = 0.59, p < 0.01) exhibited a parabolic pattern in the changes in PBLs with increasing branch size (Figure 4). Initially, for both these species, the inflection points moved to the lower segment and reached the lowest positions with PBLs of 28.0% and 20.1% for the 16.7 mm and 18.2 mm branches, respectively. While greater than these threshold branch sizes, the inflection points gradually elevated back to the upper segment. On the other hand, the PBL of S. psammophila showed a linear increase with the increment in branch size (R2 = 0.75, p < 0.01), hence indicating a climbing inflection point along the stem as the branch size grew (Figure 4).
On average, the scattered V. negundo exhibited a larger PBL at 30.0%, compared to 27.0% for the clumped V. negundo (Table 1). The pattern of the PBL changing trends with increasing branch size also varied in relation to their spatial distribution (Figure 5). The scattered V. negundo showed a parabolic change in PBL as the branch size grew (R2 = 0.76, p < 0.01), attaining the smallest PBL of 17.4% recorded at a branch diameter of 17.4 mm. In contrast, a linear decrease in PBL was observed for clumped V. negundo (R2 = 0.54, p < 0.01), indicating a descent in the inflection point as the branch size increased.

3.2. Comparison of Branch Volume Estimations and Validations

Similar median volumes and interquartile ranges were observed by applying the improved method relative to reference volumes. This conclusion was supported by the relatively small RDs noted for C. korshinskii (15.8%), S. psammophila (33.4%), and V. negundo (–8.5%) (Table 2), respectively. Similar results were also observed within the scattered and clumped V. negundo groups, as indicated by their small RDs of −9.3% and −7.6%, respectively, when compared to the reference volumes.
Further statistical analysis confirmed that the improved volume estimates did not significantly differ from the reference volumes (p > 0.05) across different species and spatial distribution patterns (Table 2). Additionally, as determined by the volume formulas (as referring to Equations (1) and (2)), the conventional cylinder volume estimates were consistently double the size of the cone volume estimates (Table 2). This disparity led to the conventional methods either overestimating or underestimating the actual branch volumes, while the reference volume remained within these extremes. Therefore, accurately identifying the inflection point, which serves to divide the branch into conic and cylindric segments, was crucial in aligning the improved volume estimation with the reference branch volumes.
The fitting of improved volumes was checked by quantifying the relative difference with the reference volumes. Smaller deviances were observed particularly for C. korshinskii, V. negundo, and the scattered and clumped V. negundo, respectively. They had an average of 68.9%, 84.1%, 82.6%, and 85.8% smaller RD, and an average 24.1%, 62.3%, 61.7%, and 63.9% smaller RMSE than those by applying the conventional methods (Table 2). For S. psammophila, the improved method resulted in a 7.1% smaller RD and a 43.0% smaller RMSE compared to the conventional cylinder method. However, it had a comparable RD to the conventional cone method (33.4% vs. −28.0%) but a larger RMSE (358.3 compared to 101.4). Furthermore, the generally good predictions by applying the improved method were also validated via building the linear regressions between the predicted volume and measurements, where the regression line for the improved method was closer to the 1:1 reference line than those for the conventional cylinder and cone methods (Figure 5).
The improved method was further validated through comparison with the shrub volume estimation predicted using the crown area and height in terms of the canopy architecture. For this comparison, we randomly selected four individual shrubs of C. korshinskii, S. psammophila, and the scattered and clumped V. negundo, respectively. The volumes of these shrubs were evaluated as cones, which revealed smaller RDs compared to those volumes derived from cylindrical estimations, in relation to the reference volumes (Table 2). As indicated in Table 3, significantly larger volumes (p < 0.05), approximately 1680 times greater on average, were determined through canopy-based calculations in contrast to the accumulation of individual branch volumes. Therefore, our improved method demonstrates a practical means of estimating both branch- and shrub-scale fuel volumes for multi-stemmed shrubs.

4. Discussion

4.1. Verification of Measurement Efficiency

The overlapping-bolts function provides an accurate estimation of branch volume by subtly considering the stem form. This approach has been widely recognized for its precision and is commonly used to compute reference volumes in the absence of data from water displacement experiments [30,42,49,50]. The segmentation of bolts into shorter lengths theoretically enhances the accuracy of volume estimation, prompting previous research to focus on optimizing the fixed bolt length to strike a balance between measurement accuracy and effort, illustrated through varying lengths like 0.1 m [43], 0.3 m [49], 0.4 m, 0.7 m, 1.0 m, and 1.2 m [51], 1.3 m and 1.4 m [49], 1.5 m and 1.8 m [30], and 2.0, 4.0, and 6.0 m [31], and so on. However, although the overlapping-bolts method delivers precision, it demands labor-intensive field measurements [52]. In contrast, conventional methods tend to simplify stem structures as a cylinder or a cone [53,54,55], which streamlines the process but may compromise accuracy, potentially resulting in over- or under-estimation of volumes. Therefore, there is a fundamental consideration of both measurement feasibility and accuracy while predicting stem volumes.
We depicted the stem shapes by automatically locating the inflection point of the branch diameter using the “Segmented” package in R software [48]. This inflection point is where the branch diameter transitions from gradually to significantly decreasing along the stem, serving as a dynamic marker reflecting the morphological variations across branches. Unlike the fixed bolt length used in the overlapping-bolts function, these inflection points greatly differ depending on the shape of the branch, suggesting a more targeted approach to volume estimation that could potentially provide higher precision. However, the dynamic nature of these inflection points makes their determination a more complex process. To address this, a quantitative relationship between the PBLs and branch size was established (Figure 4), which allows for the easily determination of the inflection points. Consequently, the proportions of the cone-shaped upper segment and the cylindric lower segment could be easily discerned for branches of any known size, greatly improving the efficiency of branch volume measurement. Then, could the improved method offer branch volume estimation with satiable accuracy?

4.2. Verification of Estimation Accuracy

We collected stem form data, including diameter, height, and the position of the inflection point of stem diameter, as well as volume estimations from nine peer-reviewed studies published over the last 16 years across Asia, Europe, and North America. These studies employed the segmented taper model and identified the inflection point of stem diameter, which indicates a sharp transition from a cylinder/paraboloid to a cone. This data enabled us to calculate the improved stem volumes, which we used to validate our enhanced method, encompassing a total of 3121 samples from nine tree species. As indicated in Table 4, the conventional cylinder and cone methods led to either overestimates or underestimates of actual stem volumes, with average excesses of 61.2% and average deficit of 46.1%, respectively. In contrast, the improved method we applied in our work was more precise, yielding the smallest relative differences at 24.3%, effectively halving and reducing to a third the degree of potential errors encountered with conventional cone and cylinder methods, respectively.
While tree species that provide valuable forestry products have seen numerous volume estimation studies, research on multi-stemmed shrubs has been comparably sparse. In this study, our results indicated that the improved method of volume estimation demonstrated average relative differences from the actual branch volume of 19.2% across species, and 8.5% when comparing different spatial distribution patterns among representative multi-stemmed shrubs such as C. korshinskii, S. psammophila, and V. negundo (Table 2). These biases were minor, relative to the 5.0 and 9.2 times larger relative difference yielded by the conventional cylinder method, and the 1.8 and 4.8 times larger bias produced by the conventional cone method (Table 2).
Branch volume is a pivotal factor in determining plant flammability and, consequently, the fuel loads which are crucial in fire behavior prediction systems [64]. Such metrics significantly influence the predicted severity and intensity of fires [65], highlighting the importance of precise branch volume estimation for accurately assessing wildfire risk, which escalates with climate change, population growth, and urban expansion [7,66]. Nevertheless, using conventional geometrical shapes like spheres, cylinders, cubes, and cones to predict the volume of individual shrubs might lead to substantial overestimations [12,67,68,69]. This approach includes not only combustible materials like branches and leaves but also substantial volumes of non-combustible air, skewing the data significantly. For instance, the predictions demonstrated that shrub volumes were, on average, 1676, 1250, 1819, and 1356 times larger for C. korshinskii, S. psammophila, and both scattered and clumped V. negundo, respectively, compared to more precise branch-based estimates (Table 3). Moreover, the transition from calculating volumes of individual branches and shrubs to predictions at the ecosystem and landscape levels could further exacerbate the issue of volume overestimation. This is particularly concerning given the increasing reliance on model simulations over direct measurements, suggesting a need for more accurate methodologies in volume estimation to prevent significant discrepancies in fuel load and fire behavior analyses.
A significant aspect of this method is its ability to accurately determine the inflection points of branch diameter along the stem. It is noteworthy that the occurrence of these inflection points varies across different parameters, including species [70], crown size [49], and stand density [25]. This variability underscores the complexity of accurately estimating shrub and branch volume. However, the method’s reliance on species-specific and branch-based estimations prioritizes stem form, thus offering more precision than approaches based predominantly on canopy architecture or community structure. The versatility and effectiveness of this method have been validated through its application across a variety of shrub and tree species (Table 4), each with its distinct crown architectures. This validation across diverse species underscores the method’s potential applicability in wide-ranging ecological contexts, enhancing its value in accurately estimating fuel volumes for fire management and ecological conservation efforts.
In general, compared to the overlapping-bolts functions with good accuracy by summing all the segmented bolts in various shapes, our improved method greatly enhanced measurement efficiency. Relative to the conventional methods which simplify the stem structure as a cylinder or a cone with convenient measurements, our improved method significantly elevated estimation accuracy. Therefore, this method offered an alternative solution by balancing the accuracy of volume estimation and the efforts in measurements, particularly for the branch volumes of multi-stemmed shrubs. Then, how do we upscale the application of the improved method for estimating the woody frames in the shrubland ecosystem, thus better serving fuel characterization and wildfire risk assessment?

4.3. Application for Shrub Volume Tables

The branch volume of the multi-stemmed shrubs could be inventoried by obtaining tallies of the inflection points of branch diameter along the stem in terms of the species and basal diameter categories. We tallied branches by basal diameter and made a brief PBL inventory across species and spatial distribution patterns, as indicated in Table 1. The inflection point can be easily located by inputting the information of species and checking the value at the corresponding BD categories. The PBL estimates derived from this process delineate the proportional lengths of the branch’s upper cone-shaped segment and the lower cylindric segment. Finally, we obtained the branch volume of any length- and size-known branches by employing our improved method, that is, summing the volumetric predictions for both the conical and cylindrical segments.
Following the logic of the volume tables in the forest inventory [71], we developed two-way volume tables (with variables of branch length and basal diameter) for a swift and straightforward estimation of branch volumes in multi-stemmed shrubs. This approach facilitates the assessment of carbon sequestration in woody structures and the estimation of carbon stock emitted by fires, which accounted for approximately 2% of the total carbon stock in publicly managed lands in Victoria, Australia, between 2000 and 2009 [72]. As indicated in Tables S1–S5 of the Supplementary Materials, which obviates the need for complex calculation, users can simply refer to these tables to determine the estimated branch volumes of C. korshinskii, S. psammophila, and V. negundo by cross-referencing the branch size and length. This greatly minimizes the fieldwork, and effectively streamlines the estimation of woody frames within shrubland ecosystems, making it a valuable tool for forestry research and fire management practices.
In general, the integration of the PBL inventory and the shrub volume table has extended the application of our improved method to accurately predict the volume of woody frames. This advancement facilitates the assessment of fuel characteristics across multiple scales, from individual branches to shrubs, and extends to the entire shrubland ecosystem and beyond. It plays a pivotal role in enhancing our ability to accurately evaluate wildfire risks, especially in regions that are prone to water scarcity and are increasingly impacted by climate change and human disturbance. However, this method heavily relies on species-specific measurements to determine the inflection point of branch diameter, establish PBL inventories, and develop shrub volume tables. The upscaling of volume estimation from individual branches to entire shrublands needs further validation across different climate zones. Additionally, this method has not yet been tested on tree species based on in situ measurements. Future studies are highly recommended to apply this improved method in a diverse array of species in various ecosystems and to develop growth and yield tables that include not only shrubs but also other life forms such as trees.

5. Conclusions

This study separates the branch into the cylindric lower segment and the cone-shaped upper segment, made possible by precisely identifying the inflection point, an endeavor that has been further improved through an automated process facilitated by the R software, and subsequently quantified by the PBL (%). Compared with the segmented taper model with good estimation accuracy, and the conventional methods with easy measurements which simplify the whole stem as a cylinder or a cone, this improved method offers an alternative solution by balancing the accuracy of volume estimation and the efforts in measurements. We further conducted the PBL inventory and the volume table of shrubs by following the strategy in the forest inventory, which conveniently yielded branch volume with acceptable bias. This extends the application of the improved method to predict the volume of wood frames at a range of scales from individual branches to shrubs and the entire shrubland and beyond. Given the significance of accurately predicting branch volume in determining fuel characteristics, our improved method provides an effective tool for wildfire risk assessment and decision-making in fuel treatment.

Supplementary Materials

The following supporting information can be downloaded at: https://www.mdpi.com/article/10.3390/f15081437/s1, Table S1: The branch volume table for a multi-stemmed shrub of Caragana korshinskii; Table S2: The branch volume table for a multi-stemmed shrub of Salix psammophila; Table S3: The branch volume table for a multi-stemmed shrub of Vitex negundo; Table S4: The branch volume table for scattered Vitex negundo with isolated canopies; Table S5: The branch volume table for clumped Vitex negundo with aggregated canopies.

Author Contributions

Conceptualization and Funding acquisition: C.Y.; Data curation, Formal Analysis, Investigation, Visualization, and Writing—original draft: C.Y. and J.Z.; Methodology: C.Y. and J.Z., X.W. and N.L.; Validation: W.X., Y.H., L.G., Y.W., G.G., Q.T., S.W., X.C. and J.G.; Writing—review and editing: W.X., N.L., Y.H., L.G., Y.W., W.C., G.G., Q.T., S.W., X.C., J.G. and X.W. All authors have read and agreed to the published version of the manuscript.

Funding

Please add: This research was funded by the Natural Science Foundation of Chongqing, China (CSTB2024NSCQ-MSX1098), the Start-up Research Fund of Southwest University (SWU-KR24003), and the National Natural Science Foundation of China (Grant No. 41901038).

Data Availability Statement

Data generated or analyzed during this study are available from the corresponding author upon reasonable request.

Acknowledgments

We are grateful to Jiemin Ma, Xiaoping Yue, Qian Wang, and Yinghao Gao (Zhejiang A&F University) for their assistance in the field. Special thanks are given to the Shenmu Erosion and Environment Research Station of CAS, and Shaanxi Yan’an Forest Ecosystem National Observation and Research Station for experimental support.

Conflicts of Interest

The authors declare no conflicts of interest.

References

  1. Morandini, F.; Santoni, P.A.; Tramoni, J.B.; Mell, W.E. Experimental investigation of flammability and numerical study of combustion of shrub of rockrose under severe drought conditions. Fire Safety J. 2019, 108, 102836. [Google Scholar] [CrossRef]
  2. Keeley, J.E.; Zedler, P.H. Large, high-intensity fire events in southern California shrublands: Debunking the fine-grain age patch model. Ecol. Appl. 2009, 19, 69–94. [Google Scholar] [CrossRef]
  3. Salvador, R.; Valeriano, J.; Pons, X.; Diaz-Delgado, R. A semi-automatic methodology to detect fire scars in shrubs and evergreen forests with Landsat MSS time series. Int. J. Remote Sens. 2000, 21, 655–671. [Google Scholar] [CrossRef]
  4. Chester, L. The 2019–2020 Australian bushfires: A potent mix of climate change, problematisation, indigenous disregard, a fractured federation, volunteerism, social media, and more. Rev. Evol. Political Econ. 2020, 1, 245–264. [Google Scholar] [CrossRef]
  5. Stephens, S.L.; Agee, J.K.; Fulé, P.Z.; North, M.P.; Romme, W.H.; Swetnam, T.W.; Turner, M.G. Managing forests and fire in changing climates. Science 2013, 342, 41–42. [Google Scholar] [CrossRef]
  6. Yin, J.; He, B.; Fan, C.; Chen, R.; Zhang, H.; Zhang, Y. Drought-related wildfire accounts for one-third of the forest wildfires in subtropical China. Agric. For. Meteorol. 2024, 346, 109893. [Google Scholar] [CrossRef]
  7. Pausas, J.G.; Llovet, J.; Rodrigo, A.; Vallejo, R. Are wildfires a disaster in the Mediterranean basin? Int. J. Wildland Fire 2008, 17, 713–723. [Google Scholar] [CrossRef]
  8. Essaghi, S.; Hachmi, M.; Yessef, M.; Dehhaoui, M.; Sesbou, A. Litter and biomass traits of some dominant moroccan understorey fuels in five fire-prone forest regions. Bois For. Des Trop. 2019, 342, 3–16. [Google Scholar] [CrossRef]
  9. Harrison, G.R.; Shrestha, A.; Strand, E.K.; Karl, J.W. A comparison and development of methods for estimating shrub volume using drone-imagery-derived point clouds. Ecosphere 2024, 15, e4877. [Google Scholar] [CrossRef]
  10. Radeloff, V.C.; Hammer, R.B.; Stewart, S.I.; Fried, J.S.; Holcomb, S.S.; McKeefry, J.F. The Wildland–Urban Interface in the United States. Ecol. Appl. 2005, 15, 799–805. [Google Scholar] [CrossRef]
  11. Conti, G.; Gorné, L.D.; Zeballos, S.R.; Lipoma, M.L.; Gatica, G.; Kowaljow, E.; Whitworth-Hulse, J.I.; Cuchietti, A.; Poca, M.; Pestoni, S.; et al. Developing allometric models to predict the individual aboveground biomass of shrubs worldwide. Glob. Ecol. Biogeogr. 2019, 28, 961–975. [Google Scholar] [CrossRef]
  12. Yao, X.; Yang, G.; Wu, B.; Jiang, L.; Wang, F. Biomass estimation models for six shrub species in Hunshandake sandy land in inner Mongolia, Northern China. Forests 2021, 12, 167. [Google Scholar] [CrossRef]
  13. Ellsworth, L.M.; Newingham, B.A.; Shaff, S.E.; Williams, C.L.; Strand, E.K.; Reeves, M.; Pyke, D.A.; Schupp, E.W.; Chambers, J.C. Fuel reduction treatments reduce modeled fire intensity in the sagebrush steppe. Ecosphere 2022, 13, e4064. [Google Scholar] [CrossRef]
  14. Zhao, Y.; Liu, X.; Wang, Y.; Zheng, Z.; Zheng, S.; Zhao, D.; Bai, Y. UAV-based individual shrub aboveground biomass estimation calibrated against terrestrial LiDAR in a shrub-encroached grassland. Int. J. Appl. Earth Obs. Geoinf. 2021, 101, 102358. [Google Scholar] [CrossRef]
  15. Yépez-Rincón, F.D.; Luna-Mendoza, L.; Ramírez-Serrato, N.L.; Hinojosa-Corona, A.; Ferriño-Fierro, A.L. Assessing vertical structure of an endemic forest in succession using terrestrial laser scanning (TLS). Case study: Guadalupe Island. Remote Sens. Environ. 2021, 263, 112563. [Google Scholar] [CrossRef]
  16. Heinzel, J.; Huber, M.O. Detecting tree stems from volumetric TLS data in forest environments with rich understory. Remote Sens. 2017, 9, 9. [Google Scholar] [CrossRef]
  17. Vega, J.A.; Arellano-Pérez, S.; Álvarez-González, J.G.; Fernández, C.; Jiménez, E.; Fernández-Alonso, J.M.; Vega-Nieva, D.J.; Briones-Herrera, C.; Alonso-Rego, C.; Fontúrbel, T.; et al. Modelling aboveground biomass and fuel load components at stand level in shrub communities in NW Spain. For. Ecol. Manag. 2022, 505, 119926. [Google Scholar] [CrossRef]
  18. Verón, S.R.; Paruelo, J.M.; Oesterheld, M. Assessing desertification. J. Arid Environ. 2006, 66, 751–763. [Google Scholar] [CrossRef]
  19. Huang, J.; Yu, H.; Guan, X.; Wang, G.; Guo, R. Accelerated dryland expansion under climate change. Nat. Clim. Change 2015, 6, 166–171. [Google Scholar] [CrossRef]
  20. Martin, A.J. Testing volume equation accuracy with water displacement techniques. For. Sci. 1984, 30, 41–50. [Google Scholar]
  21. Forslund, R.R. A geometrical tree volume model based on the location of the centre of gravity of the bole. Can. J. For. Res. 1982, 12, 215–221. [Google Scholar] [CrossRef]
  22. Wood, G.B.; Wiant, H.V.; Loy, R.J.; Miles, J.A. Centroid sampling: A variant of importance sampling for estimating the volume of sample trees of radiata pine. For. Ecol. Manag. 1990, 36, 233–243. [Google Scholar] [CrossRef]
  23. Özçelik, R.; Diamantopoulou, M.J.; Brooks, J.R.; Wiant, H.V. Estimating tree bole volume using artificial neural network models for four secies in Turkey. J. Environ. Manag. 2010, 91, 742–753. [Google Scholar] [CrossRef] [PubMed]
  24. Behre, E.C. Preliminary notes on studies of tree form. J. For. 1923, 21, 507–511. [Google Scholar]
  25. Jacobs, M.; Rais, A.; Pretzsch, H. Analysis of stand density effects on the stem form of Norway spruce trees and volume miscalculation by traditional form factor equations using terrestrial laser scanning (TLS). Can. J. For. Res. 2020, 50, 51–64. [Google Scholar] [CrossRef]
  26. Osunkoya, O.O.; Sheng, T.K.; Mahmud, N.-A.; Damit, N. Variation in wood density, wood water content, stem growth and mortality among twenty-seven tree species in a tropical rainforest on Borneo island. Austral Ecol. 2007, 32, 191–201. [Google Scholar] [CrossRef]
  27. Kozak, A.; Smith, J.H.G. Standards for evaluating taper estimating systems. For. Chron. 1993, 69, 438–444. [Google Scholar] [CrossRef]
  28. Kozak, A. My last words on taper equations. For. Chron. 2004, 80, 507–515. [Google Scholar] [CrossRef]
  29. Bi, H. Trigonometric variable-form taper equations for Australian eucalypts. For. Sci. 2000, 46, 397–409. [Google Scholar] [CrossRef]
  30. Bailey, R.L. Upper stem volumes from stem analysis data: An overlapping bolts method. Can. J. For. Res. 1995, 25, 170–173. [Google Scholar] [CrossRef]
  31. Filho, A.F.; Machado, S.A.; Carneiro, M.R.A. Testing accuracy of log volume calculation procedures against water displacement techniques (Xylometer). Can. J. For. Res. 2000, 30, 990–997. [Google Scholar] [CrossRef]
  32. Phillips, D.R.; Taras, M.A. Accuracy of log volume estimates by density and formulas compared with water displacement. For. Prod. J. 1987, 37, 37–42. [Google Scholar]
  33. Özçelik, R.; Wiant, H.V.; Brooks, J.R. Accuracy using xylometry of log volume estimates for two tree species in turkey. Scand. J. For. Res. 2008, 23, 272–277. [Google Scholar] [CrossRef]
  34. Nicholls, D.L.; Halbrook, J.M.; Benedum, M.E.; Han, H.-S.; Lowell, E.C.; Becker, D.R.; Barbour, R.J. Socioeconomic constraints to biomass removal from forest lands for fire risk reduction in the western U.S. Forests 2018, 9, 264. [Google Scholar] [CrossRef]
  35. Chave, J.; Andalo, C.; Brown, S.; Cairns, M.A.; Chambers, J.Q.; Eamus, D.; Fölster, H.; Fromard, F.; Higuchi, N.; Kira, T.; et al. Tree allometry and improved estimation of carbon stocks and balance in tropical forests. Oecologia 2005, 145, 87–99. [Google Scholar] [CrossRef] [PubMed]
  36. Fang, J.; Wang, G.G.; Liu, G.; Xu, S. Forest biomass of China: An estimate based on the biomass-volume relationship. Ecol. Appl. 1998, 8, 1084–1091. [Google Scholar]
  37. Wang, J.; Fu, B.; Lu, N.; Zhang, L. Seasonal variation in water uptake patterns of three plant species based on stable isotopes in the semi-arid Loess Plateau. Sci. Total Environ. 2017, 609, 27–37. [Google Scholar] [CrossRef]
  38. Yuan, C.; Guo, L.; Levia, D.F.; Rietkerk, M.; Fu, B.; Gao, G. Quantity or efficiency: Strategies of self-organized xerophytic shrubs to harvest rain. Water Resour. Res. 2022, 58, e2022WR032008. [Google Scholar] [CrossRef]
  39. Yuan, C.; Gao, G.; Fu, B.; He, D.; Duan, X.; Wei, X. Temporally dependent effects of rainfall characteristics on inter- and intra-event branch-scale stemflow variability in two xerophytic shrubs. Hydrol. Earth Syst. Sci. 2019, 23, 4077–4095. [Google Scholar] [CrossRef]
  40. Jia, X.X.; Shao, M.A.; Wei, X.R.; Horton, R.; Li, X.Z. Estimating total net primary productivity of managed grasslands by a state-space modeling approach in a small catchment on the Loess Plateau, China. Geoderma 2011, 160, 281–291. [Google Scholar] [CrossRef]
  41. He, P.; Hussain, A.; Khurram Shahzad, M.; Jiang, L.; Li, F. Evaluation of four regression techniques for stem taper modeling of Dahurian Larch (Larix gmelinii) in northeastern China. For. Ecol. Manag. 2021, 494, 119336. [Google Scholar] [CrossRef]
  42. Husch, B.; Miller, C.I.; Beers, T.W. Forest Mensuration, 3rd ed.; Wiley: New York, NY, USA, 1982; pp. 1–402. [Google Scholar]
  43. Wiant, H.V.; Wood, G.B.; Furnival, G.M. Estimating log volume using the centroid position. For. Sci. 1992, 38, 187–191. [Google Scholar] [CrossRef]
  44. Fang, Z.; Borders, B.E.; Bailey, R.L. Compatible volume-taper models for loblolly and slash Pine based on a system with segmented-stem form factors. For. Sci. 2000, 46, 1–12. [Google Scholar] [CrossRef]
  45. Inoue, A. Can the relative stem taper curve be estimated theoretically only from tree height and diameter at breast height? J. For. Plan. 2001, 7, 89–94. [Google Scholar] [CrossRef]
  46. Bojórquez, A.; Martínez-Yrízar, A.; Búrquez, A.; Jaramillo, V.J.; Mora, F.; Balvanera, P.; Álvarez-Yépiz, J.C. Improving the accuracy of aboveground biomass estimations in secondary tropical dry forests. For. Ecol. Manag. 2020, 474, 118384. [Google Scholar] [CrossRef]
  47. Cleveland, W.S.; Devlin, S.J.; Grosse, E. Regression by local fitting: Methods, properties, and computational algorithms. J. Econom. 1988, 37, 87–114. [Google Scholar] [CrossRef]
  48. Muggeo, V.M.R. Estimating regression models with unknown break-points. Stat. Med. 2003, 22, 3055–3071. [Google Scholar] [CrossRef]
  49. Jiang, L.C.; Brooks, J.R.; Wang, J.X. Compatible taper and volume equations for yellow-poplar in West Virginia. For. Ecol. Manag. 2005, 213, 399–409. [Google Scholar] [CrossRef]
  50. Özçelik, R.; Crecente-Campo, F. Stem taper equations for estimating merchantable volume of Lebanon cedar trees in the Taurus mountains, southern Turkey. For. Sci. 2016, 62, 78–91. [Google Scholar] [CrossRef]
  51. Clark, A.; Souter, R.A.; Schlaegel, B.E. Stem Profile for Southern Equations for Southern Tree Species; Research Paper SE-282; US Department of Agriculture, Forest Service, Southeastern Forest Experiment Station: Asheville, NC, USA, 1991; pp. 1–117.
  52. Cui, X.; Guo, L.; Chen, J.; Chen, X.; Zhu, X. Estimating tree-root biomass in different depths using ground-penetrating radar: Evidence from a controlled experiment. IEEE Trans. Geosci. Remote Sens. 2013, 51, 3410–3423. [Google Scholar] [CrossRef]
  53. Colgan, M.S.; Swemmer, T.; Asner, G.P. Structural Relationships between Form Factor, Wood Density, and Biomass in African Savanna Woodlands. Trees 2014, 28, 91–102. [Google Scholar] [CrossRef]
  54. Picard, N.; Rutishauser, E.; Ploton, P.; Ngomanda, A.; Henry, M. Should tree biomass allometry be restricted to power models? For. Ecol. Manag. 2015, 353, 156–163. [Google Scholar] [CrossRef]
  55. Dutca, I.; McRoberts, R.; Næsset, E.; Viorel, B. A practical measure for determining if diameter (D) and height (H) should be combined into D2H in allometric biomass models. Forestry 2019, 92, 627–634. [Google Scholar] [CrossRef]
  56. Diéguez-Aranda, U.; Castedo-Dorado, F.; Álvarez-González, J.F.; Rojo-Alboreca, A. Compatible taper function for Scots pine plantations in northwestern Spain. Can. J. For. Res. 2006, 36, 1190–1205. [Google Scholar] [CrossRef]
  57. Castedo-Dorado, F.; Diéguez-Aranda, U.; Alvarez-Gonzalez, J.G. A growth model for Pinus radiata D. Don stands in northwestern Spain. Ann. For. Sci. 2007, 64, 453–465. [Google Scholar] [CrossRef]
  58. Pérez, D.H.; de Los Santos-Posadas, H.M.; Ángeles-Pérez, G.; Valdez-Lazalde, J.R.; Haller, V. Taper and Commercial volume system for Pinus patula Schltdl. et Cham. in Zacualtipán, Hidalgo State. Rev. Mex. De Cienc. For. 2013, 4, 34–45. [Google Scholar]
  59. Alkan, O.; Özçelik, R. Stem taper equations for diameter and volume predictions of Abies cilicica Carr. in the Taurus Mountains. Turkey J. Mt. Sci. 2020, 17, 3054–3069. [Google Scholar] [CrossRef]
  60. Shahzad, M.K.; Hussain, A.; Jiang, L.C. A model form for stem taper and volume estimates of Asian white birch (Betula platyphylla): A major commercial tree species of Northeast China. Can. J. For. Res. 2020, 50, 274–286. [Google Scholar] [CrossRef]
  61. Poudel, K.P.; Özçelik, R.; Yavuz, H. Differences in stem taper of black alder (Alnus glutinosa subsp. barbata) by origin. Can. J. For. Res. 2020, 50, 581–588. [Google Scholar] [CrossRef]
  62. Hussain, A.; Shahzad, M.K.; Burkhart, H.; Jiang, L.C. Stem taper functions for white birch (Betula platyphylla) and costata birch (Betula costata) in the Xiaoxing’an Mountains, northeast China. Forestry 2021, 94, 714–733. [Google Scholar] [CrossRef]
  63. Sánchez-Banda, M.B.; De los Santos-Posadas, H.M.; Valdez-Lazalde, J.R.; Roldán-Cortés, M.A. Heartwood functions and compatible taper and merchantable volume system for Acacia mangium Willd., in Tabasco, Mexico. Agrociencia 2022, 56, 88–107. [Google Scholar]
  64. Guo, F.; Su, Z.; Wang, G.; Sun, L.; Tigabu, M.; Yang, X.; Hu, H. Understanding fire drivers and relative impacts in different Chinese forest ecosystems. Sci. Total Environ. 2017, 605–606, 411–425. [Google Scholar] [CrossRef]
  65. Huff, S.; Ritchie, M.; Temesgen, H. Allometric equations for estimating aboveground biomass for common shrubs in northeastern California. For. Ecol. Manag. 2017, 398, 48–63. [Google Scholar] [CrossRef]
  66. Iqbal, S.; Zha, T.S.; Jia, X.; Hayat, M.; Qian, D.; Bourque, C.P.A.; Tian, Y.; Bai, Y.J.; Liu, P.; Yang, R.Z.; et al. Interannual variation in sap flow resprnse in three xeric shrub species to periodic drought. Agric. For. Meteorol. 2021, 297, 108276. [Google Scholar] [CrossRef]
  67. Fernandes, P.M.; Rego, F.C. A new method to estimate fuel surface area-to-volume ratio using water immersion. Int. J. Wildland Fire 1998, 8, 121–128. [Google Scholar] [CrossRef]
  68. Hierro, J.L.; Branch, L.C.; Villarreal, D.; Clark, K.L. Predictive equations for biomass and fuel characteristics of argentine shrubs. J. Range Manag. 2000, 53, 617–621. [Google Scholar] [CrossRef]
  69. Li, J.; Mahalingam, S.; Weise, D.R. Experimental investigation of fire propagation in single live shrubs. Int. J. Wildland Fire 2017, 26, 58–70. [Google Scholar] [CrossRef]
  70. Larson, P.R. Stem form development of forest trees. For. Sci. 1963, 9, a0001–a0042. [Google Scholar] [CrossRef]
  71. Kumar, I.; Gupta, R.; Kumar, A. Construction of two-way volume table of Eucalyptus Tereticornis for mid-Himalayan region of Himachal Pradesh. Int. J. Bio-Resour. Stress Manag. 2020, 11, 046–050. [Google Scholar] [CrossRef]
  72. Norris, J.; Arnold, S.; Fairman, T. An indicative estimate of carbon stocks on Victoria’s publicly managed land using the FullCAM carbon accounting model. Aust. For. 2010, 73, 209–219. [Google Scholar] [CrossRef]
Figure 1. A flowchart for improved branch volume prediction and application. (ac) show the plot locations; (dg) are multi-stemmed shrub species measured in this study.
Forests 15 01437 g001
Figure 2. Scattered plots between relative diameter and length with LOESS regressions for fitting smoothing curves.
Forests 15 01437 g002
Figure 3. The scheme for improving branch volume prediction of multi-stemmed shrubs. BD, L, and H are the basal diameter, length, and height of the branch; Lu and h are the length and height of the upper segment; Ll is the length of the lower segment; IPB refers to the inflection point of the branch diameter; V1Vn are the volumes of different bolts; and + and − stand for increasing and decreasing, respectively.
Forests 15 01437 g003
Figure 4. Relations of the relative branch length at the inflection point with branch size.
Forests 15 01437 g004
Figure 5. Validating the predictive performance of the improved method for branch volume in comparison with conventional cylinder and cone methods.
Forests 15 01437 g005
Table 1. An inventory of the inflection points of branch diameter by tallying branches in terms of the species and branch size.
Species and
Spatial Distribution Patterns
BD Categories (mm)BD (mm)BL (cm)PBL (%)
Different shrub speciesC. korshinskii<105.6 ± 3.0118.0 ± 65.450.1 ± 11.6
10–2014.5 ± 2.6246.9 ± 30.228.9 ± 7.3
>2023.3 ± 1.5301.5 ± 24.933.6 ± 6.1
Average14.5 ± 0.7222.1 ± 22.037.5 ± 2.9
S. psammophila<106.3 ± 2.2168.2 ± 49.129.0 ± 8.0
10–2015.2 ± 3.3284.4 ± 50.747.1 ± 10.0
>2026.0 ± 3.8387.2 ± 38.358.8 ± 8.5
Average15.8 ± 0.8279.9 ± 6.845.0 ± 1.0
V. negundo<107.4 ± 1.2156.5 ± 31.941.6 ± 7.6
10–2015.3 ± 2.9234.1 ± 47.322.9 ± 8.3
>2022.2 ± 2.0284.9 ± 47.124.6 ± 8.5
Average15.0 ± 0.8225.2 ± 8.829.7 ± 0.5
Different spatial distribution patternsScattered V. negundo<107.2 ± 1.2158.9 ± 29.343.4 ± 8.1
10–2015.6 ± 2.4258.4 ± 41.118.5 ± 4.7
>2022.3 ± 2.2295.3 ± 50.128.0 ± 6.5
Average15.2 ± 0.6237.5 ± 10.430.0 ± 1.7
Clumped V. negundo<107.2 ± 1.3154.0 ± 35.939.7 ± 7.0
10–2015.0 ± 3.3214.4 ± 43.426.5 ± 8.9
>2021.9 ± 1.4253.9 ± 16.114.7 ± 5.8
Average14.7 ± 1.1207.5 ± 14.127.0 ± 1.6
Note: BD and BL are the branch basal diameter and the length; PBL refers to the relative length at the position of the inflection point to the total branch length. The values are expressed as the mean ± standard deviation.
Table 2. A comparison of prediction performances of the improved and conventional methods.
Species and
Spatial Distribution Patterns
MethodsBranch Volume (cm3)RD (%)RMSEHp
MedianInterquartile Range
Different shrub speciesC. korshinskiiThe reference104.1 ab8.8–214.7NANA8.90.031
The improved111.5 ab10.4−247.015.8%72.6
Conventional cylinder183.4 a14.8−480.996.8%290.1
Conventional cone61.1 b4.9−160.3−34.4%57.3
S. psammophilaThe reference120.8 ab35.9−438.8NANA10.90.012
The improved142.4 ab41.1−684.433.4%358.3
Conventional cylinder248.4 a73.0−933.0115.9%628.4
Conventional cone82.8 b24.3−311.0−28.0%101.4
V. negundoThe reference197.9 b82.9−381.1NANA14.90.002
The improved182.1 bc67.6−335.7−8.5%65.8
Conventional cylinder387.8 a125.6−718.778.0%304.3
Conventional cone129.3 c41.9−239.6−40.7%122.5
Different spatial distribution patternsScattered
V. negundo
The reference280.7 abc109.5−465.8NANA19.1<0.001
The improved196.6 bc95.2−384.4−9.3%80.4
Conventional cylinder461.6 a171.1−859.577.9%353.5
Conventional cone153.9 c57.0−286.5−40.7%149.5
Clumped
V. negundo
The reference149.5 ab80.6−305.4NANA17.20.001
The improved167.6 ab65.5−295.4−7.6%45.4
Conventional cylinder326.0 a129.9−585.178.1%241.4
Conventional cone108.7 b43.3−195.0−40.6%85.0
Note: RD is the relative difference; RMSE is the root mean square error; NA refers to not applicable. H is the Kruskal–Wallis H test statistic of the ANOVA and p is the level of significance. Different letters indicate significant differences among volume estimates (p < 0.05).
Table 3. Comparison of shrub fuel volume via accumulating branch volumes and basing canopy morphology.
Species and
Spatial Distribution Patterns
Shrub
ID
CH
(m)
CA
(m2)
BN
(Unitless)
BD
(mm)
BL
(cm)
AV
(cm3)
CV
(cm3)
CV/AV
(Unitless)
Different shrub speciesC. korshinskiiCK12.24.1348.6141.82.0 × 1033.0 × 1061500
CK22.34.4248.8128.01.6 × 1033.3 × 1062063
CK31.93.9356.6118.31.2 × 1032.4 × 1062000
CK42.43.7378.1129.22.1 × 1032.9 × 1061381
Average2.24.0338.0129.31.7 × 103 a2.9 × 106 b1676
S. psammophilaSP13.514.18513.8262.22.6 × 1031.6 × 106615
SP23.621.44315.4263.11.5 × 1032.6 × 1061733
SP33.723.95415.1268.02.8 × 1032.9 × 1061036
SP43.326.14413.1262.41.2 × 1032.9 × 1062417
Average3.521.45714.4263.92.0 × 103 a2.5 × 106 b1250
Different spatial distribution patternsScattered
V. negundo
S-VN12.77.6518.8291.82.0 × 1036.9 × 1063450
S-VN23.43.21015.3244.63.4 × 1033.6 × 1061059
S-VN31.94.5614.4189.01.2 × 1032.9 × 1062417
S-VN42.44.9817.2268.72.9 × 1033.9 × 1061345
Average2.65.1716.4248.52.4 × 103 a4.3 × 106 b1819
Clumped
V. negundo
C-VN12.14.21911.0180.42.1 × 1032.9 × 1061381
C-VN22.52.41611.8212.72.7 × 1032.0 × 106741
C-VN32.24.3179.9169.31.6 × 1033.1 × 1061938
C-VN42.42.8811.3162.81.1 × 1032.2 × 1062000
Average2.33.41511.0181.31.9 × 103 a2.6 × 106 b1356
Note: CH and CA are the canopy height and area; BN, BD, and BL are the number, basal diameter, and length of branches; and AV and CV are the shrub volumes by accumulating branch volumes and calculating as an inverted cone, respectively. Different letters indicate significant differences between AV and CV (p < 0.05).
Table 4. Comparison of stem volumes predicted by improved method and the conventional methods using published data.
ReferencesCountrySpeciesSamplesDBH
(cm)
H
(m)
PBL
(%)
Actual
Volume (m3)
Improved MethodCylinder MethodCone Method
Volume
(m3)
RD
(%)
Volume
(m3)
RD
(%)
Volume
(m3)
RD
(%)
Diéguez-Arand et al., 2006 [56]SpainPinus sylvestris22822.810.860.70.2500.3332.00.4476.00.15−40.0
Castedo-Dorado et al., 2007 [57]SpainPinus radiata42128.220.465.70.7590.9829.41.2767.90.42−44.0
Pérez et al., 2013 [58]MexicoPinus patula7827.810.382.30.5170.556.40.6219.90.21−59.4
Özçelik and Crecente-Campo 2016 [50]TurkeyCedrus libani36231.518.351.10.7500.9628.21.4390.20.48−36.6
Alkan and Özçelik 2020 [59]TurkeyAbies cilicica24438.617.99.11.0660.83−22.42.1096.90.70−34.4
Shahzad et al., 2020 [60]ChinaBetula platyphylla21817.916.654.00.2520.2915.10.4266.70.14−44.4
Poudel et al., 2020 [61]TurkeyAlnus glutinosa49925.517.382.00.5930.7831.00.8848.90.29−50.4
58222.313.878.00.3670.4625.20.5446.70.18−51.1
19921.416.483.00.3660.5242.80.5961.00.20−46.3
Hussain et al., 2021 [62]ChinaBetula costata10831.119.354.40.9001.0213.41.4762.90.49−45.7
Sánchez-Banda et al., 2022 [63]MexicoAcacia mangium6020.119.580.50.3900.5438.00.6258.70.21−47.1
6018.419.50.3500.4529.10.5248.40.17−50.5
3120.420.30.4100.5840.40.6661.40.22−46.2
3118.820.30.3700.4931.40.5651.10.19−49.6
Note: DBH and H are the diameter at breast height (cm) and tree height (m); PBL is the relative branch length at the inflection point (%); and RD is the relative difference of estimated volume relative to true volume (%).
Disclaimer/Publisher’s Note: The statements, opinions and data contained in all publications are solely those of the individual author(s) and contributor(s) and not of MDPI and/or the editor(s). MDPI and/or the editor(s) disclaim responsibility for any injury to people or property resulting from any ideas, methods, instructions or products referred to in the content.

