
Heat Mitigation Benefits of Street Tree Species during Transition Seasons in Hot and Humid Areas: A Case Study in Guangzhou


Abstract
1. Introduction
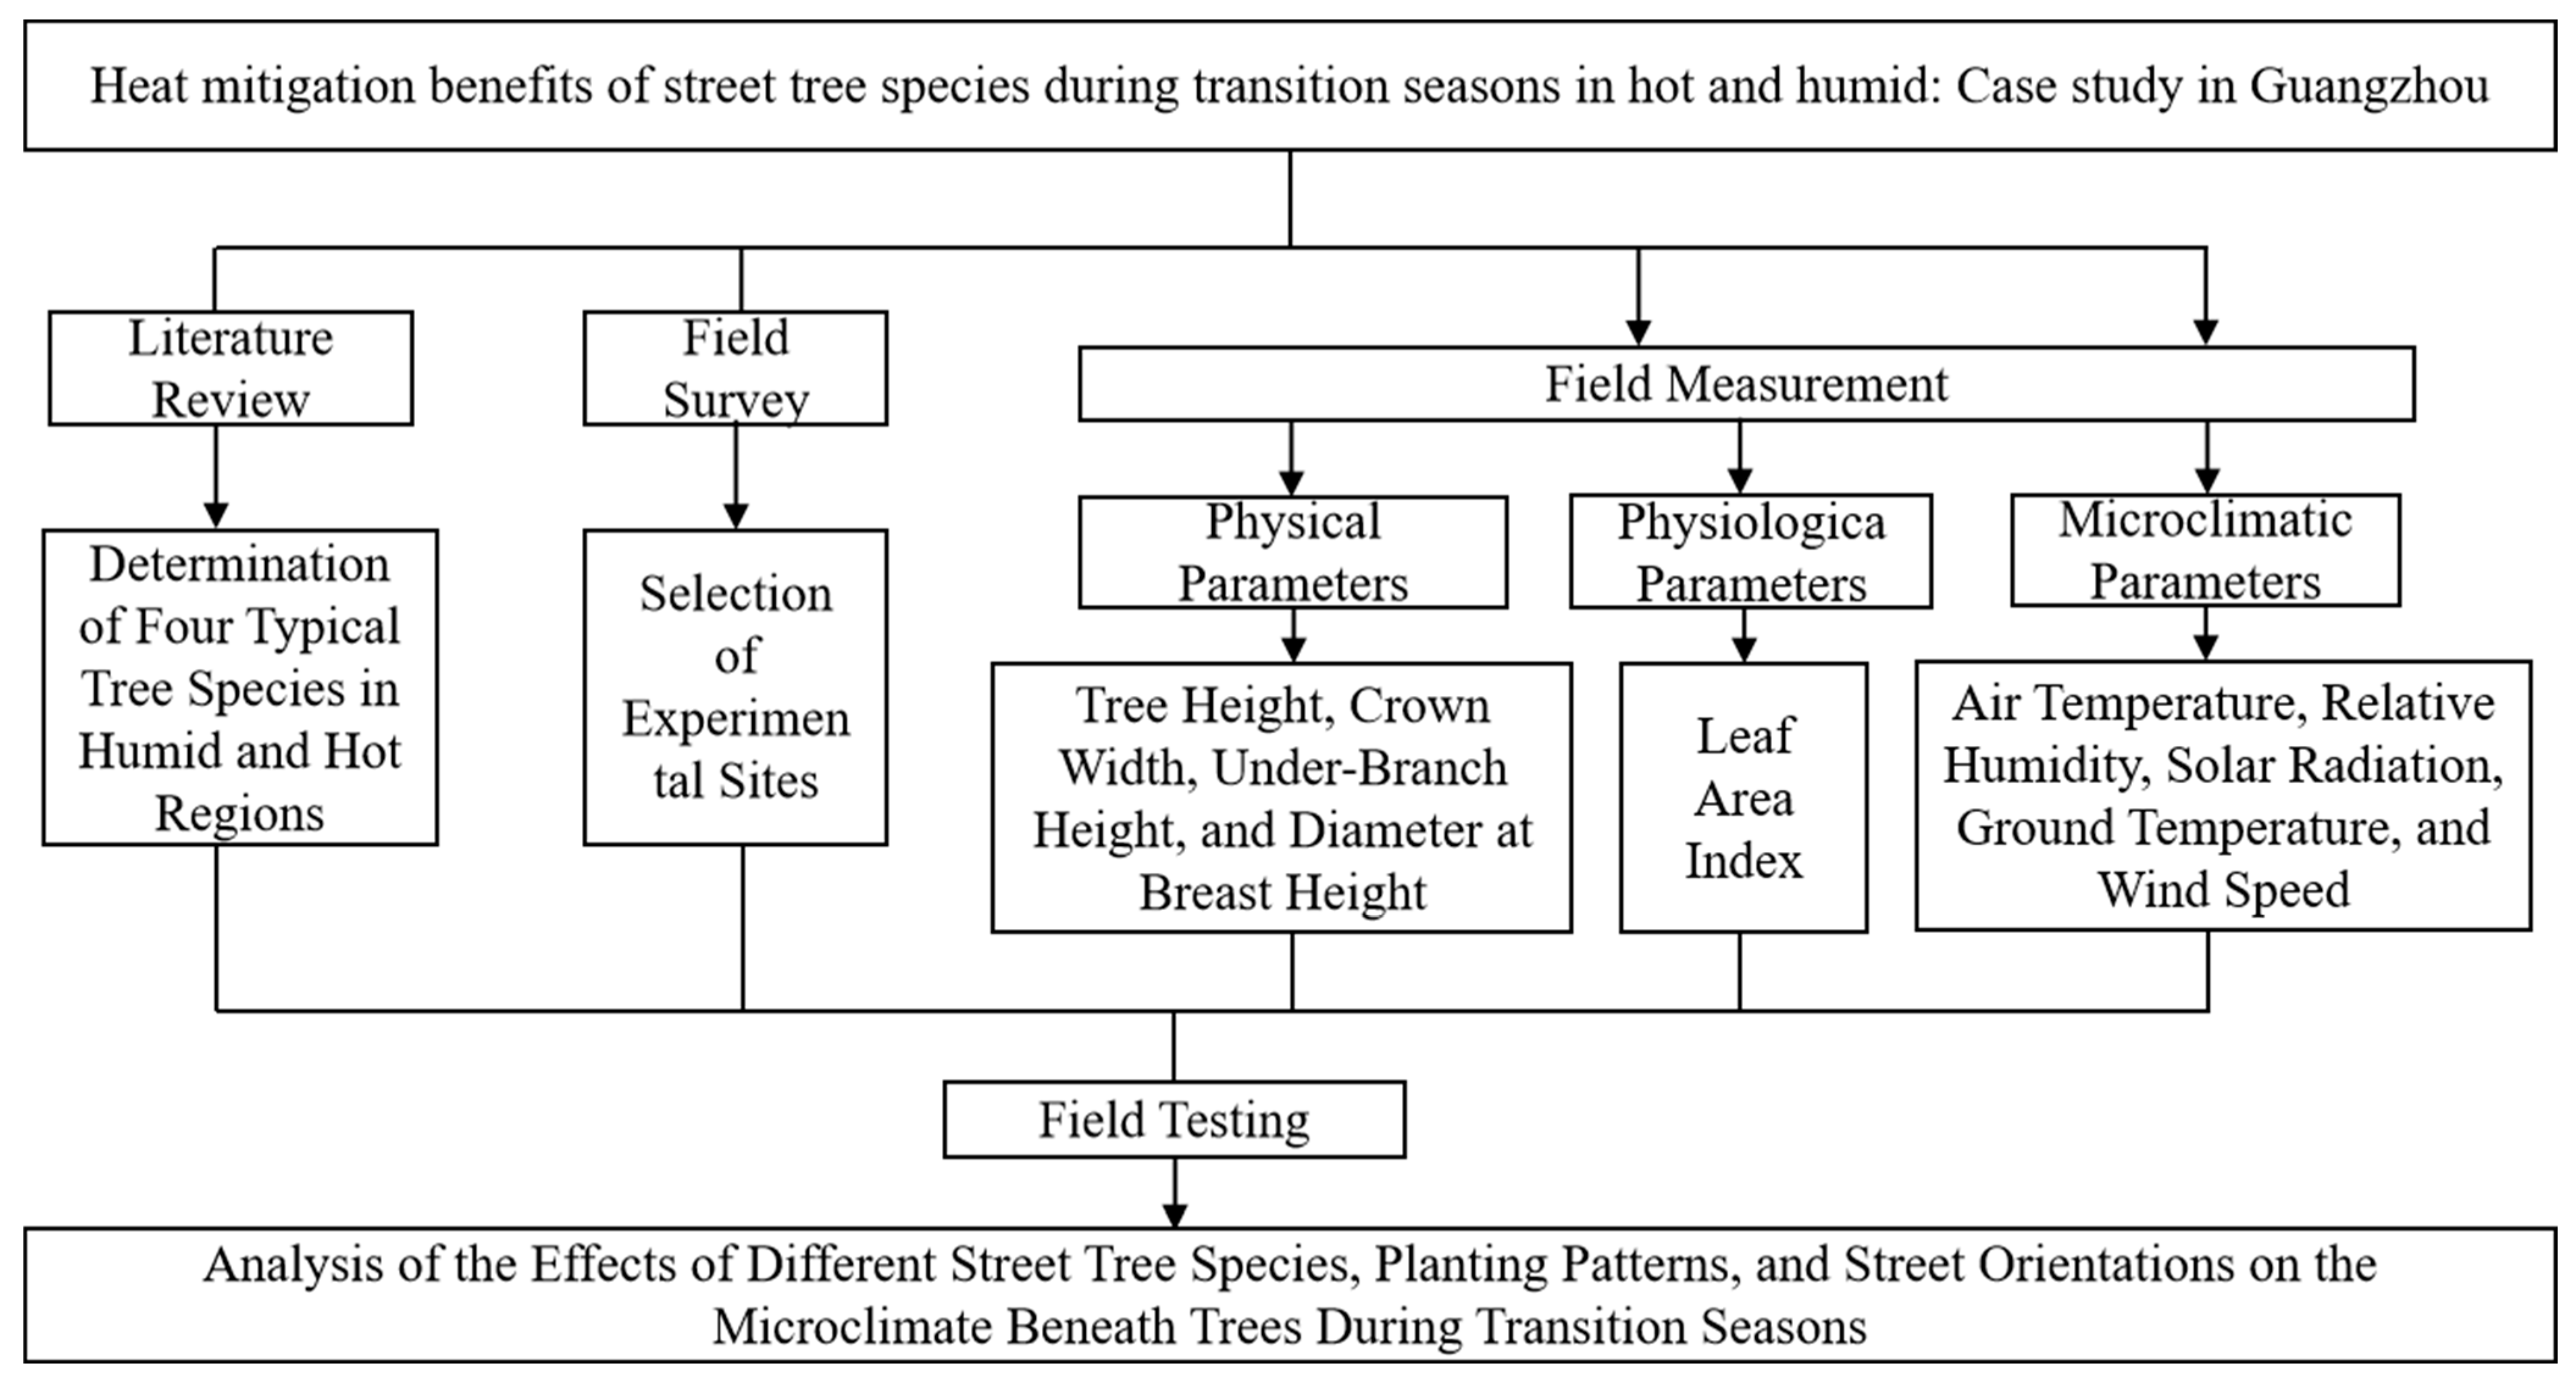
2. Methodology
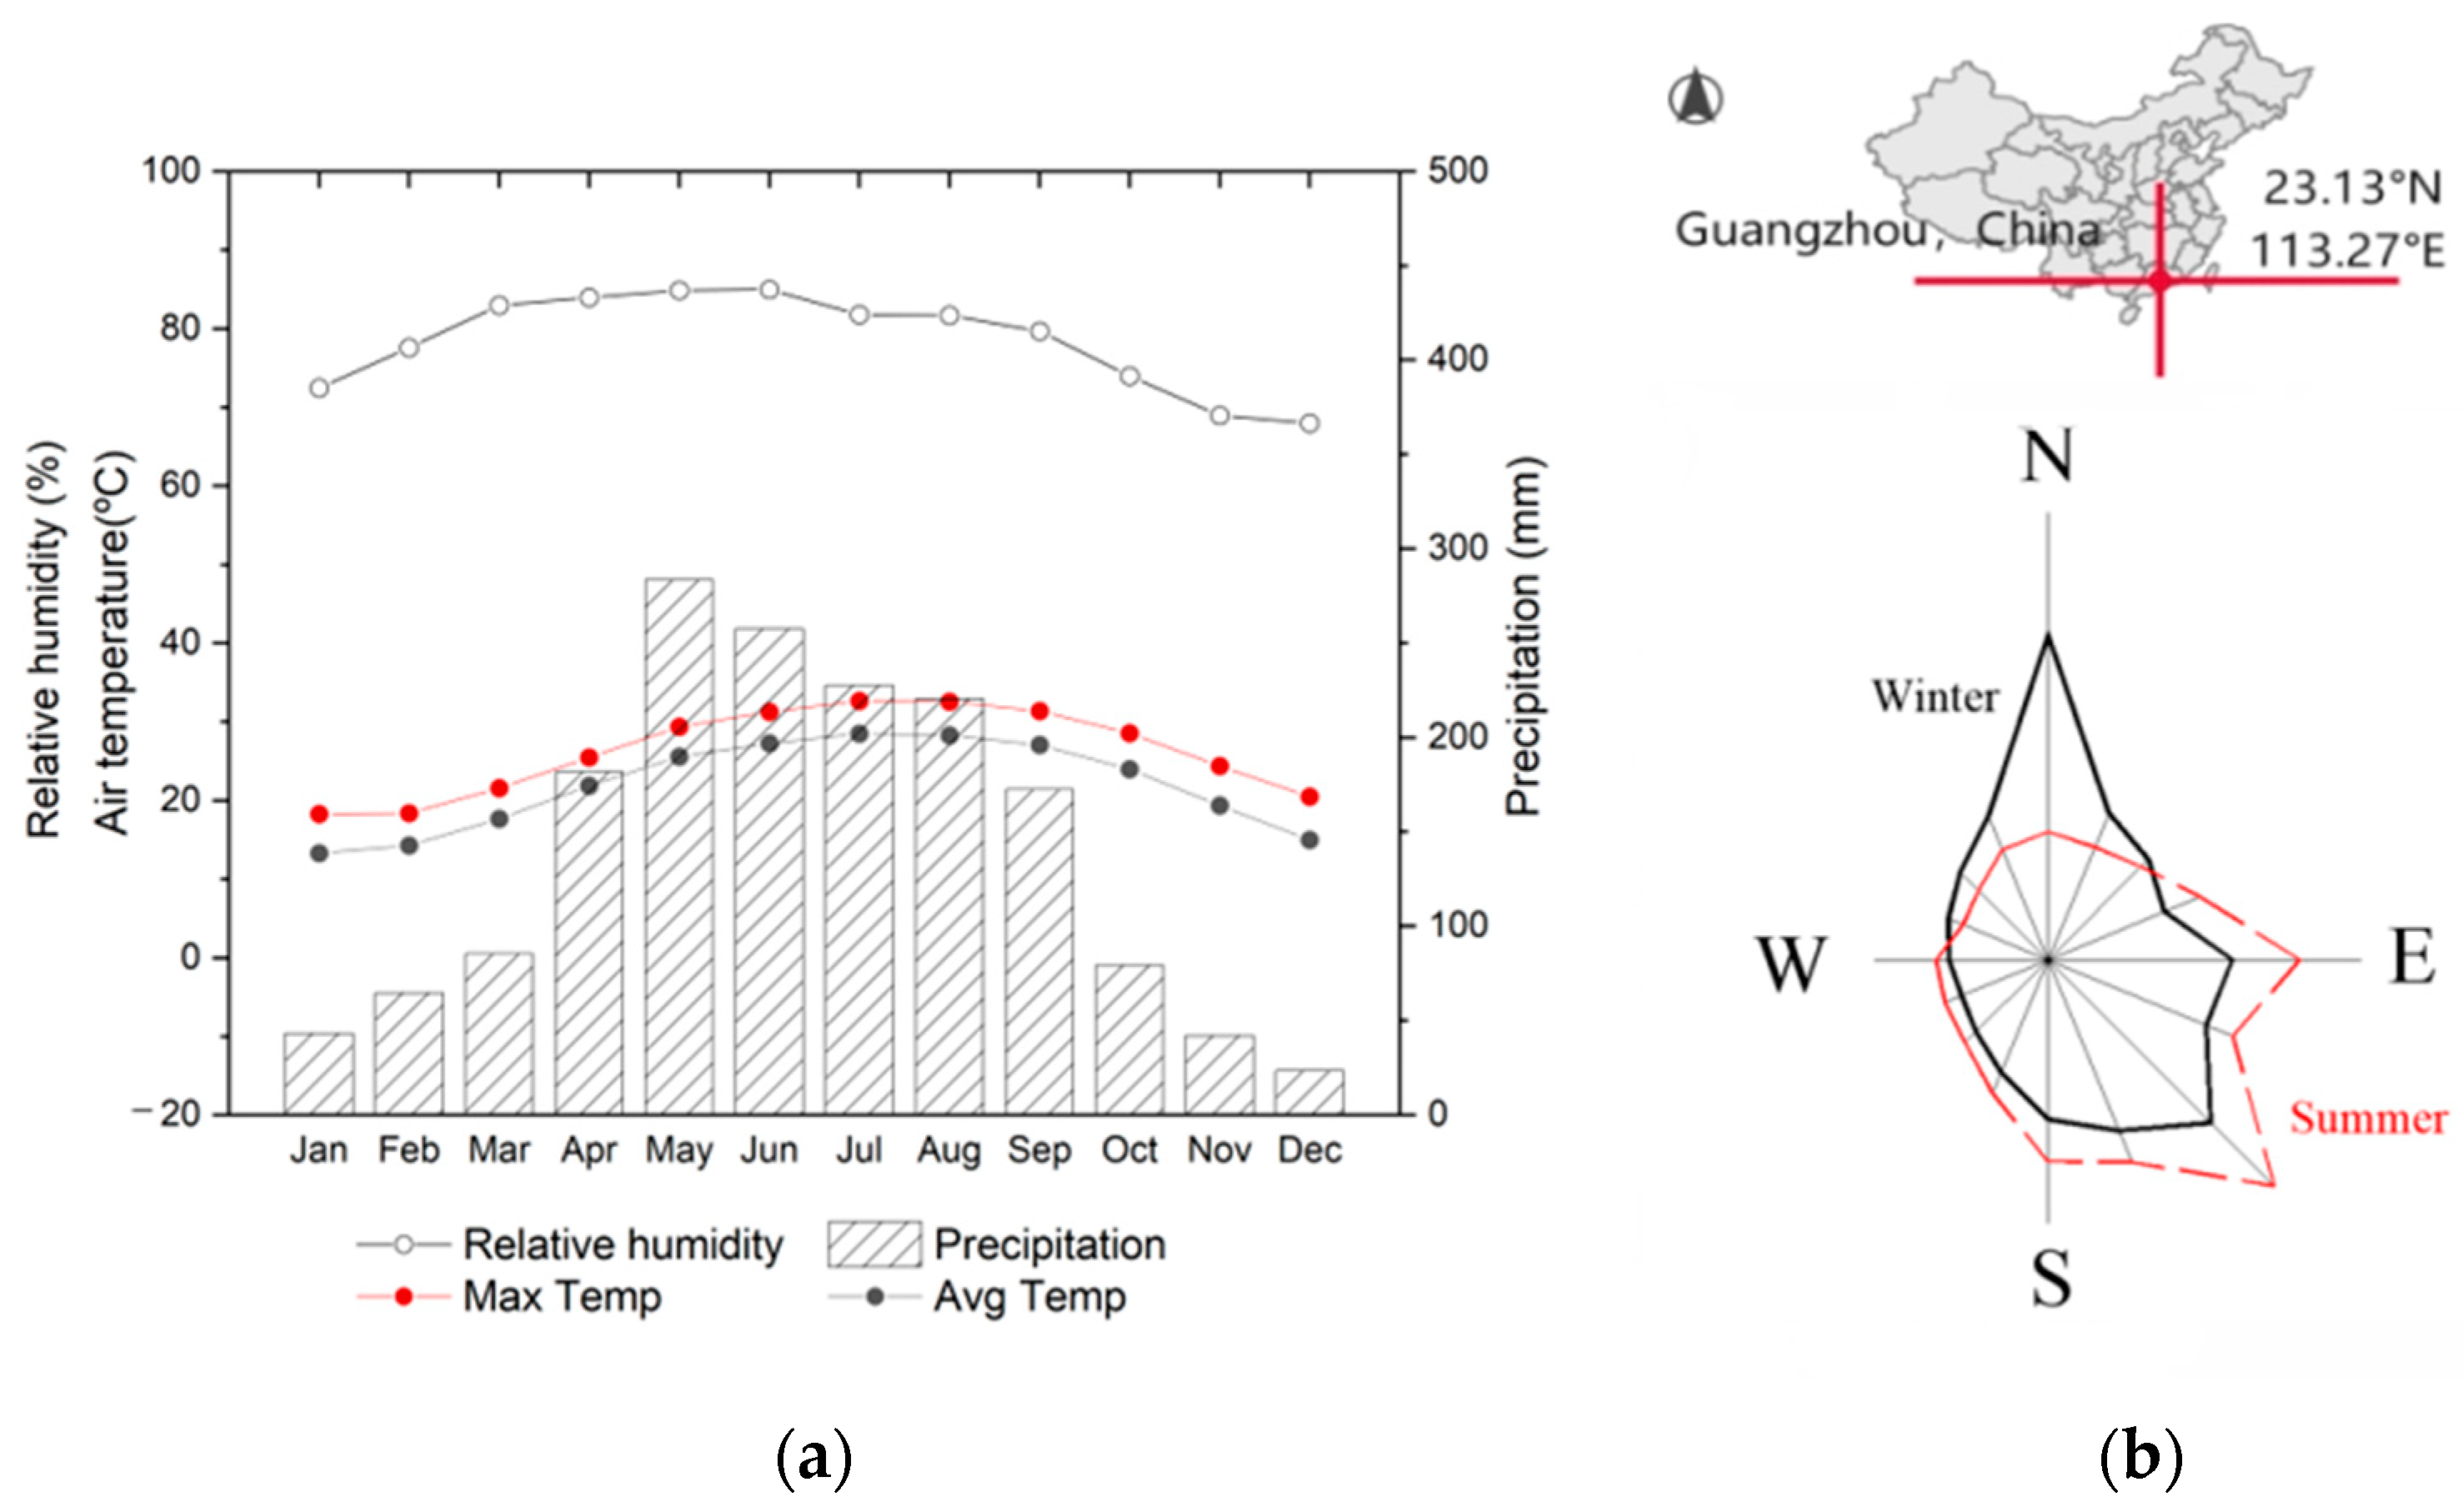
2.1. Study Area and Climate
2.2. Study Subjects
2.3. Field Measurements
3. Results and Analysis
3.1. Air Temperature (AT)
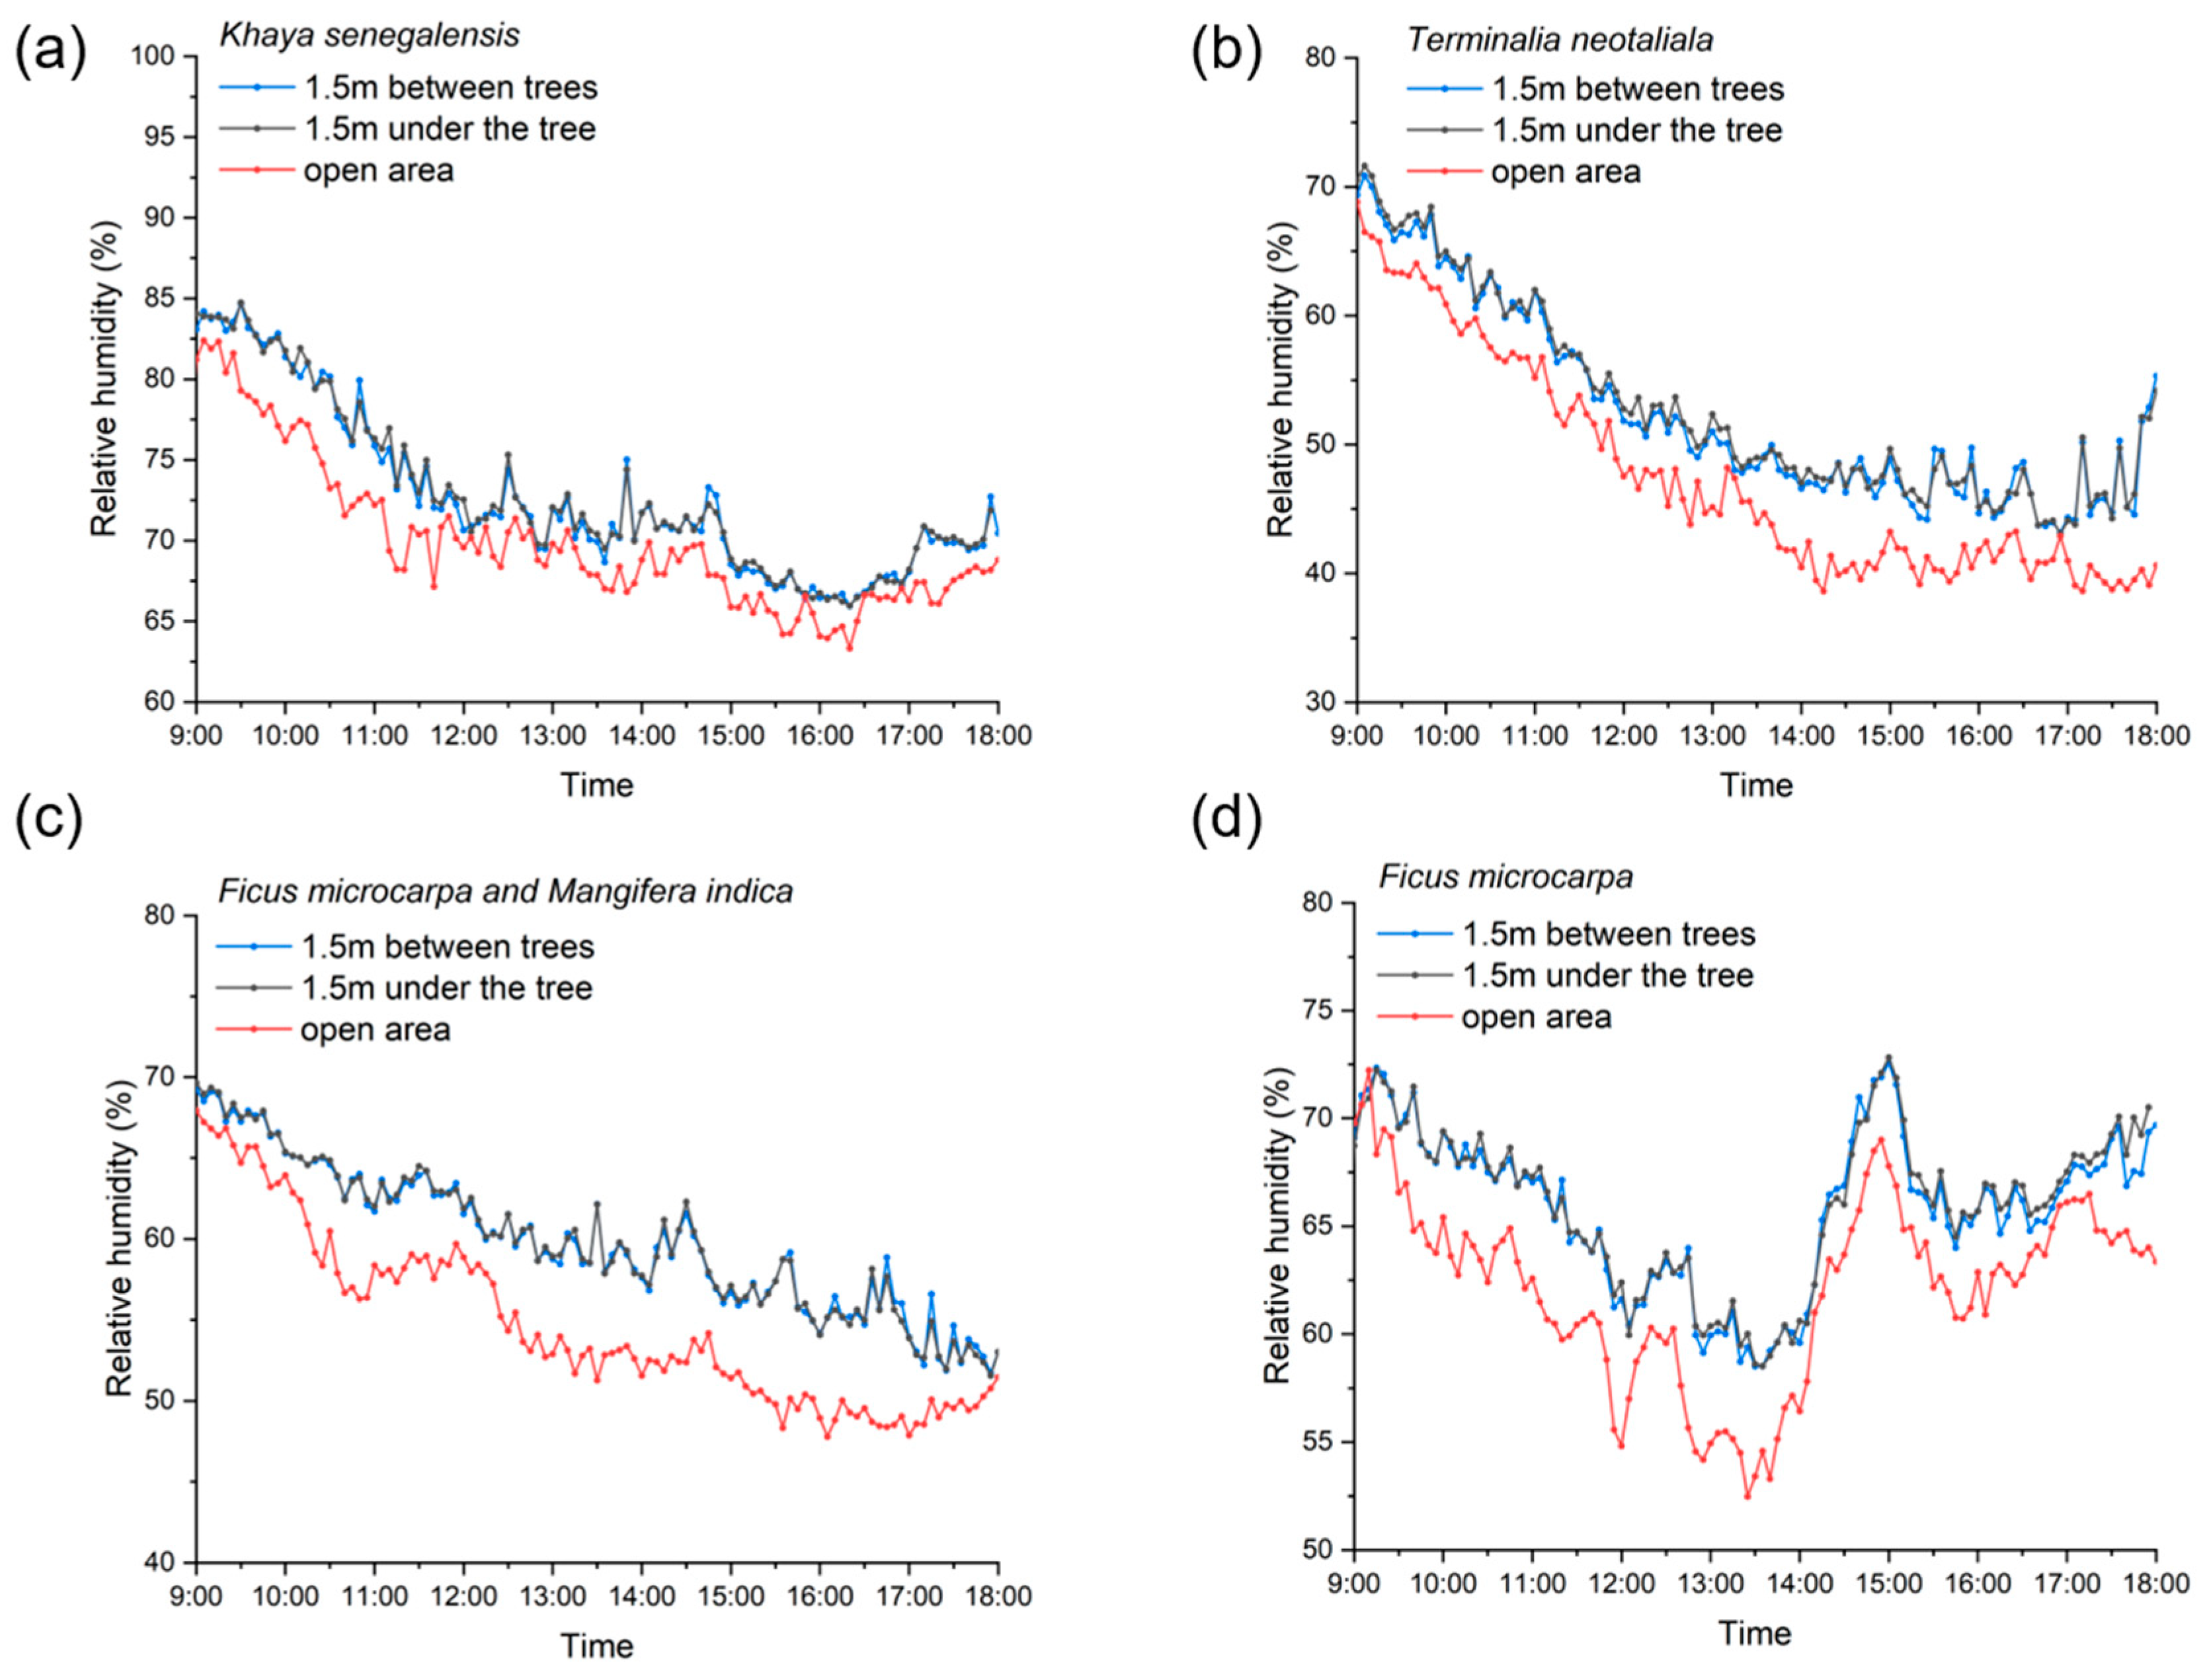
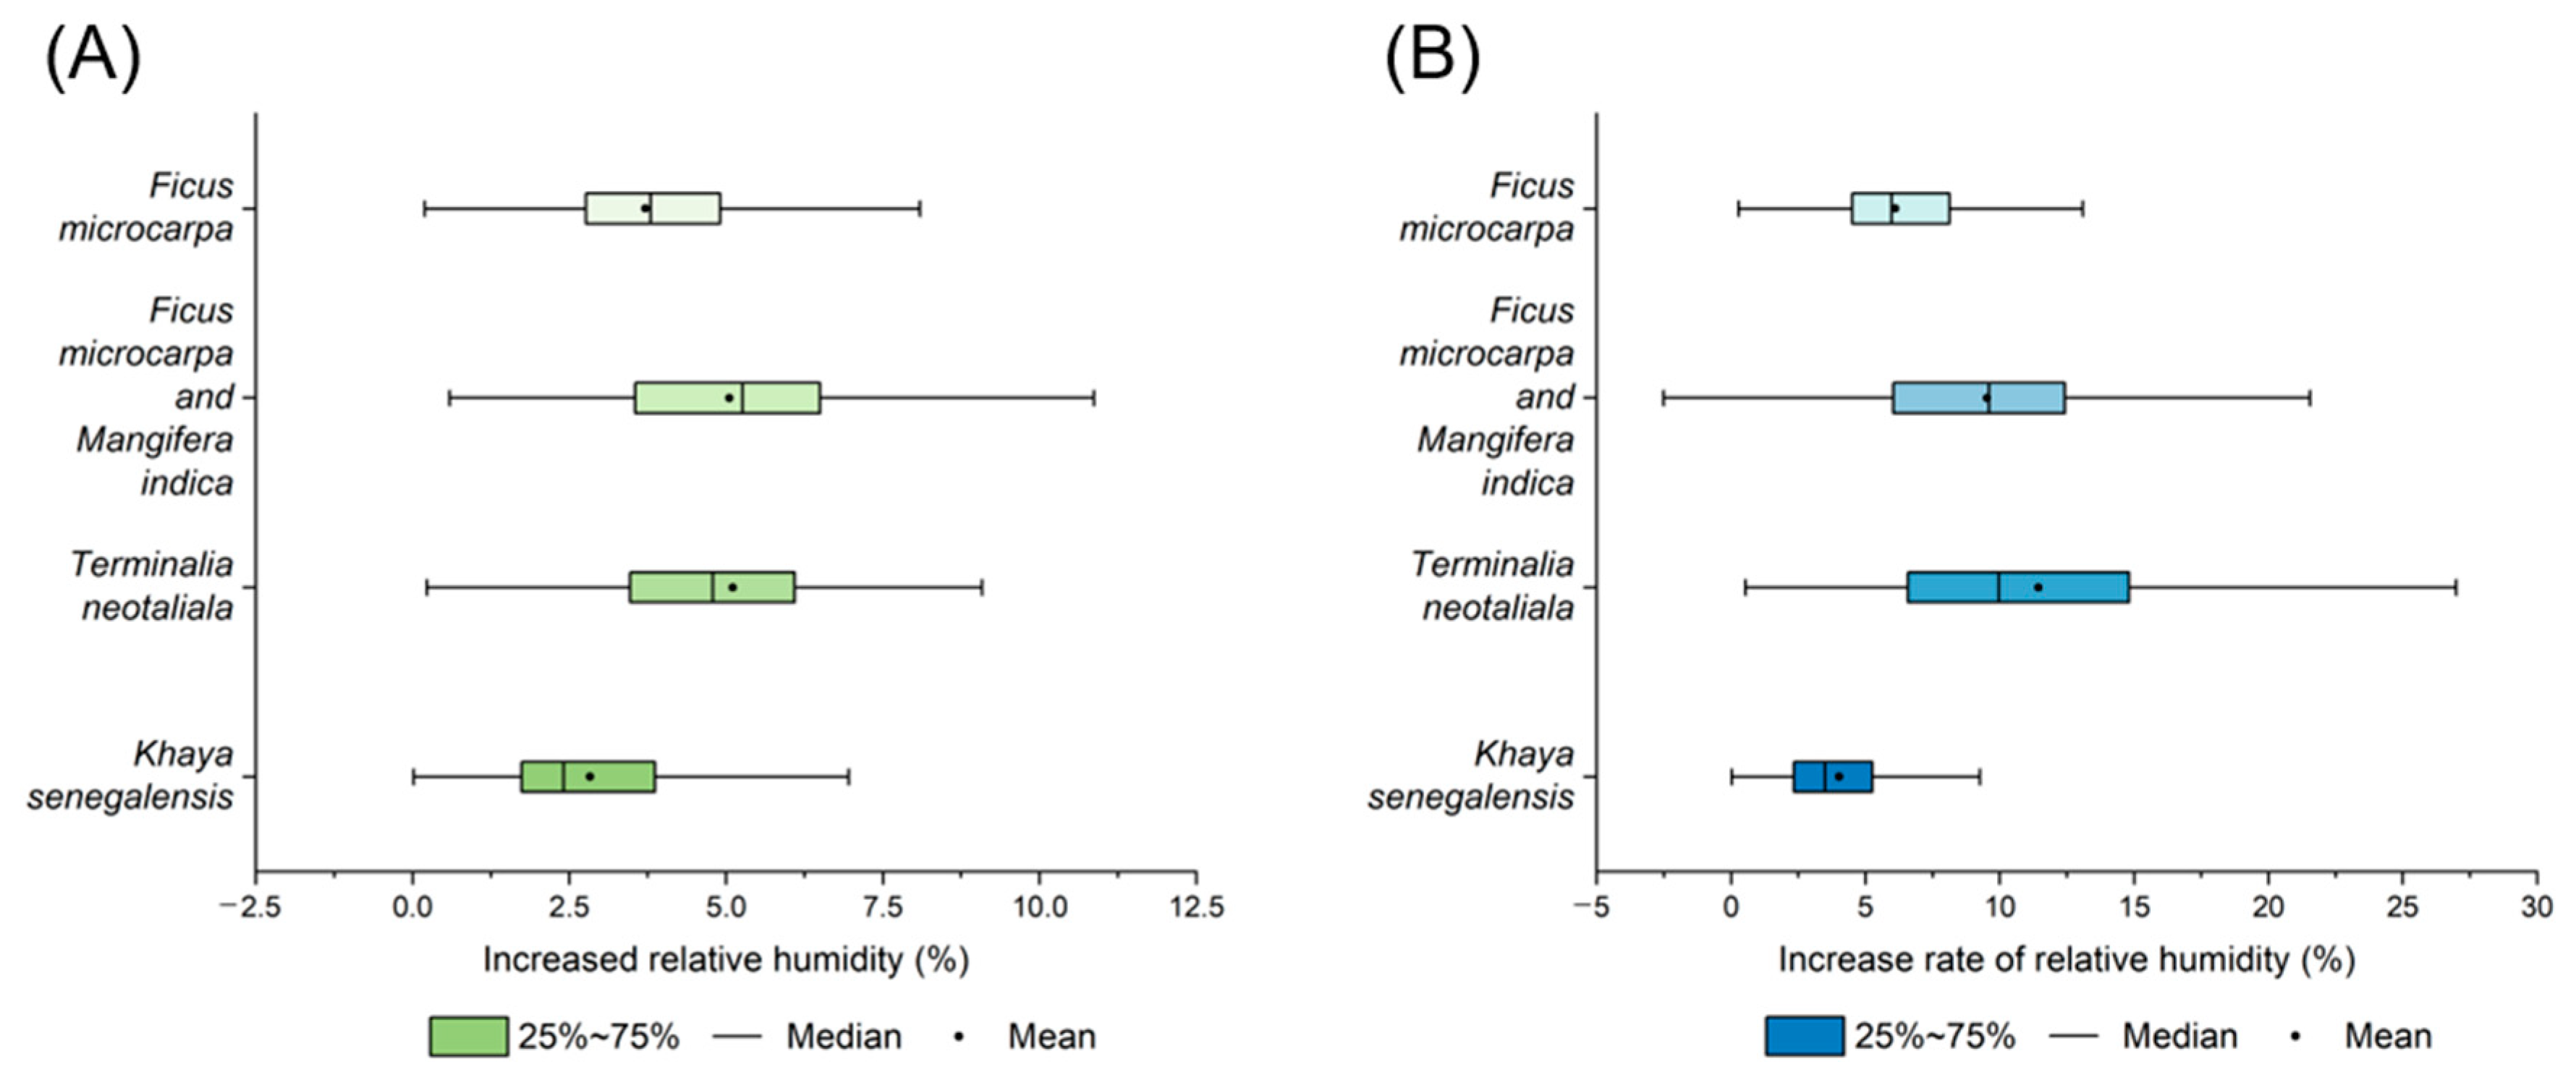
3.2. Relative Humidity (RH)
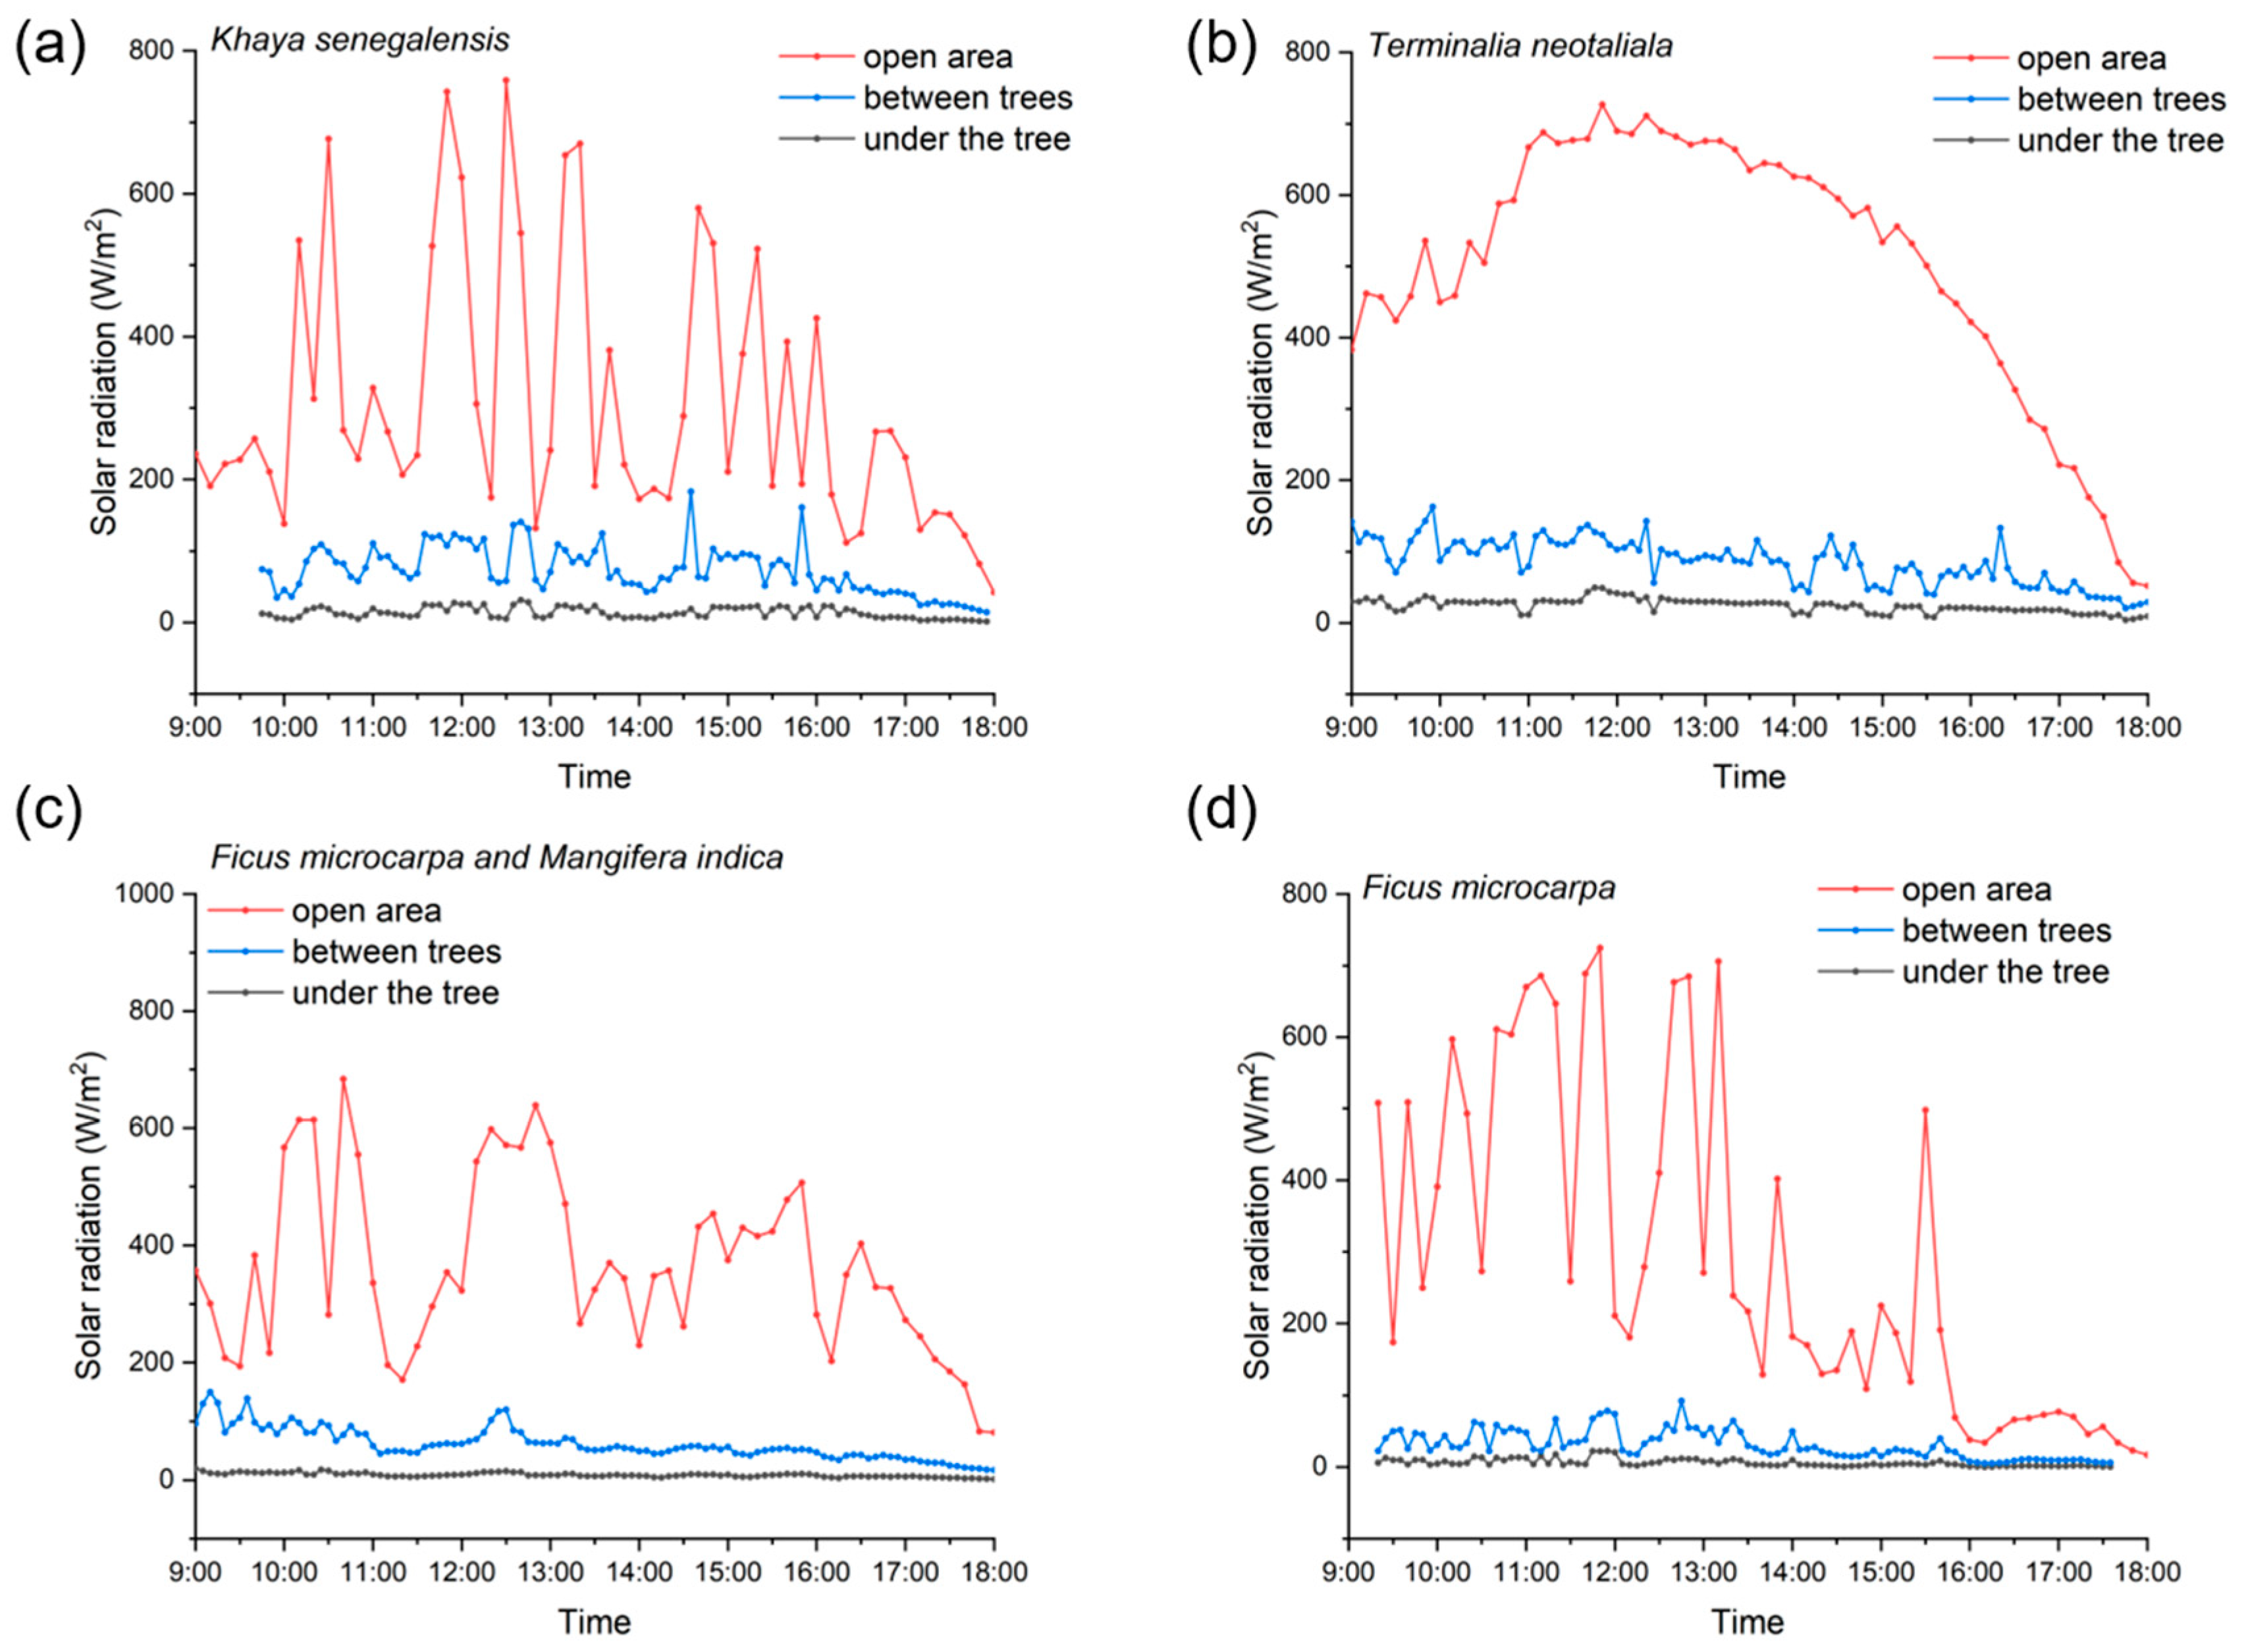
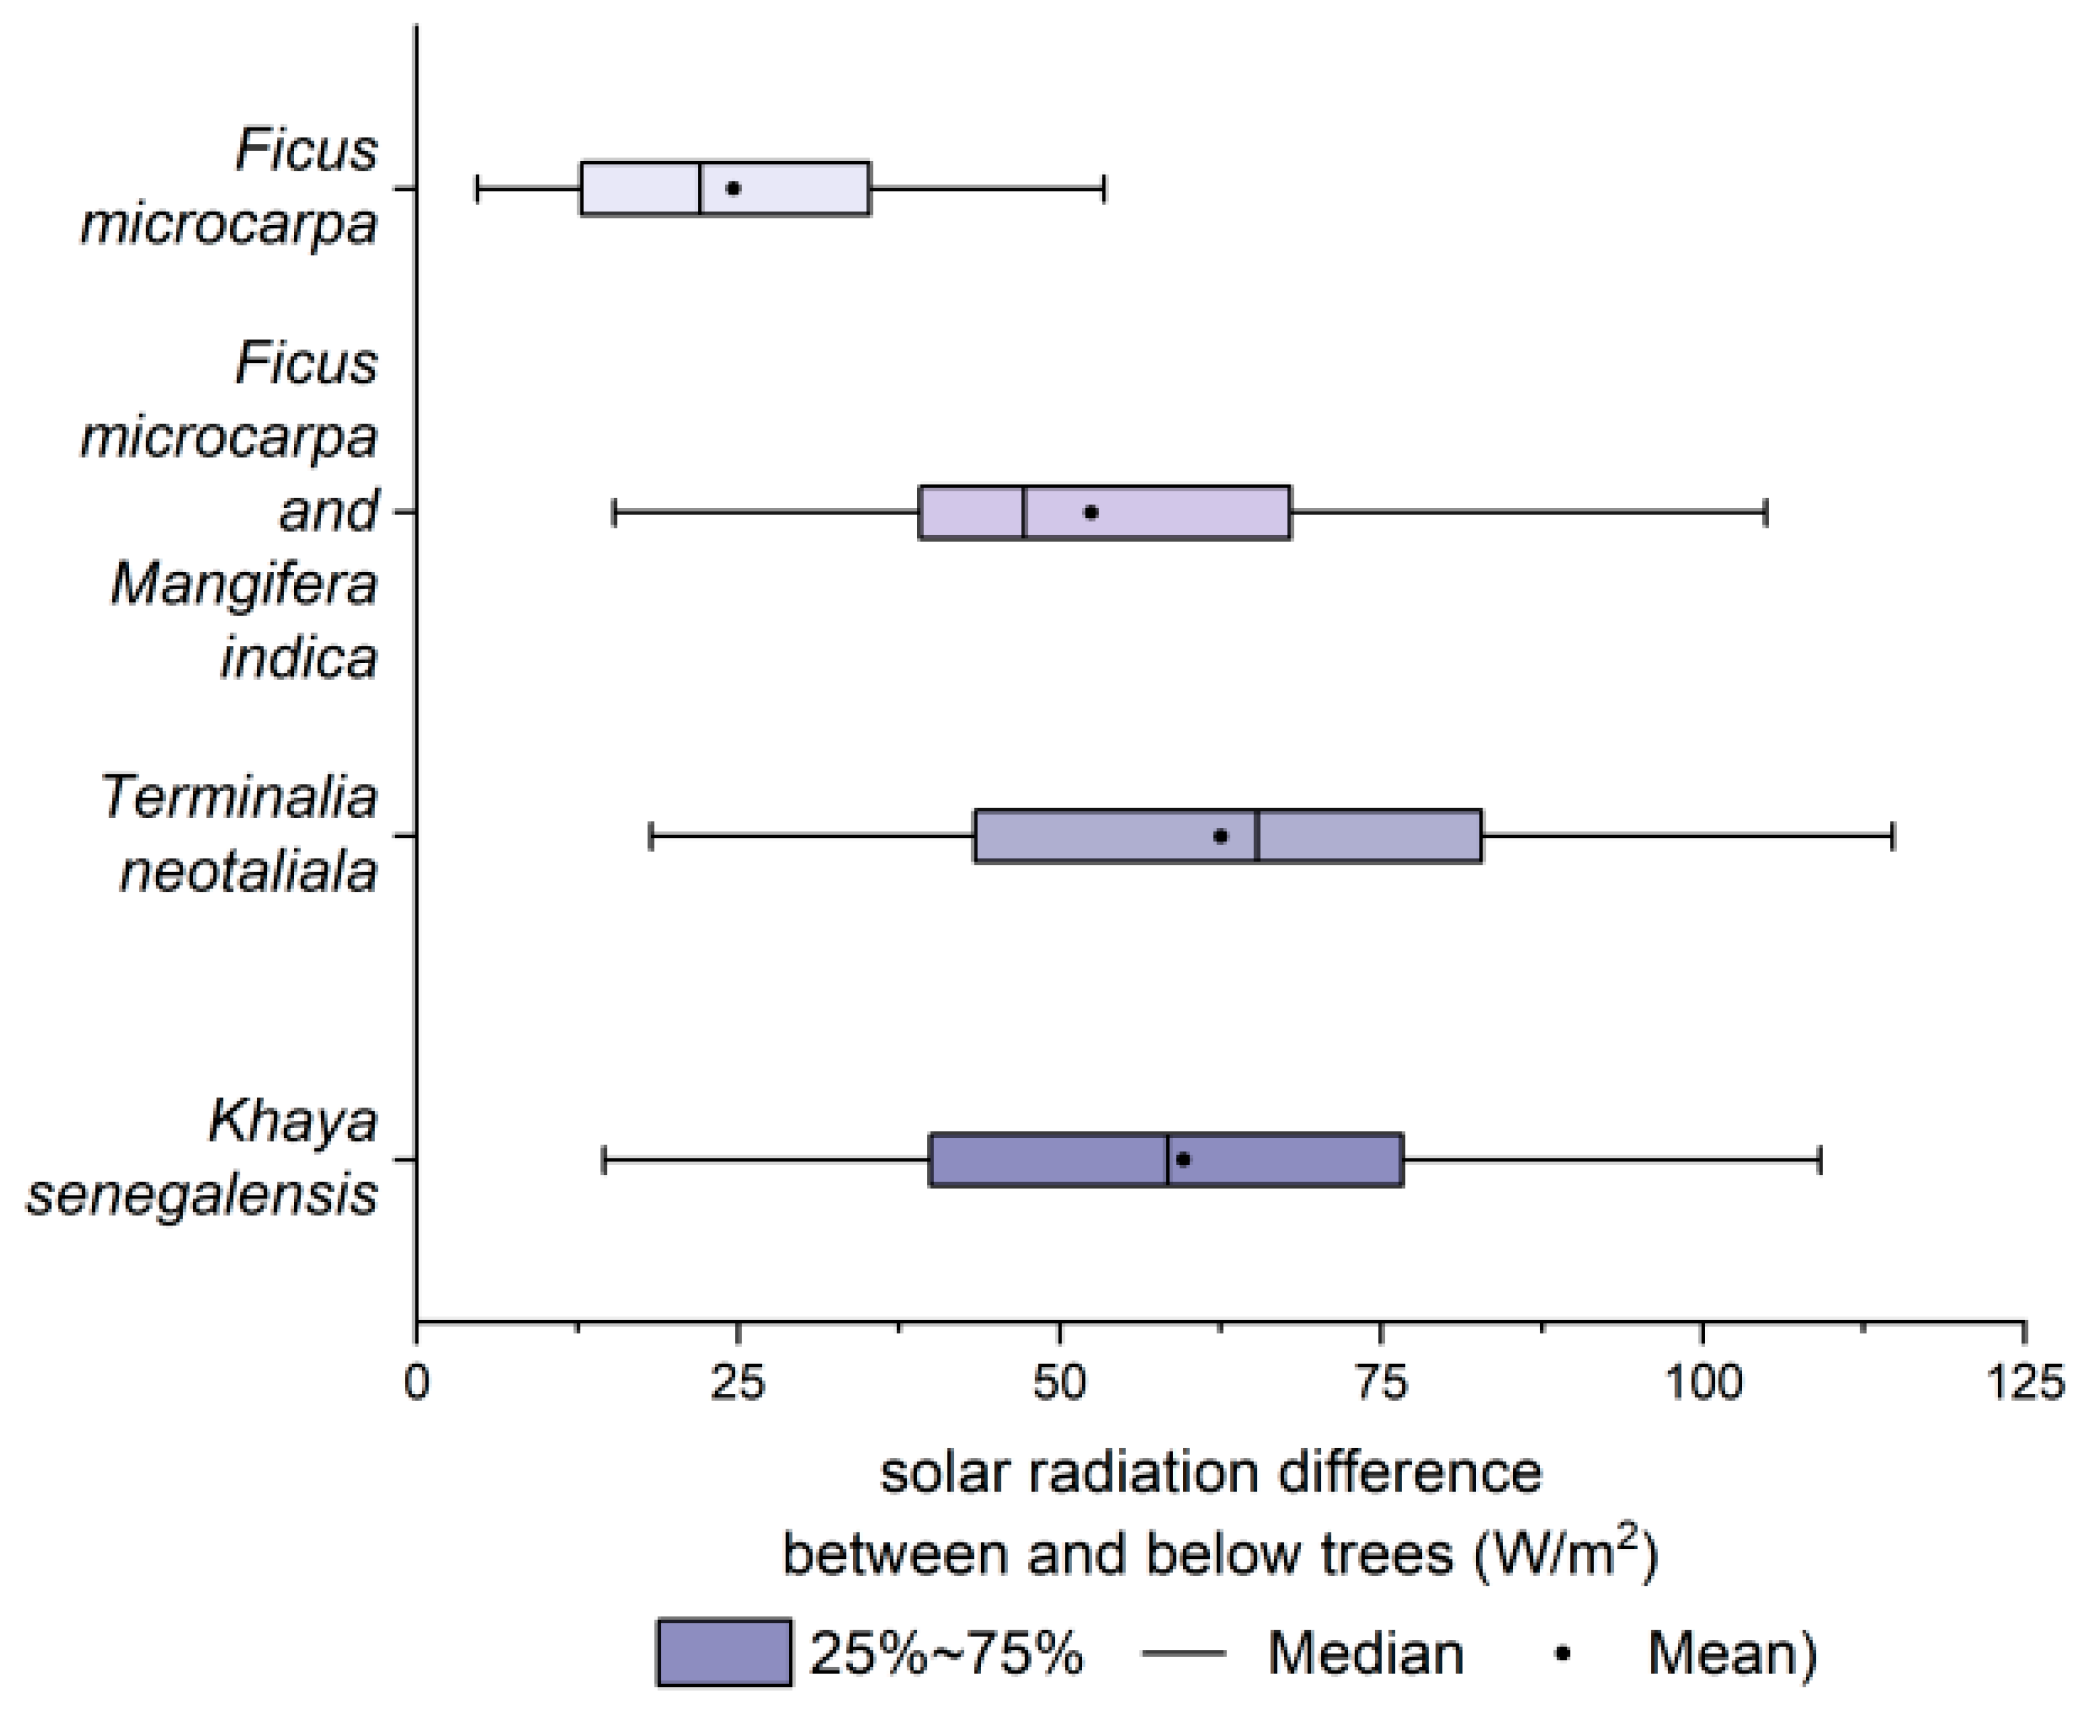
3.3. Solar Radiation (SR)
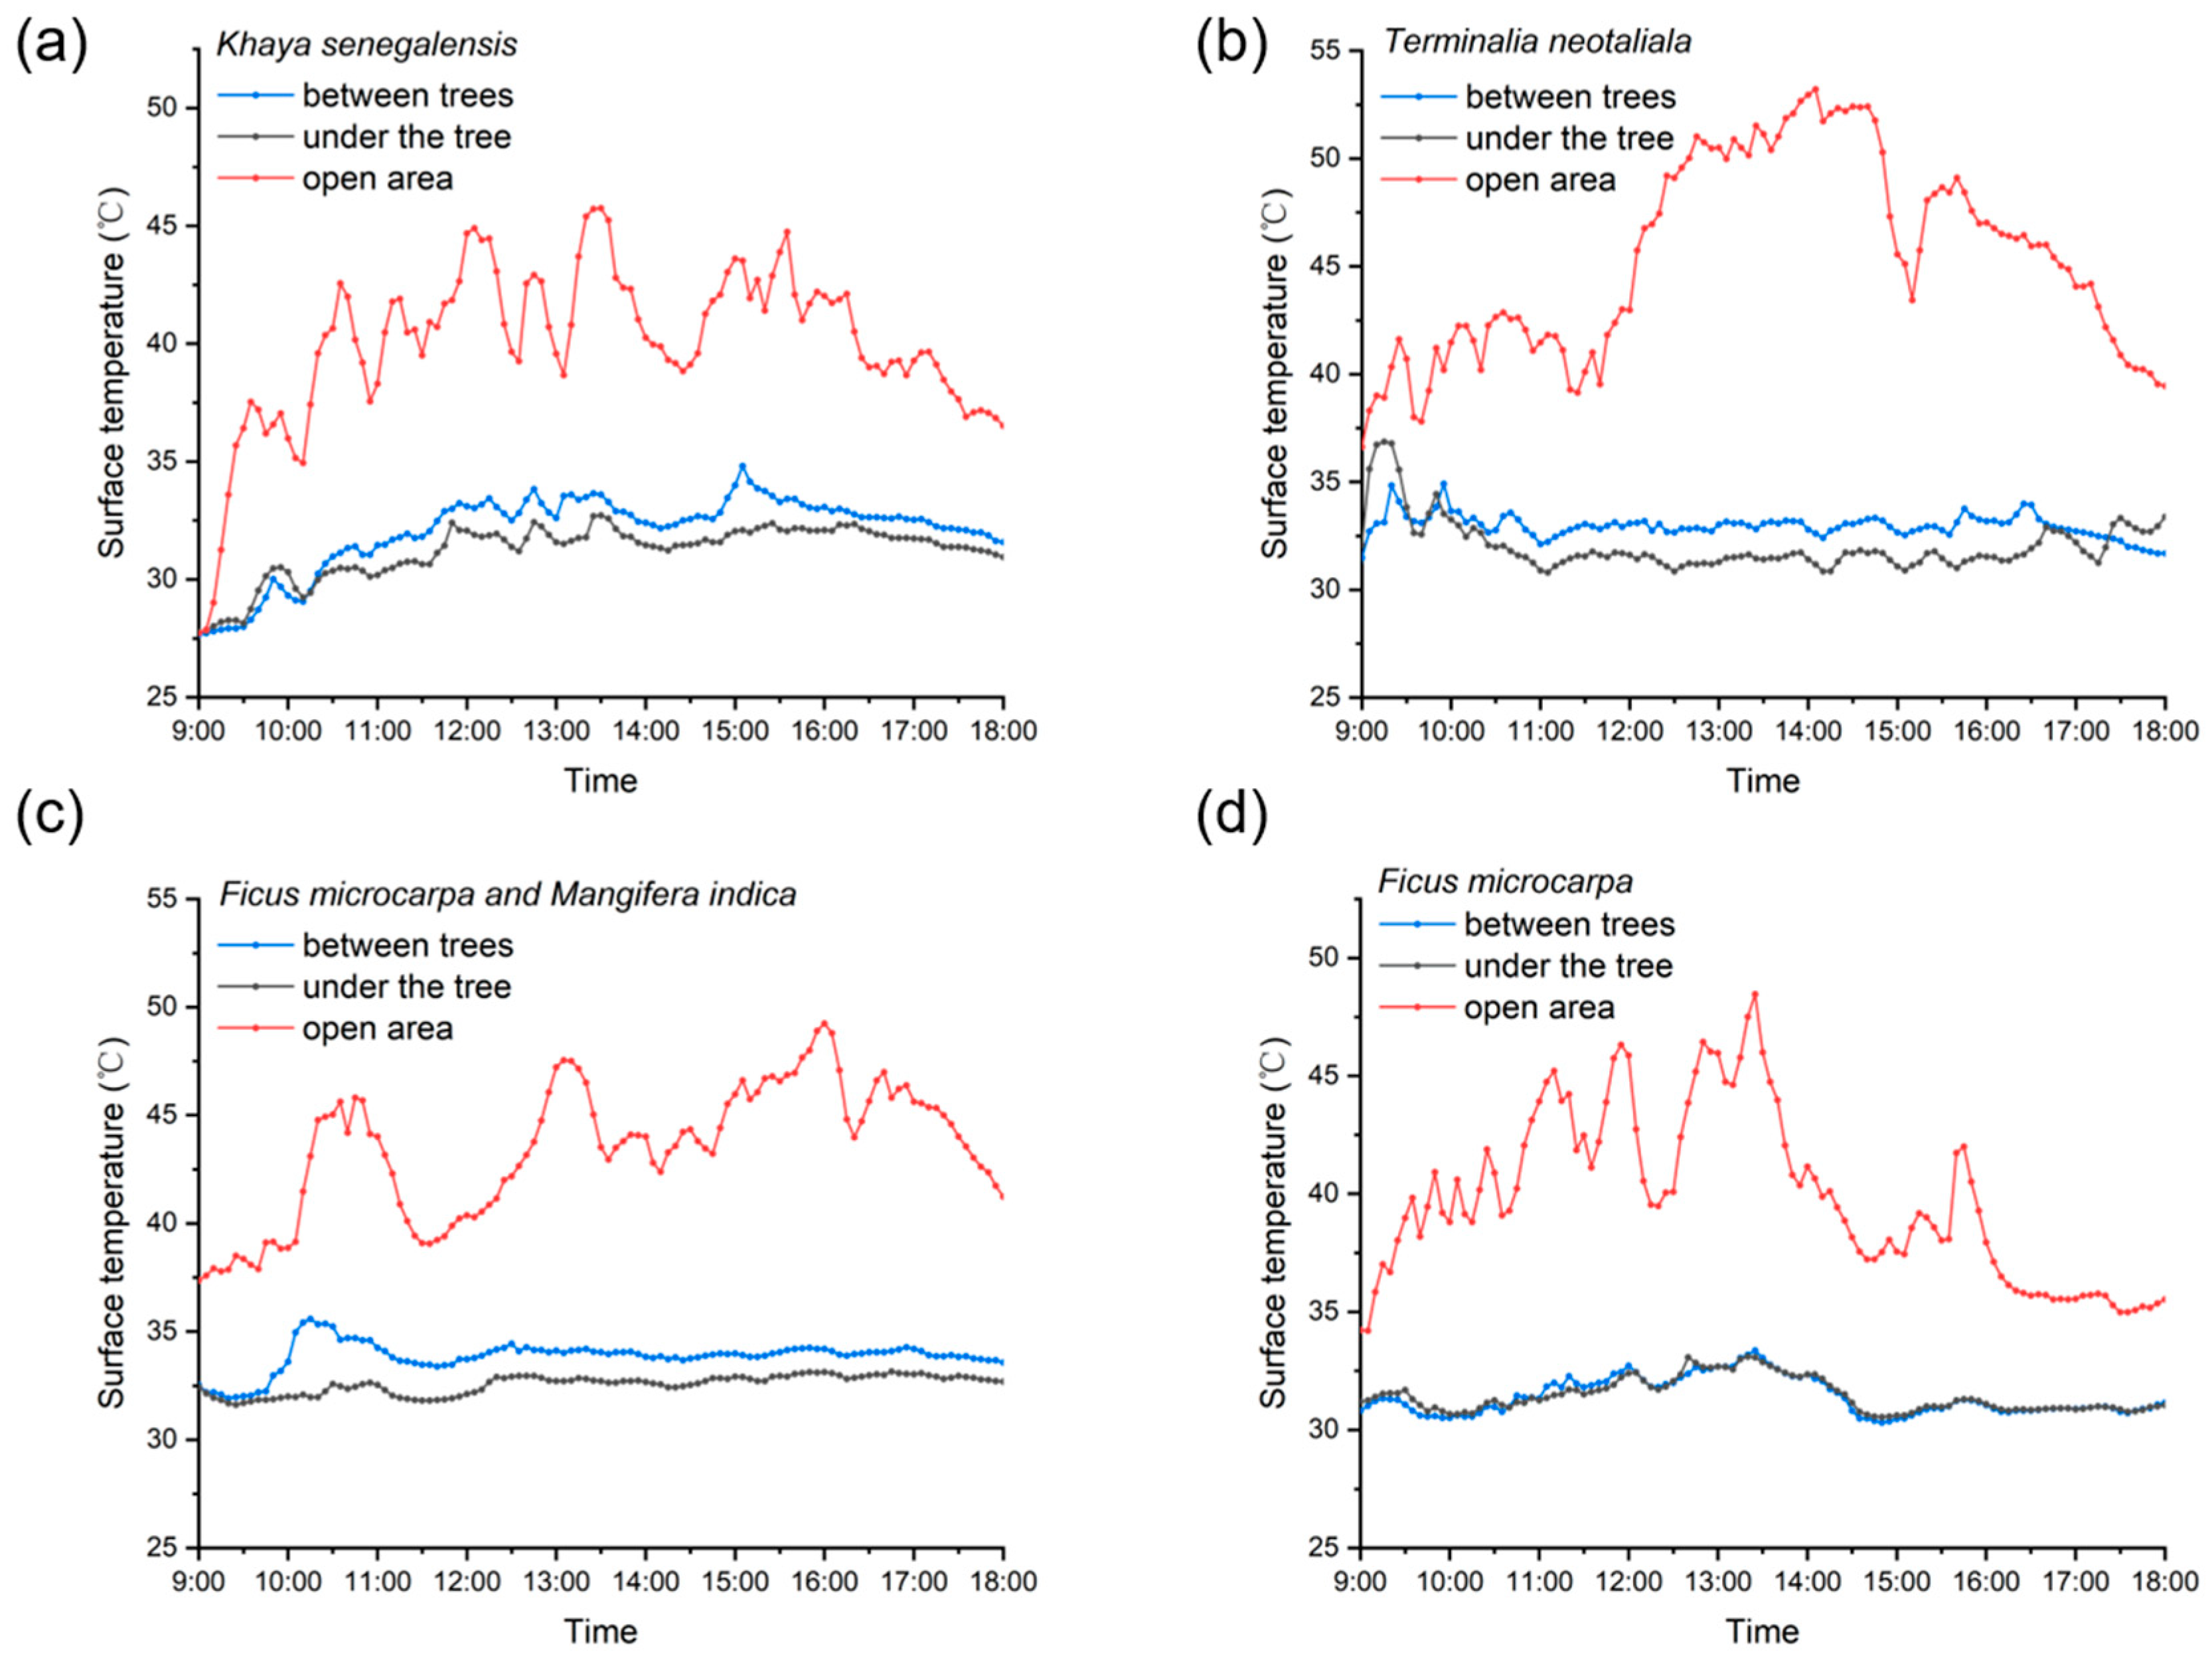
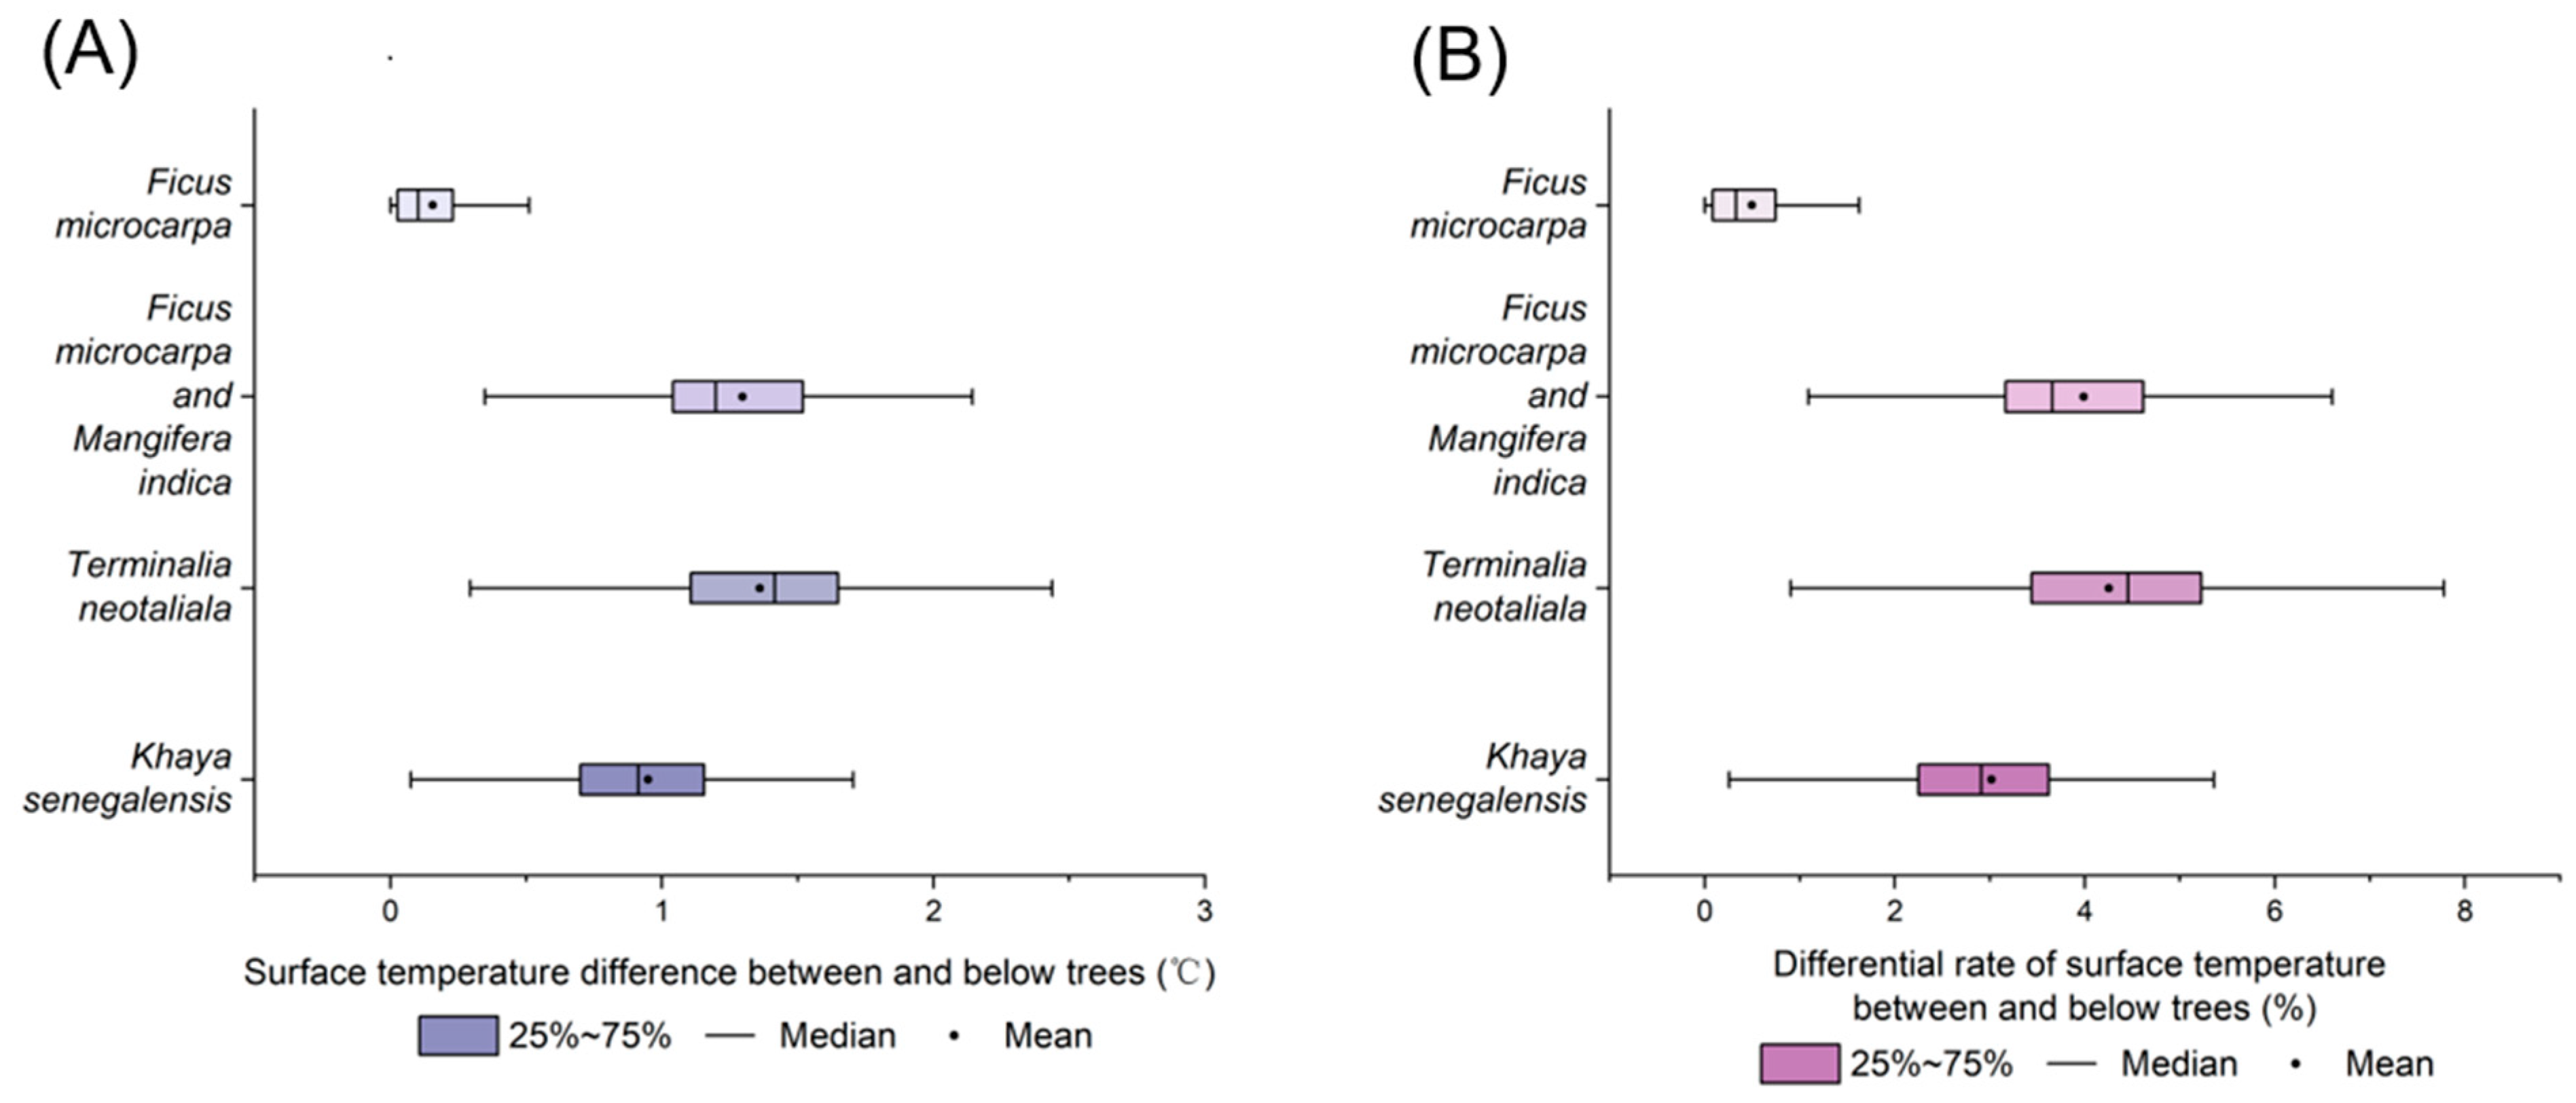
3.4. Surface Temperature (ST)
3.5. Wind Speed (WS)
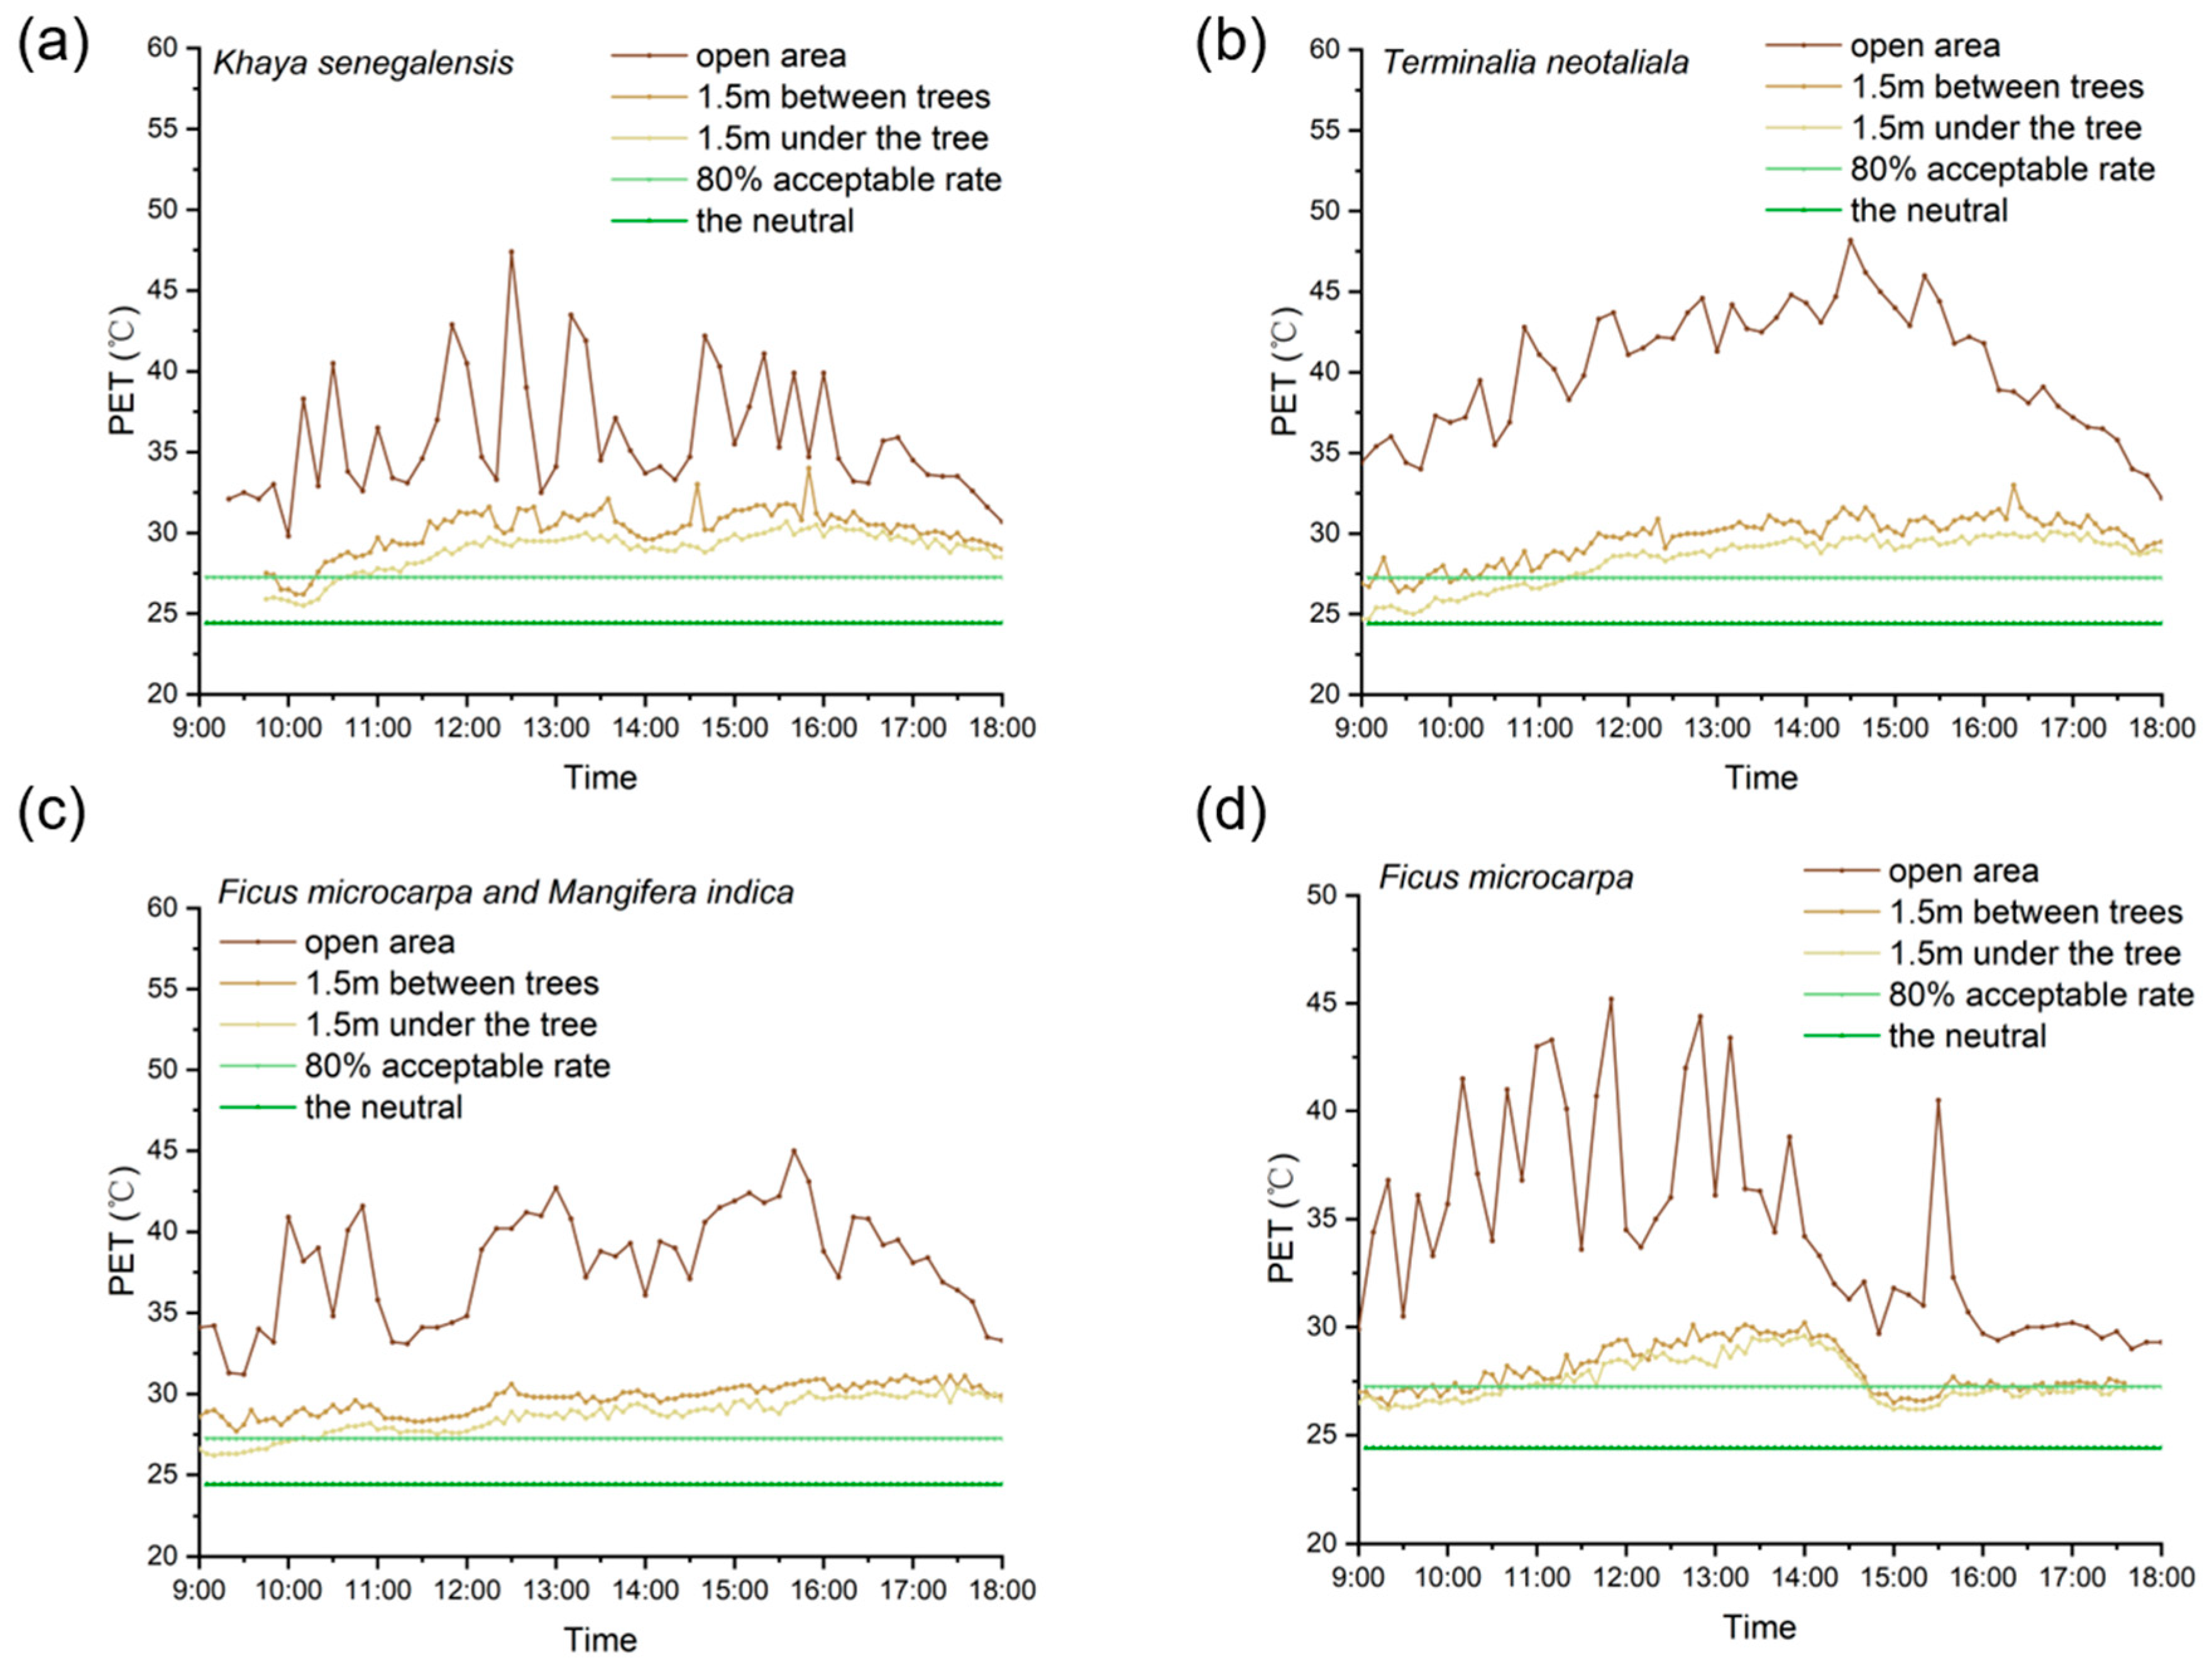
3.6. Physiologically Equivalent Temperature (PET)
3.7. Street Orientation
3.8. Planting Patterns
4. Discussion
4.1. Microclimatic Benefits of Street Trees in Transition Seasons
4.2. Under-Tree and Inter-Tree Microclimate Differences
4.3. Effect of Planting Patterns and Street Orientations on Microclimate Benefits
5. Limitations
6. Conclusions
- The four street tree species can significantly improve the thermal environment of street canyons with an average ΔAT of 1.45 °C (reduction rate of 4.33%), an average ΔST of 10.25 °C (reduction rate of 24.27%), and an average ΔPET of 8.34 °C (reduction rate of 22.09%). In the transition season, the maximum ΔAT and ΔPET for the four tree species are 1.82 °C and 12.4 °C, respectively, 0.7 °C and 4.1 °C lower than those in the subtropical summer. The minimum ΔPET of the four tree species is 5.7 °C, about 1 °C higher than in the temperate summer.
- Based on the potential of the four tree species for improving the outdoor thermal environment, the order of priority is as follows: Terminalia neotaliala > Mangifera indica > Ficus microcarpa > Khaya senegalensis. The differences in ΔST and ΔPET among the four species were only 0.76 °C and 0.25 °C, respectively.
- Among the four tree species, the inter-tree and under-tree differences averaged 0.06 °C for AT, 0.44% for RH, 0.91 °C for ST and 0.98 °C for PET. Therefore, while evaluating the overall microclimate benefits of street trees, the influence of inter-tree differences should be considered.
- The reduction rate of AT was 1.7 times greater in the double-row planting pattern than in the single-row planting pattern. With the same D/S value, a double-row planting pattern enhanced the stability of the under-tree and inter-tree ST and SR. ΔSR fluctuations under the canopy were less than 1% at a D/S ratio of 3 and above.
- In streets parallel to the prevailing summer wind direction (NW-SE) in Guangzhou, street trees in the shaded area yielded a 16.96% reduction in ΔWS. Trees in the NE-SW direction had the least ability to improve HTC. Compared to NE-SW, NW-SE had twice the AT reduction rate, while N-S had 1.3 times more reduction rate than NE-SW.
- A single-row planting pattern is recommended for streets with parallel prevailing winds, whereas a double-row planting pattern is better for streets that are perpendicular or at an angle to the prevailing wind direction to improve the HTC.
Author Contributions
Funding
Data Availability Statement
Conflicts of Interest
References
- Halder, B.; Bandyopadhyay, J.; Banik, P. Monitoring the effect of urban development on urban heat island based on remote sensing and geo-spatial approach in Kolkata and adjacent areas, India. Sustain. Cities Soc. 2021, 74, 103186. [Google Scholar] [CrossRef]
- Yao, L.; Sun, S.; Song, C.; Li, J.; Xu, W.; Xu, Y. Understanding the spatiotemporal pattern of the urban heat island footprint in the context of urbanization, a case study in Beijing, China. Appl. Geogr. 2021, 133, 102496. [Google Scholar] [CrossRef]
- Liu, H.; Huang, B.; Gao, S.; Wang, J.; Yang, C.; Li, R. Impacts of the evolving urban development on intra-urban surface thermal environment: Evidence from 323 Chinese cities. Sci. Total Environ. 2021, 771, 144810. [Google Scholar] [CrossRef] [PubMed]
- Jamei, E.; Rajagopalan, P.; Seyedmahmoudian, M.; Jamei, Y. Review on the impact of urban geometry and pedestrian level greening on outdoor thermal comfort. Renew. Sustain. Energy Rev. 2016, 54, 1002–1017. [Google Scholar] [CrossRef]
- Mora, C.; Dousset, B.; Caldwell, I.R.; Powell, F.E.; Geronimo, R.C.; Bielecki, C.R.; Counsell, C.W.W.; Dietrich, B.S.; Johnston, E.T.; Louis, L.V.; et al. Global risk of deadly heat. Nat. Clim. Chang. 2017, 7, 501–506. [Google Scholar] [CrossRef]
- Manoli, G.; Fatichi, S.; Bou-Zeid, E.; Katul, G. Seasonal hysteresis of surface urban heat islands. Proc. Natl. Acad. Sci. USA 2020, 117, 7082–7089. [Google Scholar] [CrossRef] [PubMed]
- Liu, X.; Moayedi, H.; Ahmadi Dehrashid, A.; Dai, W.; Thi, Q.T. Developments and evolution of housing architecture in the post-Corona era with a health-oriented approach. Build. Environ. 2024, 111936. [Google Scholar] [CrossRef]
- Jamei, Y.; Rajagopalan, P.; Sun, Q. Spatial structure of surface urban heat island and its relationship with vegetation and built-up areas in Melbourne, Australia. Sci. Total Environ. 2019, 659, 1335–1351. [Google Scholar] [CrossRef] [PubMed]
- Wang, Z.; Zhao, X.; Yang, J.C.; Song, J.Y. Cooling and energy saving potentials of shade trees and urban lawns in a desert city. Appl. Energy 2016, 161, 437–444. [Google Scholar] [CrossRef]
- Zhao, Q.; Sailorb, D.J.; Wentza, E.A. Impact of tree locations and arrangements on outdoor microclimates and human thermal comfort in an urban residential environment. Urban For. Urban Green. 2018, 32, 81–91. [Google Scholar] [CrossRef]
- Darvish, A.; Eghbali, G.; Eghbali, S.R. Tree-configuration and species effects on the indoor and outdoor thermal condition and energy performance of courtyard buildings. Urban Clim. 2021, 37, 100861. [Google Scholar] [CrossRef]
- Manickathan, L.; Defraeye, T.; Allegrini, J.; Derome, D.; Carmeliet, J. Parametric study of the influence of environmental factors and tree properties on the transpirative cooling effect of trees. Agric. For. Meteorol. 2018, 248, 259–274. [Google Scholar] [CrossRef]
- Meili, N.; Manoli, G.; Burlando, P.; Carmeliet, L.; Chow, W.T.L.; Coutts, A.M.; Roth, M.; Velasco, E.; Vivoni, E.T.; Fatichi, S. Tree effects on urban microclimate: Diurnal, seasonal, and climatic temperature differences explained by separating radiation, evapotranspiration, and roughness effects. Urban For. Urban Green. 2021, 58, 126970. [Google Scholar] [CrossRef]
- Schlesinger, W.H.; Jasechko, S. Transpiration in the global water cycle. Agric. For. Meteorol. 2014, 189–190, 115–117. [Google Scholar] [CrossRef]
- Zou, Z.D.; Yang, Y.J.; Qiu, G.Y. Quantifying the Evapotranspiration Rate and Its Cooling Effects of Urban Hedges Based on Three-Temperature Model and Infrared Remote Sensing. Remote Sens. 2019, 11, 202. [Google Scholar] [CrossRef]
- Gillner, S.; Vogt, J.; Tharang, A.; Dettmann, S.; Roloff, A. Role of street trees in mitigating effects of heat and drought at highly sealed urban sites. Landsc. Urban Plan. 2015, 143, 33–42. [Google Scholar] [CrossRef]
- Shashua-Bar, L.; Potchter, O.; Bitan, A.; Boltansky, D.; Yaakov, Y. Microclimate modelling of street tree species effects within the varied urban morphology in the Mediterranean city of Tel Aviv, Israel. Int. J. Climatol. 2009, 30, 44–57. [Google Scholar] [CrossRef]
- Brown, R.D.; Gillespie, T.J. Microclimate Landscape Design: Creating Thermal Comfort and Energy Efficiency; John Wiley & Sons: New York, NY, USA, 1995. [Google Scholar]
- Deng, J.; Pickles, B.J.; Shao, L. In-situ spectroscopy and shortwave radiometry reveals spatial and temporal variation in the crown-level radiative performance of urban trees. Remote Sens. Environ. 2021, 253, 112231. [Google Scholar] [CrossRef]
- Coutts, A.M.; White, E.C.; Tapper, N.J.; Beringer, J.; Livesley, S.J. Temperature and human thermal comfort effects of street trees across three contrasting street canyon environments. Theor. Appl. Climatol. 2016, 124, 55–68. [Google Scholar] [CrossRef]
- Abreu-Harbich, L.V.D.; Labaki, L.C.; Matzarakis, A. Different trees and configuration as microclimate control strategy in Tropics. In Proceedings of the ICUC8—8th International Conference on Urban Climates, Dublin, Ireland, 6–10 August 2012. [Google Scholar]
- Abreu-Harbicha, L.V.; Labakia, L.C.; Matzarakis, A. Effect of tree planting design and tree species on human thermal comfort in the tropics. Landsc. Urban Plan. 2015, 138, 99–109. [Google Scholar] [CrossRef]
- Rahman, M.A.; Hartmann, C.; Moser-Reischl, A.; von Strachwitz, M.F.; Paeth, H.; Pretzsch, H.; Pauleit, S.; Rötzer, T. Tree cooling effects and human thermal comfort under contrasting species and sites. Agric. For. Meteorol. 2020, 287, 107947. [Google Scholar] [CrossRef]
- Lin, B.-S.; Lin, Y.-J. Cooling effect of shade trees with different characteristics in a subtropical urban park. HortScience 2010, 45, 83–86. [Google Scholar] [CrossRef]
- Morakinyo, T.E.; Kong, L.; Lau, K.K.; Yuan, C.; Ng, E. A study on the impact of shadow-cast and tree species on in-canyon and neighborhood’s thermal comfort. Build. Environ. 2017, 115, 1–17. [Google Scholar] [CrossRef]
- Xiong, Y.; Zhang, J.P.; Xu, X.Y.; Yan, Y.; Sun, S.; Liu, S. Strategies for improving the microclimate and thermal comfort of a classical Chinese garden in the hot-summer and cold-winter zone. Energy Build. 2020, 215, 109914. [Google Scholar] [CrossRef]
- Leuzingera, S.; Vogt, R.; Körner, C. Tree surface temperature in an urban environment. Agric. For. Meteorol. 2010, 150, 56–62. [Google Scholar] [CrossRef]
- Yu, Z.W.; Xu, S.B.; Zhang, Y.H.; Jorgensen, G.; Vejre, H. Strong contributions of local background climate to the cooling effect of urban green vegetation. Sci. Rep. 2018, 8, 6798. [Google Scholar] [CrossRef]
- Hong, B.; Lin, B. Numerical studies of the outdoor wind environment and thermal comfort at pedestrian level in housing blocks with different building layout patterns and trees arrangement. Renew. Energy 2015, 73, 18–27. [Google Scholar] [CrossRef]
- Hsieha, C.M.; Jan, F.C.; Zhang, L. A simplifified assessment of how tree allocation, wind environment, and shading affect human comfort. Urban For. Urban Green. 2016, 18, 126–137. [Google Scholar] [CrossRef]
- Wu, Z.; Chen, L. Optimizing the spatial arrangement of trees in residential neighborhoods for better cooling effects: Integrating modeling with in-situ measurements. Landsc. Urban Plan. 2017, 167, 463–472. [Google Scholar] [CrossRef]
- Li, G.; Ren, Z.; Zhan, C. Sky View Factor-based correlation of landscape morphology and the thermal environment of street canyons: A case study of Harbin, China. Build. Environ. 2020, 169, 106587. [Google Scholar] [CrossRef]
- Krüger, E.; Drach, P.; Emmanuel, R.; Corbella, O. Urban heat island and differences in outdoor comfort levels in Glasgow, UK. Theor. Appl. Clim. 2013, 112, 127–141. [Google Scholar] [CrossRef]
- Taleghani, M.; Kleerekoper, L.; Tenpierik, M.; van den Dobbelsteen, A. Outdoor thermal comfort within five different urban forms in the Netherlands. Build. Environ. 2014, 83, 65–78. [Google Scholar] [CrossRef]
- Fan, C.; Myint, S.W.; Zheng, B. Measuring the spatial arrangement of urban vegetation and its impacts on seasonal surface temperatures. Prog. Phys. Geogr. Earth Environ. 2015, 39, 199–219. [Google Scholar] [CrossRef]
- Rahman, M.A.; Stratopoulos, L.M.; Moser-Reischl, A.; Zölch, T.; Häberle, K.H.; Rötzer, T.; Pretzsch, H.; Pauleit, S. Traits of trees for cooling urban heat islands: A meta-analysis. Build. Environ. 2020, 170, 106606. [Google Scholar] [CrossRef]
- Jia, S.; Wang, Y. Effect of heat mitigation strategies on thermal environment, thermal comfort, and walkability: A case study in Hong Kong. J. Affect. Disord. 2021, 201, 107988. [Google Scholar] [CrossRef]
- Park, M.; Hagishima, A.; Tanimoto, J.; Narita, K.-I. Effect of urban vegetation on outdoor thermal environment: Field measurement at a scale model site. J. Affect. Disord. 2012, 56, 38–46. [Google Scholar] [CrossRef]
- Zhou, W.; Wang, J.; Cadenasso, M.L. Effects of the spatial configuration of trees on urban heat mitigation: A comparative study. Remote. Sens. Environ. 2017, 195, 1–12. [Google Scholar] [CrossRef]
- Langenheim, N.; White, M.; Tapper, N.; Livesley, S.J.; Ramirez-Lovering, D. Right tree, right place, right time: A visual-functional design approach to select and place trees for optimal shade benefit to commuting pedestrians. Sustain. Cities Soc. 2020, 52, 101816. [Google Scholar] [CrossRef]
- Dimoudi, A.; Nikolopoulou, M. Vegetation in the urban environment: Microclimatic analysis and benefits. Energy Build. 2003, 35, 69–76. [Google Scholar] [CrossRef]
- Lin, T.; Matzarakis, A.; Hwang, R. Shading effect on long-term outdoor thermal comfort. Build. Environ. 2010, 45, 213–221. [Google Scholar] [CrossRef]
- Cheng, V.; Ng, E.; Chan, C.; Givoni, B. Outdoor thermal comfort study in a sub-tropical climate: A longitudinal study based in Hong Kong. Int. J. Biometeorol. 2012, 56, 43–56. [Google Scholar] [CrossRef]
- Ng, E.; Cheng, V. Urban human thermal comfort in hot and humid Hong Kong. Energy Build. 2012, 55, 51–65. [Google Scholar] [CrossRef]
- Mballo, S.; Herpin, S.; Manteau, M.; Demotes-Mainard, S.; Bournet, P. Impact of well-watered trees on the microclimate inside a canyon street scale model in outdoor environment. Urban Clim. 2021, 37, 100844. [Google Scholar] [CrossRef]
- Liu, Z.; Cheng, W.; Jim, C.; Morakinyo, T.E.; Shi, Y.; Ng, E. Heat mitigation benefits of urban green and blue infrastructures: A systematic review of modeling techniques, validation and scenario simulation in ENVI-met V4. J. Affect. Disord. 2021, 200, 107939. [Google Scholar] [CrossRef]
- Xiaohan, D.U.; Shi, Y.; Zhang, Y.; Architecture, S.O. Field Study on Thermal Environment of Typical Living Street Canyons in Guangzhou. Build. Sci. 2015, 31, 8–13. [Google Scholar] [CrossRef]
- Shi, L.; Du, Y.; Zhang, L.; Liu, W. Review of weather and climate characteristics and their impacts in Guangdong Province in May–June 2021. Guangdong Meteorol. 2021, 43, 2. [Google Scholar]
- Li, T. Fairness Evaluation of Urban Forest Based on Ecosystem Services—A Case Study of Guangzhou University City. Master’s Thesis, Guangzhou University, Guangzhou, China, 2018. [Google Scholar]
- Cai, Y.; Li, C.; Ye, L.; Xiao, L.; Gao, X.; Mo, L.; Du, H.; Zhou, Y.; Zhou, G. Effect of the roadside tree canopy structure and the surrounding on the daytime urban air temperature in summer. Agric. For. Meteorol. 2022, 316, 108850. [Google Scholar] [CrossRef]
- Huang, F. Influence of Outdoor Thermal Environment Factors on Human Thermal Comfort. Master’s Thesis, Central South University, Changsha, China, 2014. [Google Scholar]
- Meili, N.; Acero, J.A.; Peleg, N.; Manoli, G.; Burlando, P.; Fatichi, S. Vegetation cover and plant-trait effects on outdoor thermal comfort in a tropical city. J. Affect. Disord. 2021, 195, 107733. [Google Scholar] [CrossRef]
- Shahidan, M.F.; Shariff, M.K.; Jones, P.; Salleh, E.; Abdullah, A.M. A comparison of Mesua ferrea L. and Hura crepitans L. for shade creation and radiation modification in improving thermal comfort. Landsc. Urban Plan. 2010, 97, 168–181. [Google Scholar] [CrossRef]
- Zhang, J.; Gou, Z.; Zhang, F.; Shutter, L. A study of tree crown characteristics and their cooling effects in a subtropical city of Australia. Ecol. Eng. 2020, 158, 106027. [Google Scholar] [CrossRef]
- Fahmy, M.; Sharples, S.; Yahiya, M. LAI based trees selection for mid latitude urban developments: A microclimatic study in Cairo, Egypt. J. Affect. Disord. 2010, 45, 345–357. [Google Scholar] [CrossRef]
- Zheng, S.; Guldmann, J.-M.; Liu, Z.; Zhao, L. Influence of trees on the outdoor thermal environment in subtropical areas: An experimental study in Guangzhou, China. Sustain. Cities Soc. 2018, 42, 482–497. [Google Scholar] [CrossRef]
- Zhao, X.; Li, G.; Gao, T. Thermal Comfort Effects and Morphological Characteristics of Typical Street Trees in Summer in Harbin. Landsc. Archit. 2016, 12, 74–80. [Google Scholar] [CrossRef]
- Gebert, L.; Coutts, A.; Tapper, N. The influence of urban canyon microclimate and contrasting photoperiod on the physiological response of street trees and the potential benefits of water sensitive urban design. Urban For. Urban Green. 2019, 40, 152–164. [Google Scholar] [CrossRef]
- Lee, H.; Holst, J.; Mayer, H. Modification of Human-Biometeorologically Significant Radiant Flux Densities by Shading as Local Method to Mitigate Heat Stress in Summer within Urban Street Canyons. Adv. Meteorol. 2013, 2013, 1–13. [Google Scholar] [CrossRef]
- Heisler, G.M. Mean wind speed below building height in residential neighborhoods with different tree densities. ASHRAE Trans. 1990, 96, 1389–1396. [Google Scholar]
- DeWalle, D.R.; Heisler, G.M. Windbreak effects on air infiltration and space heating in a mobile home. Energy Build. 1983, 5, 279–288. [Google Scholar] [CrossRef]
- Sanusi, R.; Johnstone, D.; May, P.; Livesley, S.J. Microclimate benefits that different street tree species provide to sidewalk pedestrians relate to differences in Plant Area Index. Landsc. Urban Plan. 2017, 157, 502–511. [Google Scholar] [CrossRef]
- Mayer, H.; Kuppe, S.; Holst, J.; Imbery, F.; Matzarakis, A. Human Thermal Comfort Below the Canopy of Street Trees on a Typical Central European Summer Day; Reports of the Meteorological Institute; Albert-Ludwigs-University: Freiburg, Germany, 2009; Volume 18, pp. 211–219. [Google Scholar]
- Krüger, E.; Pearlmutter, D.; Rasia, F. Evaluating the impact of canyon geometry and orientation on cooling loads in a high-mass building in a hot dry environment. Appl. Energy 2010, 87, 2068–2078. [Google Scholar] [CrossRef]
- Liu, X.; He, J.; Xiong, K.; Liu, S.; He, B.-J. Identification of factors affecting public willingness to pay for heat mitigation and adaptation: Evidence from Guangzhou, China. Urban Clim. 2023, 48, 101405. [Google Scholar] [CrossRef]
- Liu, S.; Wang, Y.; Liu, X.; Yang, L.; Zhang, Y.; He, J. How does future climatic uncertainty affect multi-objective building energy retrofit decisions? Evidence from residential buildings in subtropical Hong Kong. Sustain. Cities Soc. 2023, 92, 104482. [Google Scholar] [CrossRef]
- Li, K.; Liu, X.; Zhang, H.; Ma, J.; He, B.-J. Evaluating and improving the adaptability of commonly used indices for predicting outdoor thermal sensation in hot and humid residential areas of China. Dev. Built Environ. 2023, 16, 100278. [Google Scholar] [CrossRef]


| Number | Species | Family and Genus | Number of Trees | Proportion (%) |
|---|---|---|---|---|
| 1 | Ficus microcarpa | Moraceae Ficus | 775 | 25.7 |
| 2 | Syzygium hainanense | Myrtaceae Syzygium | 283 | 9.4 |
| 3 | Khaya senegalensis | Meliaceae Melia | 253 | 8.4 |
| 4 | Bauhinia | Leguminosae Bauhinia | 141 | 4.7 |
| 5 | Terminalia neotaliala | Combretaceae Terminalia | 136 | 4.5 |
| 6 | Mangifera indica | Sumac Mangifera | 59 | 2.0 |
| Species | Height (m) | Height below Branch (m) | Trunk Diameter (m) | Canopy Diameter (m) | Leaf Area Index (m2/m2) |
|---|---|---|---|---|---|
| Khaya senegalensis | 12.39 | 2.80 | 0.31 | 9.90 | 4.11 |
| Terminalia neotaliala | 10.40 | 4.17 | 0.26 | 10.90 | 4.37 |
| Mangifera indica | 9.67 | 2.47 | 0.23 | 6.82 | 1.94 |
| Ficus microcarpa | 11.49 | 2.54 | 0.39 | 9.42 | 5.69 |
| Elements | Instruments | Manufacturer | Accuracy | Measurement Range | Sampling |
|---|---|---|---|---|---|
| Air temperature and humidity | HOBO data logger (U23-001) | Onset Computer Corporation, Bourne, MA, USA | ±0.2 °C (0~50 h) | −40 °C~70 °C | 5 min |
| Surface temperature | HOBO Thermocouple | ||||
| Solar radiation under trees | Two-component radiation sensor | Hukseflux Company, Delft, The Netherlands | ≤5% | 0~2000 W/m2 | 5 min |
| Solar radiation between trees | -- | ||||
| Wind speed | HD32.3 thermal environment analyzer | M. Young Company, Traverse, MI, USA | Class 1/3 DIN ±0.05 m/s | −10 °C~100 °C 0~5 m/s | 5 min |
| Black globe temperature | |||||
| Weather parameters | Davis Vantage Pro2 | Davis Company, Boston, MA, USA | ±0.6 °C (Ta) ±3% (RH) ±5% (S,V) | −40~65 °C (Ta) 0–1800 W/m2 (S) | 10 min |
Disclaimer/Publisher’s Note: The statements, opinions and data contained in all publications are solely those of the individual author(s) and contributor(s) and not of MDPI and/or the editor(s). MDPI and/or the editor(s) disclaim responsibility for any injury to people or property resulting from any ideas, methods, instructions or products referred to in the content. |
© 2024 by the authors. Licensee MDPI, Basel, Switzerland. This article is an open access article distributed under the terms and conditions of the Creative Commons Attribution (CC BY) license (https://creativecommons.org/licenses/by/4.0/).
Share and Cite
Zheng, S.; He, C.; Xu, H.; Guldmann, J.-M.; Liu, X. Heat Mitigation Benefits of Street Tree Species during Transition Seasons in Hot and Humid Areas: A Case Study in Guangzhou. Forests 2024, 15, 1459. https://doi.org/10.3390/f15081459
Zheng S, He C, Xu H, Guldmann J-M, Liu X. Heat Mitigation Benefits of Street Tree Species during Transition Seasons in Hot and Humid Areas: A Case Study in Guangzhou. Forests. 2024; 15(8):1459. https://doi.org/10.3390/f15081459
Chicago/Turabian StyleZheng, Senlin, Caiwei He, Haodong Xu, Jean-Michel Guldmann, and Xiao Liu. 2024. "Heat Mitigation Benefits of Street Tree Species during Transition Seasons in Hot and Humid Areas: A Case Study in Guangzhou" Forests 15, no. 8: 1459. https://doi.org/10.3390/f15081459
APA StyleZheng, S., He, C., Xu, H., Guldmann, J.-M., & Liu, X. (2024). Heat Mitigation Benefits of Street Tree Species during Transition Seasons in Hot and Humid Areas: A Case Study in Guangzhou. Forests, 15(8), 1459. https://doi.org/10.3390/f15081459