Abstract
Low-altitude aerial photogrammetry can be an alternative source of forest inventory data and a practical tool for rapid forest attribute updates. The availability of low-cost unmanned aerial systems (UASs) and continuous technological advances in terms of their flight duration and automation capabilities makes these solutions interesting tools for supporting various forest management needs. However, any practical application requires a priori empirical validation and optimization steps, especially if it is to be used under different forest conditions. This study investigates the influence of the main flight parameters, i.e., ground sampling distance and photo overlap, on the performance of individual tree detection (ITD) stand-level forest inventories, based on photogrammetric data obtained from budget unmanned aerial systems. The investigated sites represented the most common forest conditions in the Polish lowlands. The results showed no direct influence of the investigated factors on growing stock volume predictions within the analyzed range, i.e., overlap from 80 × 80 to 90 × 90% and GSD from 2 to 6 cm. However, we found that the tree detection ratio had an influence on estimation errors, which ranged from 0.6 to 15.3%. The estimates were generally coherent across repeated flights and were not susceptible to the weather conditions encountered. The study demonstrates the suitability of the ITD method for small-area forest inventories using photogrammetric UAV data, as well as its potential optimization for larger-scale surveys.
1. Introduction
Unmanned aerial vehicles/systems (UAVs/UASs) have been becoming more common solutions for various forestry purposes, e.g., for 2D/3D mapping, environmental monitoring, health assessment, tree species classification, firefighting or SAR missions [1]. The general availability of low-cost platforms has intensified both scientific research and the applicability of UAS solutions in forestry. As an alternative to manned aircraft and satellite-based remote sensing (RS) solutions, autonomous low-altitude systems can provide high spatial and temporal data resolution while offering relatively low operational costs and flexibility of data acquisition [2,3,4,5]. The main limitation of small UASs is their mapping range, mainly due to flight duration [6,7]. Based on the literature review conducted by Manfreda et al. [8], the cost-effective range of UAV systems for environmental monitoring was only below 20 hectares. Nevertheless, this aspect has improved over the last six years due to both technological advances and industry-specific optimization research [7,9,10,11,12].
The last decade has seen an increased interest in the research and application of precise forest inventories at stand or even single-tree level [13,14,15]. In Poland, according to forest management plans [16], stand-level inventories are conventionally planned once per 10 years—for midterm management—and 1 or 2 years before harvesting in order to evaluate the potential yield. Depending on the potential value of a particular stand, more or less accurate/time-consuming inventory methods can be applied. For instance, angle-count (relascopes) or visual assessment methods are generally used for homogeneous stands. If there are similar stands in the vicinity, the estimates can be transferred from one stand to another. For particularly valuable units, a total survey is planned, whereas for brief estimates, yield tables can be used. Due to the variety of available inventory options characterized by varying degrees of accuracy and subjectivity driven by stand complexity, some discrepancies between the inventory results as compared to post-harvest crop evaluation may occur. This problem could prove crucial for medium- and long-term forest management as well as for governmental and international reporting.
Remote sensing (RS)-assisted forest inventories enable the possibility of objectively estimating spatially continuous forest attributes for large and hardly accessible sites, with promising performance [17,18,19,20,21,22]. Among some popular inventory methods that utilize RS data, individual tree detection (ITD) has shown a potential to be useful for precision forestry [14,23,24,25,26]. The core aspect of this method is the detection and delineation of single trees (segments) based on the following RS layers: point clouds, crown height models and/or orthomosaics. In the next step, RS metrics are assigned to each segment, which in turn serve as independent variables in some sort of model developed to estimate the dendrometric attributes of a single tree, for example, height, stem volume, DBH, etc. The low-altitude character of UAS operations enables the derivation of fine-resolution rasters and very dense point clouds, which can be useful for the accurate detection and delineation of the first canopy layer crowns and in some cases can outperform LiDAR-based tree detection [27,28] and airborne laser scanning (ALS) biomass estimates [29]. In general, many studies show a high degree of agreement between UAV images and laser-based forest metrics [30,31,32,33].
As mentioned above, mapping large forest areas using UASs can still prove to be a challenging task. The main limitation of low-altitude UAV systems is the considerable amount of data required to cover vast areas. This entails requirements for flight duration, constant weather conditions during data acquisition and long-range signal transmission (especially in forest environments). In addition, big data usually has considerable redundancy and a lot of noise. Depending on the goal of the inventory, such a detailed representation can be an overkill. Therefore, optimization steps seem to be necessary when planning larger UAV inventory campaigns.
Ground sampling distance (GSD) as well as flight pattern density (photo overlap) are the factors that have a decisive influence on the resolution of the RS layers, their quality, as well as on the mapping range [34]. Depending on the scale and objectives of the respective inventory, an operator must define these parameters accordingly. The GSD is closely linked to the camera parameters and flight altitude. As shown in some studies, lower flight altitudes do not necessarily mean better results [10,29,34,35]. Among other things, this could be due to the increased influence of the tree crowns moving with the wind on the projection of the camera image. Moreover, a low approach results in more homogeneous textures of the captured photos. This may confuse the digital aerial photogrammetry (DAP) algorithms during the aero-triangulation phase of aligning the photo blocks [10]. On the other hand, high-altitude photogrammetric missions provide coarser resolutions and sparse RS material where the ITD approach may not be reliable for estimating some forest attributes—for instance the DBH [36].
As outlined in the previous paragraph, there is a keen interest in optimizing image-based aerial forest inventory methods. Nevertheless, to the best of the authors’ knowledge, there is little work on optimizing single tree detection methods for growing stock volume (GSV) estimation, based on photogrammetric UAV data. Most research on optimization so far was related to tree height estimation [10,35,36], which can be directly measured, tree detection and segmentation [10,27,36], which are very often auxiliary or intermediate results, DBH [36] or aboveground biomass [29]. It is worth noting that GSV, as a traditional indicator of timber resources, carbon stock, management efficiency and sustainability in the forestry sector, is one of the most important forest attributes to be determined [37,38]. Moreover, GSV is closely related to aboveground biomass, which in turn becomes an important indicator of carbon stock assimilation. We found one study by Tuominen et al. [39] which partially covers similar issues. Nevertheless, in that study, an area-based approach (ABA) was tested with two GSD values, i.e., 20 and 50 cm, which, however, were resampled in post-processing rather than originally captured.
Considering the above-mentioned aspects, this study aimed to test the influence of ground sampling distance and photo overlap on the efficiency of UAV-ITD stand-level growing stock inventories, with the perspective of presenting optimization possibilities that could further improve practical implementations.
2. Materials and Methods
2.1. General Concept
The main idea was to map selected representative forest stands, with a low-cost drone, using different flight settings. Next, individual tree detection and crown delineation was performed for a particular RS layer from each flight. Based on photogrammetric point clouds, the RS metrics for individual trees were calculated. The volumes of the individual trees were estimated using a dedicated model. Finally, the stand volume was calculated as the sum of the individual tree volumes related to the corresponding stand area. The estimates derived from the different flights were compared with each other, as well as with the reference data. A general picture of the methodology is presented in Figure 1.
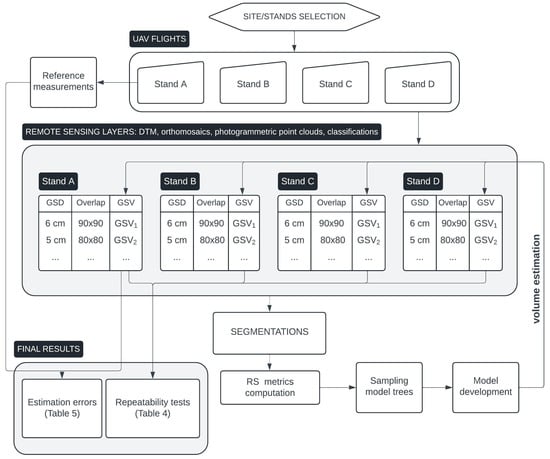
Figure 1.
Flowchart of applied methodology.
2.2. Forest Stand Selection
The first step was to select the most representative site type and stand characteristics typical of the Central European lowlands in Poland, as defined in Solon et al. [40] (Figure 2). The data for such preliminary analyses came from the Forest Data Bank [41], which contains a range of annually updated attributes for individual stands in Poland. Single-layered coniferous mixed fresh sites with Scots pine as the dominant tree species turned out to be the most representative in terms of the area coverage (Figure 3). The average age of the most frequently represented stands was in the range of 40–80 years. The authors restricted the search criteria for the upper age limit (i.e., 60–80 years) as these stands have a higher priority for estimating pre-harvest volume and usually are more diverse in terms of individual tree dimensions, making them better candidates for the validation method.
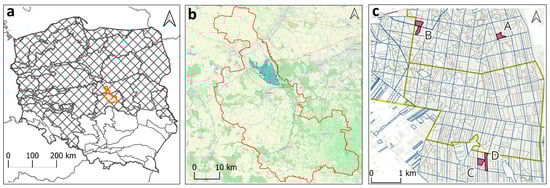
Figure 2.
Investigation area: range of Polish lowlands (a), Skierniewice forest district (b), selected sites (c). Outline of the district in orange. A, B, C, D—selected stands.
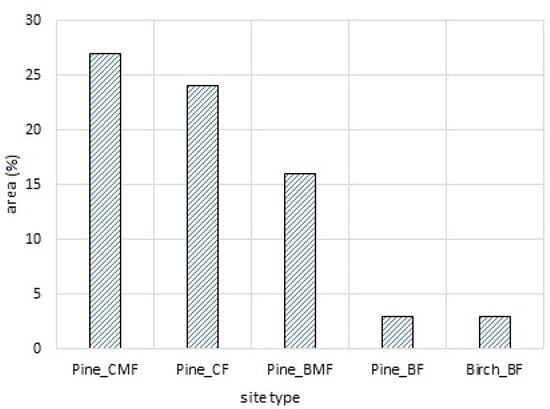
Figure 3.
The most common forest site types in Polish lowlands. Abbreviations: C—coniferous, M—mixed, F—fresh, B—broadleaved.
Knowing the characteristics of the target stand type, the next step was to localize potential sites. First of all, areas with prohibited or restricted flight possibilities were excluded, according to official aerial usage plans [42]. Next, a proximity/buffer analysis was run in order to select stands located in extensive managed forest areas, taking into account the 2 year project duration, the available human resources and the multitude of planned flight scenarios. Finally, a field inspection was carried out to check whether the actual condition of the potential sites matched their description in the database. Finally, four stands in the Skierniewice forest district that met all the required conditions were selected for further analysis. Table 1 contains their most important quantitative characteristics. Figure 4 shows the canopy structure as seen from above.

Table 1.
Basic dendrometric characteristics of the test stands based on the forest database [41].
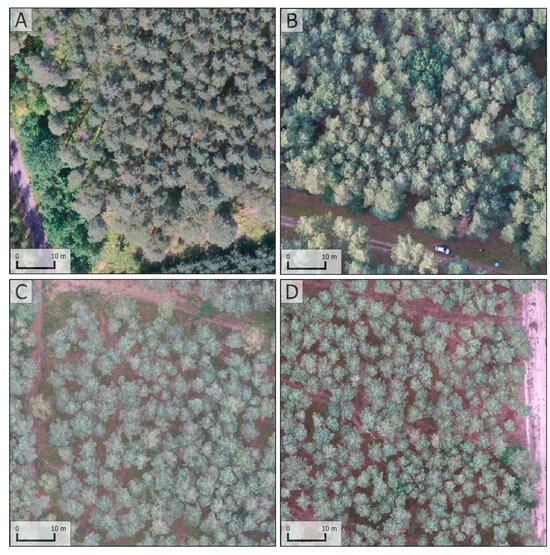
Figure 4.
Fragments of orthomosaics presenting areas of interest within analyzed stands. (A–D)—selected stands.
2.3. Photogrammetry
All flights were performed with the DJI Inspire 1 multirotor system with Zenmusse X3 RGB camera attached to a motorized gimbal. The main specifications of the camera are as follows: 1/2.3″ CMOS sensor with still image resolution of 4000 × 3000 pixels, a focal length of 20 mm (equivalent to 35 mm format) and a maximum aperture of f/2.8, providing a diagonal field of view of 94 degrees. The electronics offer automatic exposure modes with an ISO sensitivity of 300 to 3200. Ground sampling distances of 2 to 6 cm photo overlaps of 80 × 80%, 90 × 80% and 90 × 90% were tested. The photogrammetric missions were flown in the summer of 2019. Cloud cover and wind speed were noted before each flight and presented in the corresponding section of the results.
All the photo sets were processed with AgiSoft Metashape software (v. 1.2.4) [43] using original image sizes, generic preselection for photos alignment and mild filtering for the dense cloud. Digital terrain models (DTMs) with a resolution of 1 m were interpolated from the classified photogrammetric point cloud, using the lidR package (v. 3.0.4) [44,45]. The ground classification was performed on the created orthomosaics using random forest-derived masks from the supervised classification embedded in the Dzetsaka plugin (v. 3.7) for QGIS [46]. The masks represented ground points at locations like larger breaks between trees, forest gaps, roads, boundaries between stands, etc. These DTMs were used to normalize the heights of the photogrammetric point clouds and create rasterized canopy height models (CHMs).
2.4. Crown Segmentation
Previously created ground masks were inverted and at this stage served as tree masks. Both the CHMs and the trees masks were subjected to a Gaussian aggregation filter to remove the noise caused by fine resolution layers (so-called salt and pepper effect) [47]. Next, a local maximum filter [48] was applied to the CHMs to detect tree tops in 3 runs. Segmentation parameters in each swipe were set independently for large, medium and small trees, based on a visual interpretation of the RS layers. For each individual tree top, a buffer with a radius of 10 m was created to perform local single-crown segmentations using the growing region algorithm from Dalponte and Coomes [49]. The delineated segment was eliminated from the CHM and the entire procedure was repeated until all the detected tree tops within the area of interest had been included. Lastly, sharp polygon edges were smoothed using the QGIS embedded smoothing tool [50]. To maximize control over unanalyzed factors (such as segmentation in this study), major segmentation errors were corrected manually based on the orthomosaics. Nevertheless, these were only single instances. Finally, different DAP metrics were assigned to each segment. Figure 5 shows examples of the segmentation results.
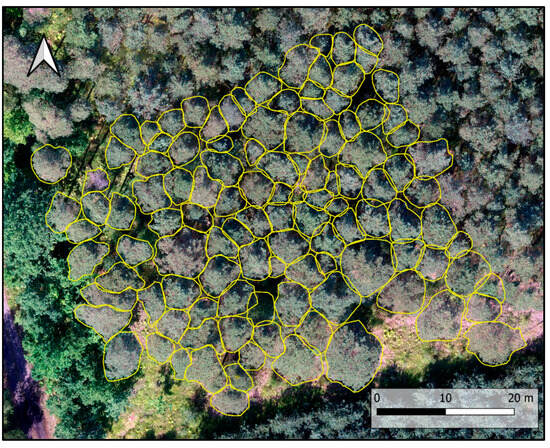
Figure 5.
Visual results of sample segmentation over test stand A.
2.5. Model Development
A dedicated linear regression model was developed to estimate the volume of individual trees on the basis of the DAP data. In the first phase of model development, histograms of tree heights and their crown areas were created based on previously prepared segmentations. These two variables are generally recognized as good predictors of the volume of standing trees [51,52,53,54]. The histograms were then stratified using the natural breaks algorithm [55]. Thanks to this step, it was possible to select so-called “model trees” that were representative along the entire range of values of the independent variables. In each stratification bin, 3 trees were randomly selected. In total, there were 90 such model trees.
In the next phase, based on the georeferenced segments, the model trees were identified and marked in the field. In order to obtain robust reference volumes, each model tree was scanned from 3 sides by means of terrestrial laser scanning (TLS) using a FARO Focus 3D device (Lake Mary, FL, USA). The following scan parameters were set: resolution ¼, quality ½ and average distance to the scanned tree ~3–5 m. The raw scans were combined in the Faro Scene software using artificial markers (spheres). The diameters of the stem at different heights were determined using the RANSAC method [56] by automatically fitting circles to point clouds representing particular model trees. Subsequently, taper curves of the stems of the model trees were reconstructed, from which individual tree volumes were calculated. The entire process of TLS-based volume estimation was performed using an R script written by the authors. In addition, the height of each model tree was captured using Vertex rangefinder (Haglöf Sweden, Långsele, Sweden) from two perpendicular directions and averaged. Similarly, the DBHs were measured using a caliper. Finally, the volumes derived from the TLS were compared with the estimates from the conventional allometric equations [57]. Deviations of more than 15% were checked and corrected in 3DsMax (2021) [58] by manual recreation (3D modeling) of stem shape, based on the TLS. Table 2 presents quantitative description of model trees’ main parameters.
Table 2.
Main parameters of the model trees.
A number of potential predictors for the volume of individual trees were investigated as follows: tree height, crown area, crown height/volume/circumference, etc. Both the original values of such predictors and their modified forms (log, power, square root transformations) were tested. Only those metrics that can be derived from aerial photogrammetry were tested in this study. Some of the variables, including tree height or crown area, were taken from the literature [59,60], whereas others were original, e.g., crown compression ratio or the dimensions of neighboring trees in different combinations. Furthermore, interactions between predictors were checked by multiplying and dividing individual pairs of independent variables. The R2 and rRMSE values of each potential model were a criterion for the elimination of variables during bidirectional stepwise regression. The models were validated using leave-one-out cross validation (LOOCV) [61].
2.6. Reference Data
A total survey was conducted for one test stand in which the DBH of all the trees was measured with a caliper. The heights of the model trees were used to construct a local DBH-height curve, which was used to estimate the heights of all trees in the stand. Finally, the volumes of all the trees were estimated using the same allometric equations as in the previous chapter. This conventional single-stand inventory method is commonly used in Polish forest management for valuable units before harvesting [62]. Additionally, in order to obtain a second independent reference dataset, full TLS of the same stand was carried out. The TLS volumes of each tree were estimated in the same way as described in a previous subchapter. The physical boundaries of the area of interest (~0.3 ha) within the stand were marked on the edge trees. Spatial coregistration between the TLS and aerial layers was based on visual georeferencing in QGIS. Figure 6 shows the 3D representation of this validation stand according to the TLS data. Table 3 shows the quantitative description of the inventory results based on the two reference datasets.
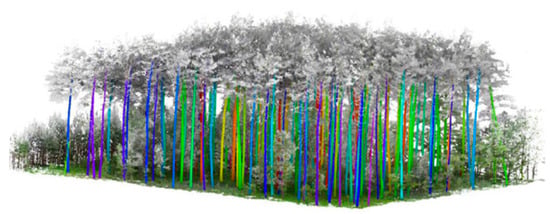
Figure 6.
3D model of validation stand A based on TLS data, with detected stems.
Table 3.
Quantitative description of the validation stand.
3. Results
3.1. Volume Modeling
The linear regression model with two independent variables, i.e., tree height and crown area, proved to be the most accurate with an R2 = 0.82. This model was able to derive unbiased estimates for the volume of single trees. The model was cross-validated using the leave-one-out method, yielding the following results: mean absolute error (MAE) = 0.09 m3 (13.9%), relative root mean square error (rRMSE) = 17.1% and mean absolute percentage error (MAPE) for a single observation = 15.1%. All the requirements for linear regression were met, i.e., the scatterplot between the observations and estimates shows a linear trend of the model fit (Figure 7a), the residuals followed a normal distribution (Figure 8) and the estimates were not correlated with the residuals (Figure 7b). One outlier and one duplicated record were identified and removed at this stage.
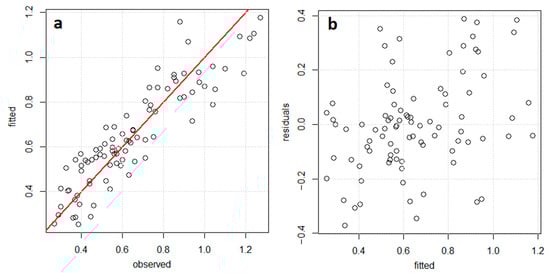
Figure 7.
Scatterplots of the winning model, (a)—fitted vs observed, (b)—fitted vs residuals (m3).
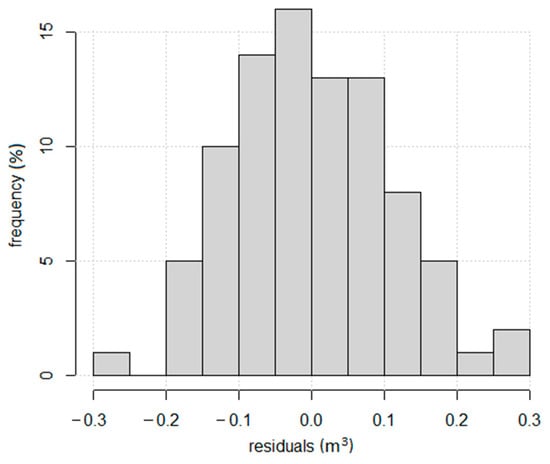
Figure 8.
Histogram of residual frequency.
3.2. Repeatability Test
Table 4 shows the variation in UAV-based GSV estimates for each stand according to the range of analyzed ground sampling distances and photo overlap levels. There were at least six independent flights for each stand, although due to some adverse weather conditions, not all the contingencies were tested for each stand. A very low coefficient of variation (CV) from 2 to 6% was observed between consecutive flights. An insignificant declivity of GSV estimation values with coarser GSD resolution was observed for three stands (Figure 9). According to one-way ANOVA with Tukey’s HSD test, the differences between means of 25 out of 28 possible pairs of different flight settings were not statistically significant at the 0.05 alpha level (Table 5). In six out of nine cases, 80 × 80% coverage resulted in slightly lower estimates than the 90 × 90% counterparts with the same GSD (difference of 13.7 m3/ha or 4% on average).
Table 4.
GSV [m3/ha] estimation repeatability test with different configurations of flight parameters.
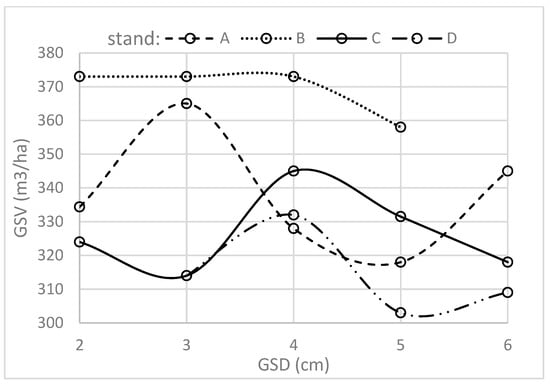
Figure 9.
GSV estimates according to GSD. Missing values were interpolated.
Table 5.
Significant results of one-way ANOVA test with Tukey’s HSD test.
3.3. Estimation Errors
Table 6 presents the UAV-based GSV estimation errors compared to the TLS and conventional method. Errors are expressed in percentages, as the difference between estimates related to the reference GSV value. This table contains the results from stand A, of which a total survey was conducted.
Table 6.
GSV estimation errors for validation of stand A.
Estimation errors related to the TLS and conventional method were relatively close for each flight configuration. This was due to the similar GSV value for each reference method as follows: 324 m3/ha for the TLS and 317 m3/ha for the conventional method. In most cases, the UAV method gave slightly overestimated results. The range of errors between flights was between −3.7% and 15.3%. The smallest estimation error (0.6%) was found for a GSD of 5 cm, although no repeated flight took place for this configuration. Although the worst score from this study (15.3%) was within the commonly reported intervals for similar RS inventory methods, there was a high coefficient of variation between the error rates, i.e., 66% for the TLS and 70% for the conventional method. We found no substantial direct influence of ground sampling distance and photo coverage or weather conditions on the error levels. Surprisingly, in most cases, the better GSV estimates were in the scenarios where fewer trees were detected (Figure 10).
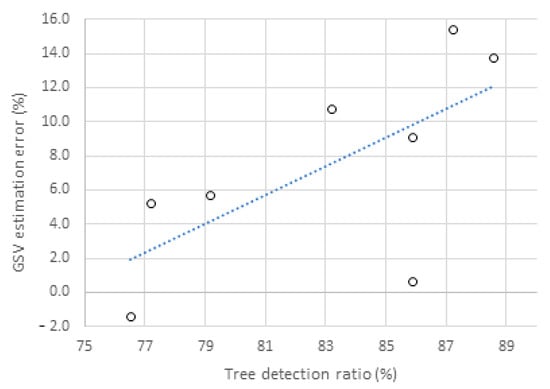
Figure 10.
Relationship between tree detection ratio and GSV estimation error.
4. Discussion
The presented UAV-ITD method for forest stock inventory provided robust (Table 6) and stable estimates (Table 4) for three of the four investigated stands. The results were neither directly dependent on the ground sampling distance nor on the overlap within the analyzed range. Pessacg et al. [63] also showed a small difference in the quality of UAV-reconstructed DTMs based on aerial photographs taken at 50 and 150 m altitudes. In this case, the mapping range and time constraints could be further optimized at a coarser resolution of RS layers; as higher flight altitudes and wider flight patterns allow coverage of larger areas in a single flight. Similar results can be found in Grybas and Congalton [35], where the differences in tree height estimates between individual flights with different altitudes and overlap configurations were less than 1%. This allows larger areas to be covered with fewer images. Smaller datasets, in turn, reduce the computational requirements, which are known to be quite high for photogrammetry. The promising results even for 6 cm GSD suggest that a broader resolution test is needed. The authors did not plan any flights at higher altitudes, i.e., above 120 m AGL, as these are prohibited in Poland under standard UAV operations. Nevertheless, some results for GSV estimated on the basis of coarser resolution DAP data can be found in the literature. For instance, Cao et al. [32] reported R2 and rRMSE values of 0.73 and 18.24% using 10 cm GSD photo sets for GSV prediction in poplar and dawn redwood stands. Based on 40 cm RS pushbroom DAP layers, the models and approaches proposed by Strunk et al. [64] were able to explain between 65 and 76 of GSV variation among coniferous stands. A further reduction in the resolution of RS layers can be found in Tuominen et al. [39], where negligible differences in GSV estimates in Pinus sylvestris/Norway spruce stands were found between UAV-DAP layers of 20 and 50 cm GSD (rRMSE 26.12 and 25.52, respectively). However, the compared layers were resampled from an original GSD of 10 cm, rather that independently acquired, and an area-based method was used in that study. Finally, Goodbody et al. [31] have presented a comprehensive review showing a high degree of agreement between ALS and DAP-based volume estimates for various GSDs. As can be seen, the literature is abundant with research concerning coarser resolutions; therefore, our study focused more on potential performance gains when using finer pixels.
Regarding another important aspect of photogrammetric missions, namely, the photo overlap, three variants (80 × 80%, 90 × 80% and 90 × 90% front/side) were tested in this study, showing a very low influence on the GSV estimates at the flown altitudes. In six out of nine flights, the GSV estimates based on the 80 × 80% overlap were lower than the 90 × 90% counterparts only of about 13.7 m3/ha. However, due to the relatively small sample, such a tendency could be a random effect. In this study, no sparse flight patterns were flown, as these are generally not recommended for low-altitude forest mapping [65,66,67,68] and can lead to significant gaps in the spatial continuity of the data [63,69,70]. Photo overlaps of less than 70%–80% are more common in manned-level photogrammetry, with a threshold of 60% lateral overlap generally considered optimal [71,72]. Higher flight altitudes usually allow for less dense photo overlap [67], as more common features can be detected on the images since the scenes are less homogeneous. In addition, the alignment algorithms do not suffer from object movements caused, for example, by wind [69].We found one study by Lima et al. [34] who analyzed lower overlaps for UAV operations and found that lateral overlap is more important than longitudinal with a 70 × 90% setting and a GSD of 3.1 cm being optimal for Scots pine stands. However, most research indicates rather denser flight scenarios, or simply does not consider more sparse flight patterns [35]. For instance, Young et al. [10] were more conservative and suggested that according to flight time constraints and the need to cover extensive areas, 90 × 80% front/side overlap may be optimal. Pessacg et al. [63] show that a 95 × 85% overlap of nadir photos is generally best for forest conditions if accurate image-based DTM reconstruction is the main goal.
The stage of tree detection and crown segmentation is a core aspect of the post-processing pipeline in the ITD inventory method. However, this factor, which was not analyzed in this study (as it is a very complex aspect that deserves its own investigation), proved to be the factor most strongly associated with errors in the estimation of GSV at the herd level.Tree detection rates from different flight scenarios were in the range of 77% to 89%. Such a score is within the range of usually reported tree detection rates for the ITD method as follows: ~70% in Goldbergs et al. [73], >80% in Krause et al. [74] and 73%–94% in Mohan et al. [75]. The most important drivers of ITD accuracy are usually stand density, tree clustering and tree vertical structure [76,77,78]. Surprisingly, the fewer trees that were detected, the more accurate the estimates were (Figure 10). Some plausible explanations for such a result could be as follows: (1) the omission of small trees during sampling for the model development, causing increased volume estimates for individual trees—the difference in the means of volumes for a single tree according to the model tree and reference datasets was 0.05 (Table 2 and Table 3), (2) higher fragmentation of pine crowns due to their structural characteristics, and (3) the presence of small second-layer trees which were not detected in the UAV-RS layers. Nevertheless, the auxiliary variable of the model, i.e., crown area, should leverage the influence of the tree detection rate. For example, a larger segment should have a similar estimated value as the sum of few smaller ones. Corresponding results were obtained by Yu et al. [79], where under-segmentation yielded better results than over-segmentation, with estimation errors ranging from 0 to 55% and 12 to 161%, respectively. They pointed to similar reasons for this result. Nevertheless, as mentioned before, tree detection and segmentation were not the main subjects of this study. Moreover, in order to gain maximum control over the analyzed factors, i.e., ground sampling distance and photo overlap, we ensured that segmentations were as accurate as possible for each scenario. Nonetheless, this issue certainly requires further research.
Allometric attributes like tree height and crown area are significantly correlated with tree volume [59,60,76]. Relatively low auto-correlation between these two variables makes them potential volume predictors when combined in some form of regression model. In this study, such a model was able to explain 82% of the variation in individual tree volumes, with an rRMSE = 17.1% for Scots pine stands. A similar model was able to explain 68% of the variation between individual tree volumes in Norway spruce-dominated stands [76]; however, the tree heights were derived from ALS data. The same model, calibrated on UAV photogrammetric point clouds representing eucalypt plantations, provided estimates with an rRMSE = 20.3% [80]. For some Quercus brantii stands, Fakhri and Latifi [81] were able to provide aboveground biomass estimates with an rRMSE of less than 10 using a consumer-class UAV.
The results obtained at stand level show that the DAP-ITD method can be competitive with ALS inventories in terms of GSV estimation. In this study, the errors in GSV prediction were no more than 15.3% in relation to the conventional method as a reference, and 12.7% when compared to the TLS score (Table 3). Similar error rates were obtained by Kotivuori et al. [82] for Finnish conifer stands. By modeling drone-derived photogrammetric point cloud data, they were able to obtain a stand-level rRMSE of 13.1% for locally calibrated models and 20% when a nationwide model was applied. Parkitna et al. [83] and Lisańczuk et al. [21] reported rRMSE ranges of 16%–23% and 12%–20%, respectively, for Scots pine-dominated stands using the area-based ALS method. On the other hand, in our study, some estimation errors were as low as 0.6%. Similarly good results were obtained by Stolle et al. [84] for Pinus taeda plantations (error rates of −3.5 to 1.8%). Although the study showed a high degree of repeatability of the UAV-based GSV estimates (coefficient of variation from 2 to 6%) and the maximum error obtained was still highly competitive compared to the alternative RS stock inventory methods, a remarkable variance (66% and 70% CV for the TLS and the traditional method, respectively) was observed in this narrow error interval (from −3.7 to 15.3%). Again, a more comprehensive study across more validation stands is needed to measure the strength of this random effect. Tuominen et al. [39], for example, found only a 10% difference based on more than 80 conifer stands; however, they used only one flight repetition.
The above comparison can only give a brief overview of the possibilities. On this occasion, it is important to point out some limitations of our research. Regarding RS metrics, the height of the trees/canopy is one of the strongest and most common predictors of their volume [76,85,86]. Therefore, it appears that high-quality DTMs are crucial for normalizing tree heights.
In our study design, we relied on self-generated image-based DTMs. However, the investigated studied sites were relatively flat, with some exposed patches of bare ground, which facilitated accurate DTM interpolation and alleviated its influence on errors in tree height measurements. However, in rugged and/or steep terrain, this issue can become more challenging [87,88,89]. On the other hand, archived high-resolution LiDAR-based DTMs are available in many countries [90], the use of which can reduce the influence of some site characteristics, including terrain and trees density, that can affect ITD accuracy [76,77]. Furthermore, Giannetti et al. [91] showed that it is possible to achieve ALS-level GSV estimates by using photogrammetric DTM-independent metrics, even in mountainous regions. Nonetheless, further optimization encompassing more diverse site and terrain features seems to be an appropriate research focus.
In order to keep the investigated factors, i.e., GSD and photo overlap under maximum feasible control, only one camera system was used to capture the images of all flights. Nevertheless, Domingo et al. [87] showed little influence of sensor resolution on biomass prediction in tropical forests, which are much more complex in structure than even-aged single-layer pine stands in Poland. They compared two camera types: the Canon IXUS127 HS with 1/2.3″ sensor size and 16 megapixels resolution and the Canon S110 with 1/1.7″ sensor and 12 megapixels. They obtained R2 and rRMSE differences of 0.01 and 0.7% for 10 cm GSD and 0.11/5.8% for 15 cm GSD. As we can see, the difference between the 12 and 16 megapixel sensor resolution was negligible for 10 cm GSD. However, their study also showed some variance in the repeatability of results for the same camera with different flight parameters, i.e., the rRMSE ranged from 31.5 to 37.7% from 70 to 80% side overlap.
No trends were found with regard to the influence of weather conditions; however, this element was relatively constant during the image collection (Table 6). If this premise is true, it testifies to a further universality of the inventory method tested. However, in order to substantiate this statement, the following aspects should still be investigated on a broader scale: influence of tree detection and segmentation accuracy, terrain diversity, stand structure and species complexity, as well as oblique images and gridded/multi-scale flight patterns.
5. Conclusions
The results of the demonstrated research allow the following conclusions to be drawn. No direct influence of photo overlap or ground sampling distance on UAV-ITD stand level growing stock volume estimation was detected within the analyzed range. Although a slight decrease in estimates was observed at coarser resolutions and wider flight patterns, the differences were not statistically significant at alpha level of 0.05 in most cases. The tree detection rate had the strongest influence on GSV estimation errors; therefore, decent individual tree detection seems to be an important factor for the accuracy of the investigated forest inventory method. Finer ground sampling resolution does not necessarily mean better results in GSV estimation. The presented approach can be characterized by a high degree of repeatability of the estimates and accuracy competitive with alternative forest inventory methods. The obtained results are promising for further optimization in regard to the mapping range of budget UAV systems for forest inventory needs and the universality of the investigated method in different scenarios. Possible directions for future research may include the following: 1—the influence of terrain variability and stand complexity, 2—a further reduction in photo overlap and sampling distance, 3—comparisons of different camera parameters, 4—the optimization and development of robust/universal ITD methods, 5—tests on various flight patterns, camera tilts and UAV airframes, and 6—broader investigation of the influence of weather conditions.
Author Contributions
Conceptualization, M.L.; methodology, M.L.; software, M.L. and G.K.; validation, M.L., G.K., K.M. and J.B.; formal analysis, M.L. and G.K.; investigation, M.L., G.K., K.M. and J.B.; resources, M.L., G.K. and K.M.; data curation, M.L., G.K. and J.B.; writing—original draft preparation, M.L.; writing—M.L., G.K., K.M. and J.B.; visualization, M.L. and G.K.; supervision, M.L.; project administration, M.L.; funding acquisition, M.L. All authors have read and agreed to the published version of the manuscript.
Funding
This research received no external funding. The project was financed entirely from the internal funds of the Forest Research Institute (Poland)—Project ID: 261501.
Data Availability Statement
The data that support the findings of this study are available from the authors upon reasonable request and with permission from the Forest Research Institute (Poland).
Acknowledgments
The authors would like to thank Łukasz Jełowicki and Piotr Mroczek for their help with part of the fieldwork. We would also like to thank Andżelika Kruszewska and Anna Markiewicz for their help with the administration of the project.
Conflicts of Interest
The authors declare no conflicts of interest.
References
- Guimarães, N.; Pádua, L.; Marques, P.; Silva, N.; Peres, E.; Sousa, J.J. Forestry Remote Sensing from Unmanned Aerial Vehicles: A Review Focusing on the Data, Processing and Potentialities. Remote Sens. 2020, 12, 1046. [Google Scholar] [CrossRef]
- Paneque-Gálvez, J.; McCall, M.; Napoletano, B.; Wich, S.; Koh, L. Small Drones for Community-Based Forest Monitoring: An Assessment of Their Feasibility and Potential in Tropical Areas. Forests 2014, 5, 1481–1507. [Google Scholar] [CrossRef]
- Whitehead, K.; Hugenholtz, C.H.; Myshak, S.; Brown, O.; LeClair, A.; Tamminga, A.; Barchyn, T.E.; Moorman, B.; Eaton, B. Remote Sensing of the Environment with Small Unmanned Aircraft Systems (UASs), Part 2: Scientific and Commercial Applications. J. Unmanned Veh. Syst. 2014, 02, 86–102. [Google Scholar] [CrossRef]
- Torresan, C.; Berton, A.; Carotenuto, F.; Di Gennaro, S.F.; Gioli, B.; Matese, A.; Miglietta, F.; Vagnoli, C.; Zaldei, A.; Wallace, L. Forestry Applications of UAVs in Europe: A Review. Int. J. Remote Sens. 2017, 38, 2427–2447. [Google Scholar] [CrossRef]
- Laporte-Fauret, Q.; Marieu, V.; Castelle, B.; Michalet, R.; Bujan, S.; Rosebery, D. Low-Cost UAV for High-Resolution and Large-Scale Coastal Dune Change Monitoring Using Photogrammetry. JMSE 2019, 7, 63. [Google Scholar] [CrossRef]
- Gupta, A.; Afrin, T.; Scully, E.; Yodo, N. Advances of UAVs toward Future Transportation: The State-of-the-Art, Challenges, and Opportunities. Future Transp. 2021, 1, 326–350. [Google Scholar] [CrossRef]
- Telli, K.; Kraa, O.; Himeur, Y.; Ouamane, A.; Boumehraz, M.; Atalla, S.; Mansoor, W. A Comprehensive Review of Recent Research Trends on Unmanned Aerial Vehicles (UAVs). Systems 2023, 11, 400. [Google Scholar] [CrossRef]
- Manfreda, S.; McCabe, M.F.; Miller, P.E.; Lucas, R.; Pajuelo Madrigal, V.; Mallinis, G.; Ben Dor, E.; Helman, D.; Estes, L.; Ciraolo, G.; et al. On the Use of Unmanned Aerial Systems for Environmental Monitoring. Remote Sens. 2018, 10, 641. [Google Scholar] [CrossRef]
- Jung, S.; Jo, Y.; Kim, Y.-J. Flight Time Estimation for Continuous Surveillance Missions Using a Multirotor UAV. Energies 2019, 12, 867. [Google Scholar] [CrossRef]
- Young, D.J.N.; Koontz, M.J.; Weeks, J. Optimizing Aerial Imagery Collection and Processing Parameters for Drone-based Individual Tree Mapping in Structurally Complex Conifer Forests. Methods Ecol. Evol. 2022, 13, 1447–1463. [Google Scholar] [CrossRef]
- Bauersfeld, L.; Scaramuzza, D. Range, Endurance, and Optimal Speed Estimates for Multicopters. IEEE Robot. Autom. Lett. 2022, 7, 2953–2960. [Google Scholar] [CrossRef]
- Okulski, M.; Ławryńczuk, M. A Small UAV Optimized for Efficient Long-Range and VTOL Missions: An Experimental Tandem-Wing Quadplane Drone. Appl. Sci. 2022, 12, 7059. [Google Scholar] [CrossRef]
- Holopainen, M.; Vastaranta, M.; Hyyppä, J. Outlook for the Next Generation’s Precision Forestry in Finland. Forests 2014, 5, 1682–1694. [Google Scholar] [CrossRef]
- Goodbody, T.R.H.; Coops, N.C.; Marshall, P.L.; Tompalski, P.; Crawford, P. Unmanned Aerial Systems for Precision Forest Inventory Purposes: A Review and Case Study. For. Chron. 2017, 93, 71–81. [Google Scholar] [CrossRef]
- Fassnacht, F.E.; White, J.C.; Wulder, M.A.; Næsset, E. Remote Sensing in Forestry: Current Challenges, Considerations and Directions. For. Int. J. For. Res. 2024, 97, 11–37. [Google Scholar] [CrossRef]
- Święcicki, Z. (Ed.) Instrukcja Urządzania lasu. Cz. 1: Instrukcja Sporządzania Projektu Planu Urządzenia lasu dla Nadleśnictwa; Centrum Informacyjne Lasów Państwowych: Warszawa, Poland, 2012; ISBN 978-83-61633-66-2.
- Næsset, E. Predicting Forest Stand Characteristics with Airborne Scanning Laser Using a Practical Two-Stage Procedure and Field Data. Remote Sens. Environ. 2002, 80, 88–99. [Google Scholar] [CrossRef]
- Suarez, J.; Smith, S.; Bull, G.; Malthus, T.; Donoghue, D.; Knox, D. The Use of Remote Sensing Techniques in Operational Forestry. Q. J. For. 2005, 99, 31–42. [Google Scholar]
- Wulder, M.A.; Hall, R.J.; Franklin, S.E. Remote Sensing and GIS in Forestry. In Remote Sensing for GIS Managers; Aronoff, S., Ed.; ESRI Press: London, UK, 2005; ISBN 1589480813, 9781589480810. [Google Scholar]
- White, J.C.; Coops, N.C.; Wulder, M.A.; Vastaranta, M.; Hilker, T.; Tompalski, P. Remote Sensing Technologies for Enhancing Forest Inventories: A Review. Can. J. Remote Sens. 2016, 42, 619–641. [Google Scholar] [CrossRef]
- Lisańczuk, M.; Mitelsztedt, K.; Parkitna, K.; Krok, G.; Stereńczak, K.; Wysocka-Fijorek, E.; Miścicki, S. Influence of Sampling Intensity on Performance of Two-Phase Forest Inventory Using Airborne Laser Scanning. For. Ecosyst. 2020, 7, 65. [Google Scholar] [CrossRef]
- Kanga, S. Advancements in Remote Sensing Tools for Forestry Analysis. Sustain. Forest. 2023, 6, 2269. [Google Scholar] [CrossRef]
- Vastaranta, M.; Holopainen, M.; Yu, X.; Hyyppä, J.; Mäkinen, A.; Rasinmäki, J.; Melkas, T.; Kaartinen, H.; Hyyppä, H. Effects of Individual Tree Detection Error Sources on Forest Management Planning Calculations. Remote Sens. 2011, 3, 1614–1626. [Google Scholar] [CrossRef]
- Kolendo, Ł.; Kozniewski, M.; Ksepko, M.; Chmur, S.; Neroj, B. Parameterization of the Individual Tree Detection Method Using Large Dataset from Ground Sample Plots and Airborne Laser Scanning for Stands Inventory in Coniferous Forest. Remote Sens. 2021, 13, 2753. [Google Scholar] [CrossRef]
- Keefe, R.F.; Zimbelman, E.G.; Picchi, G. Use of Individual Tree and Product Level Data to Improve Operational Forestry. Curr. For. Rep. 2022, 8, 148–165. [Google Scholar] [CrossRef]
- Sparks, A.M.; Smith, A.M.S. Accuracy of a LiDAR-Based Individual Tree Detection and Attribute Measurement Algorithm Developed to Inform Forest Products Supply Chain and Resource Management. Forests 2021, 13, 3. [Google Scholar] [CrossRef]
- Iqbal, I.A.; Osborn, J.; Stone, C.; Lucieer, A. A Comparison of ALS and Dense Photogrammetric Point Clouds for Individual Tree Detection in Radiata Pine Plantations. Remote Sens. 2021, 13, 3536. [Google Scholar] [CrossRef]
- You, H.; Tang, X.; You, Q.; Liu, Y.; Chen, J.; Wang, F. Study on the Differences between the Extraction Results of the Structural Parameters of Individual Trees for Different Tree Species Based on UAV LiDAR and High-Resolution RGB Images. Drones 2023, 7, 317. [Google Scholar] [CrossRef]
- Swayze, N.C.; Tinkham, W.T.; Creasy, M.B.; Vogeler, J.C.; Hoffman, C.M.; Hudak, A.T. Influence of UAS Flight Altitude and Speed on Aboveground Biomass Prediction. Remote Sens. 2022, 14, 1989. [Google Scholar] [CrossRef]
- Guerra-Hernández, J.; Cosenza, D.N.; Rodriguez, L.C.E.; Silva, M.; Tomé, M.; Díaz-Varela, R.A.; González-Ferreiro, E. Comparison of ALS- and UAV(SfM)-Derived High-Density Point Clouds for Individual Tree Detection in Eucalyptus Plantations. Int. J. Remote Sens. 2018, 39, 5211–5235. [Google Scholar] [CrossRef]
- Goodbody, T.R.H.; Coops, N.C.; White, J.C. Digital Aerial Photogrammetry for Updating Area-Based Forest Inventories: A Review of Opportunities, Challenges, and Future Directions. Curr. For. Rep. 2019, 5, 55–75. [Google Scholar] [CrossRef]
- Cao, L.; Liu, H.; Fu, X.; Zhang, Z.; Shen, X.; Ruan, H. Comparison of UAV LiDAR and Digital Aerial Photogrammetry Point Clouds for Estimating Forest Structural Attributes in Subtropical Planted Forests. Forests 2019, 10, 145. [Google Scholar] [CrossRef]
- Belcore, E.; Wawrzaszek, A.; Wozniak, E.; Grasso, N.; Piras, M. Individual Tree Detection from UAV Imagery Using Hölder Exponent. Remote Sens. 2020, 12, 2407. [Google Scholar] [CrossRef]
- De Lima, R.S.; Lang, M.; Burnside, N.G.; Peciña, M.V.; Arumäe, T.; Laarmann, D.; Ward, R.D.; Vain, A.; Sepp, K. An Evaluation of the Effects of UAS Flight Parameters on Digital Aerial Photogrammetry Processing and Dense-Cloud Production Quality in a Scots Pine Forest. Remote Sens. 2021, 13, 1121. [Google Scholar] [CrossRef]
- Grybas, H.; Congalton, R.G. Evaluating the Impacts of Flying Height and Forward Overlap on Tree Height Estimates Using Unmanned Aerial Systems. Forests 2022, 13, 1462. [Google Scholar] [CrossRef]
- Swayze, N.C.; Tinkham, W.T.; Vogeler, J.C.; Hudak, A.T. Influence of Flight Parameters on UAS-Based Monitoring of Tree Height, Diameter, and Density. Remote Sens. Environ. 2021, 263, 112540. [Google Scholar] [CrossRef]
- Lee, J.; Phua, M. Estimation of Stand Volume of Conifer Forest: A Bayesian Approach Based on Satellite-based Estimate and Forest Register Data. For. Sci. Technol. 2010, 6, 7–17. [Google Scholar] [CrossRef][Green Version]
- Mourelatou, A. Environmental Indicator Report. 2017: In Support to the Monitoring of the Seventh Environment Action Programme; Publications Office: Luxembourg, 2017; ISBN 978-92-9213-926-1. [Google Scholar]
- Tuominen, S.; Balazs, A.; Saari, H.; Pölönen, I.; Sarkeala, J.; Viitala, R. Unmanned Aerial System Imagery and Photogrammetric Canopy Height Data in Area-Based Estimation of Forest Variables. Silva Fenn. 2015, 49, 1348. [Google Scholar] [CrossRef]
- Solon, J.; Borzyszkowski, J.; Bidłasik, M.; Richling, A.; Badora, K.; Balon, J.; Brzezińska-Wójcik, T.; Chabudziński, Ł.; Dobrowolski, R.; Grzegorczyk, I.; et al. Physico-Geographical Mesoregions of Poland: Verification and Adjustment of Boundaries on the Basis of Contemporary Spatial Data. Geogr. Pol. 2018, 91, 143–170. [Google Scholar] [CrossRef]
- Forest Data Bank Home Page. Available online: https://www.bdl.lasy.gov.pl/portal/wniosek-en (accessed on 11 January 2019).
- Polish Air Navigation Services Agency (PANSA), Wieżowa 8 Street, 02-147 Warsaw, Poland. Available online: https://airspace.pansa.pl/ (accessed on 14 January 2019).
- Agisoft LLC, Agisoft Metashape. Available online: https://www.agisoft.com/ (accessed on 12 January 2019).
- Roussel, J.-R.; Auty, D.; Coops, N.C.; Tompalski, P.; Goodbody, T.R.H.; Meador, A.S.; Bourdon, J.-F.; De Boissieu, F.; Achim, A. lidR: An R Package for Analysis of Airborne Laser Scanning (ALS) Data. Remote Sens. Environ. 2020, 251, 112061. [Google Scholar] [CrossRef]
- Roussel, J.-R.; Auty, D. lidR: Airborne LiDAR Data Manipulation and Visualization for Forestry Applications 2016, 4.1.1. Available online: https://rdrr.io/cran/lidR/ (accessed on 11 January 2019).
- Karasiak, N. Dzetsaka: Classification Plugin for Qgis (Version 2019). Available online: https://github.com/nkarasiak/dzetsaka#installation-of-scikit-learn (accessed on 21 May 2024).
- Kelly, M.; Blanchard, S.D.; Kersten, E.; Koy, K. Terrestrial Remotely Sensed Imagery in Support of Public Health: New Avenues of Research Using Object-Based Image Analysis. Remote Sens. 2011, 3, 2321–2345. [Google Scholar] [CrossRef]
- Popescu, S.C.; Wynne, R.H. Seeing the Trees in the Forest. Photogramm. Eng. Remote Sens. 2004, 70, 589–604. [Google Scholar] [CrossRef]
- Dalponte, M.; Coomes, D.A. Tree-centric Mapping of Forest Carbon Density from Airborne Laser Scanning and Hyperspectral Data. Methods Ecol. Evol. 2016, 7, 1236–1245. [Google Scholar] [CrossRef] [PubMed]
- QGIS Development Team. QGIS Geographic Information System; QGIS Association. Available online: https://www.qgis.org/ (accessed on 21 May 2024).
- Holmgren, J.; Nilsson, M.; Olsson, H. Estimation of Tree Height and Stem Volume on Plots Using Airborne Laser Scanning. For. Sci. 2003, 49, 419–428. [Google Scholar] [CrossRef]
- Wyckoff, P.H.; Clark, J.S. Tree Growth Prediction Using Size and Exposed Crown Area. Can. J. For. Res. 2005, 35, 13–20. [Google Scholar] [CrossRef]
- Chen, Q.; Gong, P.; Baldocchi, D.; Tian, Y.Q. Estimating Basal Area and Stem Volume for Individual Trees from Lidar Data. Photogramm. Eng. Remote Sens. 2007, 73, 1355–1365. [Google Scholar] [CrossRef]
- Kuyah, S.; Muthuri, C.; Jamnadass, R.; Mwangi, P.; Neufeldt, H.; Dietz, J. Crown Area Allometries for Estimation of Aboveground Tree Biomass in Agricultural Landscapes of Western Kenya. Agrofor. Syst. 2012, 86, 267–277. [Google Scholar] [CrossRef]
- Rabosky, D.; Grundler, M.; Title, P.; Anderson, C.; Shi, J.; Brown, J.; Huang, H.; Mitchell, J. BAMMtools: Analysis and Visualization of Macroevolutionary Dynamics on Phylogenetic Trees 2014, 2.1.11. Available online: https://cran.r-project.org/web/packages/BAMMtools/BAMMtools.pdf (accessed on 1 January 2019).
- Fischler, M.A.; Bolles, R.C. Random Sample Consensus: A Paradigm for Model Fitting with Applications to Image Analysis and Automated Cartography. Commun. ACM 1981, 24, 381–395. [Google Scholar] [CrossRef]
- Bruchwald, A.; Rymer-Dudzinska, T.; Dudek, A.; Michalak, K.; Wroblewski, L.; Zasada, M. Wzory Empiryczne Do Okreslania Wysokosci i Piersnicowej Liczby Ksztaltu Grubizny. Sylwan 2000, 144, 5–13. [Google Scholar]
- Harper, J. Mastering Autodesk 3ds Max 2013; John Wiley & Sons: Hoboken, NJ, USA, 2012. [Google Scholar]
- Kazmierczak, K.; Najgrakowski, T. Tree crown dimensions and its relationships with tree volume based on Scots pine (Pinus sylvestris L.). Colloq. Biom. 2012, 42, 17–23. [Google Scholar]
- Gonzalez-Benecke, C.A.; Fernández, M.P.; Gayoso, J.; Pincheira, M.; Wightman, M.G. Using Tree Height, Crown Area and Stand-Level Parameters to Estimate Tree Diameter, Volume, and Biomass of Pinus Radiata, Eucalyptus Globulus and Eucalyptus Nitens. Forests 2022, 13, 2043. [Google Scholar] [CrossRef]
- Hastie, T.; Tibshirani, R.; Friedman, J. The Elements of Statistical Learning; Springer Series in Statistics; Springer: New York, NY, USA, 2009; ISBN 978-0-387-84857-0. [Google Scholar]
- Zarządzenie Nr 33 Dyrektora Generalnego Lasów Państwowych z Dnia 17 Kwietnia 2015 r. w Sprawie Zasad Sporządzania Szacunków Brakarskich, ZD.7600.4.2015, B.I.LP.2015.6.82. Available online: https://sip.lex.pl/akty-prawne/dzienniki-resortowe/zasady-sporzadzania-szacunkow-brakarskich-34976534 (accessed on 16 April 2020). (In Polish).
- Pessacg, F.; Gómez-Fernández, F.; Nitsche, M.; Chamo, N.; Torrella, S.; Ginzburg, R.; De Cristóforis, P. Simplifying UAV-Based Photogrammetry in Forestry: How to Generate Accurate Digital Terrain Model and Assess Flight Mission Settings. Forests 2022, 13, 173. [Google Scholar] [CrossRef]
- Strunk, J.; Packalen, P.; Gould, P.; Gatziolis, D.; Maki, C.; Andersen, H.-E.; McGaughey, R.J. Large Area Forest Yield Estimation with Pushbroom Digital Aerial Photogrammetry. Forests 2019, 10, 397. [Google Scholar] [CrossRef]
- Dandois, J.P.; Olano, M.; Ellis, E.C. Optimal Altitude, Overlap, and Weather Conditions for Computer Vision UAV Estimates of Forest Structure. Remote Sens. 2015, 7, 13895–13920. [Google Scholar] [CrossRef]
- PIX4D Documentation. Available online: https://support.pix4d.com/hc/en-us/articles/202557459 (accessed on 13 August 2024).
- Iglhaut, J.; Cabo, C.; Puliti, S.; Piermattei, L.; O’Connor, J.; Rosette, J. Structure from Motion Photogrammetry in Forestry: A Review. Curr. For. Rep. 2019, 5, 155–168. [Google Scholar] [CrossRef]
- Walker, M. Optimising Overlap in Drone Mapping: A Comprehensive Guide for Operators and Surveyors, Heliexpert Ltd., Trading as Aircam Drone Services. Available online: https://aircamdrone.co.uk/optimising-overlap-in-drone-mapping-a-comprehensive-guide-for-operators-and-surveyors/ (accessed on 13 August 2024).
- Frey, J.; Kovach, K.; Stemmler, S.; Koch, B. UAV Photogrammetry of Forests as a Vulnerable Process. A Sensitivity Analysis for a Structure from Motion RGB-Image Pipeline. Remote Sens. 2018, 10, 912. [Google Scholar] [CrossRef]
- Akinbiola, S.; Salami, A.T.; Awotoye, O.O.; Popoola, S.O.; Olusola, J.A. Application of UAV photogrammetry for the assessment of forest structure and species network in the tropical forests of Southern Nigeria. Geocarto Int. 2023, 38, 2190621. [Google Scholar] [CrossRef]
- Nurminen, K.; Karjalainen, M.; Yu, X.; Hyyppä, J.; Honkavaara, E. Performance of dense digital surface models based on image matching in the estimation of plot-level forest variables. ISPRS J. Photogramm. Remote Sens. 2013, 83, 104–115. [Google Scholar] [CrossRef]
- Goodbody, T.R.H.; White, J.C.; Coops, N.C.; LeBoeuf, A. Benchmarking acquisition parameters for digital aerial photogrammetric data for forest inventory applications: Impacts of image overlap and resolution. Remote Sens. Environ. 2021, 265, 112677. [Google Scholar] [CrossRef]
- Goldbergs, G.; Maier, S.; Levick, S.; Edwards, A. Efficiency of Individual Tree Detection Approaches Based on Light-Weight and Low-Cost UAS Imagery in Australian Savannas. Remote Sens. 2018, 10, 161. [Google Scholar] [CrossRef]
- Krause, S.; Sanders, T.G.M.; Mund, J.-P.; Greve, K. UAV-Based Photogrammetric Tree Height Measurement for Intensive Forest Monitoring. Remote Sens. 2019, 11, 758. [Google Scholar] [CrossRef]
- Mohan, M.; Silva, C.; Klauberg, C.; Jat, P.; Catts, G.; Cardil, A.; Hudak, A.; Dia, M. Individual Tree Detection from Unmanned Aerial Vehicle (UAV) Derived Canopy Height Model in an Open Canopy Mixed Conifer Forest. Forests 2017, 8, 340. [Google Scholar] [CrossRef]
- Hyyppä, J.; Mielonen, T.; Hyyppä, H.; Maltamo, M.; Yu, X.; Honkavaara, E.; Kaartinen, H. Using Individual Tree Crown Approach for Forest Volume Extraction with Aerial Images and Laser Point Clouds. In Proceedings of the ISPRS Workshop Laser scanning 2005, Processing of Point Clouds from Laser Scanners and Other Sensors, Enschede, The Netherlands, 12–14 September 2005; Volume 36. [Google Scholar]
- Maltamo, M.; Packalén, P.; Yu, X.; Eerikäinen, K.; Hyyppä, J.; Pitkänen, J. Identifying and Quantifying Structural Characteristics of Heterogeneous Boreal Forests Using Laser Scanner Data. For. Ecol. Manag. 2005, 216, 41–50. [Google Scholar] [CrossRef]
- Vauhkonen, J.; Ene, L.; Gupta, S.; Heinzel, J.; Holmgren, J.; Pitkanen, J.; Solberg, S.; Wang, Y.; Weinacker, H.; Hauglin, K.M.; et al. Comparative Testing of Single-Tree Detection Algorithms under Different Types of Forest. Forestry 2012, 85, 27–40. [Google Scholar] [CrossRef]
- Yu, X.; Hyyppä, J.; Holopainen, M.; Vastaranta, M. Comparison of Area-Based and Individual Tree-Based Methods for Predicting Plot-Level Forest Attributes. Remote Sens. 2010, 2, 1481–1495. [Google Scholar] [CrossRef]
- Guerra-Hernández, J.; Cosenza, D.N.; Cardil, A.; Silva, C.A.; Botequim, B.; Soares, P.; Silva, M.; González-Ferreiro, E.; Díaz-Varela, R.A. Predicting Growing Stock Volume of Eucalyptus Plantations Using 3-D Point Clouds Derived from UAV Imagery and ALS Data. Forests 2019, 10, 905. [Google Scholar] [CrossRef]
- Fakhri, A.; Latifi, H. A Consumer Grade UAV-Based Framework to Estimate Structural Attributes of Coppice and High Oak Forest Stands in Semi-Arid Regions. Remote Sens. 2021, 13, 4367. [Google Scholar] [CrossRef]
- Kotivuori, E.; Kukkonen, M.; Mehtätalo, L.; Maltamo, M.; Korhonen, L.; Packalen, P. Forest Inventories for Small Areas Using Drone Imagery without In-Situ Field Measurements. Remote Sens. Environ. 2020, 237, 111404. [Google Scholar] [CrossRef]
- Parkitna, K.; Krok, G.; Miścicki, S.; Ukalski, K.; Lisańczuk, M.; Mitelsztedt, K.; Magnussen, S.; Markiewicz, A.; Stereńczak, K. Modelling Growing Stock Volume of Forest Stands with Various ALS Area-Based Approaches. For. Int. J. For. Res. 2021, 94, 630–650. [Google Scholar] [CrossRef]
- Stolle, L.; Corte, A.P.D.; Sanquetta, C.R.; Behling, A.; Hentz, Â.M.K.; Eisfeld, R.D.L. Predicting Stand Volume by Number of Trees Automatically Detected in UAV Images: An Alternative Method for Forest Inventory. Forests 2021, 12, 1508. [Google Scholar] [CrossRef]
- Packalén, P.; Suvanto, A.; Maltamo, M. A Two Stage Method to Estimate Species-Specific Growing Stock. Photogramm. Eng. Remote Sens. 2009, 75, 1451–1460. [Google Scholar] [CrossRef]
- White, J.; Wulder, M.; Varhola, A.; Vastaranta, M.; Coops, N.; Cook, B.; Pitt, D.; Woods, M. A Best Practices Guide for Generating Forest Inventory Attributes from Airborne Laser Scanning Data Using an Area-Based Approach. For. Chron. 2013, 89, 722–723. [Google Scholar] [CrossRef]
- Domingo, D.; Ørka, H.O.; Næsset, E.; Kachamba, D.; Gobakken, T. Effects of UAV Image Resolution, Camera Type, and Image Overlap on Accuracy of Biomass Predictions in a Tropical Woodland. Remote Sens. 2019, 11, 948. [Google Scholar] [CrossRef]
- Moudrý, V.; Klápště, P.; Fogl, M.; Gdulová, K.; Barták, V.; Urban, R. Assessment of LiDAR Ground Filtering Algorithms for Determining Ground Surface of Non-Natural Terrain Overgrown with Forest and Steppe Vegetation. Measurement 2020, 150, 107047. [Google Scholar] [CrossRef]
- Oniga, V.-E.; Loghin, A.-M.; Macovei, M.; Lazar, A.-A.; Boroianu, B.; Sestras, P. Enhancing LiDAR-UAS Derived Digital Terrain Models with Hierarchic Robust and Volume-Based Filtering Approaches for Precision Topographic Mapping. Remote Sens. 2023, 16, 78. [Google Scholar] [CrossRef]
- European Commission; Joint Research Centre; Florio, P.; Kakoulaki, G.; Martinez, A. Non-Commercial Light Detection and Ranging (LiDAR) Data in Europe; Publications Office of the EU: Luxembourg, 2021. [Google Scholar]
- Giannetti, F.; Chirici, G.; Gobakken, T.; Næsset, E.; Travaglini, D.; Puliti, S. A New Approach with DTM-Independent Metrics for Forest Growing Stock Prediction Using UAV Photogrammetric Data. Remote Sens. Environ. 2018, 213, 195–205. [Google Scholar] [CrossRef]
Disclaimer/Publisher’s Note: The statements, opinions and data contained in all publications are solely those of the individual author(s) and contributor(s) and not of MDPI and/or the editor(s). MDPI and/or the editor(s) disclaim responsibility for any injury to people or property resulting from any ideas, methods, instructions or products referred to in the content. |
© 2024 by the authors. Licensee MDPI, Basel, Switzerland. This article is an open access article distributed under the terms and conditions of the Creative Commons Attribution (CC BY) license (https://creativecommons.org/licenses/by/4.0/).