Article

Soil-Moisture-Dependent Temperature Sensitivity of Soil Respiration in a Poplar Plantation in Northern China

1
School of Soil and Water Conservation, Beijing Forestry University, Qinghua East Road 35, Beijing 100083, China
2
Department of Life Sciences, Yuncheng University, Fudan West Street 1155, Yuncheng 044000, China
*
Author to whom correspondence should be addressed.
Forests 2024, 15(8), 1466; https://doi.org/10.3390/f15081466
Submission received: 12 June 2024 / Revised: 12 August 2024 / Accepted: 13 August 2024 / Published: 21 August 2024

Abstract

:
The temperature sensitivity (Q10) of soil respiration (Rs) plays a crucial role in evaluating the carbon budget of terrestrial ecosystems under global warming. However, the variability in Q10 along soil moisture gradients remains a subject of debate, and the associated underlying causes are poorly understood. This study aims to investigate the characteristics of Q10 changes along soil moisture gradients throughout the whole growing season and to assess the factors influencing Q10 variability. Changes in soil respiration (measured by the dynamic chamber method) and soil properties were analyzed in a poplar plantation located in the suburban area of Beijing, China. The results were as follows: (1) Q10 increased with the increasing soil water content up to a certain threshold, and then decreased, (2) the threshold was 75% to 80% of the field capacity (i.e., the moisture content at capillary rupture) rather than the field water-holding capacity, and (3) the dominant influence shifted from soil solid-phase properties to microbes with increasing soil moisture. Our results are important for understanding the relationship between the temperature sensitivity of soil respiration and soil moisture in sandy soil, and for the refinement of the modeling of carbon cycling in terrestrial ecosystems.

1. Introduction

Soil respiration (Rs) usually refers to the total soil carbon dioxide (CO2) efflux from the soil surface [1], including autotrophic respiration by roots and their microbial symbionts and heterotrophic respiration by soil microbes that decompose litter and soil organic matter [2,3]. Rs constitutes a significant fraction of the global carbon cycle [1]. The carbon cycle represents the most crucial and intricate biogeochemical cycle within soil ecosystems [4]. Rs plays a pivotal role in regulating ecosystem carbon cycling and biogeochemical cycles in soil ecosystems. Temperature sensitivity (Q10), a measure of the increase in Rs in response to a 10 °C increase in temperature, is a critical metric for forecasting carbon cycling in terrestrial ecosystems [5].
Q10 is controlled by various biotic and abiotic factors, such as the actinomycetes:bacteria ratio [6], fungi:bacteria ratio [7], relative abundance of fungal PLFAs [8], microbial biomass [7], soil properties [9], and the soil C:N ratio [10]. In addition, soil moisture is an important factor in controlling Q10 [11,12,13,14]. Janssens and Pilegaard [11] conducted an analysis of continuous Rs measurements obtained over one year in a Danish beech forest, and their results revealed a positive correlation between seasonal changes in Q10 and soil moisture, ranging from 16% to 32%. Meyer et al. [12] explored the regional variations in Q10 within the Rur catchment and reported that Q10 increased with moisture levels (30%, 45%, 60%, and 75% of the water-holding capacity) in croplands but declined in forests. Wang et al. [13] measured Rs values in six temperate forest types in northeastern China and reported that Q10 tended to increase with the increasing soil moisture up to the threshold (i.e., soil moisture was 40%–50% at a 10 cm soil depth and 70%–80% at 2 cm), after which it declined. Yan et al. [14] conducted a five-year study of measured soil CO2 effluxes in forests and grasslands in a semiarid mountainous area of the Loess Plateau, China, and reported that when the soil moisture was between the wilting point (approximately 9%) and field capacity (approximately 23%), the Q10 increased with the increasing soil moisture, and when the soil moisture fell below the wilting point, the Q10 decreased substantially. Although soil moisture has been shown to affect Q10, there is no consistent conclusion regarding their relationship.
Poplar is the principal tree species in northern China, where it is widely distributed [15]. It has become one of the most intensive plantation species in China [16] and provides important ecosystem services [17], such as bioenergy production [18], erosion control, and carbon sequestration [19]. Moreover, as fast-growing trees [20], poplars consume large volumes of water [17], and their Q10 may respond more strongly to soil moisture; however, limited attention has been given to this topic. Therefore, this study was conducted in a poplar plantation to (i) elucidate the effects of soil moisture on Q10, with particular emphasis on determining the threshold of soil moisture, and (ii) understand the reasons for this phenomenon.

2. Materials and Methods

2.1. Study Area

The experimental area is situated within a poplar plantation in the Daxing district (116°15′07″ E, 39°31′50″ N; Figure 1), which is located in the southern suburbs of Beijing in the People’s Republic of China. This diluvial region of the Yongding River has an average elevation of 30 m and a terrain slope below 5°. The area is characterized by a warm, temperate, sub-humid continental monsoon climate, with hot, wet summers, as well as cold, dry winters [21]. The average annual temperature is 11.5 °C, with an extreme minimum of −27.4 °C and an extreme maximum of 40.6 °C. The mean annual precipitation is approximately 568.9 mm, with a minimum of 261.8 mm and a maximum of 1058 mm. The growing season is from April to October. Our study was conducted in a pure plantation of poplar (Populus × euramericana cv. ‘74/76’), and the surface area of the studied forest was 180 ha. The surface of the research plot was uniform, the average planting density was 2 m × 3 m, the mean tree height was 22.81 m, and the mean tree diameter was 25.57 cm at a height of 1.3 m. The stand has a dense understory of annual herbaceous plants, such as Chenopodium acuminatum, Artemisia annua L., Medicago sativa, Melilotus officinalis, Salsola collina, and Tribulus terrestris. The predominant soil type is Ustic Alluvic Primosols. It is well-drained and has a texture with high sand content. The soil bulk density at the 0–40 cm soil layer ranges from 1.40 to 1.53 g/cm3.

2.2. Sampling and Pretreatment

After surface litter was removed, five soil cores (0–10 cm depth) were taken each month during the 2018 growing season near the location where soil respiration was measured. After visible stones and plant roots were removed, all the soil samples were immediately passed through a 2 mm sieve and separated into two subsamples. One subsample was air-dried and stored in airtight plastic bags for soil physicochemical analyses, whereas the other subsample was stored at −20 °C for soil microbial biomass carbon (MBC) and phospholipid fatty acid (PLFA) analyses.

2.3. Analysis Methods

2.3.1. Soil Physical and Chemical Properties

The soil pH was measured in a 1:2.5 soil-to-water dilution sample via a pH meter [22]. The soil total nitrogen (TN), total phosphorus (TP), and total potassium (TK) contents were measured via an elemental analyzer (Vario Macro Cube, Elementar Analysensysteme GmbH, Langenselbold, Germany) [23]. The soil organic carbon (SOC) content was quantified via the potassium dichromate-vitriol oxidization method [24]. The soil particle size distribution was assessed using the pipette method [25].

2.3.2. Soil Microbial Biomass Carbon and Microbial Community Composition

The soil MBC content was determined via the chloroform fumigation-K2SO4 extraction method [26]. In addition, PLFA analysis was conducted to determine the soil microbial community composition [27]. Phospholipids were extracted from 1.5 g of fresh soil and analyzed with an gas chromatograph (Agilent 6890, Agilent Technologies, CA, USA). Gram-positive bacteria were identified by the terminal and mid-chain branched fatty acids (i15:0, a15:0, i16:0, i17:0, and a17:0), and Gram-negative bacteria were identified by cyclopropyl-saturated and monosaturated fatty acids (16:1ω7c, cy-17:0, 18:1ω7c, and 8cy-19:0) [28]. The fatty acids 18:2ω6,9 and 18:1ω9 were used to represent saprotrophic and ectomycorrhizal fungi [29]. The total PLFA concentration was calculated from the identified PLFAs (15:0, 14:0, 16:1, 16:1ω5, 16:0, 17:1ω8, 7Me-17:0, br17:0, br18:0, 18:1ω5, 18:0, 19:1, and those listed above) [10]. The ratios of fungal to bacterial (F:B) PLFA and Gram-positive to Gram-negative (GP:GN) PLFA were used to represent the relative abundance metrics of these groups [10].

2.3.3. Soil Water Retention Curve

The soil water retention curve (soil water content-matric potential relationships) was determined via a high-speed refrigerated centrifuge (CR21GII, Hitachi Koki Co., Ltd., Tokyo, Japan) at the laboratory in Beijing Forestry University (Beijing, China).

2.3.4. Soil Respiration, Soil Temperature, and Moisture

Rs was determined in situ at a plot via an automated Rs system (LI-8100, LI-COR, Lincoln, NE, USA) and was measured continuously every half hour throughout one growing season, from April to October in 2018. Four PVC soil collars were installed 4–5 cm into the soil one month before the first measurement, and as far away from the plant roots and litter as possible to avoid the effects of plant autotrophic respiration [30]. The soil temperature (°C) and moisture (%) were recorded during respiration measurements beside the collars at a 5 cm soil depth with LI-8100 temperature and moisture probes. Throughout the study period, all vegetation growing inside the collars was regularly clipped from the soil surface to exclude aboveground plant respiration.

2.4. Temperature Sensitivity of Rs

The Q10 was evaluated using the following equations [31]:
Rs = a·ebT
Q10 = e10b
where Rs is the measured CO2 efflux (µmol m−2 s−1), T is the soil temperature (°C) at a 5 cm depth, and a and b are the fitted parameters.

2.5. Data Analysis

Statistical analysis was performed with Microsoft Excel 365, SPSS 25, and R 4.2.1 software. Various equations, including linear, quadratic, power, cubic, exponential, and logarithmic functions, were used to fit the relationship between Q10 and soil moisture. The ‘corrplot’ data package [32] in R was used to perform Pearson correlation analysis of Q10 and soil properties and generate a correlation heatmap. In addition, variance partition analysis (VPA) was performed via the ‘vegan’ data package [33] in R to assess the individual and shared effects of soil moisture, soil solid-phase properties, and microbial factors on Q10. All the factors were classified into three distinct categories [34]: soil moisture, soil solid-phase properties (including pH, TN, TP, TK, SOC, C:N, and clay) [35,36,37], and soil microbial characteristics (MBC, F:B, GP:GN, and PLFAs). The work process is illustrated in Figure 2.

3. Results

3.1. Soil Properties and Soil Water Retention Curve

The soil pH ranged from 5 to 9.1 and was 6.8 at the beginning and 5.7 at the end of the growing season, with an average pH of 6.97. The average TP was 0.68 g kg−1, with an SE of 0.02 g kg−1. The average TK was 17.67 g kg−1, with an SE of 0.85 g kg−1. The average F:B and GP:GN ratios were 0.35 and 0.66, respectively. The average clay content was 3.99%, and the average organic carbon and TN concentrations were 15.76 g kg−1 and 0.45 g kg−1, respectively. The average MBC and PLFAs concentrations were 166.18 mg kg−1 and 20.88 nmol g−1, respectively (Table 1).
The soil water retention curve revealed that as the soil water matric potential (ψ) increased, the soil moisture content generally decreased (Figure 3). Notably, when the soil water matric potential was below 100 kPa, the curve swiftly decreased, and leveled off when the soil water matric potential exceeded 100 kPa. This could be attributed to the sandy soil in the research area, as soil texture can affect the retention of soil water. When the suction reached a certain value, the water in the large pores of the sandy soil was easily discharged, the soil moisture content decreased rapidly, and only a small amount of water remained in the soil. The soil water characteristic curve obtained through empirical formula fitting was W = 27.423ψ−0.208 and R2 = 0.950. According to the fitting equation for the soil water retention curve, the field capacity (10 kPa) [38] was determined to be 16.99%, and the wilting point (150 kPa) was determined to be 9.67%.

3.2. Soil Respiration

The peak of diurnal soil respiration was observed at 18:30 p.m. on a typical sunny day during the growing season (Figure 4a). Rs, soil moisture, and soil temperature fluctuated with time, and both Rs and soil temperature exhibited a unimodal distribution over the growing season. The measured mean soil respiration values during the growing season ranged from 1.14 to 3.28 μmol m−2s−1. Rs was lowest in early April, with a mean of 1.14 μmol m−2s−1, and the SD was relatively small. Rs reached its maximum in July, and the SD was relatively large (Figure 4b).

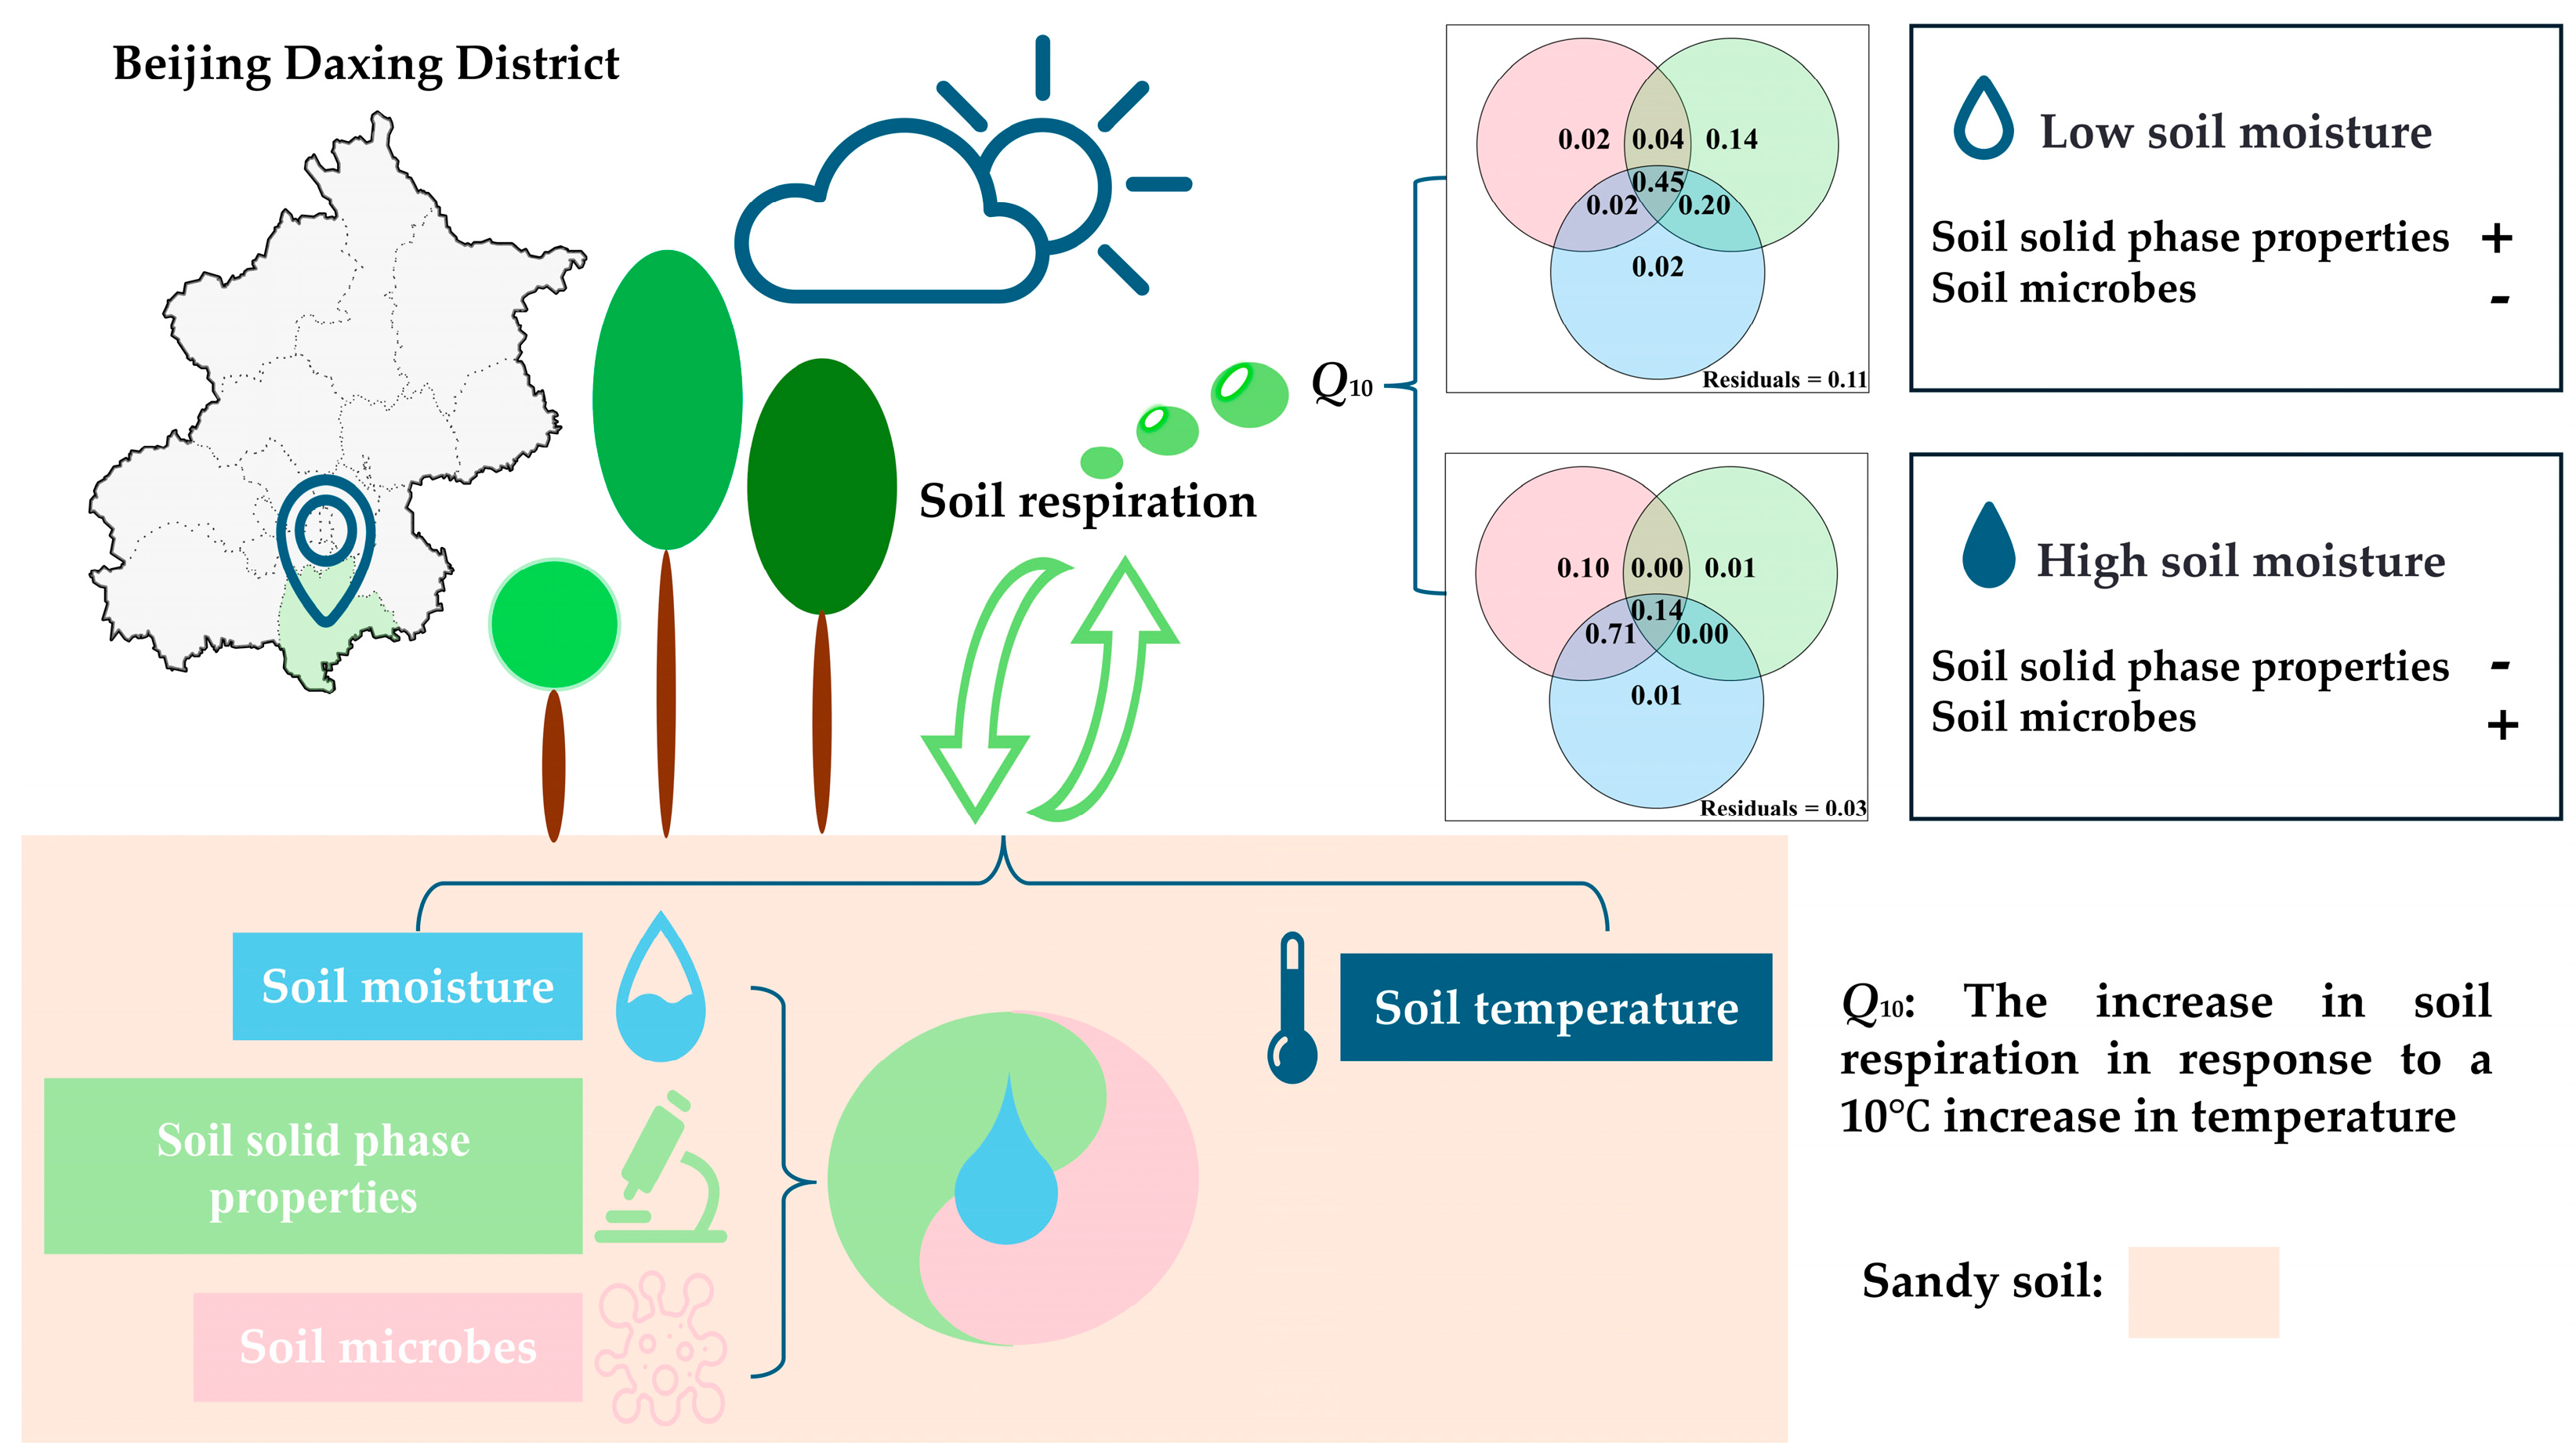
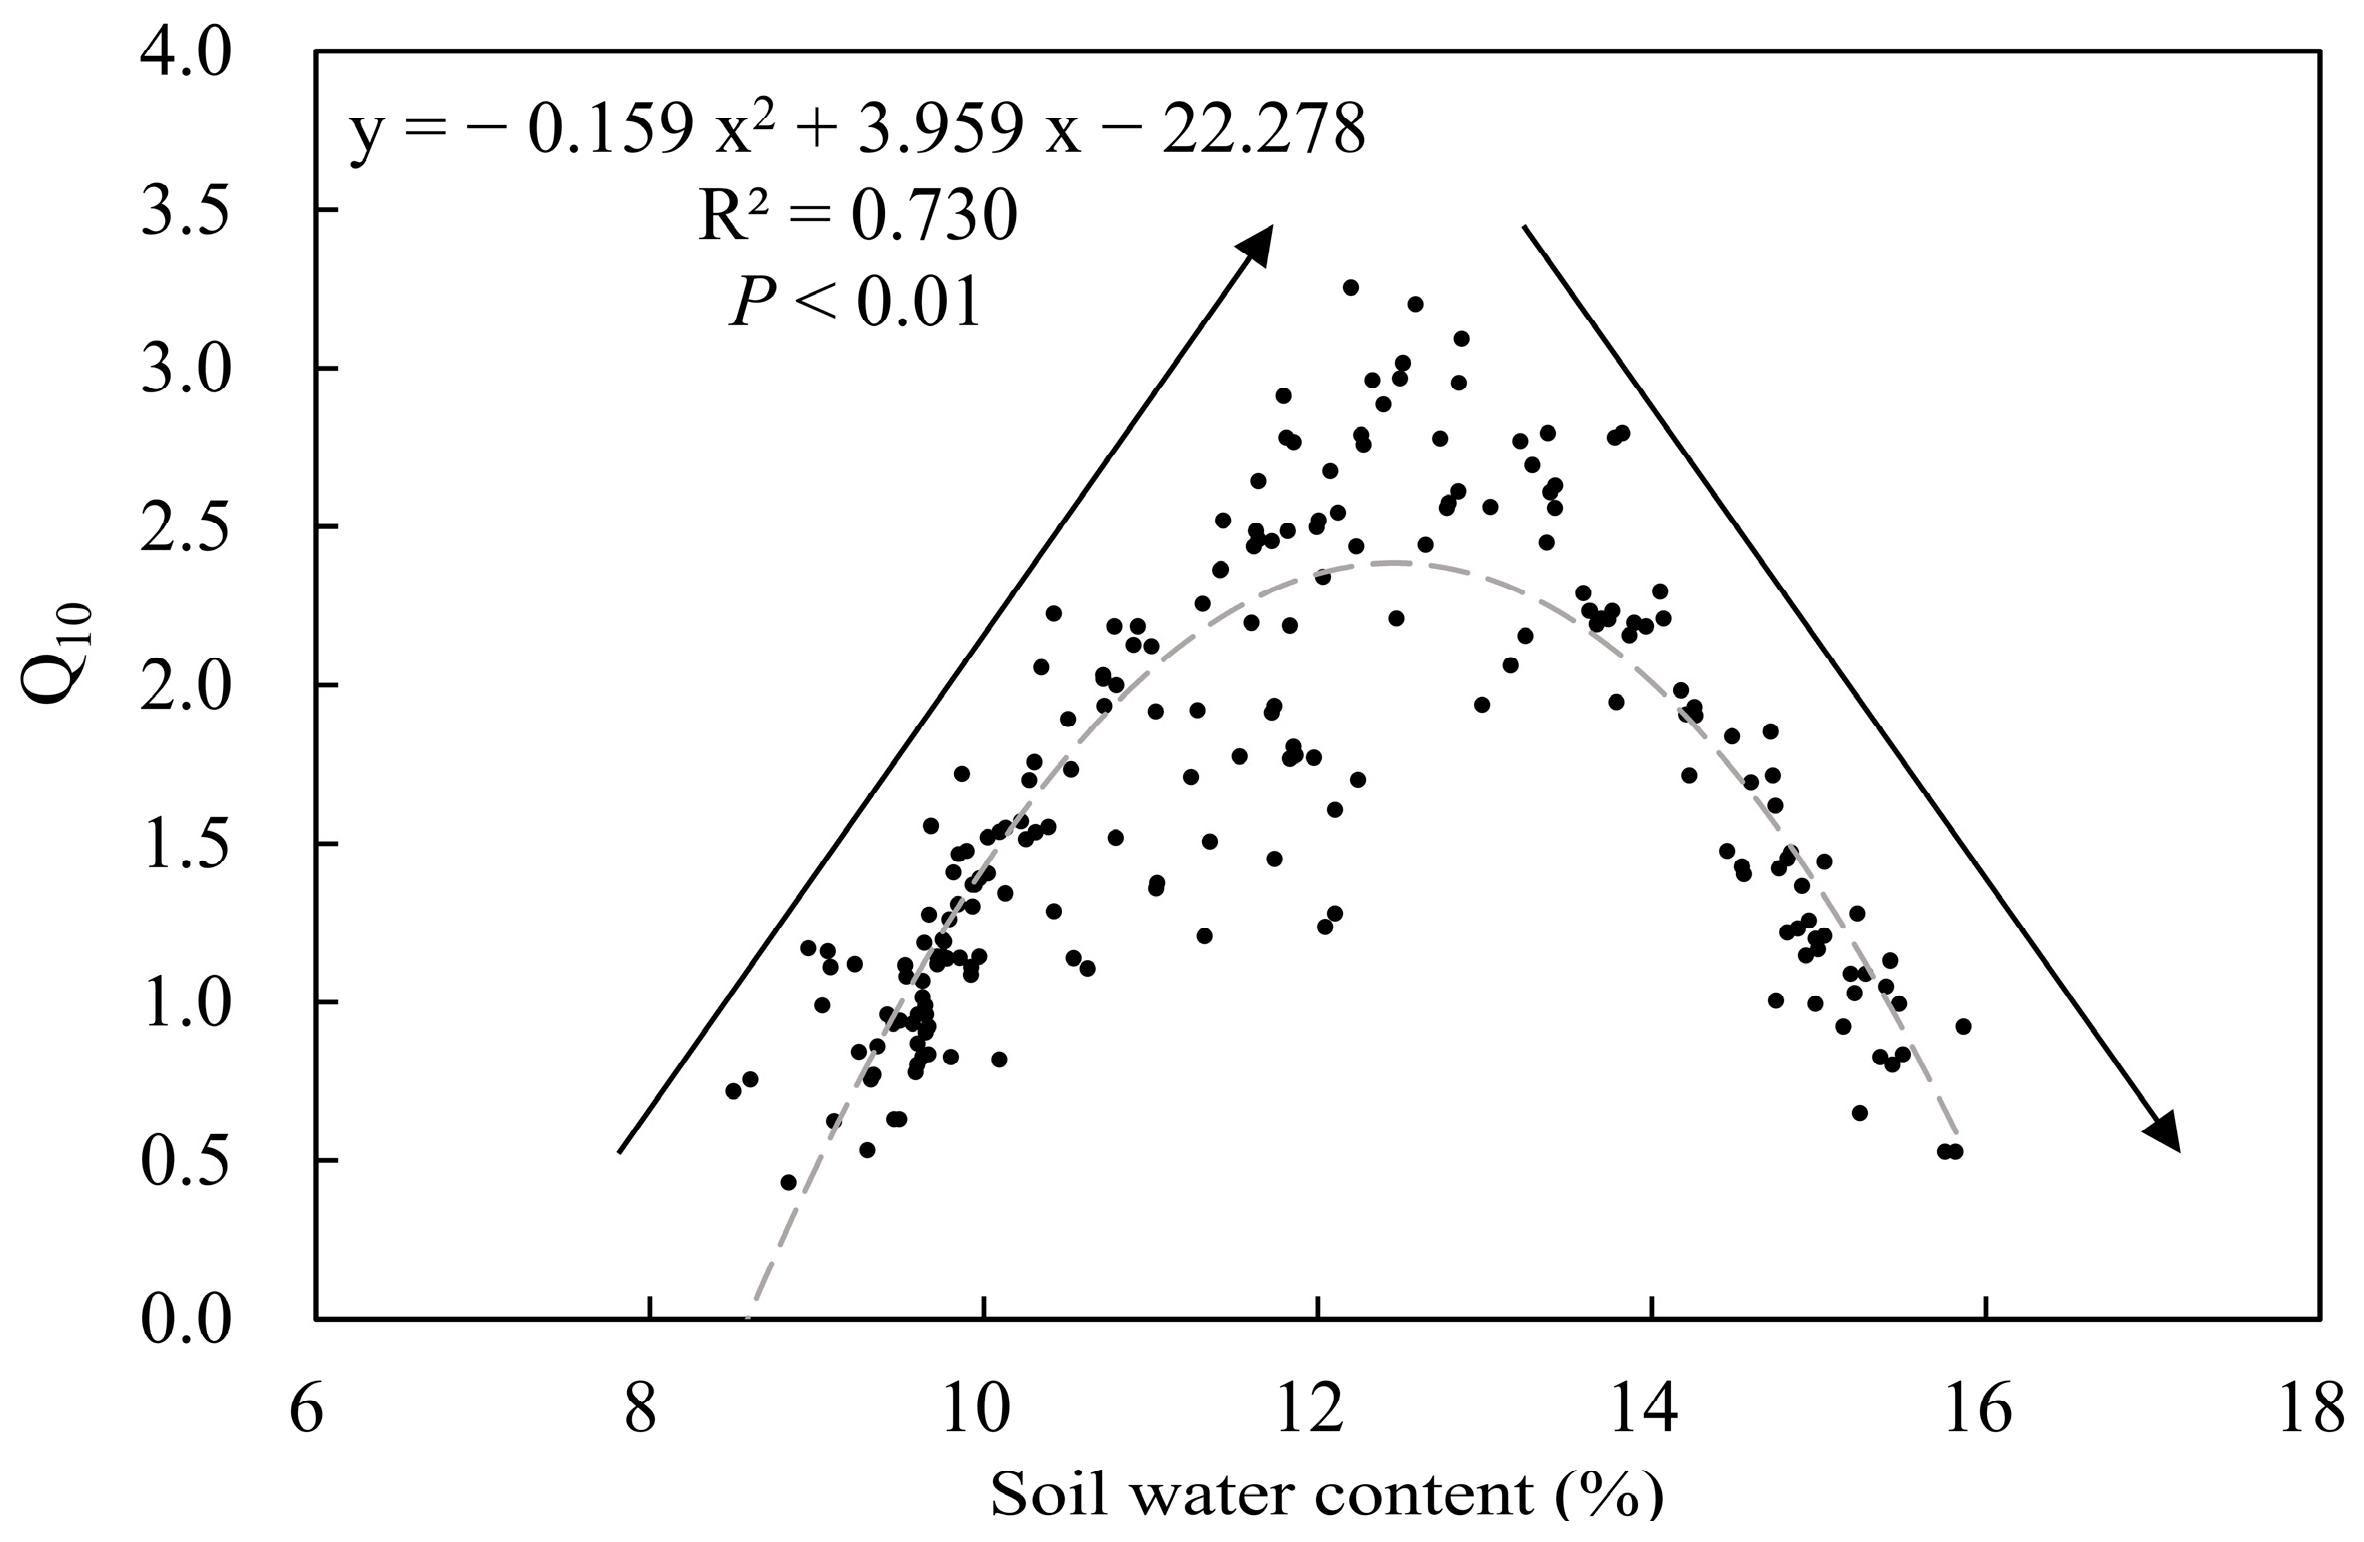
3.3. Effects of Soil Moisture on Q10

The daily Q10 fluctuated in tandem with the soil moisture, and this relationship can be accurately described by quadratic curves. The dashed line represents a fitted regression line for the combined data, showing that Q10 reached its maximum at a soil moisture content of 12.45% (R2 = 0.730, p < 0.01; Figure 5). Notably, the inflection point of Q10 with changes in soil moisture closely aligned with the moisture content at capillary rupture (WRC; 12.73%).

3.4. Correlations of Q10 with Soil Properties and Microbial Characteristics in Response to Soil Moisture Variability

The heatmap shows the correlations between Q10 and soil properties and microbial characteristics under different soil moisture conditions (Figure 6). As shown in Figure 6a, the linear correlation analysis revealed that MBC (r = 0.205, p < 0.05) was strongly correlated with Q10 and that F:B (r = 0.730, p < 0.001) was strongly significantly correlated with Q10. Among the soil physicochemical properties, four were strongly significantly correlated with Q10 (p < 0.001). Specifically, Q10 was positively correlated with TP (r = 0.912, p < 0.001), SOC (r = 0.922, p < 0.001), and C:N (r = 0.694, p < 0.001), but was negatively correlated with the soil clay content (r = −0.285, p < 0.001). Figure 6b shows that Q10 had a strongly significant association with F:B (r = 0.974, p < 0.001) and PLFAs (r = 0.685, p < 0.001) and was strongly correlated with MBC (r = 0.276, p < 0.05). Among the soil physicochemical properties, Q10 was positively related to TP (r = 0.954, p < 0.001), SOC (r = 0.416, p < 0.001), and the C:N ratio (r =0.283, p < 0.05). The other indices did not significantly correlate with Q10.
The alterations in soil moisture influenced the relationships among various variables and Q10. An increase in soil moisture led to a substantial decrease in the correlation of C:N (p < 0.05) and, conversely, an increase in the correlation of PLFAs (p < 0.001; Figure 6a,b). Moreover, the correlation of Q10 with pH revealed a notable shift from a negative correlation to a positive correlation as the soil moisture increased, and the correlation of TK with Q10 changed from a positive correlation to a negative correlation with increasing soil moisture. Additionally, the correlation between the clay content and Q10, which was initially strongly significantly negative (p < 0.001), was positive with increasing soil moisture.

3.5. Effects of Soil Moisture, Soil Solid-Phase Properties, and Microbial Characteristics on Q10

Figure 7 shows that the Q10 values were influenced by both individual and shared factors, including soil moisture, soil solid-phase properties, and microbial factors. These effects were observed when the soil moisture levels were below the WRC (a) and when the soil moisture levels exceeded the WRC (b).
When the soil moisture was lower than the WRC, the interaction and independent effects of soil moisture, solid-phase properties, and microbial factors on Q10 reached 89% (Figure 7a). Notably, the combined impact of water, soil solid-phase properties, and microbes was most influential, contributing 45% to the interpretation rate of Q10, followed by the combined effects of water and soil solid-phase properties, which contributed a total of 20% to the interpretation of Q10. The independent contribution of the soil solid-phase property factor to Q10 was 14%. However, interactions among microbes and soil solid-phase property factors or soil moisture, as well as the independent effects of microbes or soil moisture, had a limited influence on Q10. When the soil moisture exceeded the WRC, the interactions and independent effects of soil moisture, solid-phase properties, and microbial factors on Q10 increased to 97% (Figure 7b). The combined effect of soil moisture and microbes had the highest explanatory power at 71%, followed by the combined effect of soil moisture, soil solid-phase properties, and microbial factors, contributing 14% to the interpretation rate of Q10. The independent contribution of the soil microbial factors to Q10 was 10%. The pairwise interactions between soil solid-phase properties and soil moisture or microbial factors, and individual soil moisture or soil solid-phase properties, had minimal impacts on the interpretation rate of Q10. The dynamics of the relationships between Q10 and soil properties throughout the growing season are shown in Figure 7c. We found that soil moisture, soil solid-phase properties, and microbial factors collectively drove the variability in Q10. The soil solid-phase properties were the main determinant (83%) of Q10 at relatively low soil water contents (W < WRC), whereas the microbial factors exerted a more important control (95%) at relatively high soil water contents (W > WRC).

4. Discussion

4.1. Changes in Q10 Vary with Soil Moisture

Some studies have reported that there is a quadratic relationship between Q10 and soil moisture, and this relationship has a threshold value [13,14]. The results in our study area indicated that changes in Q10 in response to varying soil moisture levels during the growing season can be effectively described by a quadratic function (R2 = 0.730; Figure 5). Q10 increased with increasing soil moisture until a certain threshold was reached, after which it decreased. The inflection point, which corresponds to approximately 75% of the field capacity, was closely aligned with the WRC. This quadratic function pattern was consistent with findings documented in previous research conducted on temperate forests [13] and on forests and grasslands in the eastern Loess Plateau of China [14]. Notably, the threshold found in our study area was lower than that reported for temperate forests [13] and was inconsistent with the findings of Yan et al. [14], who reported an increase in Q10 with increasing soil water content between the wilting point and field capacity and a significant decrease in Q10 when the soil water content either fell below the wilting point or exceeded the field capacity.
This inconsistency may have occurred because previous studies [13,14,39,40] mainly focused on investigating the effects of changes in soil water content on Q10. However, relatively less attention has been paid to the effect of the continuous state of water in capillaries on Q10. As highlighted by Yang et al. [41], Q10 is influenced by factors such as microbial activity. In particular, soil microorganism activities and carbon emission rates may be affected by the continuous state of moisture in capillaries rather than merely by the moisture content [42,43]. Our research revealed that the threshold for the relationship between Q10 and soil moisture corresponded to the WRC (12.73%). The WRC describes the gradual reduction in capillary water due to plant root absorption and soil surface evaporation to the point at which it is no longer continuous, and this discontinuity interrupts the movement of capillary water [44]. When the soil moisture falls below the WRC, the water in the soil capillaries becomes discontinuous; conversely, when the soil moisture exceeds the WRC, the water in the soil capillaries remains continuous and can move efficiently. When water is stored in pores aided by capillary forces, capillary water is most readily absorbed and utilized by plants [44]. The continuous state of moisture in the capillaries could affect the activity of soil microorganisms and the rate of carbon emission, resulting in a change in Q10.
Our work deepened our understanding of the complex relationships between Q10 and soil moisture on the basis of the soil water content and the continuous state of water in capillaries.

4.2. Variability of Influencing Factors on Q10 with Soil Moisture

Previous studies mainly focused on the influence of individual factors on soil respiration [45,46] and paid less attention to the changes in factors that affect soil respiration under changing soil moisture conditions. In fact, soil moisture status could affect the balance between respiration and diffusion, or alter the response of soil respiration to temperature, thereby changing the concentration and flux of soil CO2 [47,48]. In addition, the soil tested in this study was a sandy soil. Normally, the quantity and quality of soil organic matter and soil texture can affect soil water retention and most related soil biochemical processes, including soil respiration [49,50,51,52,53,54]. Our results highlighted that Q10 was intricately shaped by a combination of soil solid-phase properties, microbial characteristics, and soil moisture in sandy soil, and that the influence of these factors on Q10 showed remarkable variability under changing soil moisture conditions. Specifically, when soil moisture fell below the WRC, soil solid-phase properties emerged as the dominant factor, leading to the highest individual interpretation rate for Q10. When soil moisture exceeded the WRC, the individual interpretation rate of soil microbes surpassed that of other factors.
In instances of low soil moisture content, an increase in Q10 was observed with increasing soil moisture. Under these conditions, soil solid-phase properties assumed a pivotal role, which was similar to the conclusions drawn by Haaf et al. [9], who emphasized that Q10 is predominantly controlled by the interactive effects of soil properties (including soil organic matter and fertility, soil CNP stoichiometry, and clay and weathering, among others). Additionally, variations in soil texture may contribute to differences in Q10 [12], which was similar to the results of previous studies [31], as respiration is influenced by the amount of free water for substrate diffusion, which is dependent on the clay content [50]. Furthermore, the positive correlation between the SOC ratios and Q10 values aligned with the findings of other studies [53]. This conclusion is partly because the labile pool of SOC serves as a significant substrate for Rs [53], mineralization of organic carbon in soils causes soil respiration [48], and ecosystems with relatively high SOC levels generally have relatively high soil CO2 efflux potential [53].
As the soil moisture levels surpassed the WRC, there was a discernible decrease in Q10 with the increasing soil moisture, indicating that microbial characteristics played a significant role. This finding was similar to that of Yang et al. [41], who reported that Q10 is influenced by the composition of the soil microbial community. This could be attributed to the fact that more than half of Rs is controlled by the metabolism of soil microbes [46,55], and at relatively high moisture levels, additional limitations, such as restricted oxygen diffusion, which affects microbial activity, may come into play [43]. Moreover, there are differences in drought tolerance among taxonomic and functional groups of microorganisms, variations in soil moisture can lead to shifts in the composition and function of the soil microbial community [56,57,58], and changes in microbial community composition and structure have the potential to alter both Rs and Q10 [8,59,60]. In our study, we identified a strongly significant positive relationship between F:B and Q10 (p < 0.001). This observation agreed with the carbon quality hypothesis, which proposes that soils with greater abundances of fungi or greater F:B ratios would exhibit greater Q10 [56]. Furthermore, the relationship between MBC and Q10 was consistently and strongly positive (p < 0.05). This finding underscored the crucial role of MBC in contributing to differences in Rs: a high MBC indicates an abundant microbial population and the availability of ample substrate for Rs. Conversely, a reduction in soil MBC indicates a decrease in microbial activity and biomass, which could consequently restrict Rs [61].
Our study demonstrated the influence of microbial community composition on Q10. However, it faced limitations due to the complex interactions among microorganisms [62]. Further studies are needed to explore the effects of individual microbial taxa and the effects of microbial functional traits on Q10. Our findings provide a reference for conducting accurate assessments and modeling of carbon cycling in territorial ecosystems.

5. Conclusions

Our research revealed a parabolic pattern in the correlation between soil moisture and Q10. The inflection point in the soil moisture–Q10 relationship was identified as 75% to 80% of the field capacity. This identification significantly contributed to the interpretation of the primary controlling factors that govern the soil moisture–Q10 relationship. Furthermore, the study highlighted that the response of Q10 to soil moisture was a joint outcome of soil moisture, soil solid-phase properties, and microbial influences. Notably, when the soil moisture was below the moisture content at capillary rupture, the soil solid-phase properties predominantly contributed to the variations in Q10; when the soil moisture exceeded the moisture content at capillary rupture, microbes became the individual factor with the highest interpretation rate for Q10. This distinction provides valuable insights into understanding the diverse driving factors that influence Q10 in sandy soil. These results have significant implications for the assessment of soil carbon emissions and contribute to advancements in modeling accuracy. Future research should focus on examining the specific roles of microbial functional traits in regulating Q10. Furthermore, additional experiments under specific site conditions should be conducted to extend the findings to other soil types, particularly clay-textured soils.

Author Contributions

Conceptualization, T.Z.; investigation, H.H. and J.T.; data curation, H.H.; visualization, H.H.; writing—original draft, H.H.; writing—review and editing, T.Z. All authors have read and agreed to the published version of the manuscript.

Funding

This research was funded by the National Science and Technology Achievements Outreach Program of the National Forestry Administration (No. [2019]03).

Data Availability Statement

Data will be made available upon reasonable request to the corresponding author.

Acknowledgments

We appreciate the anonymous reviewers for their valuable comments and suggestions on the manuscript.

Conflicts of Interest

The authors declare no conflicts of interest.

References

  1. Li, Z.T.; Yang, J.Y.; Drury, C.F.; Yang, X.M.; Reynolds, W.D.; Li, X.G.; Hu, C.S. Evaluation of the DNDC model for simulating soil temperature, moisture and respiration from monoculture and rotational corn, soybean and winter wheat in Canada. Ecol. Model. 2017, 360, 230–243. [Google Scholar] [CrossRef]
  2. Fang, C.; Li, F.M.; Pei, J.Y.; Ren, J.; Gong, Y.H.; Yuan, Z.Q.; Ke, W.B.; Zheng, Y.; Bai, X.K.; Ye, J.-S. Impacts of warming and nitrogen addition on soil autotrophic and heterotrophic respiration in a semi-arid environment. Agric. For. Meteorol. 2018, 248, 449–457. [Google Scholar] [CrossRef]
  3. Zhou, G.Y.; Zhou, X.H.; Liu, R.Q.; Du, Z.G.; Zhou, L.Y.; Li, S.S.; Liu, H.Y.; Shao, J.J.; Wang, J.W.; Nie, Y.Y.; et al. Soil fungi and fine root biomass mediate drought-induced reductions in soil respiration. Funct. Ecol. 2020, 34, 2634–2643. [Google Scholar] [CrossRef]
  4. Wang, Q.; Zhang, Q.Y.; Han, Y.C.; Zhang, D.L.; Zhang, C.-C.; Hu, C.X. Carbon cycle in the microbial ecosystems of biological soil crusts. Soil Biol. Biochem. 2022, 171, 108729. [Google Scholar] [CrossRef]
  5. Yang, Y.; Li, T.; Pokharel, P.; Liu, L.X.; Qiao, J.B.; Wang, Y.Q.; An, S.S.; Chang, S.X. Global effects on soil respiration and its temperature sensitivity depend on nitrogen addition rate. Soil Biol. Biochem. 2022, 174, 108814. [Google Scholar] [CrossRef]
  6. Liu, Y.; He, N.P.; Zhu, J.X.; Xu, L.; Yu, G.R.; Niu, S.L.; Sun, X.M.; Wen, X.F. Regional variation in the temperature sensitivity of soil organic matter decomposition in China’s forests and grasslands. Glob. Change Biol. 2017, 23, 3393–3402. [Google Scholar] [CrossRef] [PubMed]
  7. Qian, Y.Q.; He, F.P.; Wang, W. Seasonality, rather than nutrient addition or vegetation types, influenced short-term temperature sensitivity of soil organic carbon decomposition. PLoS ONE 2016, 11, e0153415. [Google Scholar] [CrossRef] [PubMed]
  8. Qin, S.Q.; Chen, L.Y.; Fang, K.; Zhang, Q.W.; Wang, J.; Liu, F.T.; Yu, J.C.; Yang, Y.H. Temperature sensitivity of SOM decomposition governed by aggregate protection and microbial communities. Sci. Adv. 2019, 5, eaau1218. [Google Scholar] [CrossRef] [PubMed]
  9. Haaf, D.; Six, J.; Doetterl, S. Global patterns of geo-ecological controls on the response of soil respiration to warming. Nat. Clim. Change 2021, 11, 623–627. [Google Scholar] [CrossRef]
  10. Wang, Q.K.; Liu, S.G.; Tian, P. Carbon quality and soil microbial property control the latitudinal pattern in temperature sensitivity of soil microbial respiration across Chinese forest ecosystems. Glob. Change Biol. 2018, 24, 2841–2849. [Google Scholar] [CrossRef] [PubMed]
  11. Janssens, I.A.; Pilegaard, K. Large seasonal changes in Q10 of soil respiration in a beech forest. Glob. Change Biol. 2003, 9, 911–918. [Google Scholar] [CrossRef]
  12. Meyer, N.; Welp, G.; Amelung, W. The temperature sensitivity (Q10) of soil respiration: Controlling factors and spatial prediction at regional scale based on environmental soil classes. Glob. Biogeochem. Cycles 2018, 32, 306–323. [Google Scholar] [CrossRef]
  13. Wang, C.K.; Yang, J.Y.; Zhang, Q.Z. Soil respiration in six temperate forests in China. Glob. Change Biol. 2006, 12, 2103–2114. [Google Scholar] [CrossRef]
  14. Yan, J.X.; Chen, L.F.; Li, J.J.; Li, H.J. Five-year soil respiration reflected soil quality evolution in different forest and grassland vegetation types in the eastern Loess Plateau of China. CLEAN Soil Air Water 2013, 41, 680–689. [Google Scholar] [CrossRef]
  15. Di, N.; Yang, S.J.; Liu, Y.; Fan, Y.X.; Duan, J.; Nadezhdina, N.; Li, X.M.; Xi, B.Y. Soil-moisture-dependent nocturnal water use strategy and its responses to meteorological factors in a seasonal-arid poplar plantation. Agric. Water Manag. 2022, 274, 107984. [Google Scholar] [CrossRef]
  16. Chen, L.H.; Mi, J.X.; Hao, L.T.; He, F.; Yang, H.B.; Wan, X.Q.; Zhang, F.; Liu, Y.; Lin, T.T. Effects of simulated nitrogen deposition on the ecophysiological responses of Populus beijingensis and P. cathayana under intra- and interspecific competition. Plant Soil 2022, 481, 127–146. [Google Scholar] [CrossRef]
  17. Rogers, E.R.; Zalesny, R.S.; Lin, C.-H.; Vinhal, R.A. Intrinsic and extrinsic factors influencing Populus water use: A literature review. J. Environ. Manag. 2023, 348, 119180. [Google Scholar] [CrossRef] [PubMed]
  18. An, Y.; Liu, Y.; Liu, Y.J.; Lu, M.Z.; Kang, X.H.; Mansfield, S.D.; Zeng, W.; Zhang, J. Opportunities and barriers for biofuel and bioenergy production from poplar. GCB Bioenergy 2021, 13, 905–913. [Google Scholar] [CrossRef]
  19. McIvor, I.; Douglas, G.; Dymond, J.; Eyles, G.; Marden, M. Pastoral hill slope erosion in New Zealand and the role of poplar and willow trees in its reduction. In Soil Erosion Issues in Agriculture; Godone, D., Stanchi, S., Eds.; InTech: Rijeka, Croatia, 2011; pp. 257–278. [Google Scholar] [CrossRef]
  20. Navarro, A.; Portillo-Estrada, M.; Ceulemans, R. Identifying the best plant water status indicator for bio-energy poplar genotypes. GCB Bioenergy 2020, 12, 426–444. [Google Scholar] [CrossRef]
  21. Wu, X.Y.; Xu, H.; Zha, T.G.; Zhao, Y.; Zhang, Z.Q. Soil water availability induces divergent ecosystem water-use strategies to dry-heat conditions in two poplar plantations in North China. Agric. For. Meteorol. 2024, 353, 110074. [Google Scholar] [CrossRef]
  22. Kooch, Y.; Rostayee, F.; Hosseini, S.M. Effects of tree species on topsoil properties and nitrogen cycling in natural forest and tree plantations of northern Iran. Catena 2016, 144, 65–73. [Google Scholar] [CrossRef]
  23. Man, Z.H.; Xie, C.K.; Jiang, R.Y.; Liang, A.Z.; Wu, H.; Che, S.Q. Effects of revetments on soil ecosystems in the urban river-riparian interface. iScience 2022, 25, 105277. [Google Scholar] [CrossRef]
  24. Bao, S.D. Soil and Agricultural Chemistry Analysis, 3rd ed.; China Agriculture Press: Beijing, China, 2000; pp. 30–34. [Google Scholar]
  25. Gee, G.W.; Or, D. Methods of soil analysis, part 4: Physical methods. In Particle-Size Analysis; Dane, J.H., Topp, G.C., Eds.; SSSA Book Ser. 5; SSSA: Madison, WI, USA, 2002; pp. 255–293. [Google Scholar]
  26. Vance, E.D.; Brookes, P.C.; Jenkinson, D.S. An extraction method for measuring soil microbial biomass carbon. Soil Biol. Biochem. 1987, 19, 703–707. [Google Scholar] [CrossRef]
  27. Bardgett, R.D.; Hobbs, P.J.; Frostegård, A. Changes in soil fungal: Bacterial biomass ratios following reductions in the intensity of management of an upland grassland. Biol. Fert. Soils 1996, 22, 261–264. [Google Scholar] [CrossRef]
  28. Rinnan, R.; Bååth, E. Differential utilization of carbon substrates by bacteria and fungi in tundra soil. Appl. Environ. Microbiol. 2009, 75, 3611–3620. [Google Scholar] [CrossRef]
  29. Kaiser, C.; Koranda, M.; Kitzler, B.; Fuchslueger, L.; Schnecker, J.; Schweiger, P.; Rasche, F.; Zechmeister-Boltenstern, S.; Sessitsch, A.; Richter, A. Belowground carbon allocation by trees drives seasonal patterns of extracellular enzyme activities by altering microbial community composition in a beech forest soil. New Phytol. 2010, 187, 843–858. [Google Scholar] [CrossRef]
  30. Dong, H.Y.; Hu, Y.; Qian, L.W.; Yan, J.F.; Gao, L.Y.; Mei, W.X.; Zhang, J.L.; Chen, X.Z.; Wu, P.F.; Sun, Y.; et al. Preliminary manifestation of the Yangtze River Protection Strategy in improving the carbon sink function of estuary wetlands. iScience 2024, 27, 108974. [Google Scholar] [CrossRef]
  31. Li, J.Q.; Pei, J.M.; Pendall, E.; Fang, C.M.; Nie, M. Spatial heterogeneity of temperature sensitivity of soil respiration: A global analysis of field observations. Soil Biol. Biochem. 2020, 141, 107675. [Google Scholar] [CrossRef]
  32. Wei, T.; Simko, V. R Package ‘Corrplot’: Visualization of a Correlation Matrix. 2021, R Package Version 0.92. Available online: https://github.com/taiyun/corrplot (accessed on 20 April 2023).
  33. Oksanen, J.; Blanchet, F.G.; Kindt, R.; Legendre, P.; Minchin, P.R.; O’hara, R.B.; Simpson, G.L.; Solymos, P.; Stevens, M.H.H.; Wagner, H. Package ‘vegan’. In Community Ecology Package Version 2; R Software Inc.: Indianapolis, IN, USA, 2013; Volume 2, pp. 1–295. [Google Scholar]
  34. Peres-Neto, P.R.; Legendre, P.; Dray, S.; Borcard, D. Variation partitioning of species data matrices: Estimation and comparison of fractions. Ecology 2006, 87, 2614–2625. [Google Scholar] [CrossRef]
  35. Lilienfein, J.; Wilcke, W.; Vilela, L.; Do Carmo Lima, S.; Thomas, R.; Zech, W. Effect of no-tillage and conventional tillage systems on the chemical composition of soil solid phase and soil solution of Brazilian savanna oxisols. J. Plant Nutr. Soil Sci. 2000, 163, 411–419. [Google Scholar] [CrossRef]
  36. Janssen, R.P.T.; Peijnenburg, W.J.G.M.; Posthuma, L.; Van Den Hoop, M.A.G.T. Equilibrium partitioning of heavy metals in Dutch field soils. I. Relationship between metal partition coefficients and soil characteristics. Environ. Toxicol. Chem. 1997, 16, 2470–2478. [Google Scholar] [CrossRef]
  37. Zaidel’man, F.R.; Ustinov, M.T.; Pakhomova, E.Y. Solods of the Baraba Lowland and the Priobskoe Plateau: Their properties and genesis and the methods of their diagnostics. Eurasian Soil Sci. 2010, 43, 1069–1082. [Google Scholar] [CrossRef]
  38. da Costa, A.; Albuquerque, J.A.; Almeida, J.A.D.; da Costa, A.; Luciano, R.V. Pedotransfer functions to estimate retention and availability of water in soils of the state of Santa Catarina, Brazil. Rev. Bras. De Ciênc. Do Solo 2013, 37, 889–910. [Google Scholar] [CrossRef]
  39. Zhu, M.X.; De Boeck, H.J.; Xu, H.; Chen, Z.S.N.; Lv, J.; Zhang, Z.Q. Seasonal variations in the response of soil respiration to rainfall events in a riparian poplar plantation. Sci. Total Environ. 2020, 747, 141222. [Google Scholar] [CrossRef] [PubMed]
  40. Wang, M.; Li, X.J.; Wang, S.Z.; Wang, G.D.; Zhang, J.T. Patterns and controls of temperature sensitivity of soil respiration in a meadow steppe of the Songnen Plain, Northeast China. PLoS ONE 2018, 13, e0204053. [Google Scholar] [CrossRef] [PubMed]
  41. Yang, S.; Wu, H.; Wang, Z.R.; Semenov, M.V.; Ye, J.; Yin, L.M.; Wang, X.; Kravchenko, I.; Semenov, V.; Kuzyakov, Y.; et al. Linkages between the temperature sensitivity of soil respiration and microbial life strategy are dependent on sampling season. Soil Biol. Biochem. 2022, 172, 108758. [Google Scholar] [CrossRef]
  42. Smith, A.P.; Bond-Lamberty, B.; Benscoter, B.W.; Tfaily, M.M.; Hinkle, C.R.; Liu, C.X.; Bailey, V.L. Shifts in pore connectivity from precipitation versus groundwater rewetting increases soil carbon loss after drought. Nat. Commun. 2017, 8, 1335. [Google Scholar] [CrossRef] [PubMed]
  43. Han, G.X.; Sun, B.Y.; Chu, X.J.; Xing, Q.H.; Song, W.M.; Xia, J.Y. Precipitation events reduce soil respiration in a coastal wetland based on four-year continuous field measurements. Agric. For. Meteorol. 2018, 256–257, 292–303. [Google Scholar] [CrossRef]
  44. Tan, J.R. The Dynamic of Soil Respiration and Its Dependence on Soil Temperature and Water Content in a Poplar Plantation in Daxing District of Beijing, China. Master’s Thesis, Beijing Forestry University, Beijing, China, 2010. (In Chinese). [Google Scholar]
  45. Yang, C.; Zhang, Y.J.; Rong, Y.P.; Bei, Y.X.; Wei, Y.Q.; Liu, N. Temporal variation of Q10 values in response to changes in soil physiochemical properties caused by fairy rings. Eur. J. Soil Biol. 2018, 86, 42–48. [Google Scholar] [CrossRef]
  46. Zhuang, W.L.; Liu, M.Y.; Wu, Y.L.; Ma, J.T.; Zhang, Y.J.; Su, L.; Liu, Y.C.; Zhao, C.C.; Fu, S.L. Litter inputs exert greater influence over soil respiration and its temperature sensitivity than roots in a coniferous forest in north-south transition zone. Sci. Total Environ. 2023, 886, 164009. [Google Scholar] [CrossRef] [PubMed]
  47. Min, K.; Berhe, A.A.; Khoi, C.M.; van Asperen, H.; Gillabel, J.; Six, J. Differential effects of wetting and drying on soil CO2 concentration and flux in near-surface vs. deep soil layers. Biogeochemistry 2020, 148, 255–269. [Google Scholar] [CrossRef]
  48. Zhang, Y.; Li, X.; Liu, X.; Cui, Y.; Zhang, Y.; Zheng, X.; Zhang, W.; Fan, Y.; Zou, J. Effects of Drying and Rewetting Cycles on Carbon Dioxide Emissions and Soil Microbial Communities. Forests 2022, 13, 1916. [Google Scholar] [CrossRef]
  49. Yang, F.; Zhang, G.L.; Yang, J.L.; Li, D.C.; Zhao, Y.G.; Liu, F.; Yang, R.M.; Yang, F. Organic matter controls of soil water retention in an alpine grassland and its significance for hydrological processes. J. Hydrol. 2014, 519, 3086–3093. [Google Scholar] [CrossRef]
  50. Moyano, F.E.; Manzoni, S.; Chenu, C. Responses of soil heterotrophic respiration to moisture availability: An exploration of processes and models. Soil Biol. Biochem. 2013, 59, 72–85. [Google Scholar] [CrossRef]
  51. Ni, H.W.; Liu, C.Y.; Sun, B.; Liang, Y.T. Response of global farmland soil organic carbon to nitrogen application over time depends on soil type. Geoderma 2022, 406, 115542. [Google Scholar] [CrossRef]
  52. Grandy, A.S.; Strickland, M.S.; Lauber, C.L.; Bradford, M.A.; Fierer, N. The influence of microbial communities, management, and soil texture on soil organic matter chemistry. Geoderma 2009, 150, 278–286. [Google Scholar] [CrossRef]
  53. Zheng, Z.M.; Yu, G.R.; Fu, Y.L.; Wang, Y.S.; Sun, X.M.; Wang, Y.H. Temperature sensitivity of soil respiration is affected by prevailing climatic conditions and soil organic carbon content: A trans-China based case study. Soil Biol. Biochem. 2009, 41, 1531–1540. [Google Scholar] [CrossRef]
  54. Xia, Q.; Rufty, T.; Shi, W. Soil microbial diversity and composition: Links to soil texture and associated properties. Soil Biol. Biochem. 2020, 149, 107953. [Google Scholar] [CrossRef]
  55. Bölscher, T.; Ågren, G.I.; Herrmann, A.M. Land-use alters the temperature response of microbial carbon-use efficiency in soils –a consumption-based approach. Soil Biol. Biochem. 2020, 140, 107639. [Google Scholar] [CrossRef]
  56. Zhou, W.P.; Hui, D.F.; Shen, W.J. Effects of soil moisture on the temperature sensitivity of soil heterotrophic respiration: A laboratory incubation study. PLoS ONE 2014, 9, e92531. [Google Scholar] [CrossRef] [PubMed]
  57. Duan, L.M.; Liu, T.X.; Ma, L.Q.; Lei, H.M.; Singh, V.P. Analysis of soil respiration and influencing factors in a semiarid dunemeadow cascade ecosystem. Sci. Total Environ. 2021, 796, 148993. [Google Scholar] [CrossRef] [PubMed]
  58. Gray, S.B.; Classen, A.T.; Kardol, P.; Yermakov, Z.; Miller, R.M. Multiple climate change factors interact to alter soil microbial community structure in an old-field ecosystem. Soil Sci. Soc. Am. J. 2011, 75, 2217–2226. [Google Scholar] [CrossRef]
  59. Zeng, X.M.; Feng, J.; Chen, J.; Delgado-Baquerizo, M.; Zhang, Q.G.; Zhou, X.Q.; Yuan, Y.S.; Feng, S.H.; Zhang, K.X.; Liu, Y.R.; et al. Microbial assemblies associated with temperature sensitivity of soil respiration along an altitudinal gradient. Sci. Total Environ. 2022, 820, 153257. [Google Scholar] [CrossRef] [PubMed]
  60. Zhou, J.Z.; Xue, K.; Xie, J.P.; Deng, Y.; Wu, L.Y.; Cheng, X.L.; Fei, S.F.; Deng, S.P.; He, Z.L.; Van Nostrand, J.; et al. Microbial mediation of carbon-cycle feedbacks to climate warming. Nat. Clim. Change 2012, 2, 106–110. [Google Scholar] [CrossRef]
  61. Ma, X.L.; Jiang, S.J.; Zhang, Z.Q.; Wang, H.; Song, C.; He, J.-S. Long-term collar deployment leads to bias in soil respiration measurements. Methods Ecol. Evol. 2023, 14, 981–990. [Google Scholar] [CrossRef]
  62. Weiland-Brauer, N. Friends or foes—Microbial interactions in nature. Biology 2021, 10, 496. [Google Scholar] [CrossRef] [PubMed]
Figure 1. Location of the study area.
Forests 15 01466 g001
Figure 2. A conceptual diagram showing the factors influencing Q10 in sandy soil of a poplar plantation in northern China.
Forests 15 01466 g002
Figure 3. Soil water retention curve for the topsoil layer.
Forests 15 01466 g003
Figure 4. Diurnal variation (a) and temporal variation (mean values ± SD) (b) of soil respiration.
Forests 15 01466 g004
Figure 5. Relationships between daily Q10 values and soil moisture during the growing season. R2 is the proportion of variance explained. P is the significance level. The black arrows indicate the observed trend in the relationship between daily Q10 values and soil water content.
Forests 15 01466 g005
Figure 6. Correlation analysis of Q10 and soil properties for soil moisture lower than the WRC (a) and soil moisture higher than the WRC (b). The blue circles indicate positive correlations, and the red circles indicate negative correlations. The coefficients in the figure represent a strong (* p < 0.05), significant (** p < 0.01), or strongly significant (*** p < 0.001) correlation.
Forests 15 01466 g006
Figure 7. Individual and shared effects of soil moisture, soil solid-phase properties, and microbial factors on Q10, as derived when the soil moisture was lower than the WRC (a) and when the soil moisture was higher than the WRC (b). Dynamics of the relationships among Q10 and soil properties during the growing season (c).
Forests 15 01466 g007
Table 1. Basic statistics of soil properties.
Soil
Properties
pHTN
(g kg−1)
TP
(g kg−1)
TK
(g kg−1)
SOC
(g kg−1)
Clay
(%)
MBC
(mg kg−1)
F:BGP:GNPLFAs (nmol g−1)
Mean6.970.450.6817.6715.763.99166.180.350.6620.88
SE0.060.010.020.850.580.145.130.010.020.40
Disclaimer/Publisher’s Note: The statements, opinions and data contained in all publications are solely those of the individual author(s) and contributor(s) and not of MDPI and/or the editor(s). MDPI and/or the editor(s) disclaim responsibility for any injury to people or property resulting from any ideas, methods, instructions or products referred to in the content.

