
Estimation of NPP in Huangshan District Based on Deep Learning and CASA Model
Abstract
:1. Introduction
2. Materials
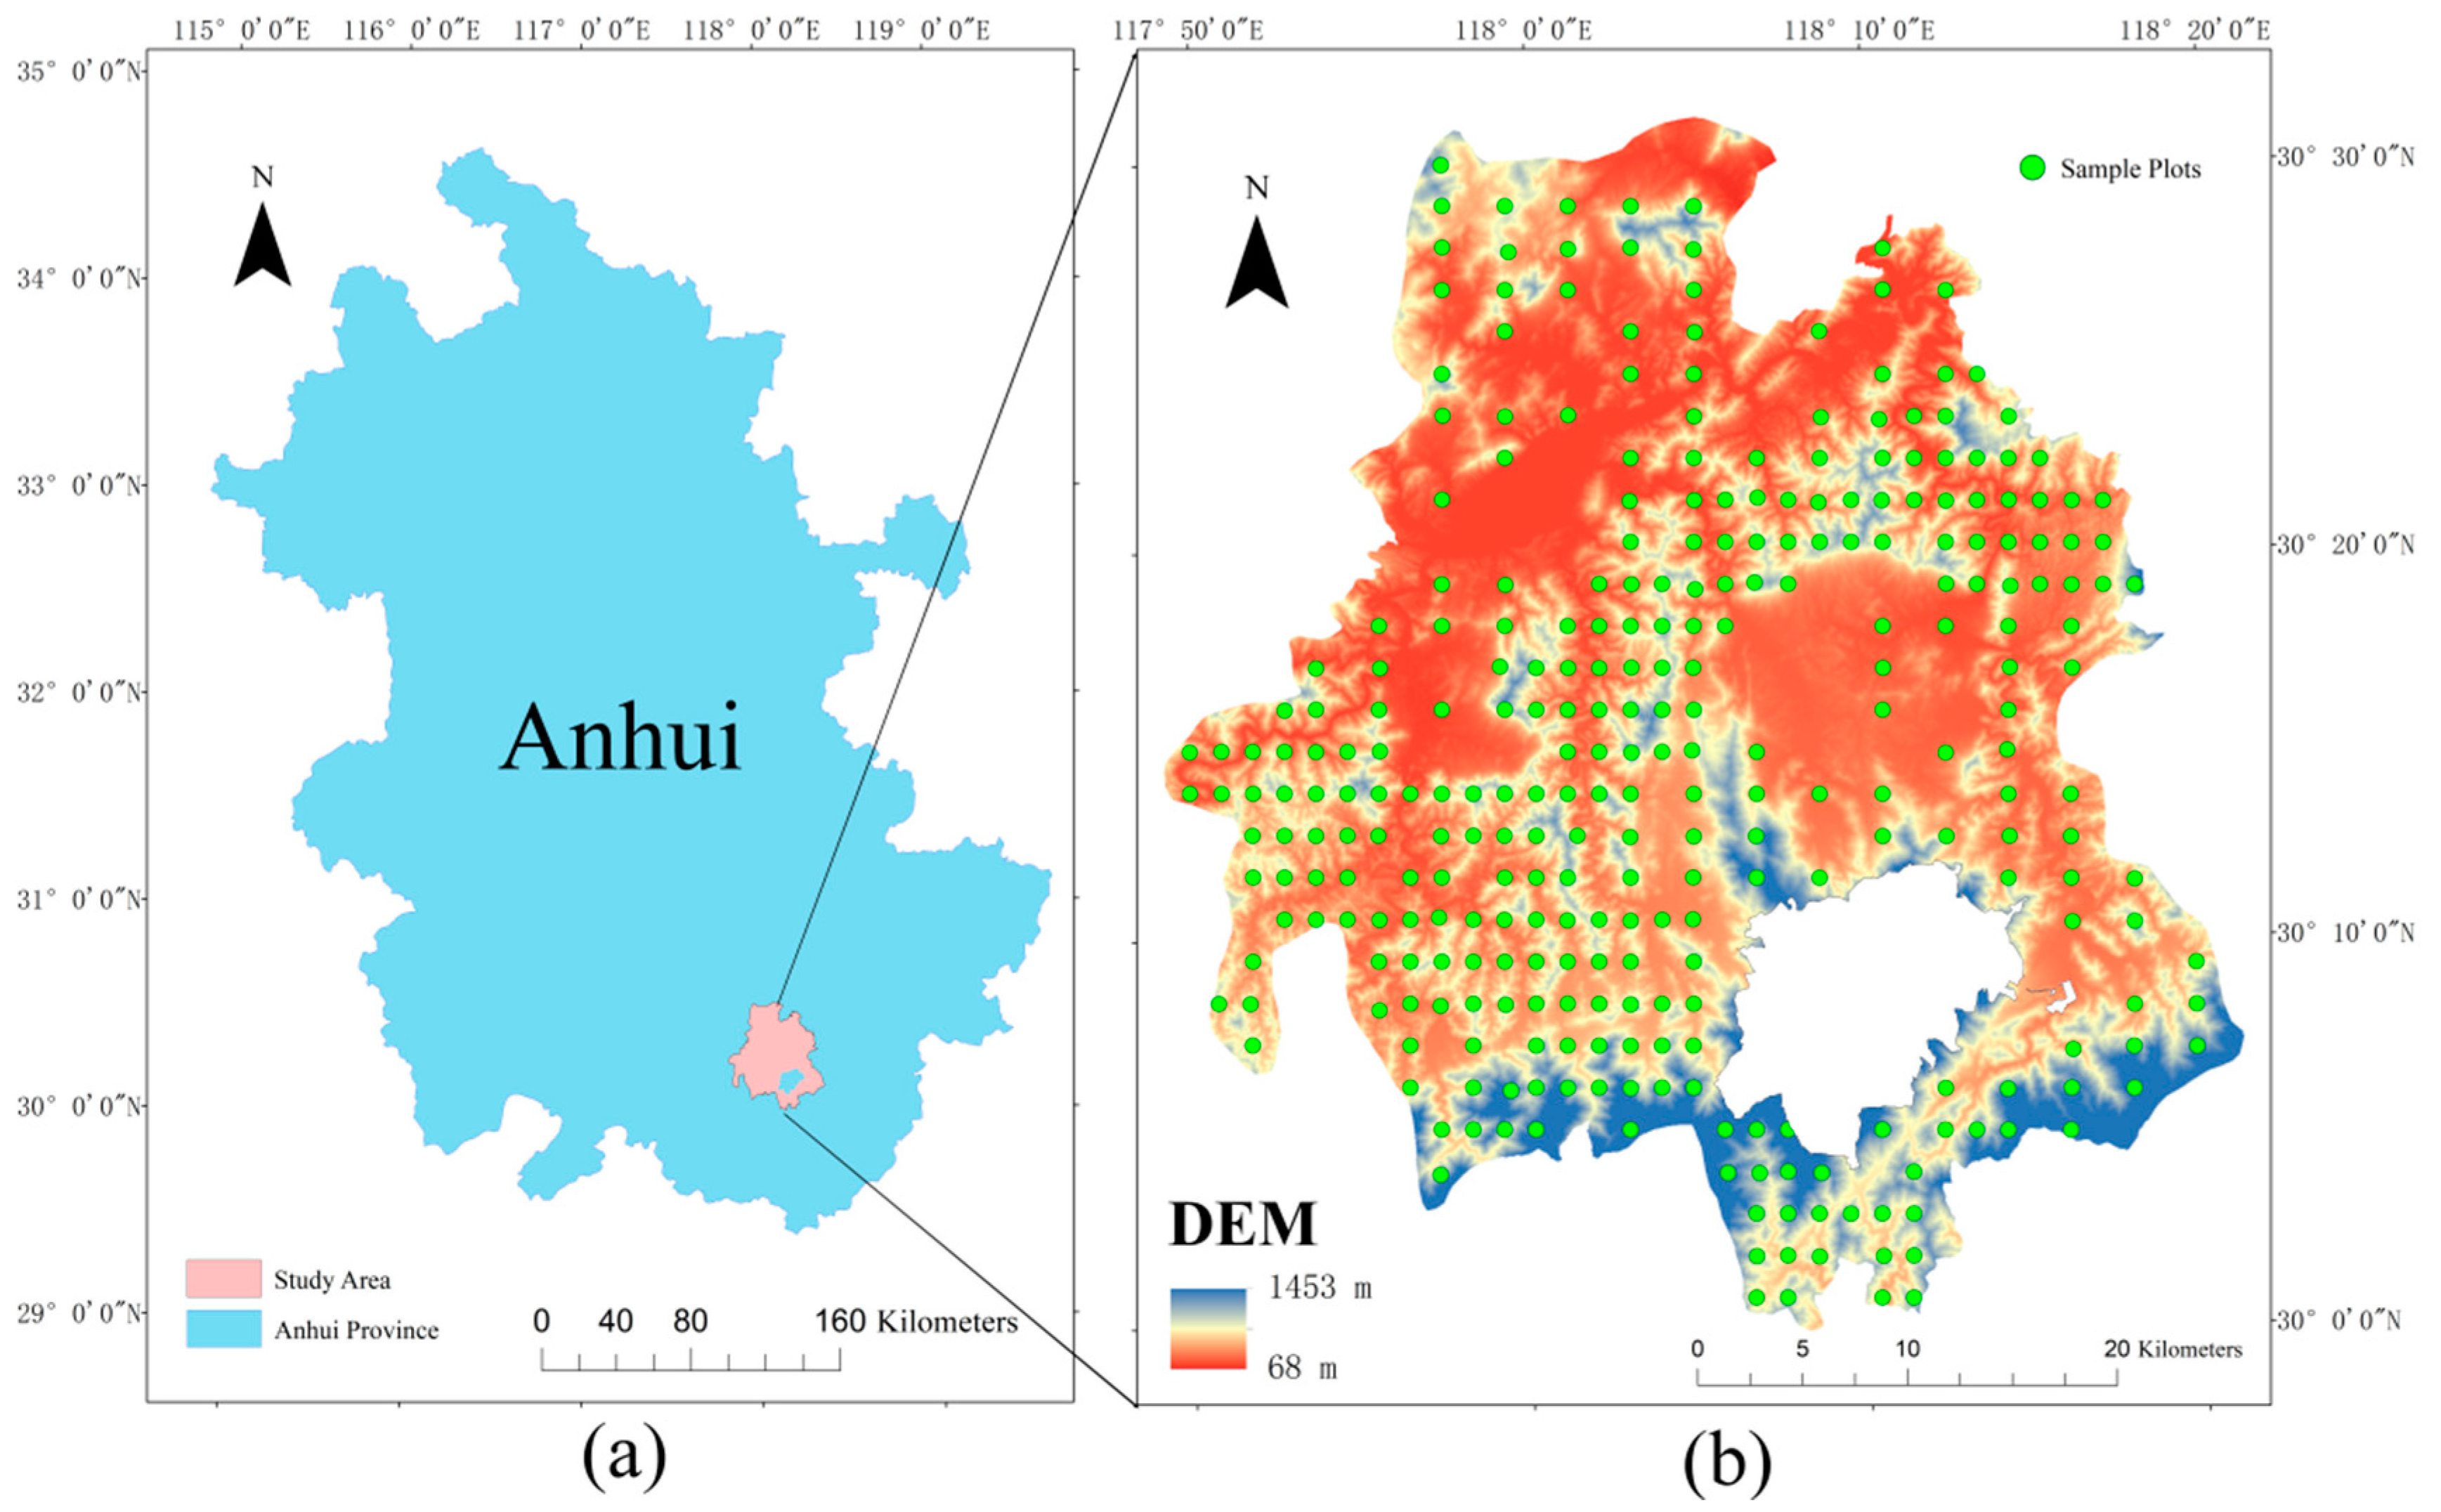
2.1. Study Area
2.2. Data Sources
2.2.1. Remote Sensing Data
2.2.2. Field Data
3. Methods
3.1. Classification of Forest Types Based on the HRET Algorithm
3.1.1. HRNET Algorithm
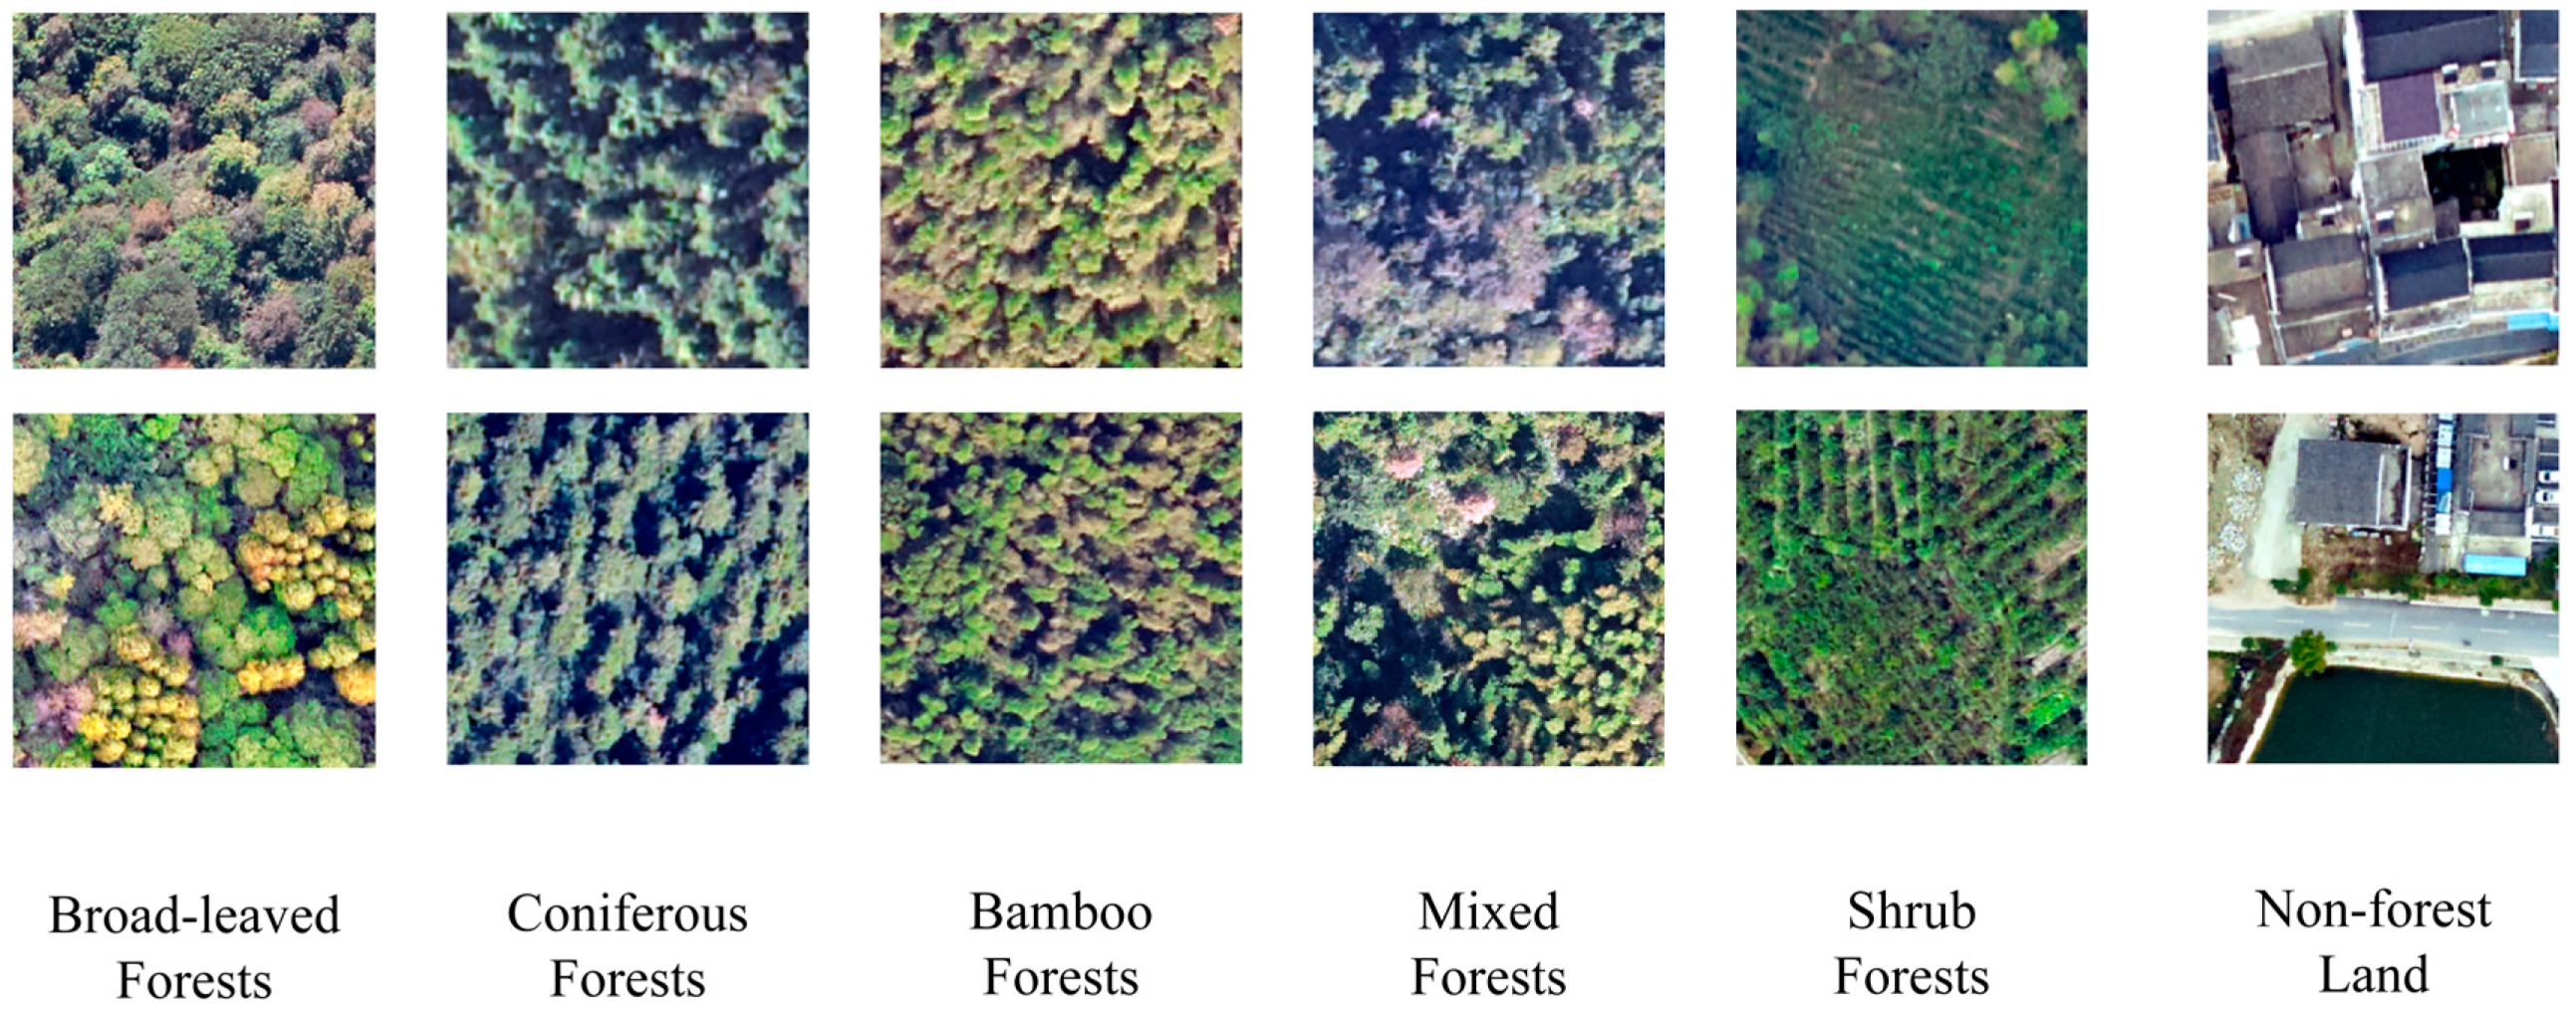
3.1.2. Construction of a Semantic Segmentation Sample Datasets for Tree Species
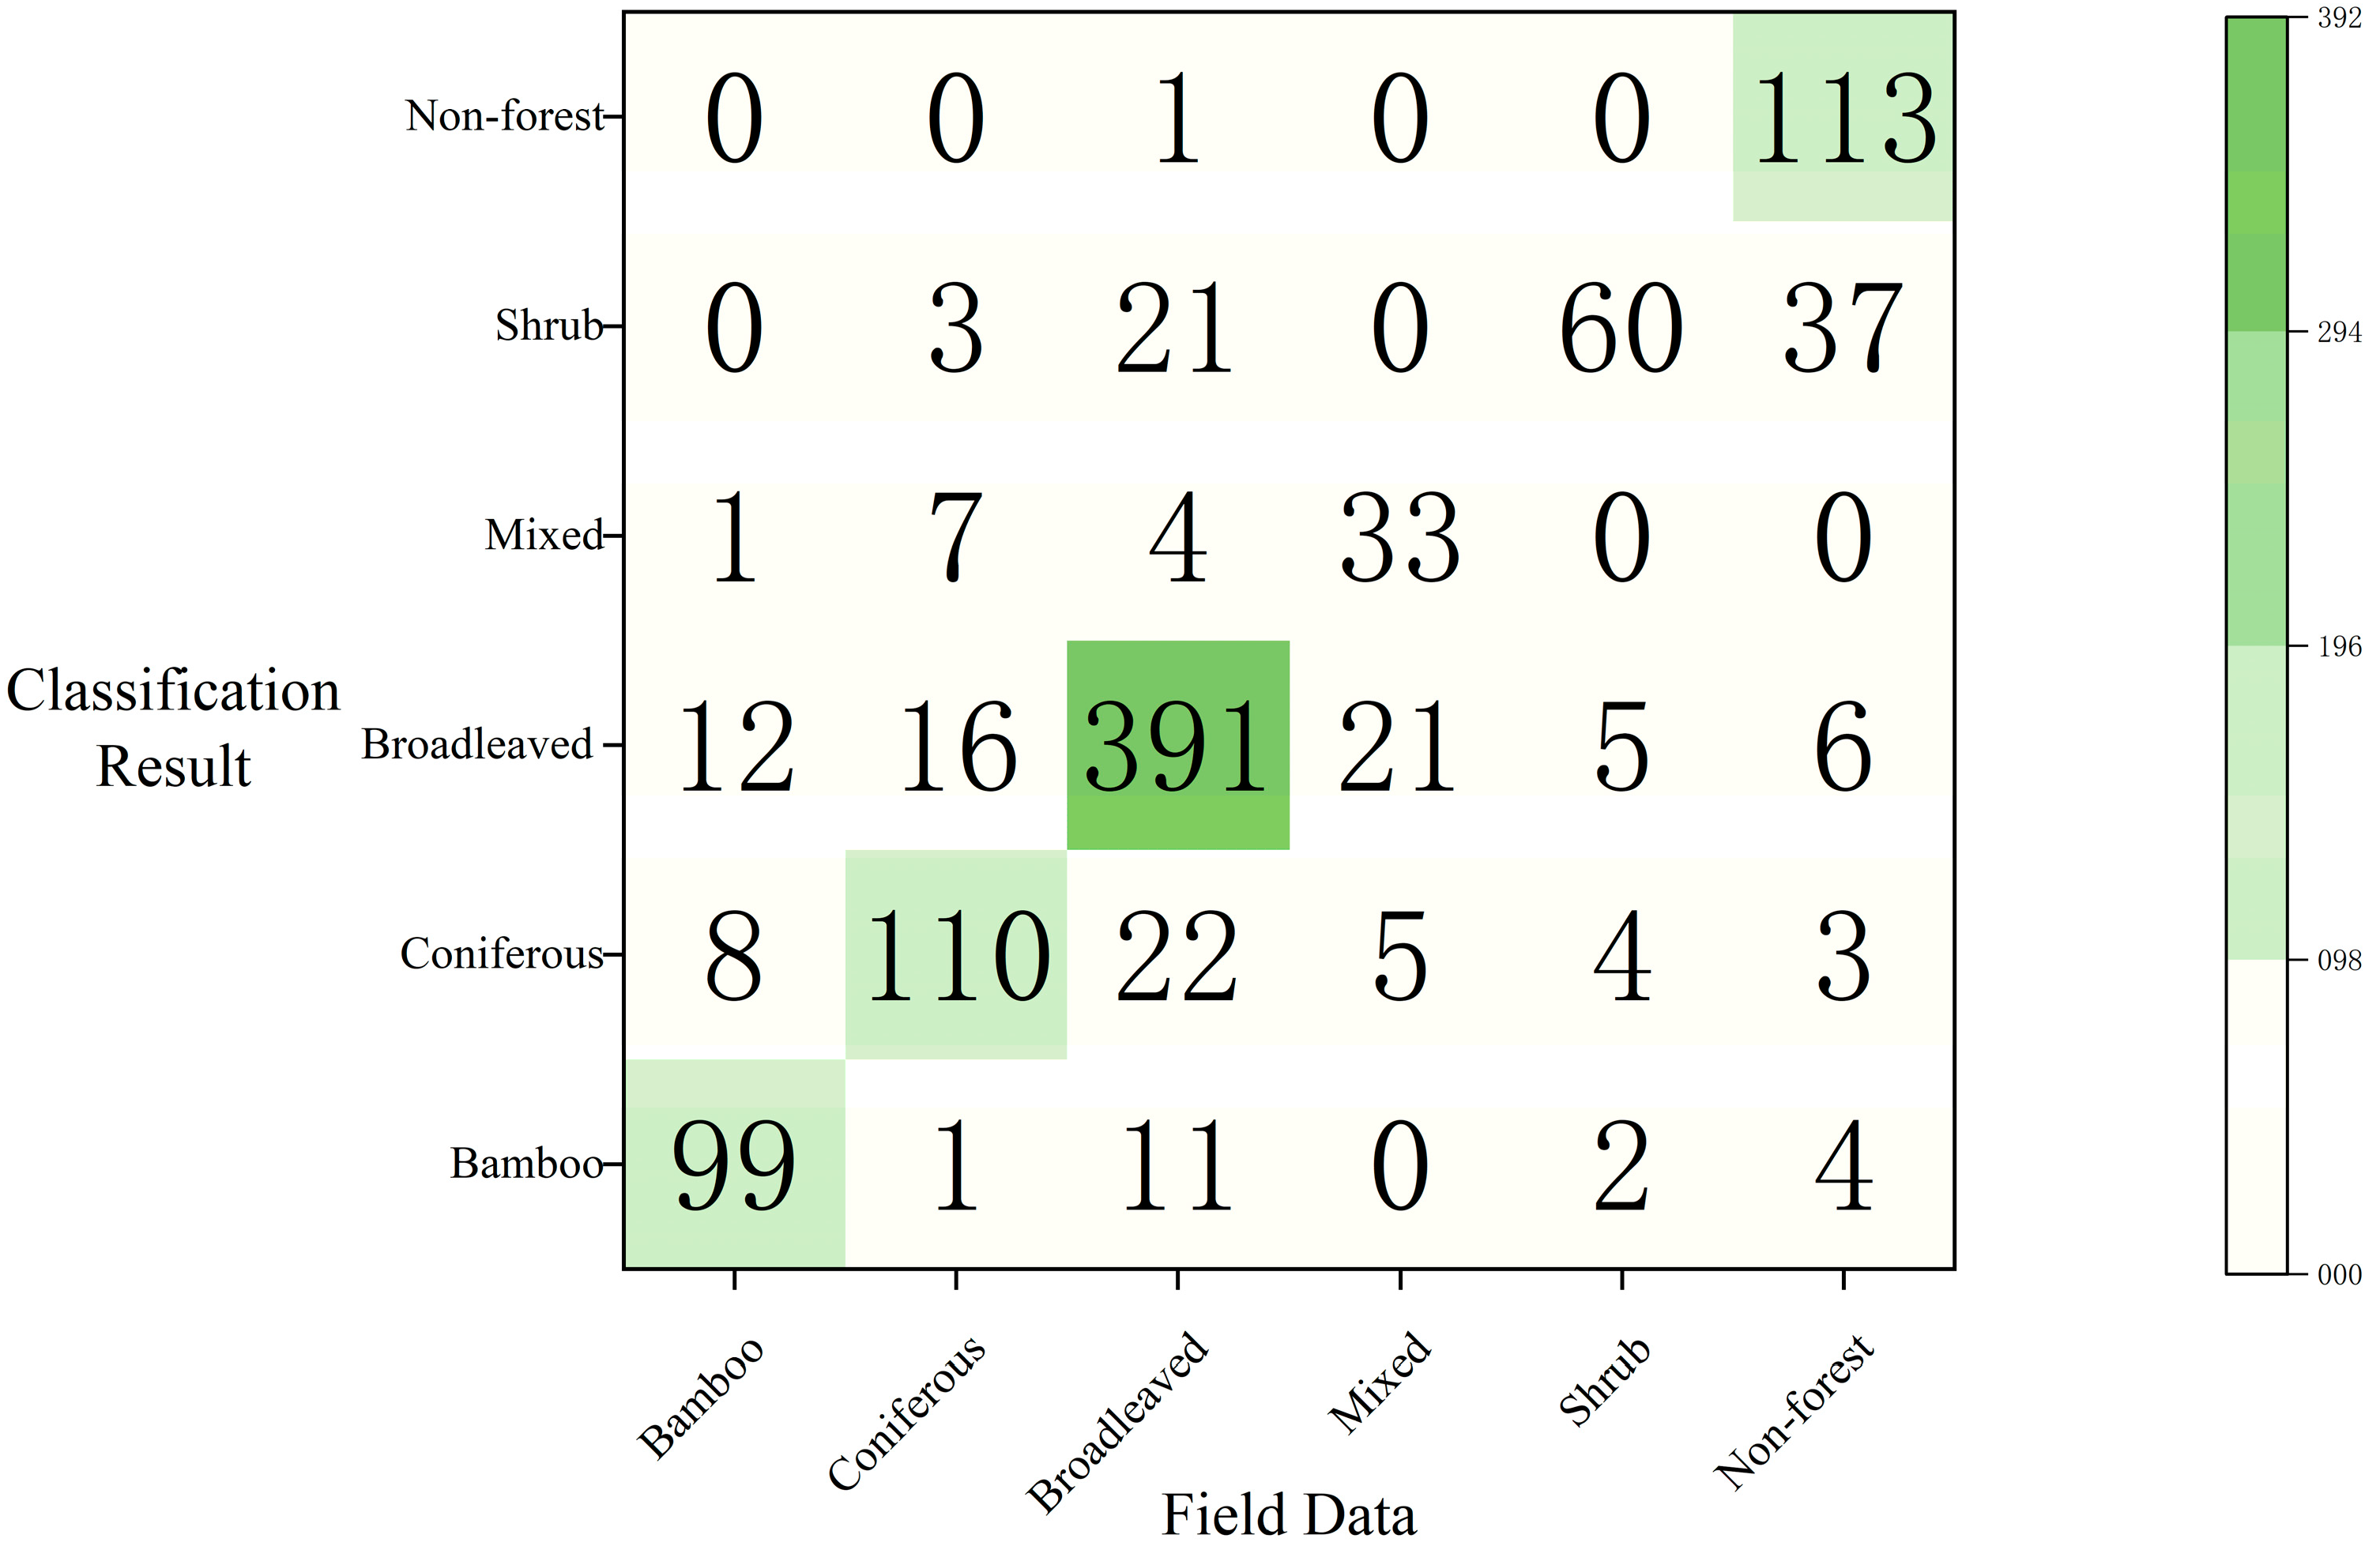
3.1.3. Accuracy Evaluation of Forest Types Classification
3.2. NPP Estimation Model
3.2.1. Actual Light Energy Utilization Estimation
3.2.2. APAR Estimation
3.3. Calculation of Forest NPP Based on Field Data
3.4. Evaluation of NPP Estimation Accuracy
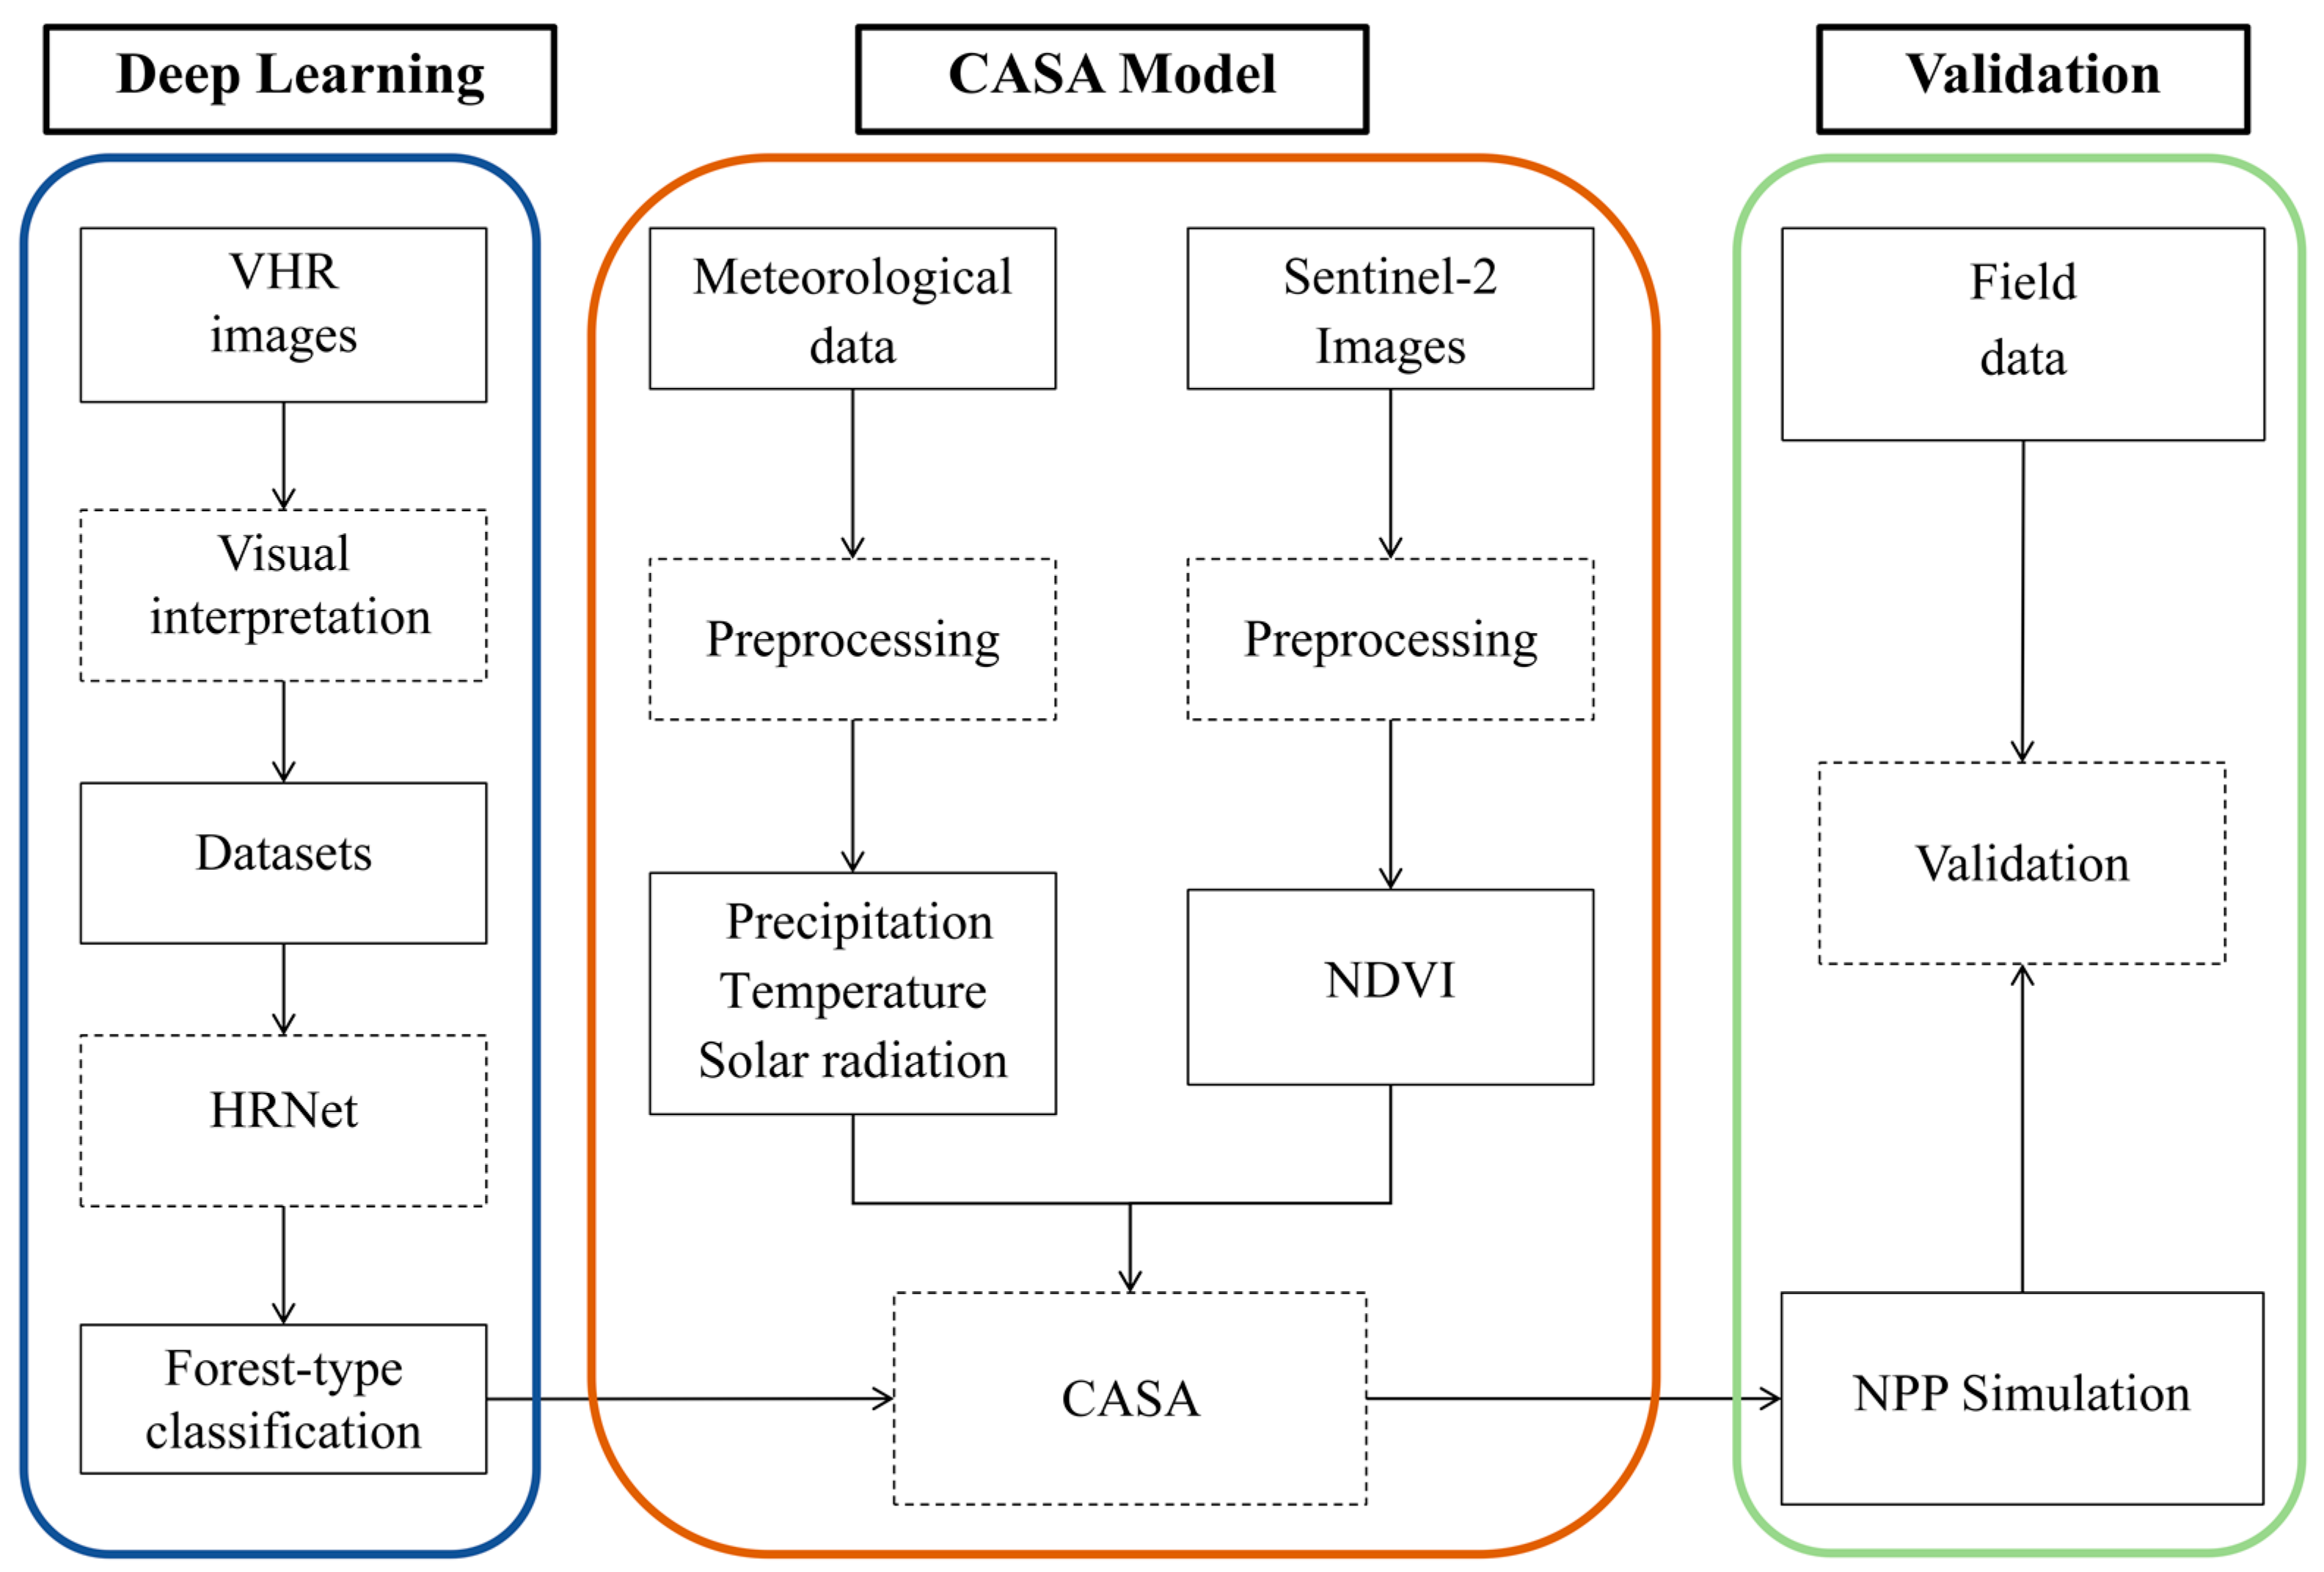
3.5. Framework of the Analysis
4. Results
4.1. Validation of Forest Types Classification
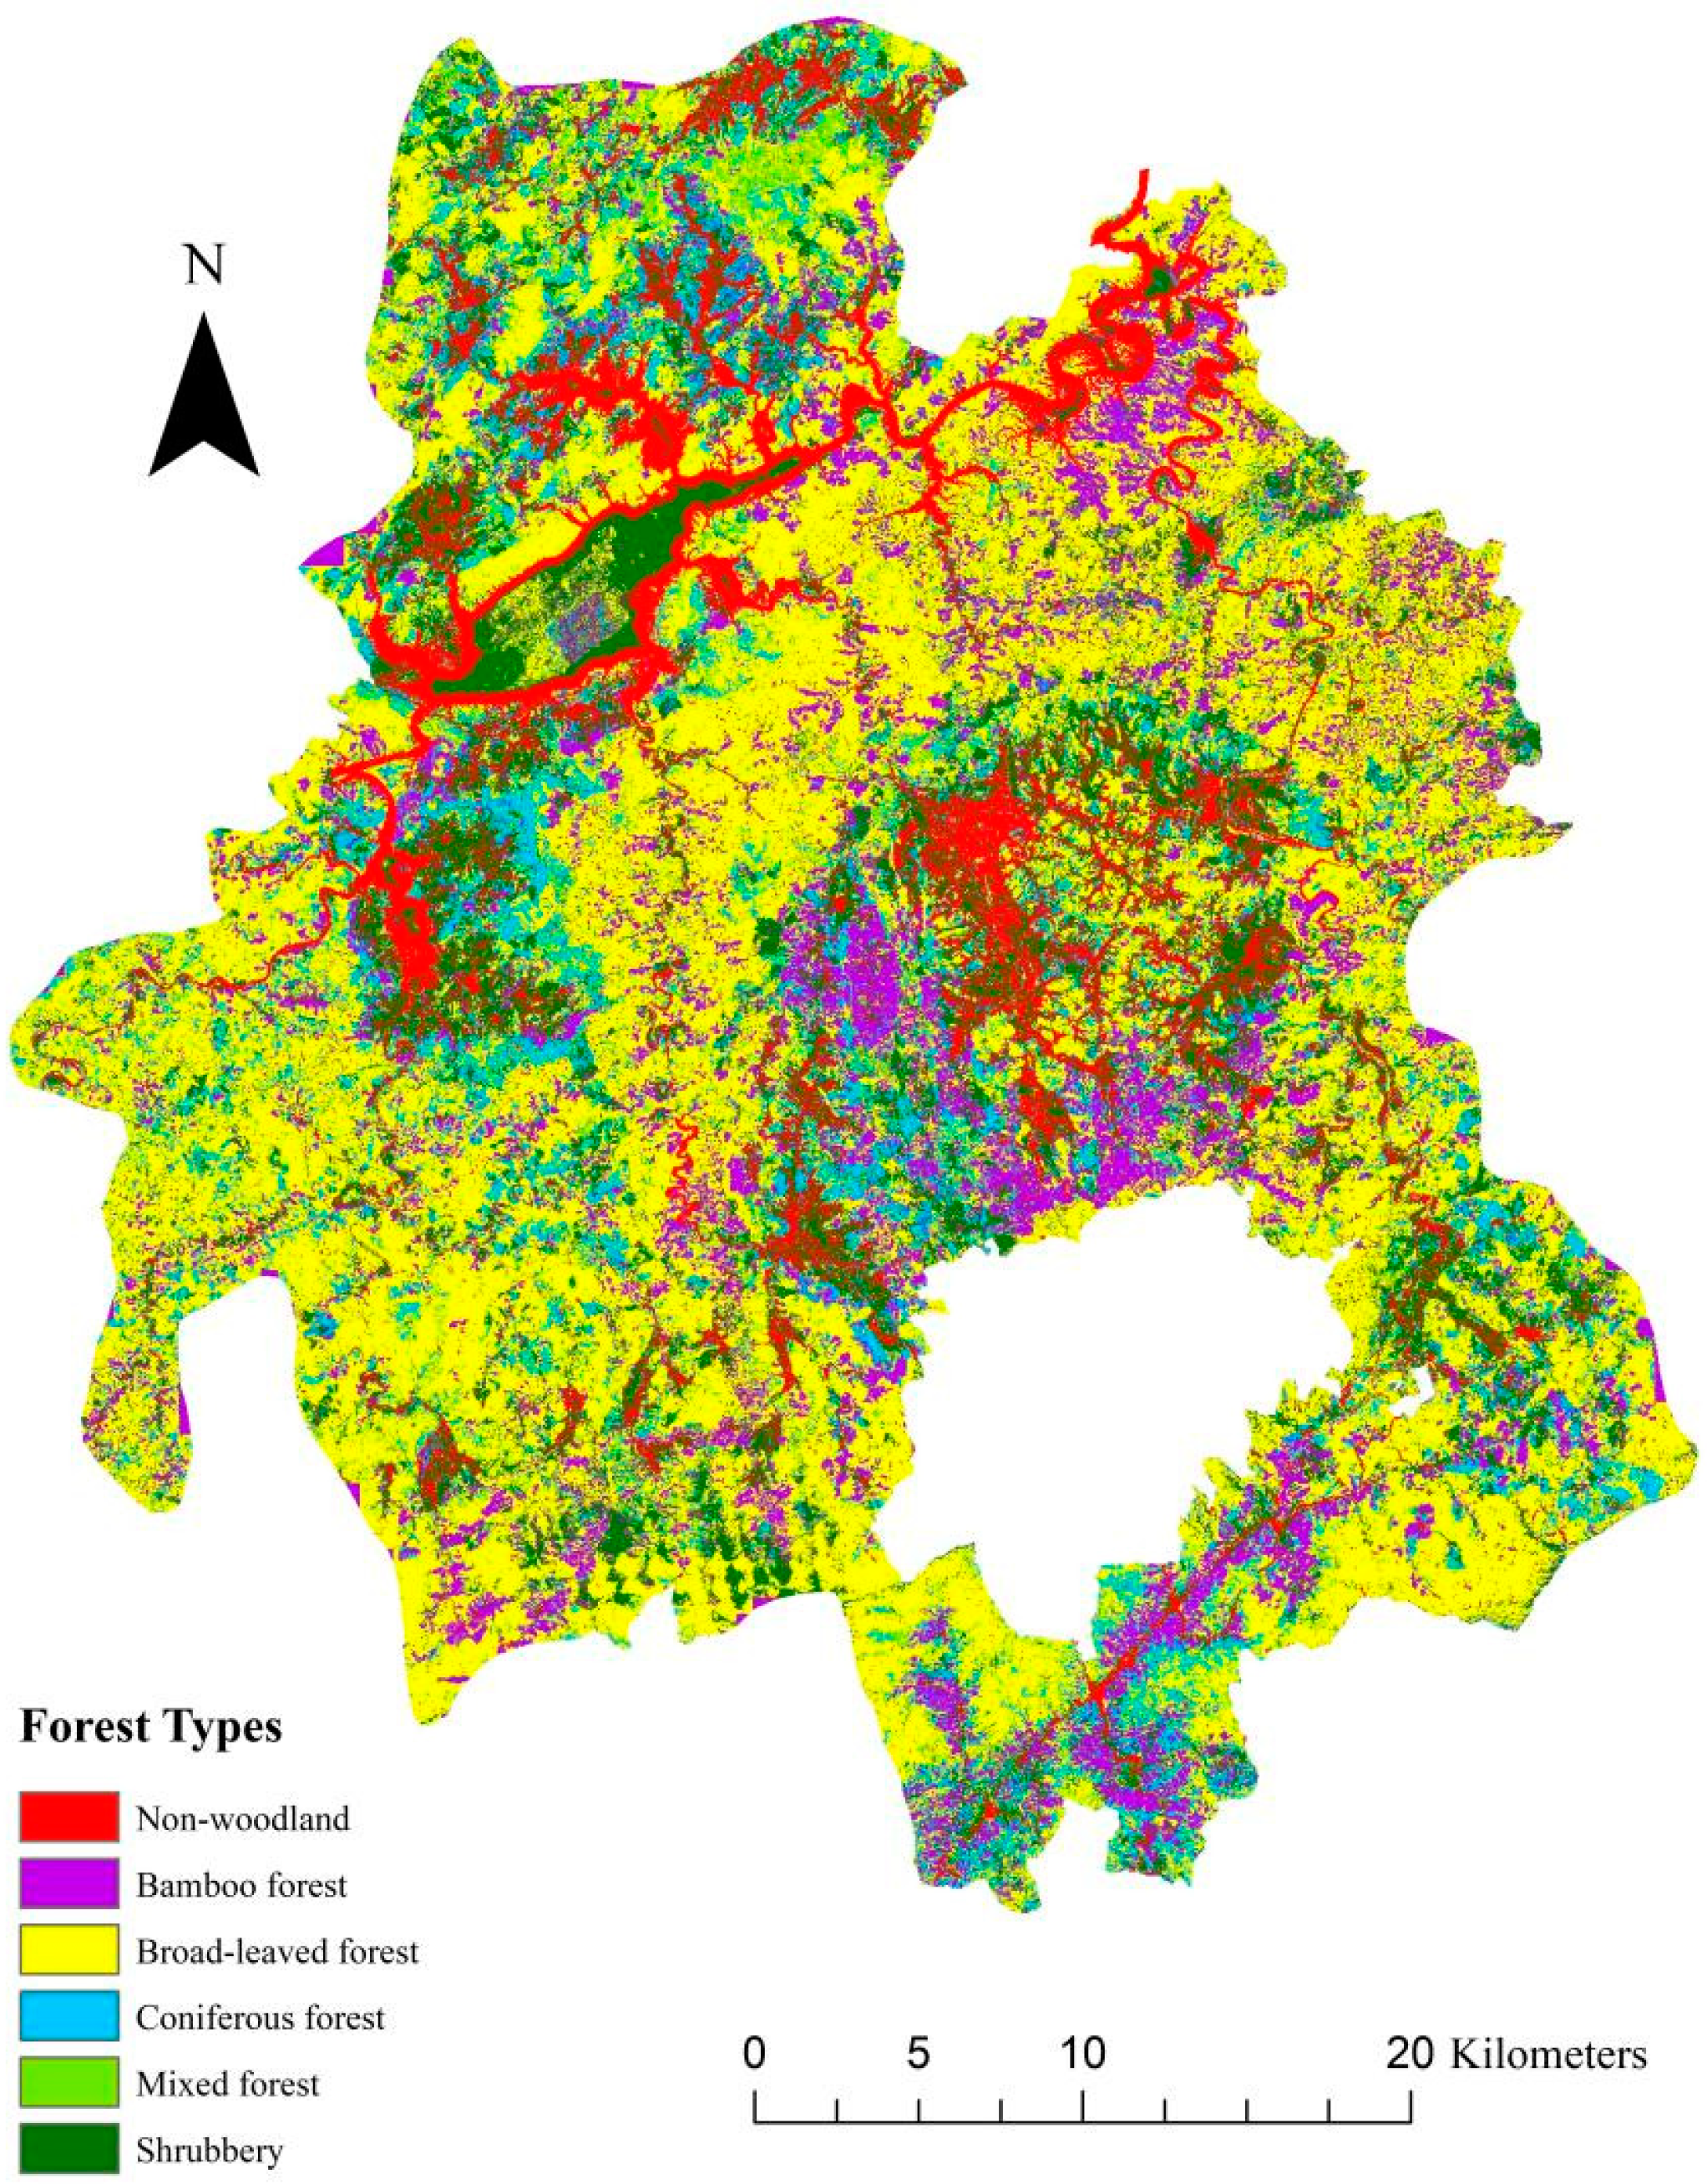
4.2. Forest Types Classification Results
4.3. NPP Simulation Results
4.4. Validation of NPP Simulation
5. Discussion
5.1. Classification of Forest Types
5.2. Study Area NPP Simulation
5.3. Shortcomings and Prospects
6. Conclusions
Author Contributions
Funding
Data Availability Statement
Conflicts of Interest
References
- Altman, J.; Fibich, P.; Trotsiuk, V.; Altmanova, N. Global pattern of forest disturbances and its shift under climate change. Sci. Total. Environ. 2024, 915, 170117. [Google Scholar] [CrossRef] [PubMed]
- Song, X.; Chen, F.; Sun, Y.; Ma, J.; Yang, Y.; Shi, G. Effects of land utilization transformation on ecosystem services in urban agglomeration on the northern slope of the Tianshan Mountains, China. Ecol. Indic. 2024, 162, 112046. [Google Scholar] [CrossRef]
- Luo, M.; Sa, C.; Meng, F.; Duan, Y.; Liu, T.; Bao, Y. Assessing extreme climatic changes on a monthly scale and their implications for vegetation in Central Asia. J. Clean. Prod. 2020, 271, 122396. [Google Scholar] [CrossRef]
- Wang, C.L.; Jiang, Q.O.; Deng, X.Z.; Lv, K.X.; Zhang, Z.H. Spatio-Temporal Evolution, Future Trend and Phenology Regularity of Net Primary Productivity of Forests in Northeast China. Remote Sens. 2020, 12, 3670. [Google Scholar] [CrossRef]
- Johnson, E.A.; Miyanishi, K. The boreal forest as a cultural landscape. Ann. N. Y. Acad. Sci. 2012, 1249, 151–165. [Google Scholar]
- Ge, W.Y.; Deng, L.Q.; Wang, F.; Han, J.Q. Quantifying the contributions of human activities and climate change to vegetation net primary productivity dynamics in China from 2001 to 2016. Sci. Total Environ. 2021, 773, 145648. [Google Scholar] [CrossRef]
- Li, Z.J.; Chen, J.P.; Chen, Z.P.; Sha, Z.Y.; Yin, J.H.; Chen, Z.T. Quantifying the contributions of climate factors and human activities to variations of net primary productivity in China from 2000 to 2020. Front. Earth Sci. 2023, 11, 1084399. [Google Scholar] [CrossRef]
- Liu, G.B.; Shao, Q.Q.; Fan, J.W.; Ning, J.; Rong, K.; Huang, H.B.; Liu, S.C.; Zhang, X.Y.; Niu, L.A.; Liu, J.Y. Change Trend and Restoration Potential of Vegetation Net Primary Productivity in China over the Past 20 Years. Remote Sens. 2022, 14, 1634. [Google Scholar] [CrossRef]
- Gu, X.X.; Zhao, H.W.; Peng, C.J.; Guo, X.D.; Lin, Q.L.; Yang, Q.; Chen, L.Z. The mangrove blue carbon sink potential: Evidence from three net primary production assessment methods. For. Ecol. Manag. 2022, 504, 119848. [Google Scholar] [CrossRef]
- Shi, S.H.; Zhu, L.P.; Luo, Z.H.; Qiu, H. Quantitative Analysis of the Contributions of Climatic and Anthropogenic Factors to the Variation in Net Primary Productivity, China. Remote Sens. 2023, 15, 789. [Google Scholar] [CrossRef]
- Xu, F.; Wang, X.R.; Li, L. NPP and Vegetation Carbon Sink Capacity Estimation of Urban Green Space Using the Optimized CASA Model: A Case Study of Five Chinese Cities. Atmosphere 2023, 14, 1161. [Google Scholar] [CrossRef]
- Li, S.; Zhang, R.; Xie, L.X.; Zhan, J.Y.; Song, Y.F.; Zhan, R.Q.; Shama, A.; Wang, T. A Factor Analysis Backpropagation Neural Network Model for Vegetation Net Primary Productivity Time Series Estimation in Western Sichuan. Remote Sens. 2022, 14, 3961. [Google Scholar] [CrossRef]
- Xing, W.X.; Chi, Y.; Ma, X.J.; Liu, D.H. Spatiotemporal Characteristics of Vegetation Net Primary Productivity on an Intensively-Used Estuarine Alluvial Island. Land 2021, 10, 130. [Google Scholar] [CrossRef]
- Zhang, R.; Zhou, Y.; Luo, H.X.; Wang, F.T.; Wang, S.X. Estimation and Analysis of Spatiotemporal Dynamics of the Net Primary Productivity Integrating Efficiency Model with Process Model in Karst Area. Remote Sens. 2017, 9, 477. [Google Scholar] [CrossRef]
- Turner, D.P.; Ollinger, S.V.; Kimball, J.S. Integrating remote sensing and ecosystem process models for landscape- to regional-scale analysis of the carbon cycle. Bioscience 2004, 54, 573–584. [Google Scholar] [CrossRef]
- Sun, Q.L.; Li, B.L.; Zhang, T.; Yuan, Y.C.; Gao, X.Z.; Ge, J.S.; Li, F.; Zhang, Z.J. An improved Biome-BGC model for estimating net primary productivity of alpine meadow on the Qinghai-Tibet Plateau. Ecol. Model. 2017, 350, 55–68. [Google Scholar] [CrossRef]
- Hazarika, M.K.; Yasuoka, Y.; Ito, A.; Dye, D. Estimation of net primary productivity by integrating remote sensing data with an ecosystem model. Remote Sens. Environ. 2005, 94, 298–310. [Google Scholar] [CrossRef]
- Li, J.; Cui, Y.P.; Liu, J.Y.; Shi, W.J.; Qin, Y.C. Estimation and analysis of net primary productivity by integrating MODIS remote sensing data with a light use efficiency model. Ecol. Model. 2013, 252, 3–10. [Google Scholar] [CrossRef]
- Zhang, L.X.; Zhou, D.C.; Fan, J.W.; Hu, Z.M. Comparison of four light use efficiency models for estimating terrestrial gross primary production. Ecol. Model. 2015, 300, 30–39. [Google Scholar] [CrossRef]
- Guo, D.; Song, X.N.; Hu, R.H.; Cai, S.H.; Zhu, X.M.; Hao, Y.B. Grassland type-dependent spatiotemporal characteristics of productivity in Inner Mongolia and its response to climate factors. Sci. Total Environ. 2021, 775, 145644. [Google Scholar] [CrossRef]
- Luo, Z.; Wu, W.; Yu, X.; Song, Q.; Yang, J.; Wu, J.; Zhang, H. Variation of Net Primary Production and Its Correlation with Climate Change and Anthropogenic Activities over the Tibetan Plateau. Remote Sens. 2018, 10, 1352. [Google Scholar] [CrossRef]
- Peng, J.; Shen, H.; Wu, W.H.; Liu, Y.X.; Wang, Y.L. Net primary productivity (NPP) dynamics and associated urbanization driving forces in metropolitan areas: A case study in Beijing City, China. Landsc. Ecol. 2016, 31, 1077–1092. [Google Scholar] [CrossRef]
- Xiao, F.J.; Liu, Q.F.; Xu, Y.Q. Estimation of Terrestrial Net Primary Productivity in the Yellow River Basin of China Using Light Use Efficiency Model. Sustainability 2022, 14, 7399. [Google Scholar] [CrossRef]
- Zhou, Y.; Shao, M.; Li, X. Temporal and Spatial Evolution, Prediction, and Driving-Factor Analysis of Net Primary Productivity of Vegetation at City Scale: A Case Study from Yangzhou City, China. Sustainability 2023, 15, 14518. [Google Scholar] [CrossRef]
- Li, A.N.; Bian, J.H.; Lei, G.B.; Huang, C.Q. Estimating the Maximal Light Use Efficiency for Different Vegetation through the CASA Model Combined with Time-Series Remote Sensing Data and Ground Measurements. Remote Sens. 2012, 4, 3857–3876. [Google Scholar] [CrossRef]
- Bai, M.Y.; Peng, P.H.; Zhang, S.Q.; Wang, X.M.; Wang, X.; Wang, J.; Pellikka, P. Mountain Forest Type Classification Based on One-Dimensional Convolutional Neural Network. Forests 2023, 14, 1823. [Google Scholar] [CrossRef]
- Borlaf-Mena, I.; García-Duro, J.; Santoro, M.; Villard, L.; Badea, O.; Tanase, M.A. Seasonality and directionality effects on radar backscatter are key to identify mountain forest types with Sentinel-1 data. Remote Sens. Environ. 2023, 296, 113728. [Google Scholar] [CrossRef]
- Cheng, G.; Xie, X.X.; Han, J.W.; Guo, L.; Xia, G.S. Remote Sensing Image Scene Classification Meets Deep Learning: Challenges, Methods, Benchmarks, and Opportunities. IEEE J. Sel. Top. Appl. Earth Obs. Remote Sens. 2020, 13, 3735–3756. [Google Scholar] [CrossRef]
- Neupane, B.; Horanont, T.; Aryal, J. Deep Learning-Based Semantic Segmentation of Urban Features in Satellite Images: A Review and Meta-Analysis. Remote Sens. 2021, 13, 808. [Google Scholar] [CrossRef]
- Xie, Y.C.; Sha, Z.Y.; Yu, M. Remote sensing imagery in vegetation mapping: A review. J. Plant Ecol. 2008, 1, 9–23. [Google Scholar] [CrossRef]
- Hoeser, T.; Kuenzer, C. Object Detection and Image Segmentation with Deep Learning on Earth Observation Data: A Review-Part I: Evolution and Recent Trends. Remote Sens. 2020, 12, 1667. [Google Scholar] [CrossRef]
- He, T.; Zhou, H.K.; Xu, C.Y.; Hu, J.G.; Xue, X.Y.; Xu, L.C.; Lou, X.W.; Zeng, K.; Wang, Q. Deep Learning in Forest Tree Species Classification Using Sentinel-2 on Google Earth Engine: A Case Study of Qingyuan County. Sustainability 2023, 15, 2741. [Google Scholar] [CrossRef]
- Lee, S.-H.; Han, K.-J.; Lee, K.; Lee, K.-J.; Oh, K.-Y.; Lee, M.-J. Classification of Landscape Affected by Deforestation Using High-Resolution Remote Sensing Data and Deep-Learning Techniques. Remote Sens. 2020, 12, 3372. [Google Scholar] [CrossRef]
- Wu, C.; Jia, W.; Yang, J.; Zhang, T.; Dai, A.; Zhou, H. Economic Fruit Forest Classification Based on Improved U-Net Model in UAV Multispectral Imagery. Remote Sens. 2023, 15, 2500. [Google Scholar] [CrossRef]
- Chen, B.; Seely, B.; Innes, J.L.; Wang, G.; Wang, T. ClimateAP: An application for dynamic local downscaling of historical and future climate data in Asia Pacific. Front. Agric. Sci. Eng. 2017, 4, 448–458. [Google Scholar] [CrossRef]
- Sun, K.; Xiao, B.; Liu, D.; Wang, J. Deep High-Resolution Representation Learning for Human Pose Estimation. In Proceedings of the 2019 IEEE/CVF Conference on Computer Vision and Pattern Recognition (CVPR), Long Beach, CA, USA, 15–20 June 2019; pp. 5686–5696. [Google Scholar]
- Sun, K.; Zhao, Y.; Jiang, B.; Cheng, T.; Xiao, B.; Liu, D.; Mu, Y.; Wang, X.; Liu, W.; Wang, J. High-Resolution Representations for Labeling Pixels and Regions. arXiv 2019, arXiv:1904.04514. [Google Scholar]
- Bo, Y.; Li, X.; Liu, K.; Wang, S.; Zhang, H.; Gao, X.; Zhang, X. Three Decades of Gross Primary Production (GPP) in China: Variations, Trends, Attributions, and Prediction Inferred from Multiple Datasets and Time Series Modeling. Remote Sens. 2022, 14, 2564. [Google Scholar] [CrossRef]
- Chen, Y.; Feng, X.; Fu, B.; Wu, X.; Gao, Z. Improved Global Maps of the Optimum Growth Temperature, Maximum Light Use Efficiency, and Gross Primary Production for Vegetation. J. Geophys. Res. Biogeosciences 2021, 126, e2020JG005651. [Google Scholar]
- Zhu, W.; Pan, Y.; He, H.; Yu, D.; Hu, H. Simulation of maximum light use efficiency for some typical vegetation types in China. Chin. Sci. Bull. 2006, 51, 457–463. [Google Scholar]
- Potter, C.S.; Randerson, J.T.; Field, C.B.; Matson, P.A.; Vitousek, P.M.; Mooney, H.A.; Klooster, S.A. Terrestrial ecosystem production: A process model based on global satellite and surface data. Glob. Biogeochem. Cycles 1993, 7, 811–841. [Google Scholar] [CrossRef]
- Chao, Y.U.; Bin, W.; Hua, L.I.U.; Xiao-sheng, Y.; Zhen-zhen, X.I.U. Dynamic Change of Net Production and Mean Net Primary Productivity of China’s Forests. For. Res. 2014, 27, 542–550. [Google Scholar]
- Zhang, J.-H.; Yao, F.-M. Simulating leaf net CO2 assimilation rate of C3 & C4 plants and its response to environmental factors. J. For. Res. 2001, 12, 9–12. [Google Scholar] [CrossRef]
- Wang, Y.L.; Gong, R.; Wu, F.M.; Fan, W. Temporal and spatial variation characteristics of China shrubland net primary production and its response to climate change from 2001 to 2013. Chin. J. Plant Ecol. 2017, 41, 925–937. [Google Scholar]
- Sun, C.; Shrivastava, A.; Singh, S.; Gupta, A. Revisiting Unreasonable Effectiveness of Data in Deep Learning Era. In Proceedings of the 2017 IEEE International Conference on Computer Vision (ICCV), Venice, Italy, 22–29 October 2017; pp. 843–852. [Google Scholar]
- Lei, G.; Li, A.; Bian, J.; Zhang, Z.; Jin, H.; Nan, X.; Zhao, W.; Wang, J.; Cao, X.; Tan, J.; et al. Land Cover Mapping in Southwestern China Using the HC-MMK Approach. Remote. Sens. 2016, 8, 305. [Google Scholar] [CrossRef]
- Lei, G.; Li, A.; Tan, J.; Zhang, Z.; Bian, J.; Jin, H.; Zhao, W.; Cao, X. Forest Types Mapping in Mountainous Area Using Multi-source and Multi-temporal Satellite Images and Decision Tree Models. Remote Sens. Technol. Appl. 2016, 31, 31–41. [Google Scholar]
- Zhang, W.; Xi, M.; Liu, H.; Zheng, H. Low sensitivity of net primary productivity to climatic factors in three karst provinces in southwest China from 1981 to 2019. Ecol. Indic. 2023, 153, 110465. [Google Scholar] [CrossRef]
- Chen, S.; Ma, M.; Wu, S.; Tang, Q.; Wen, Z. Topography intensifies variations in the effect of human activities on forest NPP across altitude and slope gradients. Environ. Dev. 2023, 45, 100826. [Google Scholar] [CrossRef]
- Bryan, B.A.; Gao, L.; Ye, Y.; Sun, X.; Connor, J.D.; Crossman, N.D.; Stafford-Smith, M.; Wu, J.; He, C.; Yu, D.; et al. China’s response to a national land-system sustainability emergency. Nature 2018, 559, 193–204. [Google Scholar] [CrossRef]
- Gómez, C.; White, J.C.; Wulder, M.A. Optical remotely sensed time series data for land cover classification: A review. ISPRS J. Photogramm. Remote Sens. 2016, 116, 55–72. [Google Scholar] [CrossRef]
- Zhong, L.; Hu, L.; Zhou, H. Deep learning based multi-temporal crop classification. Remote Sens. Environ. 2019, 221, 430–443. [Google Scholar] [CrossRef]
- Geng, T.; Yu, H.; Yuan, X.; Ma, R.; Li, P. Research on Segmentation Method of Maize Seedling Plant Instances Based on UAV Multispectral Remote Sensing Images. Plants 2024, 13, 1842. [Google Scholar] [CrossRef] [PubMed]


| Regions | 1 | 2 | 3 | 4 | 5 | 6 |
|---|---|---|---|---|---|---|
| Flight speed (km/h) | 260 | 260 | 260 | 240 | 240 | 240 |
| Flight altitude (m) | 2140 | 2190 | 2300 | 1840 | 1930 | 2050 |
| Datum elevation (m) | 80 | 130 | 240 | 110 | 200 | 320 |
| IXU-RS1000 Digital Camera Parameters | |
|---|---|
| Heading overlap (%) | 65 |
| Side-by-side overlap (%) | 20 |
| Ground resolution (m) | 0.19 |
| Field of view ° | 56.2 × 43.7 |
| pixels | 11,608 × 8708 |
| Forest Type | Relationship between Biomass and Volume | Relationship between Biomass and Community Growth | Relationship between Biomass and Annual Withering |
|---|---|---|---|
| Mixed forest | |||
| Broad-leaved forest | |||
| Coniferous forest |
| Forest-Type | PA (%) | F1-Score | OA (%) | Kappa Coefficient |
|---|---|---|---|---|
| Bamboo | 82.50 | 0.8354 | 80.60 | 0.7351 |
| Coniferous | 80.29 | 0.7612 | ||
| Broad-leaved | 86.89 | 0.8679 | ||
| Mixed | 55.93 | 0.6346 | ||
| Shrub | 84.51 | 0.6250 | ||
| Non-forest | 69.33 | 0.8159 |
| Vegetation Type | εmax (gC MJ−1) |
|---|---|
| Broad-leaved forest | 0.808 |
| Coniferous forest | 0.406 |
| Mixed forests | 0.484 |
| Bamboo forest | 0.577 |
| Shrub | 0.448 |
| Forest Type | NPP Mean (gCm−2a−1) | NPP MAX (gCm−2a−1) | NPP Min (gCm−2a−1) |
|---|---|---|---|
| Broad-leaved | 1025.94 | 1539.54 | 240.04 |
| Mixed | 867.99 | 1275.14 | 154.95 |
| Coniferous | 512.97 | 710.33 | 132.61 |
| Bamboo | 788.85 | 986.05 | 268.91 |
| Shrub | 440.21 | 647.48 | 127.06 |
| Broad-Leaved | Mixed | Coniferous | Bamboo | |
|---|---|---|---|---|
| Field data (gCm−2a−1) | 943.97 | 1001.39 | 673.31 | 772.83 |
| NPP simulation (gCm−2a−1) | 994.94 | 927.82 | 665.75 | 748.97 |
Disclaimer/Publisher’s Note: The statements, opinions and data contained in all publications are solely those of the individual author(s) and contributor(s) and not of MDPI and/or the editor(s). MDPI and/or the editor(s) disclaim responsibility for any injury to people or property resulting from any ideas, methods, instructions or products referred to in the content. |
© 2024 by the authors. Licensee MDPI, Basel, Switzerland. This article is an open access article distributed under the terms and conditions of the Creative Commons Attribution (CC BY) license (https://creativecommons.org/licenses/by/4.0/).
Share and Cite
Wang, Z.; Zhou, Y.; Sun, X.; Xu, Y. Estimation of NPP in Huangshan District Based on Deep Learning and CASA Model. Forests 2024, 15, 1467. https://doi.org/10.3390/f15081467
Wang Z, Zhou Y, Sun X, Xu Y. Estimation of NPP in Huangshan District Based on Deep Learning and CASA Model. Forests. 2024; 15(8):1467. https://doi.org/10.3390/f15081467
Chicago/Turabian StyleWang, Ziyu, Youfeng Zhou, Xinyu Sun, and Yannan Xu. 2024. "Estimation of NPP in Huangshan District Based on Deep Learning and CASA Model" Forests 15, no. 8: 1467. https://doi.org/10.3390/f15081467