Article

Changes in Soil Total and Microbial Biomass Nitrogen in Deforested and Eroded Areas in the Western Black Sea Region of Turkey

1
Division of Soil Science and Ecology, Department of Forest Engineering, Faculty of Forestry, Bartın University, Bartın 74100, Turkey
2
Division of Watershed Management, Department of Forest Engineering, Faculty of Forestry, Bartın University, Bartın 74100, Turkey
*
Author to whom correspondence should be addressed.
Forests 2024, 15(8), 1468; https://doi.org/10.3390/f15081468
Submission received: 31 July 2024 / Revised: 8 August 2024 / Accepted: 18 August 2024 / Published: 21 August 2024
(This article belongs to the Section Forest Soil)

Abstract

:
The microbial biomass in soil is an active and living constituent of organic matter. It is both a storage pool and a source of plant nutrients that can be used as required. In addition, each microbial indicator evaluates soil quality and health from different perspectives, which are not necessarily very different. This study was conducted to compare some physical, chemical, and biochemical characteristics of the soils of forest (SF) and deforested (SDE) areas located on the slopes of the Kirazlıköprü area, which was previously deforested due to dam construction in Bartın province in northwestern Turkey. Soil samples were taken from the topsoil surface (0–5 cm) to determine the microbial soil characteristics of the SF and SDE sites. The soil microbial biomass N (Nmic) was determined by chloroform fumigation extraction, and the Cmic/Nmic ratio and Nmic/Ntotal percentage were calculated using the original values. Total N, Nmic and Cmic/Nmic values are higher in the forest area. The lowest and highest total N (Ntotal) contents in the SF and SDE soils varied between 1.50 and 3.47 g kg−1 and 0.91 and 1.46 g kg−1, respectively. Similarly, the Nmic contents of the SF and SDE soils varied between 75.56 and 143.42 μg g−1 and 10.40 and 75.96 μg g−1, respectively. A statistical analysis revealed that the mean Ntotal and mean Nmic values differed (p < 0.05) in the SF and SDE soils. The mean Cmic/Nmic values in the SF and SDE soils were 8.79 (±1.65) and 5.64 (±1.09), respectively, and a statistical difference was found between the fields (p < 0.05). Our findings indicate that the soil microbial community structure varies according to the site. As a result, it can be concluded that deforestation and erosion due to dam construction in the area led to the removal of plant nutrients from the soil; deterioration in the amount and activity of microbial biomass; and, consequently, soil losses and degradation of soil quality.

1. Introduction

Soil microbial biomass is an indispensable component of soil organic matter and is crucial in nutrient cycling; organic matter dynamics; and, thus, ecosystem services [1,2]. Therefore, microbial community composition is considered an important indicator of soil quality [3,4] and a key ecological factor in rehabilitating degraded ecosystems [2]. Since the presence of microbial biomass also affects soil nitrogen availability [5], soil nitrogen availability, soil microbial diversity, and soil microbial biomass are in a continuous interaction [6]. On the other hand, this interaction may cause changes in soil N availability depending on many factors, such as climatic, environmental, crop, and soil characteristics [7,8]. Microbial indices such as microbial biomass N (Nmic), the percentage of total N (Ntotal) to Nmic (Nmic/Ntotal), and the ratio of microbial biomass C to Nmic (Cmic/Nmic) are essential indicators of choice to make sense of the outcomes of these changes. Therefore, these indicators are frequently used in analyzing and monitoring soil microbial communities [9,10,11,12,13].
Deforestation and erosion processes, separately or together, remain a problem or threat to natural resources. Indeed, more than just the loss of forest vegetation in an area, deforestation can cause rapid and significant problems and threats to other natural resources such as soil and water. It is among the prominent results highlighted in many studies that deforestation causes a decrease in soil quality [14,15,16]. At the same time, deforestation, one of the most critical factors causing land degradation [17], is followed by deterioration in many physical and chemical characteristics of soil [18]. Deforestation affects many soil characteristics [19], as well as the amount of nitrogen plant nutrients [20]. Indeed, the decreasing biomass inputs after deforestation reduce Ntotal [21,22] and Nmic [23]. This leads to a decrease in the quality of forest soils and further soil degradation because Ntotal is one of the most critical soil quality indicators in a forest ecosystem [24]. On the other hand, like deforestation, topography and slope characteristics also play an important role in Ntotal [24,25,26]. However, more information is needed on the effects of topography on Ntotal variation [27]. This can significantly affect soil microbial biomass. Therefore, since there is a need for a better understanding of the effects of deforestation on soil [14], it is important to conduct more studies and generate more data to better understand the details of this interaction.
Erosion has a very negative impact on natural resources and soil as a component of natural resources. One of the well-known downsides of the erosion process is soil and land loss. As a result of soil loss, the depletion of nutrients and microbial biomass is unavoidable, and thus, many physical and chemical characteristics of the soil are disturbed. However, very few studies have been conducted on the effects of gully erosion on soil microbial activity [28]. As little is known about the interaction of erosion with soil microbiological characteristics [29], its impact on soil microbial communities also needs to be clarified [30].
This study was conducted in an area dominated by deforestation and post-deforestation gullies. Indeed, a dam site, located on steep topography, was deforested, resulting from the construction of various roads for the construction of the dam. While some parts of the SDE site have limited vegetation cover, most of the SDE has no vegetation. Moreover, there is no mechanical or vegetative soil retention or conservation buffer zone between the site and the stream, resulting in several gullies and grooves within the area. Then, ongoing rapid erosion started in the area. As a result of all this, it is estimated that the physical, chemical, and microbiological properties of the soil within the site have changed, thus deteriorating soil health and quality. Therefore, a recent study by [31] in this area revealed that deforestation and erosion negatively influenced microbial biomass carbon, some microbial indices, and soil characteristics. However, how total nitrogen, an important plant nutrient, and microbial biomass nitrogen—as well as being important indicators of soil health and quality and some microbial indices—have changed in SF and SDE sites is still uncertain. On the other hand, the effects of deforestation presumably started before 2000 following the dam construction. The dam’s construction began in 1998 [32], and its arch was completed in 2017. Landscaping and other structural activities related to the dam continued for several more years. Although it is a relatively small dam, its completion took a long time due to bureaucratic reasons [31]. The deprivation of forest cover on the steep slopes for more than twenty years has also caused erosion to begin and develop in the area. Afterward, rapid erosion started in the region, which is ongoing as of 2022, when the sampling was performed. The main purpose of this study is to determine the combined effects of deforestation and erosion on some soil microbial biomass and activity. For this purpose, the differences in total and microbial biomass nitrogen between the topsoil of a forest—preserving its natural cover and the topsoil of a second deforested and gully-eroded area bordering this area—were monitored in this study. In addition, the changes in the Nmic/Ntotal percentage and Cmic/Nmic ratio (microbial indices) were also examined based on the studied sites. Furthermore, an attempt was made to determine correlations between total nitrogen and microbial biomass nitrogen with other soil properties such as soil temperature, moisture, and organic C. Moreover, a lack of studies that reveal changes in soil following dam construction in Turkey was another reason for the necessity of this study.

2. Material and Methods
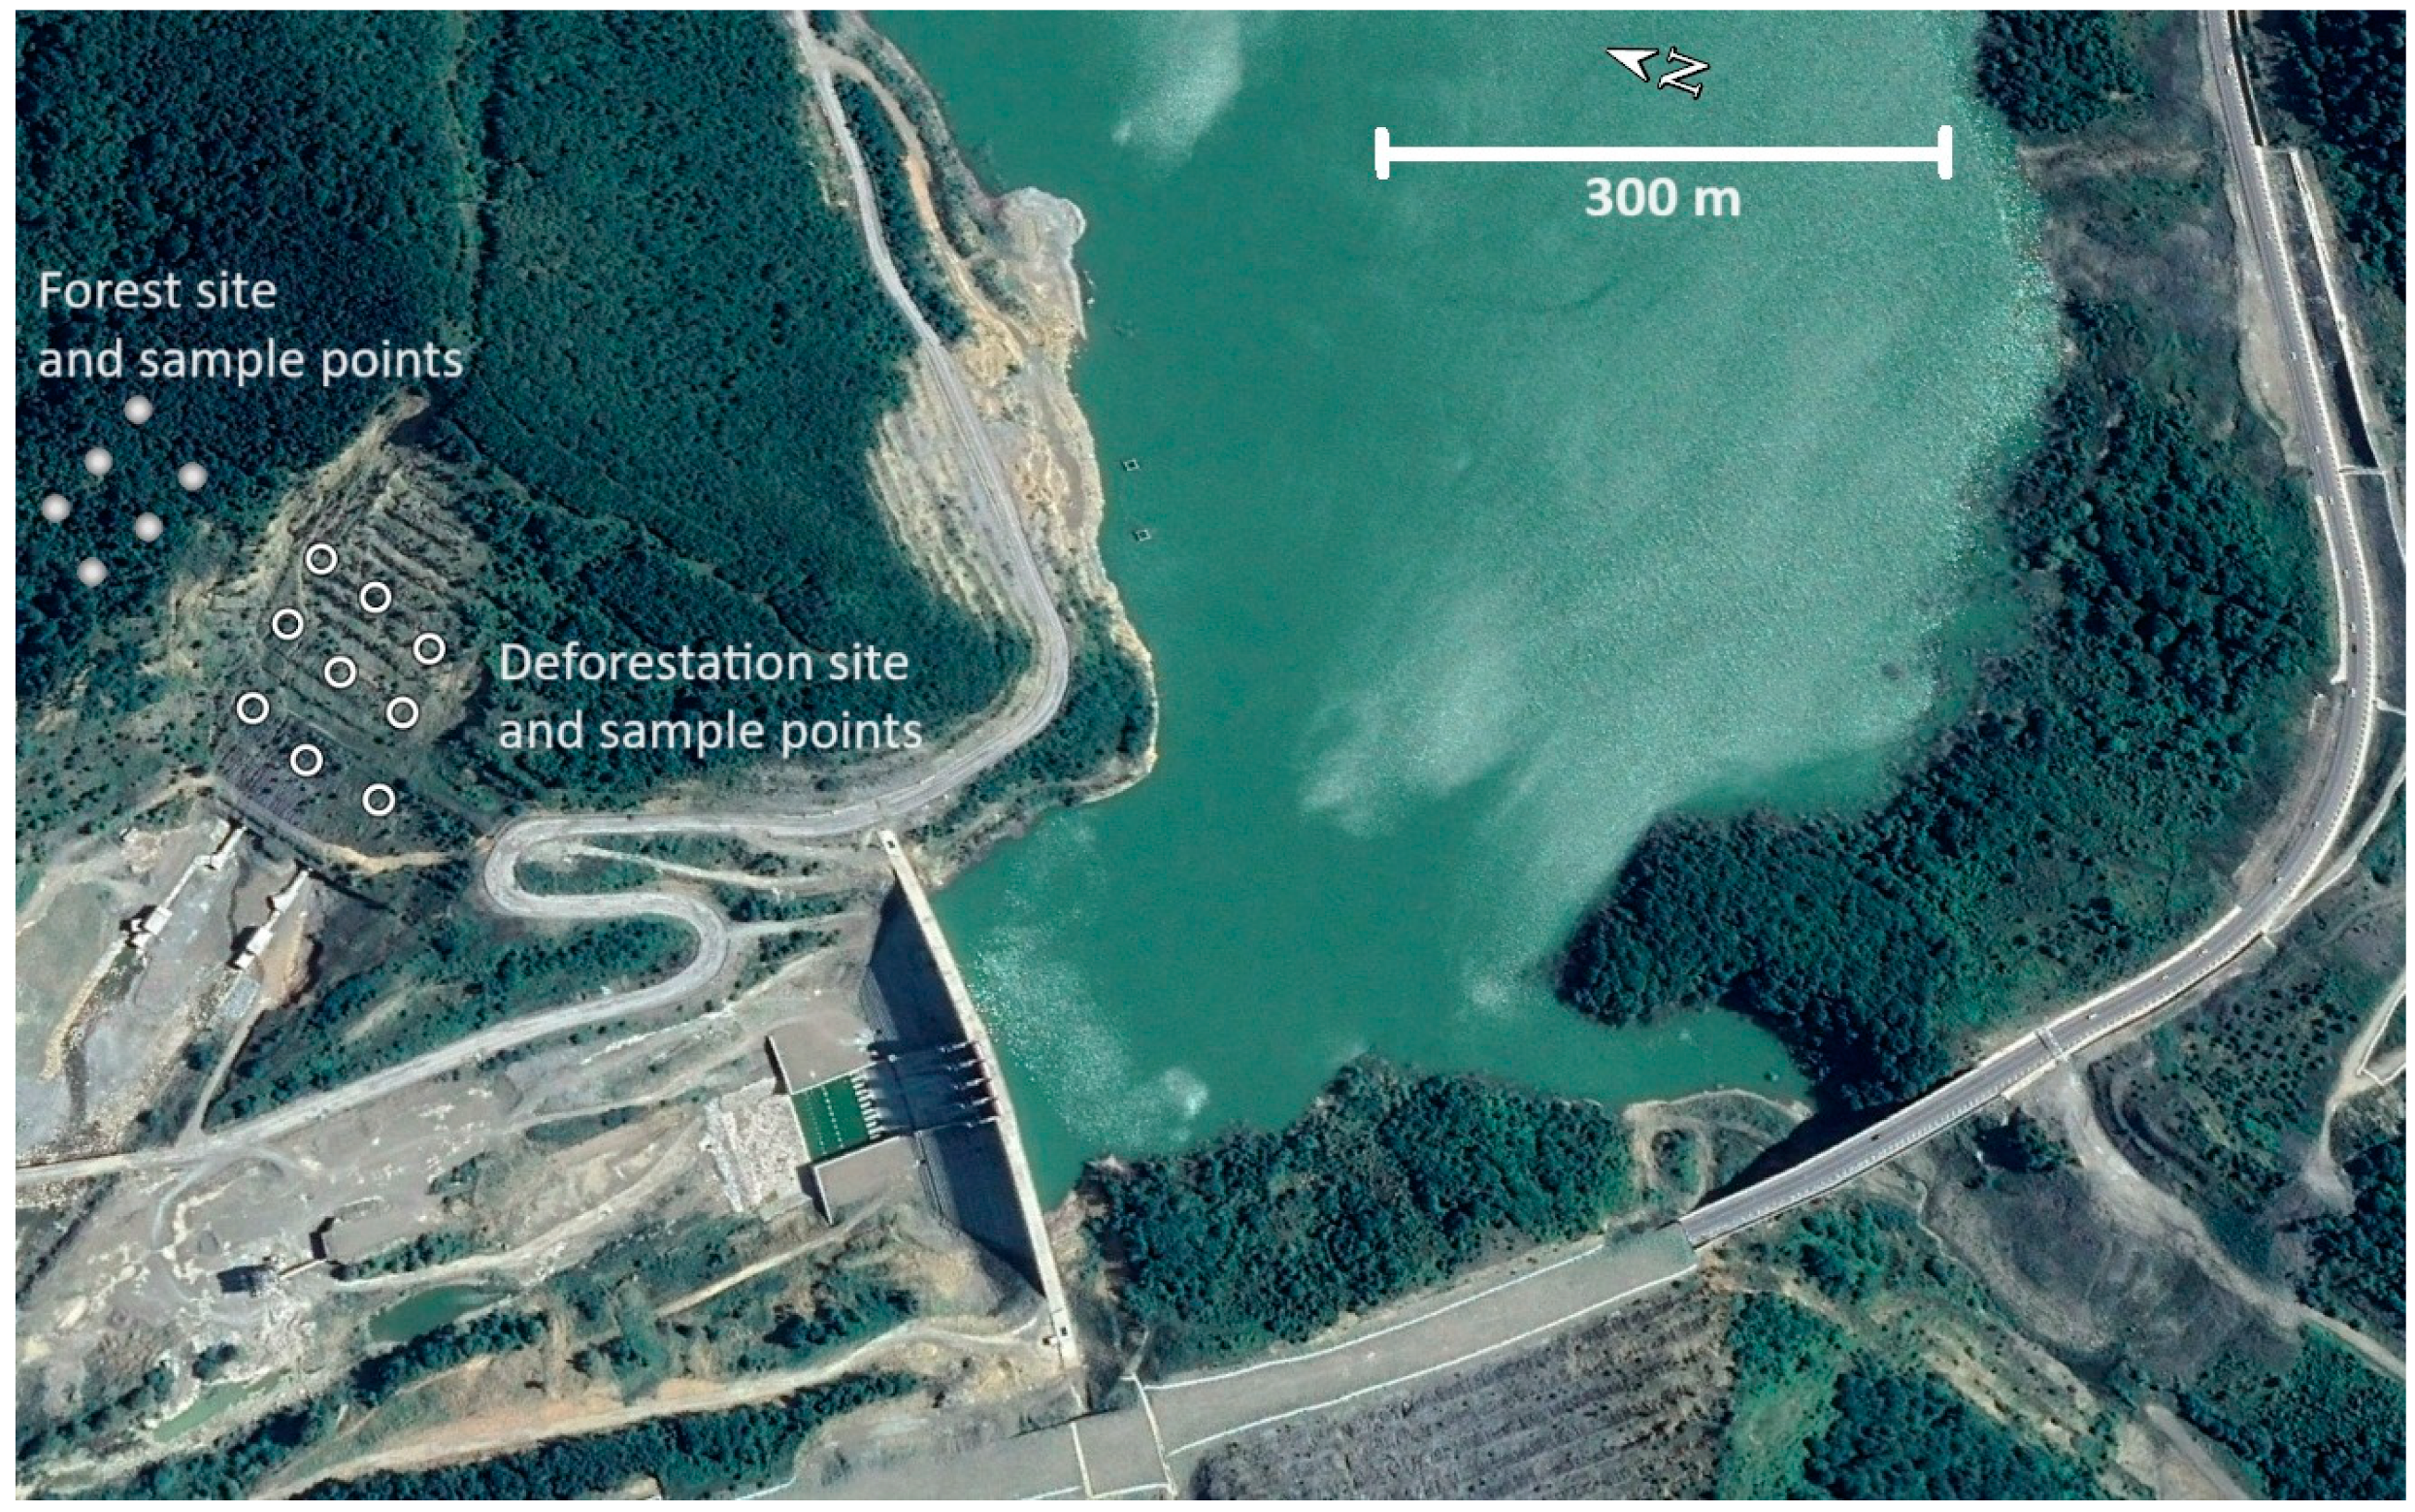
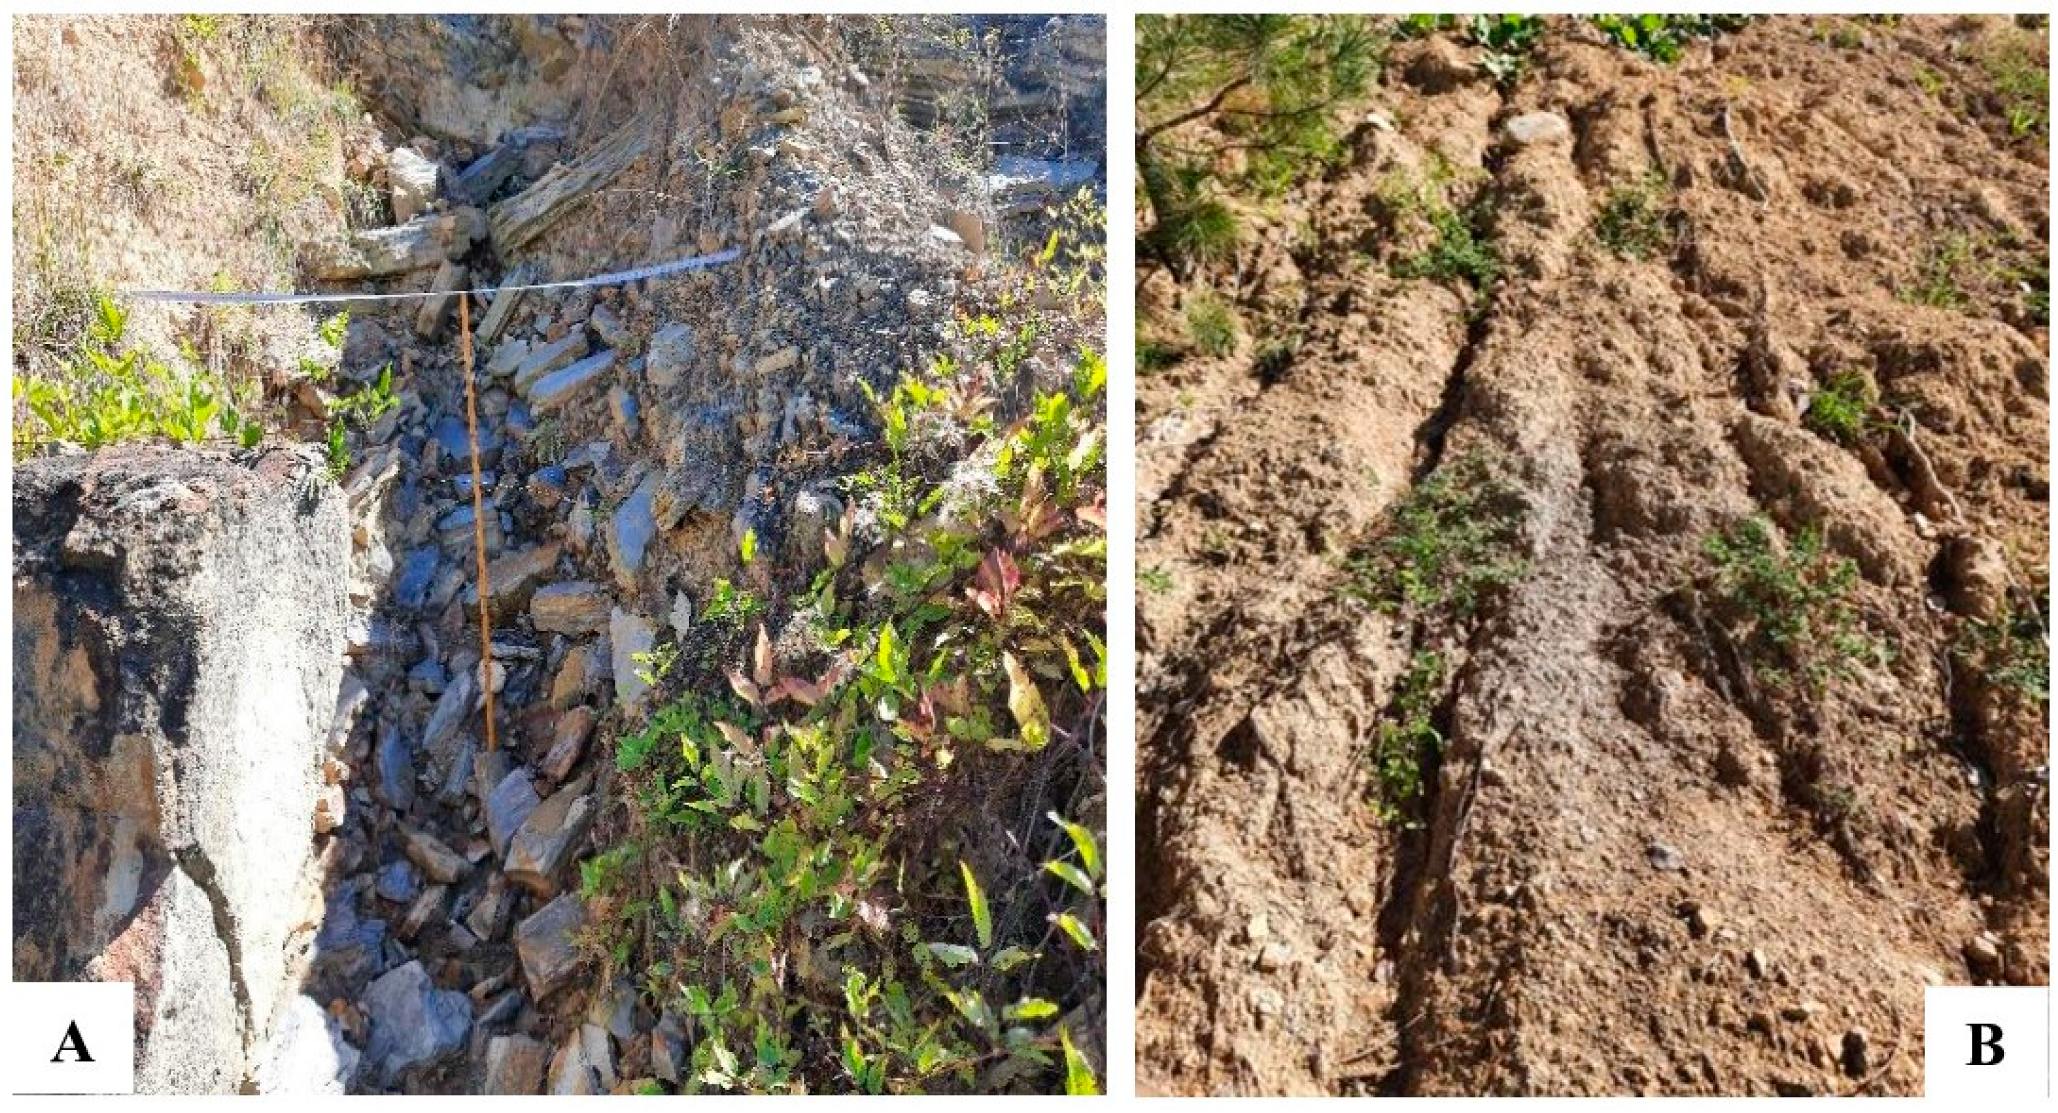
2.1. Study Area

This study was designed on the slopes of Kirazliköprü, which was deforested due to dam construction in Bartın province, located in northwestern Turkey. Kirazliköprü Dam (41°32′16″ N, 32°28′25″ E) is situated on the Gökırmak branch of the Bartın River, 16 km south of Bartın city center and 7 km north of Abdipaşa town (Figure 1). The altitude of the study area is approximately 150 m above sea level, and the main aspect is west. According to Bartın meteorological station data, the average total annual precipitation in the region is 1039 mm, while the mean annual temperature is 12.7 °C [33]. The area features a humid mesothermal climate [34]. The soil type in the Bartın region is ultisol according to USDA classification [35].
There are many openings in the study area where the tree cover has been removed due to both dam construction and the new route of the intercity highway. The impact of deforestation on these openings has resulted in the formation of gullies and grooves (Figure 2). Under these conditions, a deforested area of approximately 2.8 hectares with four independent gullies was selected as the study site (SDE). The area is covered by gullies with a depth of more than 1 m and a width of more than 2 m (Figure 2).
Since the SDE contains widening, narrowing, and deepening gullies, it exhibits a very heterogeneous topographic appearance. It is difficult to provide an average slope value for the SDE because the natural slope line of the site has changed considerably during deforestation. Moreover, some sections have been terraced for soil conservation. However, the site is very steep, with slopes exceeding 50% at many points. Herbaceous blackberry species (Rubus sp.) are densely distributed on the SDE. There are also some woody species such as black pine (Pinus nigra Arnold.), oak (Quercus robur L.), and strawberry tree (Arbutus unedo L.). A second site adjacent to the SDE, a natural forest (SF), was selected for comparison. The SF has similar slope and topographic characteristics, with an average slope of 45%. Black pine and oak are the dominant tree species in the SF. In addition, hornbeam (Carpinus betulus L.), hazelnut (Corylus sp.), maple (Acer campestre L.), chestnut (Castenea sativa Mill.), and rhododendron (Rhododendron ponticum L.) are other species in this site. Since the SDE and SF are neighboring areas, their average altitudes and aspects are also similar. Before deforestation, the same plant species were present in the SDE as in the SF. In the SF, there is an uneven-aged stand, with some black pines that are 80–100 years old.

2.2. Data Collection

Soil samples were taken from the topsoil surface (0–5 cm) to determine the microbial soil characteristics of the SDE and SF sites as of September 2022. Since microbial biomass is high in rainy periods and low in the winter period [36], sampling in the field was carried out in autumn when the averages are precise. In the SDE, the bottom and side walls of the gullies were avoided during sampling. The SDE was divided into three sections, upper, middle, and lower, at approximately 100 m intervals. Three bag samples were taken from each section at 50–70 m intervals to determine microbial characteristics. In this way, nine 2 mm sieved bag samples were taken from the SDE. A total of six soil samples were taken from SF soils at the same elevation levels as SDE (Figure 1). Soil samples were stored in a refrigerator at +4 °C until microbial analysis. Air and soil temperatures were recorded during soil sampling. The methods for determining certain physical and chemical soil characteristics in the SDE and SF soils are detailed in [31]. Some data on soil characteristics used in this study are shown in Table 1.

2.3. Determination of Soil Total N and Microbial Biomass N

Total nitrogen (Ntotal) was determined using the micro-Kjeldahl digestion, distillation, and titration procedure described by [37]. Nitrogen in microbial biomass (Nmic) was determined using the chloroform fumigation extraction method. For this purpose, a 30 g soil sample extracted with 0.5 M K2SO4—passed through a 2 mm sieve (<2 mm) and containing 40–50% moisture—was used [38]. The determination of Nmic was based on the difference between fumigated and non-fumigated biomass developed by [39]. The Nmic was determined by proportioning the difference obtained to a coefficient of 0.54. In addition, a Nmic analysis was performed in two replicates for each sample point. The Nmic/Ntotal indices were calculated as the ratio of microbial nitrogen contained in the soil to the total amount of nitrogen [40]. The Cmic/Nmic indices were calculated as the ratio of microbial biomass C (Cmic) to Nmic [40]. However, the Cmic data used in the Cmic/Nmic indices were obtained from the study conducted by [31].

2.4. Statistical Analysis

The SPSS 24.0 package program was used for statistical analyses. An independent t-test was used to compare total N; microbial biomass N; Nmic/Ntotal percentage; and Cmic/Nmic ratio values in the SDE and SF soils. A confidence limit of 95% (p < 0.05) was chosen to indicate significant differences between the characteristics of the sites. The relationship between some soil characteristics and total N, microbial biomass N, Nmic/Ntotal percentage, and Cmic/Nmic ratio values was evaluated by Pearson correlation analysis.

3. Results

3.1. Soil Total N and Microbial Biomass N Content

As presented in Table 1, there were statistical differences between some physical and chemical properties of the soils of forest and deforested areas, mainly sand, bulk density, pore space, soil temperature, moisture and reaction (pH), electrical conductivity, and organic C content. In addition to these characteristics, the lowest and highest Ntotal contents varied between 0.91 and 1.46 g kg−1 and 1.50 and 3.47 g kg−1 in the SDE and SF soils, respectively. The mean Ntotal values for SDE and SF were 1.20 g kg−1 and 2.49 g kg−1, respectively, and there was a statistical difference between them (p < 0.05) (Figure 3A). Ntotal, an essential plant nutrient of the soil, was found to be approximately 52% less in the SDE site compared with the SF site; thus, nitrogen was lost from the site. On the other hand, the Nmic contents of the SDE and SF soils ranged between 10.40 and 75.96 μg g−1 and 75.56 and 143.42 μg g−1, respectively. The mean Nmic values were 36.63 and 102.39 μg g−1 for the SDE and SF, respectively. The results of the statistical analysis demonstrated that the Nmic values differed (p < 0.05) in the SDE and SF soils (Figure 3B). The amount of Nmic in the SDE soils was approximately 66% less than in SF soils.

3.2. Nmic/Ntotal Percentage

The mean Nmic/Ntotal values were 3.21% (±2.17) and 4.48% (±1.48) in the SDE and SF soils, respectively (Figure 4). The lowest and highest Nmic/Ntotal values were 1.06–9.03% and 2.25–6.38% in the SDE and SF, respectively, with no statistical difference (p > 0.05).

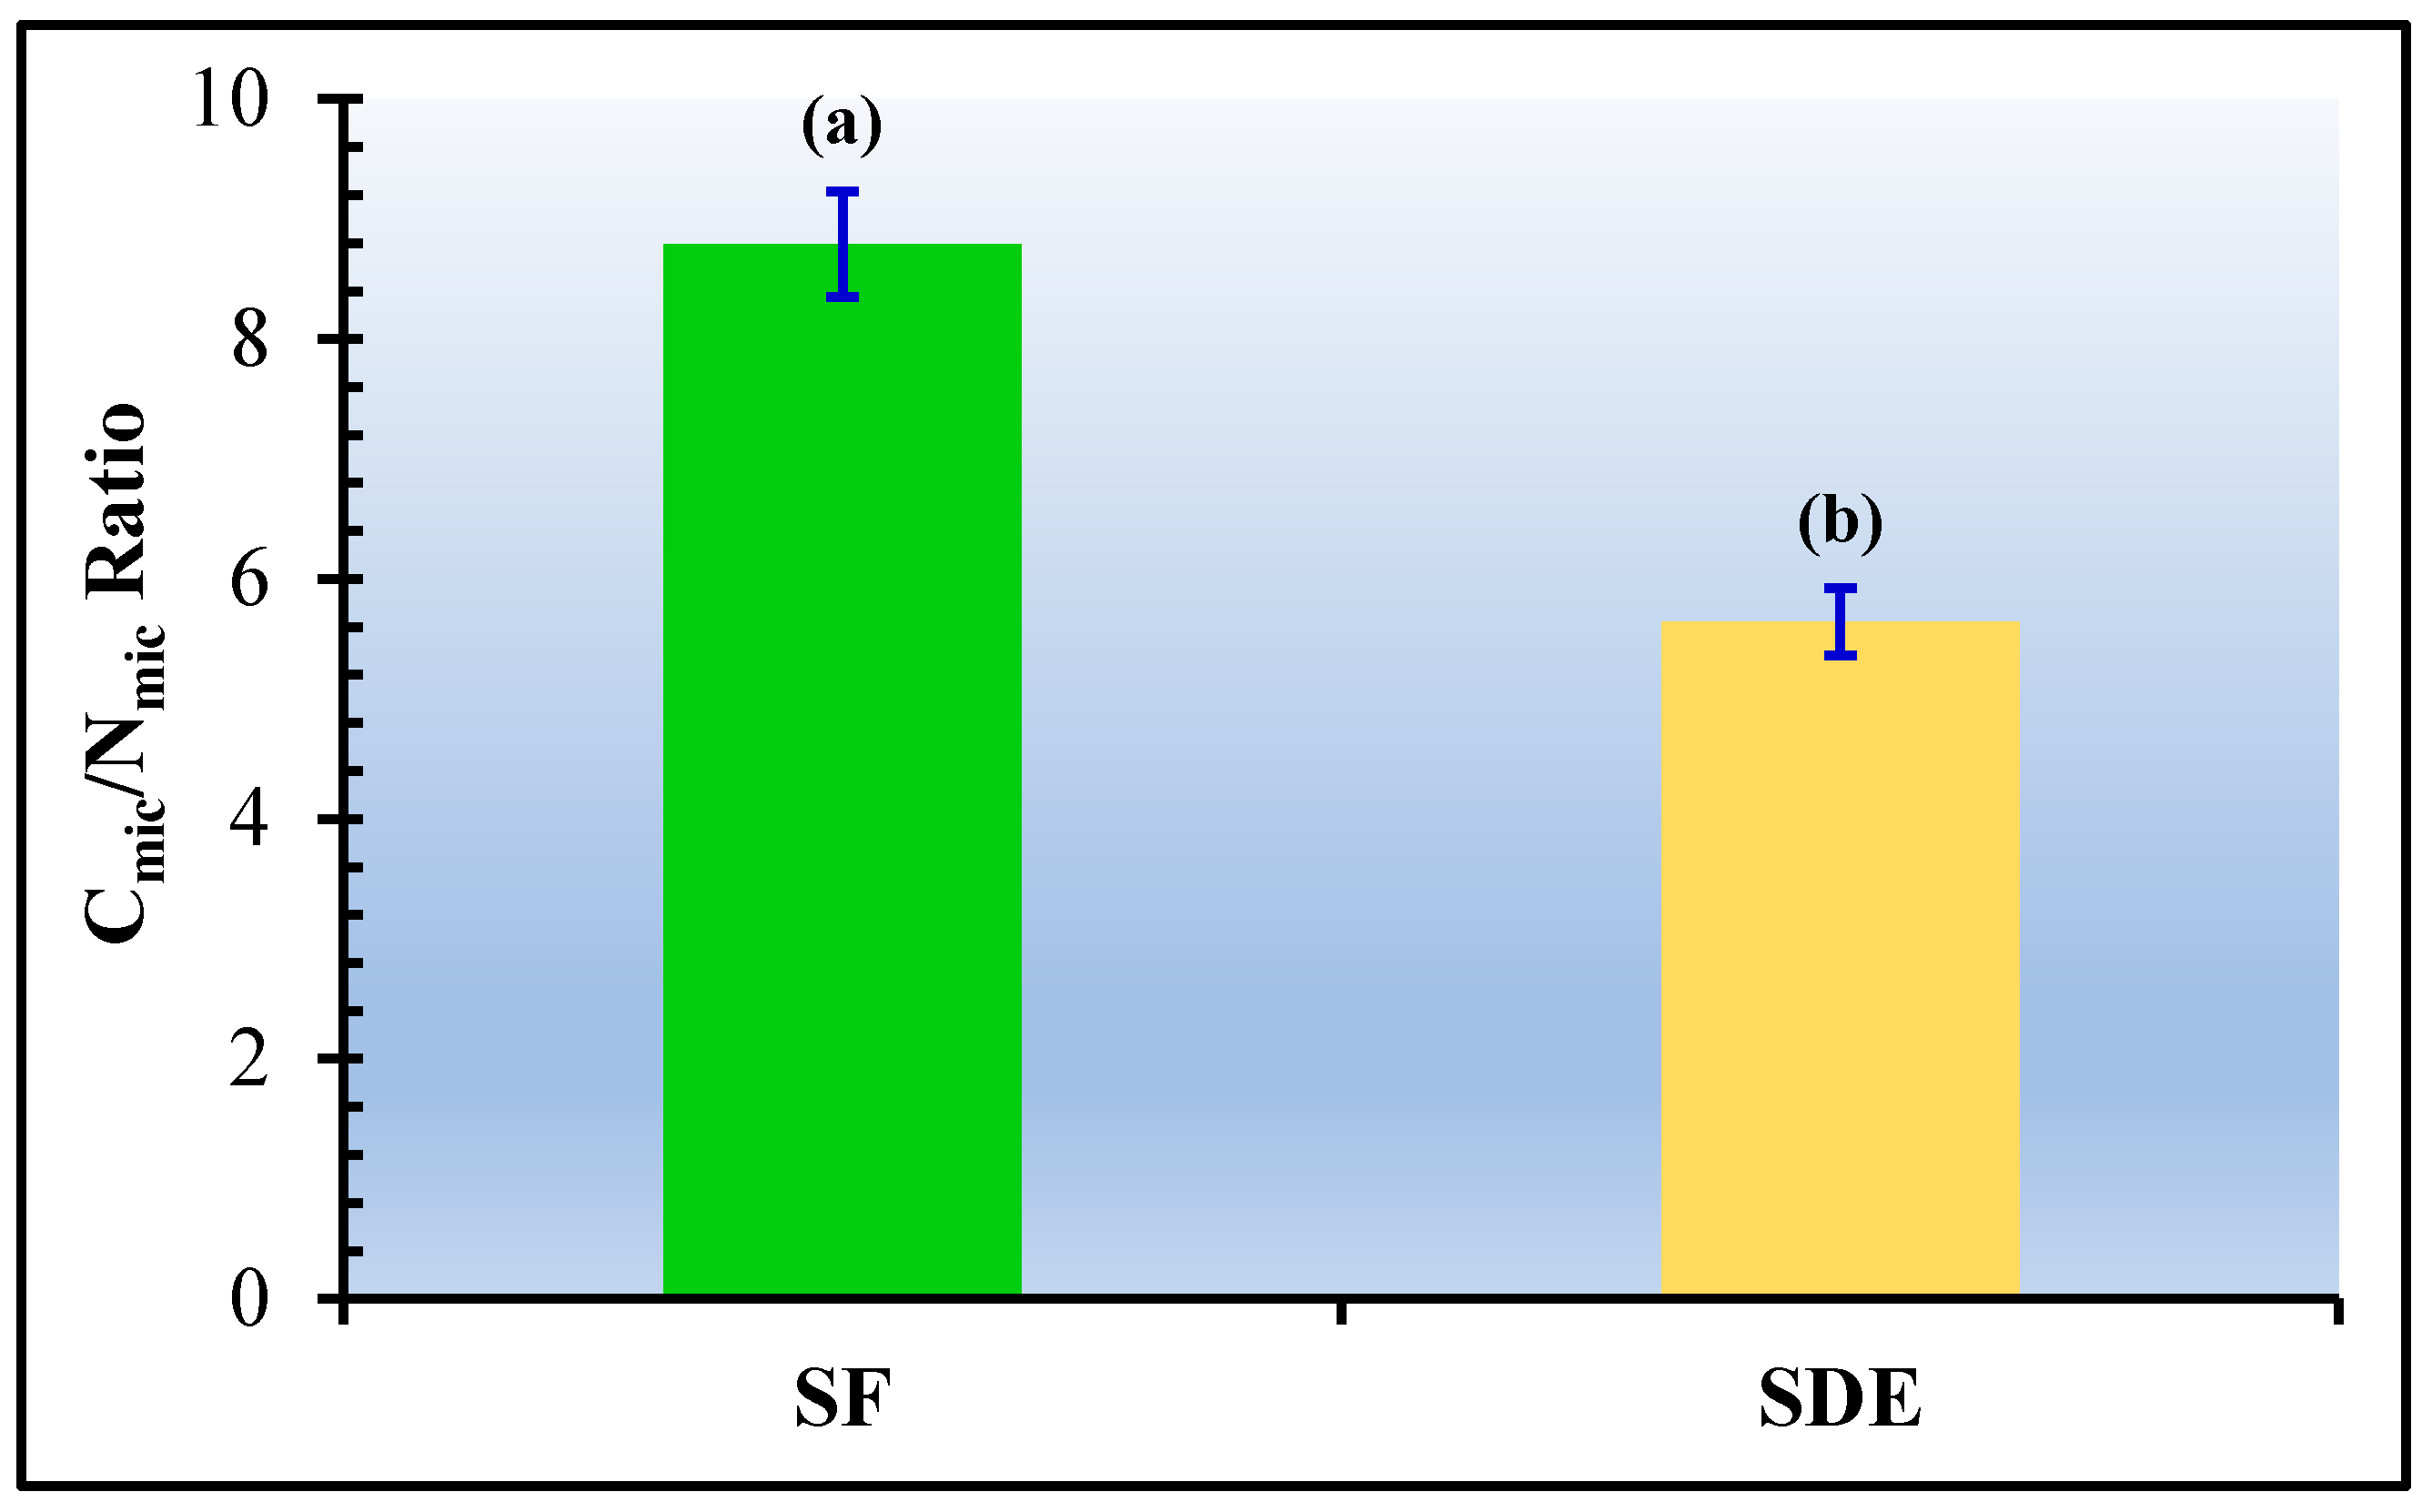
3.3. Cmic/Nmic Ratio

The mean Cmic/Nmic ratios in the SF and SDE soils were 8.79 (±1.65) and 5.64 (±1.09), respectively, and there was a statistical difference between the fields (p < 0.05) (Figure 5). The lowest and highest Cmic/Nmic ratios in the SF and SDE soils were 7.27–11.19 and 2.46–7.86, respectively.

3.4. Relationships between Some Physical–Chemical Soil Characteristics and Ntotal and Nmic

The relationship between Ntotal and Nmic and some physical and chemical soil characteristics was determined by Pearson correlation analysis. There was a positive correlation between Ntotal and Cmic/Nmic (r = 0.611; p < 0.05), organic carbon (r = 0.913; p < 0.01), and soil moisture (r = 0.821; p < 0.01) and a negative correlation between Ntotal and pH (r = −0.677; p < 0.01) and bulk density (r = −0.800; p < 0.01). Although there was a negative correlation between Ntotal and soil temperature (r = −0.397; p > 0.05) and electrical conductivity (r = −0.403; p > 0.05), it was not statistically significant. There was a positive relationship between the Nmic and Cmic/Nmic ratio (r = 0.562; p < 0.05), Nmic/Ntotal percentage (r = 0.641; p < 0.05), organic carbon (r = 0.715; p < 0.01), and soil moisture (r = 0.688; p < 0.01). In addition, there was a negative correlation between Nmic and pH (r = −0.796; p < 0.01) and bulk density (r = −0.699; p < 0.01). Soil temperature and electrical conductivity were not significantly correlated with Nmic (Table 2).

4. Discussion

Although there are some exceptions [41], Ntotal [42,43] and Nmic contents are generally higher in forests than in other land uses [44,45]. It has been suggested that the presence of litter and fine roots in forests may increase the Ntotal content [46]. Deformed agricultural areas have been reported to contain less Nmic than areas that protect their natural structure [47], and degraded forests have been reported to contain less Nmic than forests that maintain their natural structure [48,49]. Consequently, the increases in both the Ntotal and Nmic content of the soil in the SF area compared with the SDE area are probably due to the increased input of organic matter and total N, which is perhaps based on the decomposition of plant litter and the fine root zone. At the same time, previous research indicates that soils with high organic carbon content generally have higher amounts of microbial biomass [9,50]. In addition, the positive and robust correlation of Nmic with soil organic C (r = 0.715; p < 0.01) and total N (r = 0.675; p < 0.01) supports these ideas. Moreover, there was a positive and strong correlation between Ntotal and organic carbon (r = 0.913; p < 0.01) (Table 2). One of the objectives of this study was to reveal the difference between the Ntotal and Nmic amounts in soils belonging to a non-disturbed (control) forest area and an area under the influence of erosion and deforestation. In this sense, when Ntotal and Nmic values in the SDE and SF soils are compared, the findings are not different from the predicted ones. As a matter of fact, it was revealed that in the area under the influence of erosion and deforestation, plant nutrients (i.e., Ntotal) were lost, as well as the topsoil transported from the gullies and small gullies formed on the slope, with the effect of destroying the slope, which took place for many years. Indeed, there is about a twofold difference in Ntotal and a threefold difference in Nmic (Figure 3A,B) between the SF and SDE soils. Ref. [51] reported a threefold difference in nitrogen content between eroded and deposited sites. The findings obtained in this study are consistent with [51]. It is likely that deforestation has a primary effect on this result in two different ways. First, it reduces nitrogen storage in the deforested area [48], and second, it accelerates different types of erosion [52,53,54]. Unfortunately, in Turkey, building and construction processes are carried out without considering the protection of natural resources and taking necessary and adequate protection measures. With an average altitude of over 1000 m and a very rugged topography, Turkey is at serious risk of erosion even under normal conditions. However, decision-makers have always prioritized the second option in choosing between the conservation of natural resources and development. In this respect, it is hoped that the findings obtained from this and similar studies will serve as an opportunity for decision-makers to check their decisions and make more accurate actions in their future decisions.
According to [55], a decrease in the percentage of Nmic/Ntotal indicates a reduction in the quality of the substrate (such as carbohydrate, glucose, and protein). In this study, the percentage of Nmic/Ntotal was higher in SF soils than in the SDE. This implies that organic nitrogen components are not a limiting factor for microbial biomass in SF soils [56]. On the other hand, the percentage of Nmic/Ntotal is a quality indicator of soil organic matter, as it reveals the value of Ntotal incorporated into microbial biomass [40]. Although the percentage of Nmic/Ntotal was not statistically different between SDE and SF soils, there was a more than 1.2% decrease in SDE soils following erosion and deforestation. If erosion and deforestation are not prevented in the SDE area, vegetation and its remains (i.e., organic matter) will continue to move away from the site. As a result, the site will become increasingly poor regarding plant nutrients because there has been an erosion process in the SDE soils for many years, which has resulted in the transportation of the topsoil. In other words, the topsoil in the SDE soils is actually the lower soil layer that remains in the area after the transported soil. Considering that the percentage of Nmic/Ntotal increases with soil depth [57], a particular percentage difference between SDE and SF can be explained. The topsoil from the SDE is the soil that remains in the area after deforestation and soil transported by erosion, and it is deeper than the soil at the bottom before erosion and deforestation. On the other hand, since both deforestation and erosion processes were experienced in the SDE, it could be expected that the Ntotal value would be much lower and the Nmic/Ntotal ratio would increase. Because Ntotal is significantly affected by the removal of forest cover [58] and Nmic restoration in soils after the deformation process occurs faster than Ntotal [59]. In this study, although the percentage of Nmic/Ntotal was higher in the SF and SDE, there was no statistical difference in the percentage of Nmic/Ntotal between the sites. One of the reasons predicted here is the presence of larch trees, a coniferous species, in the SF because the dead cover formed by pine needles contains components such as resin, lignin, and phenol, which soil microbial organisms do not like after decomposition [60,61]. The fact that these compounds were released because of the decomposition of the dead cover in the SF area may have hindered the further proliferation of microbial organisms present in the soil. This is because this type of organic matter is not preferred by microbial organisms, which prefer organic matter originating from leafy and herbaceous plants. Nevertheless, the relatively high percentage of Nmic/Ntotal in the SF indicates that the availability of organic nitrogen components is better in the SF than in the SDE, indicating a rich soil substrate.
The Cmic/Nmic ratio is generally considered an indicator for interpreting fungal–bacterial relationships in the composition of microbial biomass in soil [62,63,64]. Indeed, according to [65], a Cmic/Nmic ratio of 10–12 indicates that the microbial community is dominated by fungi, while a ratio of 3–5 indicates that bacteria dominate. However, although it has recently been reported that there are some limitations and uncertainties in interpreting the Cmic/Nmic ratio as an indicator of fungal–bacterial relationships [66,67], forests are still reported to have higher fungal dominance and content [68]. Considering that soil fungi have two main factors in the ecosystem that influence changes in metabolic activity, such as the decomposition and regulation of organic matter in the plant litter and root system [69], it can be stated that the microbial biomass in SF soils (mean 8.79) is mostly formed by fungi, and therefore, even the decomposition of organic matter and the release of plant nutrients are in good and regular condition. The Cmic/Nmic (8.79) result for the forest area in this study is like the Cmic/Nmic ratios previously obtained for tropical, temperate, and boreal forests. In the study, it was found that the Cmic/Nmic ratio of soil samples in forest types ranged between 2.5 and 27.5, with an average of 8.2 [70]. On the other hand, in this study, the Cmic/Nmic ratio in the SF and SDE soils was found to be lower in SDE soils (average 5.64) and showed a statistical difference (Figure 5). This result is an indication that bacteria dominated the microbial diversity in the SDE after erosion and deforestation (no better than in the forest site). Apart from erosion and deforestation, this increase in bacterial biomass in the SDE area may be primarily related to the high soil pH and soil temperature, as well as the low soil moisture content (see Table 1). Indeed, some researchers [9,71,72] have suggested that the fungal–bacterial ratio of microbial biomass may be more influenced by factors such as soil moisture, temperature, and reaction (pH) than by litter quality. According to these researchers, bacteria are better adapted to high temperature and soil reaction (pH) conditions than fungi, which increases the number and weight of bacteria in the microbial community. On the other hand, the positive correlation of the Cmic/Nmic ratio with soil moisture (r = 0.576; p < 0.05), the negative correlation with soil reaction (r = −0.749; p < 0.01), and the strong correlation between the Cmic/Nmic ratio and soil moisture (r = 0.576; p < 0.05) confirm the dominance of fungi in the SF site with high humidity and low pH conditions (Table 1 and Table 2). When the Cmic/Nmic ratios obtained from previous studies [9,10,11,44,63] are compared with the SDE in different plantations and forests in Bartın and its surrounding area, it can be better understood that there is an overall diminishing microbial biomass community structure. This result can be attributed to the integrated effect of deforestation and erosion. Although there are not many field studies on the impact of erosion on microbial activity, deforestation negatively affects microbial biomass [73,74,75]. In this study, the Cmic/Nmic ratio strongly suggests that the integrated effect of deforestation and erosion on the SDE negatively affects microbial biomass and activity.

5. Conclusions

This study was completed in an area subjected to deforestation and erosion around Kirazliköprü Dam. Kirazlıköprü Dam is a dam on Gökırmak Stream in Bartın, which was constructed in 1999 for irrigation, energy, and flood control purposes and completed in 2017. As a result of this study, it was revealed that deforestation that started before 2000 due to dam construction and subsequent erosion had adverse effects on the physical, chemical, and biochemical characteristics of the soil. The physical and chemical characteristics of the soils, mainly sand, bulk density, soil moisture, temperature, reaction, and organic carbon contents, were worsened in the SDE site compared with the SF site. In addition, the different Cmic/Nmic ratios in SF and SDE soils indicate that the microbial communities of the areas are different; the fungal population is more dominant in the SF site, and the bacterial population is dominant in the SDE site. Although the Nmic/Ntotal percentage is not statistically different between the sites, the substrate quality of organic matter is relatively worse in the SDE site, which has a lower Nmic/Ntotal percentage. In conclusion, we can say that deforestation and erosion due to dam construction in the area we examined caused the loss of plant nutrients from the soil and a deterioration in the amount and activity of microbial biomass. In this respect, decision-makers are expected to consider the results of these and similar studies when choosing between the conservation of natural resources and development. On the other hand, since microbial biomass measurements are a sensitive indicator in monitoring soil quality that is decreasing/degrading for various reasons, the condition of the soils in the study area should be monitored in the following years.

Author Contributions

İ.B. and H.S. substantively participated in this work. Namely, İ.B. and H.S. designed the work. The field and laboratory work was carried out by all authors. İ.B. and H.S. prepared the manuscript. All authors have read and agreed to the published version of the manuscript.

Funding

This research received no external funding.

Data Availability Statement

The datasets used and/or analyzed during the current study are available from the corresponding author upon reasonable request.

Acknowledgments

The authors have received no financial support or funding from any organization at any stage of this study.

Conflicts of Interest

There are no conflicts of interest between the authors and any persons or organizations.

References

  1. Bargali, K.; Manral, V.; Padalia, K.; Bargali, S.S.; Upadhyay, V.P. Effect of vegetation type and season on microbial biomass carbon in Central Himalayan forest soils, India. Catena 2018, 171, 125–135. [Google Scholar] [CrossRef]
  2. Singh, J.S.; Gupta, V.K. Soil microbial biomass: A key soil driver in management of ecosystem functioning. Sci. Total Environ. 2018, 634, 497–500. [Google Scholar] [CrossRef] [PubMed]
  3. Islam, K.R.; Weil, R.R. Soil quality indicator properties in mid-Atlantic soils as influenced by conservation management. J. Water Soil Conserv. 2000, 55, 69–78. [Google Scholar]
  4. Xu, Y.; Du, A.; Wang, Z.; Zhu, W.; Li, C.; Wu, L. Effects of different rotation periods of Eucalyptus plantations on soil physiochemical properties, enzyme activities, microbial biomass and microbial community structure and diversity. For. Ecol. Manag. 2020, 456, 117683. [Google Scholar] [CrossRef]
  5. Allen, K.; Corre, M.D.; Tjoa, A.; Veldkamp, E. Soil nitrogen-cycling responses to conversion of lowland forests to oil palm and rubber plantations in Sumatra, Indonesia. PLoS ONE 2015, 10, e0133325. [Google Scholar] [CrossRef] [PubMed]
  6. Wang, C.; Liu, D.; Bai, E. Decreasing soil microbial diversity is associated with decreasing microbial biomass under nitrogen addition. Soil Biol. Biochem. 2018, 120, 126–133. [Google Scholar] [CrossRef]
  7. Gao, W.; Yan, D. Warming suppresses microbial biomass but enhances N recycling. Soil Biol. Biochem. 2019, 131, 111–118. [Google Scholar] [CrossRef]
  8. Li, Z.; Tian, D.; Wang, B.; Wang, J.; Wang, S.; Chen, H.Y.H.; Xu, X.; Wang, C.; He, N.; Niu, S. Microbes drive global soil nitrogen mineralization and availability. Glob. Change Biol. 2019, 25, 1078–1088. [Google Scholar] [CrossRef]
  9. Bolat, I.; Sensoy, H.; Özer, D. Short-term changes in microbial biomass and activity in soils under black locust trees (Robinia pseudoacacia L.) in the northwest of Turkey. J. Soils Sediments 2015, 15, 2189–2198. [Google Scholar] [CrossRef]
  10. Bolat, I.; Kara, Ö.; Sensoy, H.; Yüksel, K. Influences of Black Locust (Robinia pseudoacacia L.) afforestation on soil microbial biomass and activity. Iforest—Biogeosciences For. 2016, 9, 171–177. [Google Scholar] [CrossRef]
  11. Bolat, I.; Sensoy, H. Microbial biomass soil content and activity under black alder and sessile oak in the western Black Sea Region of Turkey. Int. J. Environ. Res. 2019, 13, 781–791. [Google Scholar] [CrossRef]
  12. Bhanwaria, R.; Singh, B.; Musarella, C.M. Effect of organic manure and moisture regimes on soil physiochemical properties, microbial biomass Cmic:Nmic:Pmic turnover and yield of mustard grains in arid climate. Plants 2022, 11, 722. [Google Scholar] [CrossRef] [PubMed]
  13. Wang, P.; Xie, W.; Ding, L.; Zhuo, Y.; Gao, Y.; Li, J.; Zhao, L. Effects of maize–crop rotation on soil physicochemical properties, enzyme activities, microbial biomass and microbial community structure in Southwest China. Microorganisms 2023, 11, 2621. [Google Scholar] [CrossRef] [PubMed]
  14. Junior, C.R.P.; Pereira, M.G.; Filho, J.S.O.; Beutler, S.J. Can topography affect the restoration of soil properties after deforestation in a semiarid ecosystem? J. Arid Environ. 2019, 162, 45–52. [Google Scholar] [CrossRef]
  15. Zeraatpisheh, M.; Bakhshandeh, E.; Hosseini, M.; Alavi, S.M. Assessing the effects of deforestation and intensive agriculture on the soil quality through digital soil mapping. Geoderma 2020, 363, 114139. [Google Scholar] [CrossRef]
  16. Zhang, Q.; Wang, Z.; Yao, Y.; Kong, W.; Zhao, Z.; Shao, M.; Wei, X. Effects of slope morphology and position on soil nutrients after deforestation in the hilly loess region of China. Agric. Ecosyst. Environ. 2021, 321, 107615. [Google Scholar] [CrossRef]
  17. Rezapour, S.; Alipour, O. Degradation of Mollisols quality after deforestation and cultivation on a transect with Mediterranean condition. Environ. Earth Sci. 2017, 76, 755. [Google Scholar] [CrossRef]
  18. Li, M.; Zhou, X.; Zhang, Q.; Cheng, X. Consequences of afforestation for soil nitrogen dynamics in central China. Agric. Ecosyst. Environ. 2014, 183, 40–46. [Google Scholar] [CrossRef]
  19. Ferreira, A.C.C.; Leite, L.F.C.; De Araujo, A.S.F.; Eisenhauer, N. Land-use type effects on soil organic carbon and microbial properties in a semi-arid region of northeast Brazil. Land Degrad. Dev. 2016, 27, 171–178. [Google Scholar] [CrossRef]
  20. Kassa, H.; Dondeyne, S.; Poesen, J.; Frankl, A.; Nyssen, J. Impact of deforestation on soil fertility, soil carbon and nitrogen stocks: The case of the Gacheb catchment in the White Nile Basin, Ethiopia. Agric. Ecosyst. Environ. 2017, 247, 273–282. [Google Scholar] [CrossRef]
  21. Sirajul Haque, S.M.; Gupta, S.D.; Miah, S. Deforestation effects on biological and other important soil properties in an upland watershed of Bangladesh. J. For. Res. 2014, 25, 877–885. [Google Scholar] [CrossRef]
  22. Bakhshandeh, E.; Hosseini, M.; Zeraatpisheh, M.; Francaviglia, R. Land use change effects on soil quality and biological fertility: A case study in northern Iran. Eur. J. Soil Biol. 2019, 95, 103119. [Google Scholar] [CrossRef]
  23. De Souza, T.A.F.; Da Silva, L.J.R.; Nascimento, G.S. Amazonian deforestation and its influence on soil biotic factors and abiotic properties. Pedobiologia 2023, 97–98, 150865. [Google Scholar] [CrossRef]
  24. Dong, J.; Zhou, K.; Jiang, P.; Wu, J.; Fu, W. Revealing horizontal and vertical variation of soil organic carbon, soil total nitrogen and C:N ratio in subtropical forests of southeastern China. J. Environ. Manag. 2021, 289, 112483. [Google Scholar] [CrossRef]
  25. Kara, O.; Sensoy, H.; Bolat, I. Slope length effects on microbial biomass and activity of eroded sediments. J. Soils Sediments 2010, 10, 434–439. [Google Scholar] [CrossRef]
  26. Liu, R.; Pan, Y.; Bao, H.; Liang, S.; Jiang, Y.; Tu, H.; Nong, J.; Huang, W. Variations in soil physico-chemical properties along slope position gradient in secondary vegetation of the hilly region, Guilin, southwest China. Sustainability 2020, 12, 1303. [Google Scholar] [CrossRef]
  27. Shi, W.; Huang, M.; Wu, L. Prediction of storm-based nutrient loss incorporating the estimated runoff and soil loss at a slope scale on the Loess Plateau. Land Degrad. Dev. 2018, 29, 2899–2910. [Google Scholar] [CrossRef]
  28. Feng, S.; Wen, H.; Ni, S.; Wang, J.; Cai, C. Degradation characteristics of soil-quality-related physical and chemical properties affected by collapsing gully: The case of subtropical hilly region, China. Sustainability 2019, 11, 3369. [Google Scholar] [CrossRef]
  29. Merlo, M.N.; Avanzi, J.C.; da Silva, L.C.M.; da Silva Aragao, O.O.; Borghi, E.; de Souza Moreira, F.M.; Thebaldi, M.S.; de Resende, A.V.; Silva, M.L.N.; Silva, B.M. Microbiological properties in cropping systems and their relationship with water erosion in the Brazilian Cerrado. Water 2022, 14, 614. [Google Scholar] [CrossRef]
  30. Qiu, L.; Zhu, H.; Liu, J.; Yao, Y.; Wang, X.; Rong, G.; Zhao, X.; Shao, M.; Wei, X. Soil erosion significantly reduces organic carbon and nitrogen mineralization in a simulated experiment. Agric. Ecosyst. Environ. 2021, 307, 107232. [Google Scholar] [CrossRef]
  31. Sensoy, H. Impact of deforestation and erosion on some soil physicochemical properties and microbial activity on steep slopes. Croat. J. For. Eng. 2024, 45, 305–318. [Google Scholar] [CrossRef]
  32. Karakaya, K. Numerical Simulation of the Kirazlıköprü Dam Failure on the Gökırmak River. Master’s Thesis, Middle East Technical University, Ankara, Turkey, 2005; 117p. [Google Scholar]
  33. Sensoy, H.; Atesoglu, A. A review of climate type variability from Bartın region. J. Bartin Fac. For. 2018, 20, 576–582. [Google Scholar]
  34. Sensoy, H.; Kara, Ö. Slope shape effect on runoff and soil erosion under natural rainfall conditions. iForest 2014, 7, 110–114. [Google Scholar] [CrossRef]
  35. Kara, Ö.; Bolat, İ.; Çakıroğlu, K.; Öztürk, M. Plant canopy effects on litter accumulation and soil microbial biomass in two temperate forests. Biol. Fertil. Soils 2008, 45, 193–198. [Google Scholar] [CrossRef]
  36. Devi, N.B.; Yadava, P.S. Seasonal dynamics in soil microbial biomass C, N and P in a mixed-oak forest ecosystem of Manipur, North-east India. Appl. Soil Ecol. 2006, 31, 220–227. [Google Scholar] [CrossRef]
  37. Rowell, D.L. Soil Science: Methods and Applications, 1st ed.; Longman Group: London, UK, 1994. [Google Scholar]
  38. Anderson, J.M.; Ingram, J.S.I. Tropical Soil Biology and Fertility: A Handbook of Methods, 2nd ed.; CAB International: Wallingford, UK, 1996; pp. 68–70. [Google Scholar]
  39. Brookes, P.C.; Landman, A.; Pruden, G.; Jenkinson, D.S. Chloroform fumigation and the release of soil nitrogen: A rapid direct extraction method to measure microbial biomass nitrogen in soil. Soil Biol. Biochem. 1985, 17, 837–842. [Google Scholar] [CrossRef]
  40. Lopes, E.L.N.; Fernandes, A.R.; Ruivo, L.P.; Cattanio, J.H.; Souza, G.F.D. Microbial biomass and soil chemical properties under different land use systems in northeastern Pará. Rev. Bras. Cienc. Solo 2011, 35, 1127–1139. [Google Scholar] [CrossRef]
  41. Bolat, I.; Sensoy, H. Changes in soil microbial biomass and activity under different land-use types in Bartın, northwestern Türkiye. Contemp. Probl. Ecol. 2023, 16, 886–889. [Google Scholar] [CrossRef]
  42. Xiao, S.; Zhang, W.; Ye, Y.; Zhao, J.; Wang, K. Soil aggregate mediates the impacts of land uses on organic carbon, total nitrogen, and microbial activity in a Karst ecosystem. Sci. Rep. 2017, 7, 41402. [Google Scholar] [CrossRef]
  43. Razzaghi, S.; Islam, K.R.; Ahmed, I.A.M. Deforestation impacts soil organic carbon and nitrogen pools and carbon lability under Mediterranean climates. J. Soils Sediments 2022, 22, 2381–2391. [Google Scholar] [CrossRef]
  44. Kara, O.; Bolat, I. The effect of different land uses on soil microbial biomass carbon and nitrogen in Bartın province. Turk. J. Agric. For. 2008, 32, 281–288. [Google Scholar]
  45. Tiwari, S.; Singh, C.; Boudh, S.; Rai, P.K.; Gupta, V.K.; Singh, J.S. Land use change: A key ecological disturbance declines soil microbial biomass in dry tropical uplands. J. Environ. Manag. 2019, 242, 1–10. [Google Scholar] [CrossRef]
  46. Gao, F.; Cui, X.; Sang, Y.; Song, J. Changes in soil organic carbon and total nitrogen as affected by primary forest conversion. For. Ecol. Manag. 2020, 463, 118013. [Google Scholar] [CrossRef]
  47. Groppo, J.D.; Lins, S.R.M.; Camargo, P.B.; Assad, E.D.; Pinto, H.S.; Martins, S.C.; Salgado, P.R.; Evangelista, B.; Vasconcellos, E.; Sano, E.E.; et al. Changes in soil carbon, nitrogen, and phosphorus due to land-use changes in Brazil. Biogeosciences 2015, 12, 4765–4780. [Google Scholar] [CrossRef]
  48. Moghimian, N.; Hosseini, S.M.; Kooch, Y.; Darki, B.Z. Impacts of changes in land use/cover on soil microbial and enzyme activities. Catena 2017, 157, 407–414. [Google Scholar] [CrossRef]
  49. Haghverdi, K.; Kooch, Y. Soil carbon and nitrogen fractions in response to land use/cover changes. Acta Oecologica 2020, 109, 103659. [Google Scholar] [CrossRef]
  50. Zhu, B.; Li, Z.; Li, P.; Liu, G.; Xue, S. Soil erodibility, microbial biomass, and physical–chemical property changes during long-term natural vegetation restoration: A case study in the Loess Plateau, China. Ecol. Res. 2010, 25, 531–541. [Google Scholar] [CrossRef]
  51. Berhe, A.A.; Torn, M.S. Erosional redistribution of topsoil controls soil nitrogen dynamics. Biogeochemistry 2017, 132, 37–54. [Google Scholar] [CrossRef]
  52. Restrepo, J.D.; Kettner, A.J.; Syvitski, J.P.M. Recent deforestation causes rapid increase in river sediment load in the Colombian Andes. Anthropocene 2015, 10, 13–28. [Google Scholar] [CrossRef]
  53. Parhizkar, M.; Shabanpour, M.; Zema, D.A.; Lucas-Borja, M.E. Rill erosion and soil quality in forest and deforested ecosystems with different morphological characteristics. Resources 2020, 9, 129. [Google Scholar] [CrossRef]
  54. Chuma, G.B.; Mondo, J.M.; Ndeko, A.B.; Mugumaarhahama, Y.; Bagula, E.M.; Blaise, M.; Valerie, M.; Jacques, K.; Karume, K.; Mushagalusa, G.N. Forest cover affects gully expansion at the tropical watershed scale: Case study of Luzinzi in Eastern DR Congo. Trees For. People 2021, 4, 100083. [Google Scholar] [CrossRef]
  55. Bauhus, J.D.; Pare, D.; Cote, L. Effects of tree species, stand age and soil type on soil microbial biomass and its activity in a southern boreal forest. Soil Biol. Biochem. 1998, 30, 1077–1089. [Google Scholar] [CrossRef]
  56. Khan, K.S.; Joergensen, R.G. Microbial C, N, and P relationships in moisture-stressed soils of Potohar, Pakistan. J. Plant Nutr. Soil Sci. 2006, 169, 494–500. [Google Scholar] [CrossRef]
  57. Wen, L.; Lei, P.; Xiang, W.; Yan, W.; Liu, S. Soil microbial biomass carbon and nitrogen in pure and mixed stands of Pinus massoniana and Cinnamomum camphora differing in stand age. For. Ecol. Manag. 2014, 328, 150–158. [Google Scholar] [CrossRef]
  58. Foote, J.A.; Boutton, T.W.; Scott, D.A. Soil C and N storage and microbial biomass in US southern pine forests: Influence of forest management. For. Ecol. Manag. 2015, 355, 48–57. [Google Scholar] [CrossRef]
  59. Singh, K.P.; Mandal, T.N.; Tripathi, S.K. Patterns of restoration of soil physciochemical properties and microbial biomass in different landslide sites in the sal forest ecosystem of Nepal Himalaya. Ecol. Eng. 2001, 17, 385–401. [Google Scholar] [CrossRef]
  60. Nsabimana, D.; Haynes, R.J.; Wallis, F.M. Size, activity and catabolic diversity of the soil microbial biomass as affected by land use. Appl. Soil Ecol. 2004, 26, 81–92. [Google Scholar] [CrossRef]
  61. Evangelou, E.; Tsadilas, C.; Giourga, C. Seasonal variation of soil microbial biomass carbon and nitrogen as affected by land use in a mediterranean agro ecosystem. Commun. Soil Sci. Plant Anal. 2021, 52, 222–234. [Google Scholar] [CrossRef]
  62. Moore, J.M.; Klose, S.; Tabatabai, M.A. Soil microbial biomass carbon and nitrogen as affected by cropping systems. Biol. Fertil. Soils 2000, 31, 200–210. [Google Scholar] [CrossRef]
  63. Kara, O.; Bolat, I. Soil microbial biomass C and N changes in relation to forest conversion in the Northwestern Turkey. Land Degrad. Dev. 2008, 19, 421–428. [Google Scholar] [CrossRef]
  64. Fierer, N.; Strickland, M.S.; Liptzin, D.; Bradford, M.A.; Cleveland, C.C. Global patterns in belowground communities. Ecol. Lett. 2009, 12, 1238–1249. [Google Scholar] [CrossRef]
  65. Jenkinson, D.S.; Ladd, J.N. Microbial biomass in soil measurement and turnover. In Soil Biochemistry; Paul, E.A., Ladd, J.N., Eds.; Marcel Dekker Inc.: New York, NY, USA; Basel, Switzerland, 1981; Volume 5, pp. 415–471. [Google Scholar]
  66. Strickland, M.S.; Rousk, J. Considering fungal:bacterial dominance in soils—Methods, controls, and ecosystem implications. Soil Biol. Biochem. 2010, 42, 1385–1395. [Google Scholar] [CrossRef]
  67. Kallenbach, C.; Grandy, A.S. Controls over soil microbial biomass responses to carbon amendments in agricultural systems: A meta-analysis. Agric. Ecosyst. Environ. 2011, 144, 241–252. [Google Scholar] [CrossRef]
  68. Smith, L.C.; Orgiazzi, A.; Eisenhauer, N.; Cesarz, S.; Lochner, A.; Jones, A.; Bastida, F.; Patoine, G.; Reitz, T.; Buscot, F.; et al. Large-scale drivers of relationships between soil microbial properties and organic carbon across Europe. Glob. Ecol. Biogeogr. 2021, 30, 2070–2083. [Google Scholar] [CrossRef]
  69. Li, X.; Qu, Z.; Zhang, Y.; Ge, Y.; Sun, H. Soil fungal community and potential function in different forest ecosystems. Diversity 2022, 14, 520. [Google Scholar] [CrossRef]
  70. Bauhus, J.; Khanna, P.K. The significance of microbial biomass in forest soils. In Going Underground—Ecological Studies in Forest Soils; Rastin, N., Bauhus, J., Eds.; Research Signpost: Trivandrum, India, 1999; pp. 77–110. [Google Scholar]
  71. Högberg, M.N.; Högberg, P.; Myrold, D.D. Is microbial community composition in boreal forest soils determined by pH, C-to-N ratio, the trees, or all three? Oecologia 2007, 150, 590–601. [Google Scholar] [CrossRef] [PubMed]
  72. Pietikäinen, J.; Pettersson, M.; Bååth, E. Comparison of temperature effects on soil respiration and bacterial and fungal growth rates. FEMS Microbiol. Ecol. 2005, 52, 49–58. [Google Scholar] [CrossRef]
  73. Dinesh, R.; Chaudhuri, S.G.; Ganeshamurthy, A.N.; Dey, C. Changes in soil microbial indices and their relationships following deforestation and cultivation in wet tropical forests. Appl. Soil Ecol. 2003, 24, 17–26. [Google Scholar] [CrossRef]
  74. Kooch, Y.; Tavakoli, M.; Akbarinia, M. Microbial/biochemical indicators showing perceptible deterioration in the topsoil due to deforestation. Ecol. Indic. 2018, 91, 84–91. [Google Scholar] [CrossRef]
  75. Nunes, J.S.; Araujo, A.S.F.; Nunes, L.A.P.L.; Lima, L.M.; Carneiro, R.F.V.; Salviano, A.A.C.; Tsai, S.M. Impact of land degradation on soil microbial biomass and activity in northeast Brazil. Pedosphere 2012, 22, 88–95. [Google Scholar] [CrossRef]
Figure 1. Kirazlıköprü Dam and sampling points in forest and deforested sites.
Forests 15 01468 g001
Figure 2. Images of grooves (A) and gullies (B) in the deforested site.
Forests 15 01468 g002
Figure 3. Mean total N (A) and mean microbial biomass N (B) values in SF and SDE soils. The letters in parentheses represent a difference (p < 0.05) between fields.
Forests 15 01468 g003
Figure 4. Mean Nmic/Ntotal (%) values in SF and SDE soils. The letters in parentheses represent no difference (p > 0.05) between fields.
Forests 15 01468 g004
Figure 5. Mean Cmic/Nmic values in SF and SDE soils. The letters in parentheses represent the difference (p < 0.05) between fields.
Forests 15 01468 g005
Table 1. Mean values of some physical and chemical soil characteristics of SF and SDE soils [31]. Different letters in the row represent a difference between the means (p < 0.05).
Soil CharacteristicsSFSDE
Sand (%)33.6 a46.9 b
Silt (%)18.1 a14.5 a
Clay (%)48.3 a38.6 a
Soil textureClaySandy clay
Bulk density (g cm−3)1.16 a1.53 b
Pore space (%)51.83 a41.69 b
Soil temperature in sites (°C)18.77 a21.90 b
Soil moisture content (%)21.74 a 13.10 b
>2 mm/<2 mm (%)22.48 a40.16 b
pH (H2O)5.31 a7.72 b
Electrical conductivity (μS cm−1)39.45 a61.80 b
Soil organic C (g kg−1)22.53 a4.41 b
Table 2. Correlation analysis between some physicochemical characteristics and total and microbial nitrogen in SDE and SF soils.
Soil CharacteristicsPerson Correlation and Significance LevelNmicNtotalCmic/NmicOCSTSMpHECBDCNmic/Ntotal
NmicPearson correlation10.675 **0.562 *0.715 **−0.3410.688 **−0.796 **−0.350−0.699 **0.2810.641 *
Sig. (2-tailed) 0.0060.0290.0030.2140.0050.0000.2010.0040.3110.010
NtotalPearson correlation 10.611 *0.913 **−0.3970.821 **−0.677 **−0.403−0.800 **0.224−0.053
Sig. (2-tailed) 0.0150.0000.1430.0000.0060.1370.0000.4220.851
Cmic/NmicPearson correlation 10.702 **−0.0610.576 *−0.749 **−0.477−0.673 **0.4980.197
Sig. (2-tailed) 0.0040.8290.0250.0010.0720.0060.0590.481
OCPearson correlation 1−0.2280.775 **−0.733 **−0.365−0.857 **0.1500.034
Sig. (2-tailed) 0.4140.0010.0020.1800.0000.5940.905
STPearson correlation 1−0.4470.4880.580 *0.359−0.292−0.018
Sig. (2-tailed) 0.0950.0650.0240.1890.2920.950
SMPearson correlation 1−0.752 **−0.540 *−0.742 **0.2220.062
Sig. (2-tailed) 0.0010.0380.0020.4270.828
pHPearson correlation 10.726 **0.855 **-0.559 *−0.326
Sig. (2-tailed) 0.0020.0000.0300.236
ECPearson correlation 10.525 *-0.751 **−0.018
Sig. (2-tailed) 0.0440.0010.950
BDPearson correlation 1-0.327−0.014
Sig. (2-tailed) 0.2350.960
CPearson correlation 10.249
Sig. (2-tailed) 0.370
Nmic/NtotalPearson correlation 1
Sig. (2-tailed)
Nmic → microbial biomass nitrogen (μg g−1), Ntotal → total nitrogen (g kg−1), Cmic/Nmic → microbial biomass carbon–microbial biomass nitrogen ratio, OC → soil organic carbon (%), ST → soil temperature (°C), SM → soil moisture (%), pH → soil pH (H2O), EC → electrical conductivity (μS cm−1), BD → bulk density (g cm−3), C → clay fraction (%), Nmic/Ntotal → microbial biomass nitrogen–total nitrogen percentage. ** Correlation is significant at the 0.01 level (2-tailed). * Correlation is significant at the 0.05 level (2-tailed).
Disclaimer/Publisher’s Note: The statements, opinions and data contained in all publications are solely those of the individual author(s) and contributor(s) and not of MDPI and/or the editor(s). MDPI and/or the editor(s) disclaim responsibility for any injury to people or property resulting from any ideas, methods, instructions or products referred to in the content.

