Abstract
This study evaluated vegetation management (VM) strategies under electricity distribution lines (EDLs) through ecosystem service (ES) criteria. Deforestation, worsened by insufficient VM practices, poses a threat to ecosystem stability. Using a hybrid FAHP (Fuzzy Analytic Hierarchy Process) and TOPSIS (Technique for Order Preference by Similarity to Ideal Solution) approach, ten VM strategies were assessed based on 15 ES criteria. The FAHP results identified biodiversity, timber resources, and erosion control as the most crucial criteria due to their significant weights. The TOPSIS analysis determined that VM6 (creation and restoration of scrub edges) was the most effective strategy, achieving a value of 0.744 for reducing deforestation and enhancing energy security. VM6 helps preserve forest cover and protect infrastructure by creating a “V”-shaped structures within the EDLs corridor. This study underscores the importance of ES-oriented VM strategies for sustainable vegetation management and deforestation mitigation. It also highlights the need for incorporating scientific, ES-based decision support mechanisms into VM strategy development. Future research should expand stakeholder perspectives and conduct a comprehensive assessment of ESs to ensure that VM strategies align with ecological and socio-economic sustainability. This study provides a framework for improving VM practices and offers directions for future sustainable energy management research. This study focuses exclusively on ecological criteria for evaluating VM strategies, neglecting other dimensions. Future research should use methods like ANP and fuzzy cognitive maps to explore inter-dimension relationships and their strengths. Additionally, employing SWARA, PIPRECIA, ELECTRE, and PROMETHEE for ranking VM strategies is recommended.
1. Introduction
Energy distribution lines (EDLs) are the backbone of modern energy infrastructure, ensuring reliable and continuous transmission of electrical energy. However, the installation and maintenance of these lines can lead to various environmental problems, especially in natural forest ecosystems. The opening of wide corridors in areas crossed by EDLs can lead to a disturbance of vegetation balance and, thus, deforestation. Deforestation not only leads to the loss of natural habitats, but also has serious environmental impacts such as reduced biodiversity, soil erosion, reduced carbon storage capacity, and microclimatic changes [1]. Such practices have direct and indirect impacts on the quality and quantity of ecosystem services provided by trees [2,3]. In this context, proper management of vegetation under EDLs is critical to minimize environmental impacts and maintain sustainable ecosystem services [4].
Forests have a critical role, recognized as the building blocks of ecosystems. Forests of trees and shrubs provide a variety of important services. They absorb carbon dioxide from the atmosphere and contribute to oxygen production, prevent soil erosion, reduce noise pollution, and increase property values [5]. It is also important to recognize that they improve our quality of life through their aesthetic contribution [6]. There are potential risks, however, for vegetation under and near in-forest EDLs. Plants in direct contact with these lines or electric arcs on EDLs can result in forest fires and other serious damage, which can accelerate deforestation [7]. Therefore, careful planning of the management of vegetation under EDLs is crucial to prevent deforestation and minimize environmental and socio-economic risks [8].
Deforestation is a widespread and complex problem at a global scale, and these processes are triggered by a range of factors such as fires, storms, logging, forest pests, and land use changes. These factors have profound impacts on biodiversity, ecosystem services, land productivity, and climate regulation. Recognizing the seriousness of these problems, vegetation management (VM) strategies based on ecosystem service principles can be developed under EDLs to restore degraded landscapes. In this context, this study, alternative VM strategies under EDLs were subjected to a comprehensive assessment in terms of deforestation risk through a framework from an ES perspective.
Ecosystem services (ESs) are defined as the functions of ecosystems that provide various goods and services to humans [6]. The Millennium Ecosystem Assessment (MEA) principles have put ecosystem service criteria on the global policy agenda. Today, ESs are at the centre of conservation planning and environmental impact assessments [9,10]. Furthermore, the contribution of ESs to sustainable development is increasingly being recognized and accepted [11]. In this regard, ES is being integrated into global policy strategies [12,13], and there is a broad consensus that the capacity of ecosystems to produce ESs is largely linked to biodiversity [14,15]. These services are realized through ecological processes and interactions of biotic and abiotic components of ecosystems. For example, trees, groves, and forests provide supporting services such as nutrient cycling, soil formation, and primary biomass production. On the other hand, EDLs fragment natural habitats, affecting biodiversity and triggering deforestation. Therefore, it is critical to consider ES criteria during VM planning and management. In this perspective, VM strategies under EDLs in line with ES criteria are analysed in detail in this study.
Different VM activities under EDLs can affect the deforestation process in various ways. Therefore, preventing deforestation should be defined as an important objective in the planning and management of vegetation under EDLs. In the planning process, it is important to plan and design the trees and shrubs in the vegetation under EDLs in such a way that they do not cause interruptions and fires, while the EDLs within the forest are expected to integrate with the surrounding vegetation. Since the vegetation under EDLs provides vital habitats for plant and animal species, operational activities carried out in these areas disrupt vegetation and negatively affect the conservation of biodiversity. Therefore, it is critical to maintain and improve ecosystem services during EDL planning and management [16,17,18].
Vegetation under EDLs plays a critical role in supporting many ESs, including habitat for pollinating insects, root systems for plants that prevent soil erosion, woody materials that store carbon, and structures that influence landscape aesthetics, etc. EDLs are important elements for landscape aesthetics. EDLs with negative aesthetics can even affect real estate prices in the area [19,20,21]. A well-planned vegetation can contribute to reduce the negative landscape impacts of EDLs. On the other hand, EDLs with a well-planned VM can contribute to the preservation of natural vegetation and even fruit trees [16,22,23]. Therefore, by developing VM strategies for each EDLs, VM plans that prevent deforestation, contribute to ES sustainability, and support biodiversity conservation can be prepared.
For an ideal VM planning under EDLs, VM strategies that represent biodiversity and deforestation impacts can be applied in the field. For this purpose, applications and experiments can be carried out in the field. However, in field studies, there are many variables and criteria that need to be included in the calculations. This would make the research complex, time-consuming, laborious, and costly. The interrelationships between EDLs, deforestation, biodiversity, and ESs are increasingly becoming the subject of research, and various studies have been conducted on the mutually constraining or supportive capacity of these elements. In fact, VM activities under and around EDLs are closely related to deforestation and biodiversity. Irregularly planned and increasing numbers of in-forest EDLs are increasing deforestation, and there are growing concerns about biodiversity loss. Therefore, a comprehensive policy framework for vegetation management under EDLs needs to be shaped, and effective VM strategies need to be developed, taking into account current research on ES criteria. This framework should include a model for developing and monitoring effective VM strategies. In addition, the applicability of the model should be demonstrated with a case study [24].
Addressing the problem of developing VM strategies with a more accessible approach will often save the manager time. One such approach is to consult decision-makers (DMs). Many researchers have consulted DMs to identify vegetation strategies under EDLs [16,25,26]. These include different pruning techniques, selective cutting, preservation of structural elements, and strategies that can reduce the negative impacts of power line networks [25,26]. The developed strategies are asked to the experts, and with the feedback received, the decision set that will be effective in planning is obtained. Thus, it will be possible to obtain information that will provide a solution to the VM problem in a practical way. To overcome this challenge, many multi-criteria decision-making (MCDM) techniques can be used in combination. For example, the analytical hierarchy process (AHP) and the technique of ranking preferences by similarity to the ideal solution (TOPSIS) are effective methods for evaluating alternative strategies.
In order to define VM strategies under EDL in-depth with ES criteria, multidisciplinary approaches need to be adopted. In this way, it is possible to take into account a wide range of data. In this context, experimental studies [27,28,29] and modelling techniques [30] can be used. Although there are studies in the literature that examine the vegetation of power transmission lines [31,32], a comprehensive framework for evaluating VM strategies under EDLs according to ES criteria has not been established. Addressing this gap requires the development of integrated methods for a holistic and comprehensive understanding of the dynamics between ES criteria and VM strategies.
In practice, there are still significant gaps in the use of indicators identified for many of the ES criteria. The objective of this study was to test a hybrid framework for evaluating the effectiveness of different VM strategies in preventing deforestation in areas under EDLs in line with ES criteria. The study used a combination of MCDM techniques to rank different VM strategies according to ES criteria. In the study, the FAHP (Fuzzy Analytic Hierarchy Process) and TOPSIS (Similarity to Ideal Solution with Preference Ranking Techniques) methods were used together to analyse the effectiveness of different management strategies. Hybrid methods have provided very good estimates in many studies [33]. The framework combining these methods offers an innovative approach to evaluate effective VM strategies and identify the best one. FAHP realizes decision-makers’ uncertainty and subjective evaluation of ES criteria, while TOPSIS is used to compare alternative strategies [34,35]. It has been stated that this qualitative evaluation approach can overcome the shortcomings of the scientific literature and/or the difficulty of conducting field studies and experiments.
In this study, ten decision-makers (DMs) evaluated the impact of ten different VM strategies on deforestation prevention in a sample EDLs in northwestern Turkey. DMs may have different views on which of the ES criteria is more important than another. The developed framework uses a weighting approach to reflect DMs’ relative preferences. Urbanization and industrialization are also spreading into forested areas with infrastructural facilities such as roads and power lines. For example, transmission lines or power lines span more than 55.000 km in Turkey and are increasing by about 3% per year [36,37,38]. Therefore, understanding the impacts of EDLs on deforestation is important for the development of sustainable VM strategies to counteract the impacts.
Consequently, the findings of this study will contribute to the development of VM strategies under EDLs in line with ES criteria and to preventing deforestation. The structure of the paper is as follows: Section 2 describes the theoretical framework and methodology. Section 3 presents the case study and data collection processes. Section 4 contains the results of the evaluations using the FAHP and TOPSIS methods. Section 5 presents the discussion of the results, and Section 6 provides recommendations and future research directions.
2. Literature Review
Vegetation management under power distribution lines is a critical issue for both energy security and environmental sustainability. The literature in this area focuses on the impacts of vegetation on energy infrastructure, as well as the ecosystem services, biodiversity, and socio-economic impacts of the strategies used to manage this vegetation [39].
Many studies have examined the impacts of vegetation management on ecosystem services and biodiversity in EDL corridors [19,40,41,42], but in general, there is no consistent answer as to which management strategy is best for ecosystem services and biodiversity, as this can be taxon-specific. In some cases, vegetation disturbances in EDL corridors can lead to an increase in invasive vegetation [43]; in other cases, native plants such as tall grasses can thrive [44]. Deforestation and habitat fragmentation under EDLs is, therefore, one of the common impacts of energy infrastructures. The construction and maintenance of EDLs often requires vegetation clearing, leading to habitat loss. Studies have examined in detail the impacts of VM strategies under EDLs on biodiversity and found that some VM strategies can increase biodiversity, while others can weaken ecosystems [45].
The impacts of VM strategies on ecosystem services is an important evaluation criterion in environmental management. Studies have also analysed the impacts of different VM strategies implemented under EDLs on various ESs such as carbon storage, water quality protection, erosion control, and aesthetic values. The findings revealed that ES-based VM strategies are effective in ensuring the continuity of these services as well as minimizing environmental impacts [46,47].
The socio-economic impacts of VM strategies have also been widely discussed in the literature. Smith and Jones (2018) argue that ES-based VM strategies offer advantages in terms of social acceptance and economic sustainability as well as environmental benefits [46]. Local community support for such strategies is emphasized as a critical factor for the success of VM practices. In this context, FAHP-TOPSIS hybrid methods can play an important role in assessing and integrating such socio-economic factors into management processes [48].
VM under EDLs is critical for energy security, environmental sustainability, and biodiversity conservation. This vegetation has received considerable attention in recent years, with the need to develop strategies to mitigate the impacts of energy infrastructures on deforestation, habitat fragmentation, and ESs [39]. MCDM methods provide powerful tools for evaluating and optimizing VM strategies in complex and multidimensional decision processes. In this context, methods such as FAHP and TOPSIS stand out for their capacity to handle environmental uncertainties and subjectivity [35,49].
FAHP is a version of the traditional AHP method adapted to decision-making situations involving uncertainty and fuzziness. The main advantage of FAHP is that it can process the uncertain and subjective evaluations of DMs within the framework of fuzzy logic [50]. While AHP provides a process in which criteria are evaluated in a hierarchical structure and alternatives are compared by determining their weights, FAHP makes this process more flexible [34]. This flexibility enables DMs to cope with uncertain data, especially in environmental decision-making processes [51].
When we look at its applications in the field of environmental management, it is seen that FAHP is used in a wide range of areas from sustainable supply chain management [51] to water resources management [52]. For example, Büyüközkan and Çifçi (2012) showed how environmental factors can be effectively assessed using FAHP in sustainable supply chain management [51]. This demonstrates the advantages of FAHP in situations such as VM where environmental decisions are fraught with uncertainty. FAHP has been widely used in the literature in various fields such as ecosystem service conservation, natural resource management, and environmental sustainability [53].
TOPSIS is a method used to select the most appropriate one among the alternatives in the decision-making process. This method is based on the principle of selecting the alternative that is closest to an ideal solution point and farthest from a negative solution point [35]. The main advantage of TOPSIS is that it allows for DMs to find the best solution quickly and efficiently by considering different criteria [54]. Effectively used in various environmental management applications, TOPSIS is an important tool for evaluating and comparing complex criteria [55].
A study by Xu and Zhang (2013) used the TOPSIS method to evaluate different land use plans and succeeded in identifying the most appropriate strategy for ES conservation [53]. Similarly, Şengül et al. (2015) examined the use of the TOPSIS method in sustainable energy planning and emphasized its effectiveness in minimizing the environmental impacts of energy policies [55]. TOPSIS stands out with its objective evaluation capacity in optimizing multidimensional environmental decisions such as vegetation management.
The hybrid use of the FAHP and TOPSIS methods offers significant advantages in solving complex problems such as VM. While FAHP enables the weighting of criteria under uncertainty, TOPSIS helps to select the most appropriate strategy according to these criteria [53]. The combination of these two methods enables a more comprehensive and balanced evaluation in MCDM processes.
In a study by Kuo and Chen (2008), it was shown that the combined use of the FAHP and TOPSIS methods in sustainable supply chain management leads to more balanced and sustainable decisions by taking into account different environmental and economic factors [53]. This approach can be similarly applied in the process of optimizing ES-based VM strategies and can contribute to achieving more sustainable results [56].
VM under EDLs is a multidimensional issue that needs to be considered from various perspectives such as biodiversity, ESs, and socio-economic factors. In the literature, studies emphasizing the importance of this issue in terms of energy security and environmental sustainability reveal the advantages and disadvantages of different VM strategies. MCDM approaches, such as the FAHP-TOPSIS hybrid method, stand out as powerful tools in the process of evaluating and optimizing VM strategies. In the future, further empirical studies in this area and the development of innovative management strategies will be of great importance for both the sustainability of energy infrastructure and the protection of natural ecosystems.
In summary, developing and prioritizing VM strategies under EDLs to prevent deforestation is critical for energy security and environmental sustainability. Energy infrastructure often leads to habitat loss and deforestation [45]. In this context, VM strategies can have an impact on ES (carbon storage, water quality protection, etc.) and socio-economic factors [46]. The FAHP and TOPSIS methods are important tools for evaluating and optimizing VM strategies, managing uncertainties, and identifying optimal solutions [35,49]. More work needs to be done in this area in the future.
3. Methodology
When working with MCDM methods, it is essential to start by clearly defining the problem to be addressed. After that, a hierarchical structure of the problem is established. This structure includes the alternatives, scenarios, or constraints of the problem to be evaluated or prioritized, as well as the criteria for evaluation or prioritization. In this study, the problem was analysed within the framework of VM strategies using the ESFAT (Ecosystem Server FAHP-TOPSIS) hybrid model according to ES criteria.
The ESFAT hybrid framework was selected as a comprehensive tool for assessing and quantifying deforestation under EDLs and its interacting environment. The FAHP and TOPSIS methods were chosen to implement the proposed ESFAT hybrid framework due to their ease of understanding, computational simplicity, and wide availability in various software. This enhances the framework’s applicability. The development process of the ESFAT Hybrid framework consists of three main steps:
- -
- The framework evaluates VM strategies under EDLs in line with ES criteria, using the opinions of DMs who are experts in their field.
- -
- The weights of the ES criteria considered in assessing deforestation are calculated using FAHP. Then, the ranking of alternative VM strategies, calculated with ES criteria weights, is determined by TOPSIS.
- -
- The developed ESFAT Hybrid framework is tested on case studies, and the results are interpreted.
3.1. Research Process
The aim of this research was to apply a hybrid model to assess the effectiveness of various vegetation management strategies to prevent deforestation in vegetation under EDLs in the context of ecosystem service criteria. It is recommended to work with at least DMs in group studies such as the ESFAT framework [57]. In this study, local people with limited knowledge on the subject were not selected as DMs, as the method based on expert opinions was preferred. In sensitivity analyses, only expert opinions were used to ensure a high accuracy. Within the ESFAT framework, 10 DMs were consulted for the analyses. To ensure that the research results are reliable, the DMs selected should have professional knowledge in their field, have conducted long-term academic research or have more than 5 years of practical experience.
Studies published in relevant academic journals were collected to identify criteria and strategies. These studies cover topics such as ES criteria, EDLs, vegetation management, VM strategies, and deforestation. The collected data were presented to DMs at a meeting held in Bartın in the fall of 2023. During the meeting, various comments were made on which criteria to use or exclude. An effective brainstorming technique such as the 6-3-5 method was applied in the meeting [58,59]. Approximately twenty ES criteria and fifteen VM strategies were identified by this method. However, it was concluded that the number of criteria and strategies should be limited to ensure the validity of the analysis within the ESFAT framework. For this reason, the criteria and strategies were re-evaluated by the DMs in the final stage, and it was found appropriate to conduct the study with 15 ES criteria and 10 VM strategies in line with the opinions of the decision-makers.
In the first stage of the evaluation, the fuzzy weighting of the ES criteria was carried out by FAHP, and in the second stage, the ranking of VM strategies was carried out by TOPSIS. The best VM strategy to prevent deforestation was determined according to PIS (Positive Ideal Solution) and NIS (Negative Ideal Solution) values.
The hierarchical structure of the ESFAT hybrid framework is given in Figure 1.
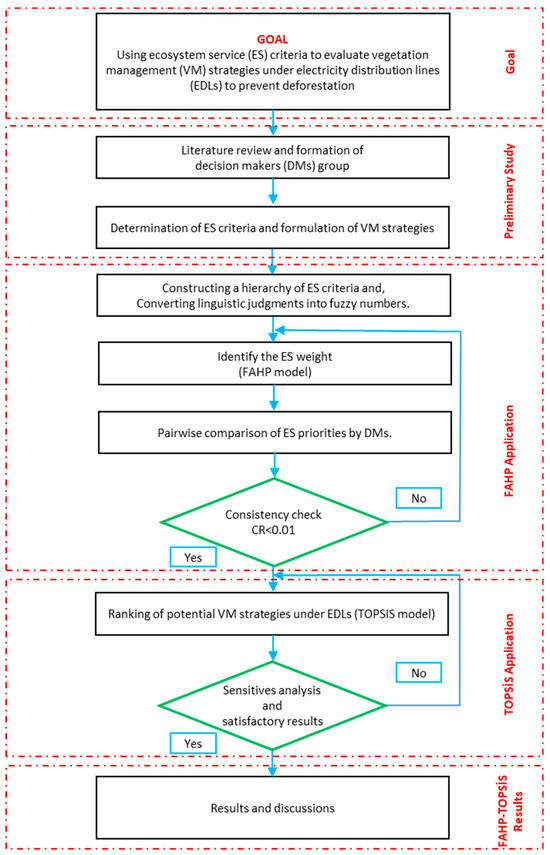
Figure 1.
Hierarchical structure of ESFAT framework.
3.2. A Hybrid FAHP-TOPSİS Method Integrated into ESFAT Framework
3.2.1. Fuzzy Sets and Fuzzy Number
The fuzzy set, introduced by Zadeh (1965), was designed to depict the uncertainty and complexity inherent in subjective statements [50]. This set facilitates the operation of a mathematical system within a fuzzy environment. A fuzzy set can be described as a class of criteria with continuous membership values, characterized by an initial function. This initial function, which ranges between 0 and 1, defines the initial level for each ES criterion in the ESFAT Hybrid approach [60,61].
Fuzzy set theory was developed to address uncertain problems and is used to identify key criteria and alternative performance [50]. A triangular fuzzy number (TFN) is defined as a triplet (a, b, c), representing the lower, middle, and upper values, respectively, as illustrated in Equation (1) and Figure 2.
where membership function
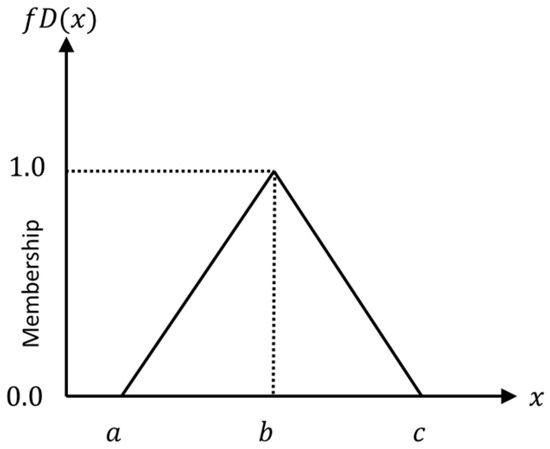
Figure 2.
Triangular fuzzy number.
3.2.2. Linguistic Values
Linguistic variable intervals were proposed by [60,61]. The criteria and alternatives were evaluated using fuzzy numbers on a scale from 1 to 9. Specifically, the membership function of the linguistic scale for criteria and alternatives, as shown in Table 1 and Table 2, represents the nine-point scale used in the TOPSIS method [62].

Table 1.
Linguistic scales for rating criteria in FAHP [60].
Table 2.
Linguistic scales of alternative’s rating for TOPSIS model [62].
Equation (2) calculates the distance between the two triangular fuzzy numbers and.
3.2.3. Fuzzy Analytic Hierarchy Process (FAHP)
The Analytic Hierarchy Process (AHP) is an MCDM technique developed by Prof. Thomas L. Saaty in the 1970s. This method establishes priorities at each hierarchical level by using a pairwise comparison matrix with a scale ranging from 1 to 9 designed by Saaty. In fuzzy AHP, the process of calculating criteria weights involves an eight-step procedure: defining the problem and criteria, constructing the fuzzy pairwise comparison matrix, normalizing the matrix, calculating the fuzzy synthetic extent vector, determining the fuzzy weights, checking the consistency of the matrix, adjusting the weights if necessary, and deriving the final weights and aggregating the results [34].
Step 1: Construct Pairwise Comparison Matrices of Criteria
There are K experts (decision-makers) who identify the key dimensions by creating pairwise comparison matrices among all the criteria within the hierarchical structure, as shown in Equation (3) matrix ().
where represents the fuzzy comparison value assigned by the th decision-maker when comparing the th criterion to the th criterion.
Step 2: Calculate Fuzzy Geometric Mean and Fuzzy Criteria Weights
The process of determining the fuzzy geometric mean and the fuzzy weights of each criterion using the geometric technique is illustrated in Equations (4) and (5).
where represents the integrated fuzzy comparison value across all thdecision-makers for the comparison between the th and th criteria. Here, denotes the fuzzy geometric mean of the th criterion, and indicates the fuzzy weight of theth criterion.
Step 3: Calculate the BNP Value for Rating Weight
Calculating the best non-fuzzy performance (BNP) value [63] to analyse the rating weight of the criteria is shown in Equation (6):
In this context, represent the upper, middle, and lower values, respectively, of the fuzzy weight for the th criterion.
3.2.4. Technique for Order Preference by Similarity to an Ideal Solution (TOPSIS)
Step 1: Constructing the Decision Matrix
Assuming that there are m alternatives and evaluation criteria, the decision matrix s formed. Equation (7) represents this matrix, where each element in the matrix corresponds to the performance of the th alternative with respect to the th criterion.
Step 2: Normalization
In this step, the elements of the decision matrix are normalized to form the normalized decision matrix . Each element in the normalized decision matrix represents the normalized value of the performance of the th alternative with respect to the th criterion. The formula for calculating and the resulting normalized decision matrix are presented in Equations (8) and (9), respectively.
Step 3: Constructing the Weighted Normalized Decision Matrix
In this step, the weighted normalized decision matrix is constructed. The matrix is obtained by multiplying each element of the normalized decision matrix by the corresponding weight of the th criterion. The weighted normalized decision matrix is represented as follows in Equation (10):
where represents the weights of the decision criteria, and the weights satisfy
Step 4: Calculating the positive ideal solution () and the negative ideal solution ()
The calculations are provided in Equations (11) and (12).
where represents the benefit criteria, where higher index values indicate better performance scores, and represents the cost criteria, where lower index values correspond to better performance scores.
Step 5: Calculating the Distance Between Each Alternative and the Positive and Negative Ideal Solutions
In this step, the distances from each alternative to the positive ideal solution () and the negative ideal solution () are calculated. These distances assess how closely each alternative aligns with the ideal solutions. Equations (13) and (14) provide the formulas for determining these distances:
Step 6: Calculating the Relative Closeness of Each Alternative to the Ideal Solution
In this step, the relative closeness () of each alternative to the ideal solution is computed. This measure combines the distances to both the positive ideal solution () and the negative ideal solution () to assess how well each alternative performs relative to the ideal benchmarks. The relative closeness of each alternative is calculated using Equation (15), which is defined as follows:
where ; when the value of is closer to 1, it means that the solution is closer to the ideal solution.
Step 7: Ranking of Alternatives’ Preference
In this step, alternatives are ranked based on their relative closeness to the ideal solutions. The optimal alternative is one that is closer to the positive ideal solution PIS () and farther from the negative ideal solution NIS (). Therefore, alternatives are ranked in descending order of their values, with those closer to 1 being preferred.
4. Application of Methodology and Result Assessment
Evaluating and selecting VM strategies under EDLs is critical in preventing deforestation. To validate the model, the VM strategies under EDL vegetation within forests in Bartın, Karabük, and Zonguldak provinces of Enerjisa A.Ş., a distribution company in north-western Turkey, were evaluated. Enerjisa serves 21.6 million users in 14 provinces in an area of 110,000 km2, which constitutes approximately 26% of Turkey, and operates in three regions: AYEDAŞ on the Anatolian side of Istanbul, Başkent EDAŞ in the north of Turkey, and Toroslar EDAŞ in the south (Figure 3) [64].
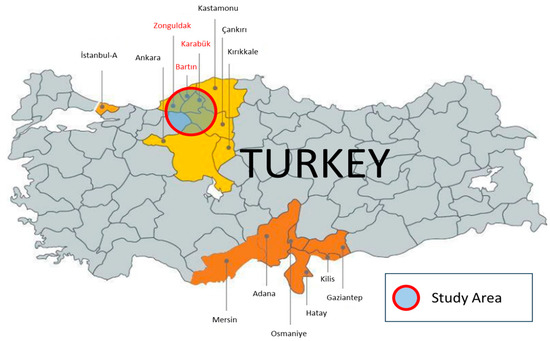
Figure 3.
Case study area.
The selection of DMs for this study was based on their specialized knowledge in ES and related fields, including forest economics, landscape ecology, biogeochemistry, ecological economics, vegetation dynamics, and biodiversity evolution (Table 3). Criteria for inclusion included holding a PhD and actively conducting research in these areas, as well as having published peer-reviewed studies on ES-EDLs interactions in forests in the rural regions of the Western Black Sea.
Table 3.
DMs identification.
In the research, the selection of DMs was based on their expertise and experience. Seven DMs were experts in forest economy, landscape ecology, biogeochemistry, ecological economics, vegetation dynamics, and biodiversity evolution. The remaining three DMs had been employed by EDLs in the region for at least five years (Table 3).
Based on interviews with DMs in November 2023, 15 ES criteria were identified that influence VM strategies in the study area. Those ES were based on the literature review on ESs provided by trees, woodlands, and forests [65,66,67,68,69,70,71,72,73,74,75,76,77,78,79,80,81,82,83,84,85,86]. In the same interviews, 10 potential VM strategies were also identified. In the proposed model, five of the VM strategies represent the current VM management situation (Conventional), and the other five represent the new VM management situation. On the other hand, the ES weights used in the proposed model and the ranking of VM strategies were evaluated by 10 DMs (Table 4 and Table 5).
Table 4.
ES categories, criteria and definitions.
Table 5.
VM groups, strategies, and description.
After the ES criteria and potential VM strategies were defined, a fuzzy evaluation matrix was created within the ESFAT framework. Then, 10 DMs compared 15 ES criteria with FAHP in a fuzzy structure.
4.1. Application of FAHP for Weight of ES Criteria
The average weights of the ES criteria evaluated by the 10 DMs as a result of FAHP calculations are given in Table 6. In this way, pairwise comparison matrices and the weight vector of each matrix were determined. The FAHP procedure was performed using the equations given in Section 3.2.2.
Table 6.
ES criteria weights found as a result of FAHP calculations.
The last two rows of Table 6 and Figure 4 provide information on the cardinal values (weights) of the criteria. The DMs ranked the ES32-Biodiversity criterion as the most important for preventing deforestation with a weight value of 0.0940. It is followed by the ES12-Timber Resources criterion with 0.0807 and the ES24-Erosion Control criterion with 0.0787. The last three criteria, which are also seen as the least important for preventing deforestation, are ES26-Pollination with a weight value of 0.0516, ES43-Educational with 0.0503, and ES13-Water Provision with 0.0455 (Figure 4).
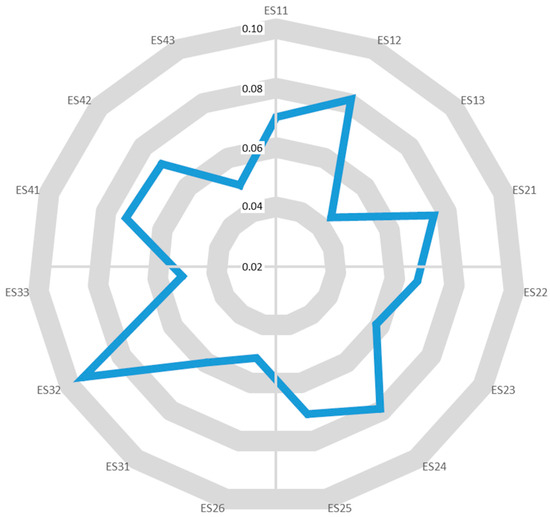
Figure 4.
Radar representation of ES criteria weights calculated using FAHP.
4.2. Application of TOPSIS for Ranking of VM Strategies
Choosing the most appropriate VM strategy to prevent deforestation is a challenging decision for many DMs. Likewise, each ES criterion has a significant impact on VM strategies. This is because ES criteria weights are an important clue in the evaluation of VM strategies. The DMs evaluated 10 VM strategies in accordance with the TOPSIS technique (Table 7).
Table 7.
TOPSIS performance matrix.
In TOPSIS, based on the DMs’ responses ranging from “1—Poor (P)” to “9—Good (G)”, a decision matrix was created as shown in Table 7. The normalized matrix is presented in Table 8. Then, the weighted normalized decision matrix was obtained (Table 9). In this study, all ES criteria were considered as beneficial, and both positive and negative ideal solutions were calculated (Table 10). Furthermore, the proximity coefficient was calculated, and VM strategies were ranked according to these values (Table 11). The entire TOPSIS procedure was performed using the equations detailed in Section 3.2.3.
Table 8.
The normalized weight matrix.
Table 9.
The Normalized weight matrix× AHP weight.
Table 10.
Positive and negative ideal solutions.
Table 11.
Closeness coefficient values and final ranking.
Table 11 shows the positive ideal solution and negative ideal solution of 10 VM Strategies calculated by transforming the matrix. For example, the VM1 strategy obtained the distance of the positive ideal solution (PIS), i.e., = 0.00637, and the distance of the negative ideal solution (NIS), i.e., = 0.01218; thus, the relative closeness of the VM1 strategy to the ideal solution C1 is calculated as below:
Table 11 shows the positive ideal solution (PIS) and negative ideal solution (NIS) values for 10 different VM strategies. The PIS represents the highest value a strategy can achieve given all factors, while the NIS is the lowest value. It can be seen that some strategies have higher PIS values than others, indicating that these strategies perform better in terms of the evaluated criteria. For example, VM Strategy 5 has the highest PIS value of 0.01462, while VM Strategy 2 has the lowest PIS value of 0.00694. On the other hand, some strategies have higher NIS values, indicating that these strategies underperform overall. For example, VM Strategy 6 has the highest NIS value of 0.01584, while VM Strategy 8 has the lowest PIS value of 0.00545.
It should be noted that the PIS and NIS values only provide a relative comparison between strategies according to the criteria analysed. Therefore, in order to draw meaningful conclusions about the performance of each strategy, these values should be evaluated in conjunction with other pieces of relevant information, such as the criteria used and the weights given to these criteria.
TOPSIS uses the method of relative proximity to the positive ideal solution to prioritize strategies. This method avoids the occurrence of options that are closest to the positive ideal solution, closest to the negative ideal solution, farthest from the positive ideal solution, and closest to the negative ideal solution. Table 11 also shows the performance ranking of the VM strategies. After calculating the weights with the TOPSIS approach, the table ranks the strategies according to their results. VM Strategy 6 (creation and restoration of shrub edges) is ranked first with the highest score, while VM Strategy 8 and VM Strategy 1 are ranked second and third respectively. In contrast, VM Strategy 5 has the lowest score and is ranked last.
4.3. Sensitivity Analysis
To evaluate the robustness of the proposed research framework and the resulting rankings, conducting a sensitivity analysis within MCDM is practical. Given that small changes in the relative weights of the criteria can significantly impact the results, various sensitivity studies are performed [87]. In these studies, some criteria weights are increased while others are decreased, as illustrated in Equation (16) below:
were fuzzification factors, represents the percentage change in the original weight , and the sum of all new weights.
In this study, the criteria weights were determined using the FAHP model with a linguistic scale. To assess robustness, a sensitivity test was performed by assigning adjusted weights to the criteria, thereby evaluating and selecting the most efficient performing institution. The evaluation dimensions and criterion weights of VM strategies were calculated based on the DMs’ opinions. Therefore, robustness analysis was conducted to test the impact of changes in the criteria weights on the final ranking of the VM strategies. This was intended to increase the reliability of the decision-making process.
According to the sensitivity analysis, small changes in the weights of the criteria (ES11–ES13, ES21–ES26, ES31–ES33, and ES41–ES43) have minimal effects on the final ranking of the strategies (VM1–VM10). The results of the sensitivity analyses revealed that VM6 has the highest priority, followed by VM8 and VM1, respectively. The observed ranking order is VM6 > VM8 > VM1, which is valid in seven of the nine sensitivity scenarios (α = 0.1–0.7). VM6 received the highest ranking in scenarios other than scenarios 8 and 9 (α = 0.8–0.9). However, only in scenarios 8 and 9 did we observe changes (increase or decrease) in the priorities of dimensions VM6, VM8, and VM1 and, consequently, changes in the weights of the criteria (Table 12).
Table 12.
Sensitive analysis.
The ranking remains consistent as long as there are no major changes in the weights of the top-three-ranked strategies. In this case, it can be said that the sensitivity analysis shows robustness in the ranking order of alternative strategies. VM6, VM8, and VM1 are ranked the highest in all scenarios and are selected as the best by the DMs. VM1 and VM8 always follow VM6 (Table 12). In conclusion, sensitivity analysis can be a meaningful tool for evaluating VM strategies.
5. Results and Discussion
5.1. Evaluation in Terms of Ecosystem Server (ES) Criteria
For a healthy vegetation structure in areas under EDLs, edge closure should be well adjusted. The growth rate of species found in areas with low edge closure is more problematic than those found in areas with high edge closure. This situation may change in the future in favour of undesirable species that cause problems for the EDL system. Some undesirable pioneer species tend to control areas under EDL vegetations and colonize these sites as the dominant species, taking a significant role in reducing the number and diversity of other species [16,17]. Edge closure can lead to an unfavourable ecological change in loose EDL vegetation, increased disease, and negative effects on the control of noxious weeds and shrubs. Clearance significantly changes the soil structure due to machine passage, soil compaction, and destruction of large roots. This results in a decrease in soil fertility, soil runoff, changes in the soil biological community, and erosion [70]. The absence of trees and roots increases infiltration and reduces the filtering capacity of the soil, resulting in reduced flood control, erosion control, and water quality services. Nutrient leaching and erosion are higher after clearing compared to partial harvesting [18].
On the other hand, in-forest areas under EDL clearings are predicted to reduce aesthetic landscape and cultural services as they evoke a sense of destruction of nature. However, they can be valuable for recreational purposes, e.g., hiking and snowmobiling. There is no consensus on the impact of these services [88]. By increasing soil warming, openness conditions can increase the diversity and abundance of organisms in the soil, which, in turn, can promote nutrient cycling. However, this benefit can be out of balance if the soil dries out and there is not enough moisture. Although the clearing generates income from wood resources in the first year, the short harvesting cycle may not be enough to provide a sustainable income. There are conflicting views among experts on this issue. The machinery used during harvesting can affect the soil and soil structure, even if the role of roots to aid in water penetration is sustainable, a view not shared by all experts.
These findings provide an important guide when assessing the impacts of ESs on vegetation management strategies, providing a clue as to which VM strategy may be more effective in achieving biodiversity conservation and sustainability goals [6,88,89,90].
5.2. Evaluation in Terms of Vegetation Management (VM) Groups
The DMs prioritized strategies in the “New Application” over those in the “Conventional” in terms of preventing deforestation. In particular, strategies VM6 (creation and restoration of shrub edges) and VM8 (restoration of habitats of high biological value) were ranked higher than traditional group strategies such as VM1 (pruning). Overall, the relative importance of the new application strategies compared to the conventional strategies is approximately 58.40% to 41.60% (Table 11, second column).
The biggest difference in terms of preventing deforestation is the approach to vegetation management along the EDL route. The clear-cutting process produces a large change for light reaching the ground, which leads to significant changes in the composition of the vegetation. These changes can have both positive and negative effects on deforestation prevention. Clearing conditions favour species that need direct sunlight, especially fruit-bearing shrubs such as raspberries. These species are often pioneer species and thrive in open areas [91]. Open areas encourage herbaceous plants that produce more flowers than in closed forest areas, providing more food for pollinators [92]. Some experts argue that the sudden regrowth of vegetation after clearing has a positive effect. Young forests are known to act as carbon sinks due to their rapid growth [93].
5.3. Evaluation in Terms of Vegetation Management (VM) Strategies
The assessment of VM strategies under EDL allows us to understand the impacts of different strategies on deforestation and biodiversity. The data obtained showed that various ES criteria have different effects on VM strategies.
The DMs concluded that the most optimistic strategy to prevent deforestation is VM6 (creation and restoration of shrub edges) with a value of 0.744. The creation of “V”-type structures in the EDL vegetation can play an important role in reducing deforestation while ensuring the safety of power lines. The VM6 strategy aims to gradually establish boundaries by leaving green space in the centre of the corridor and planting shrubs and woody plants on the edges. By the systematic cutting of tall or fast-growing species (birch, ash, maple, poplar, etc.), areas naturally enriched with diverse and short plants can be encouraged. This process allows the shape of the power corridor to change from “U” to “V” within a few years. However, more research is needed on the long-term effects of these methods under EDL vegetation. Such interventions are considered an important strategy in efforts to prevent deforestation and conserve biodiversity [6,70].
The second strategy VM8 (restoration of habitats with high biological value) with a value of 0.742 reduces deforestation and increases biodiversity through the protection and restoration of habitats with high biological value. This method contributes to conservation objectives such as the Natura 2000 network and ensures the protection of rare and endemic species. Particularly, the restoration of sensitive ecosystems such as swamps, meadows, and poor grasslands under EDL is of great importance for preventing deforestation and maintaining biodiversity [6,88].
The VM1 (pruning) strategy, which ranked third with 0.657, largely preserves the natural state of habitats, reduces visual landscape and disturbance to users, and minimally interferes with ecosystem services. Pruning preserves the natural habitat by cutting only some branches of the trees, thus minimizing deforestation impacts [6,89].
The fourth most effective strategy was VM9 (creating medicinal aromatic plants or orchards), with 0.627. This strategy provides bio-economic products to local people while maximizing ecosystem services through flowers that provide nectar for insects, fruits for birds and mammals, and trees that provide high-quality wood. In particular, medicinal aromatic plants such as laurel (Lauris nobilis L.) and fruit trees such as apple (Malus sylvestris) and wild pear (Pyrus communis) support the prevention of deforestation by increasing biodiversity in these areas [6].
However, the DMs identified VM10 (creation of ponds) and VM5 (clear-cutting) as the least beneficial VM strategies in terms of preventing deforestation, ranking the lowest (9th and 10th) with rank values of 0.347 and 0.247, respectively. Although the VM10 strategy supports natural colonization processes, it makes a more limited contribution to preventing deforestation in terms of ES compared to other methods. In this strategy, ponds are allowed to be naturally populated with plants or fish, but the deforestation prevention effect is less than other methods. The VM5 strategy, on the other hand, provides some short-term economic returns, but has a negative impact on long-term deforestation prevention, particularly in terms of habitat loss and biodiversity reduction. The success of open area species means that species native to closed forest habitats are displaced, leading to a sharp decline in biodiversity [92,93,94]. Furthermore, negative impacts are also observed, such as a decrease in soil fertility and water quality due to the passage of machinery that changes the soil structure and the death of roots [70,71,95].
5.4. Study Limitations and Recommendations for Future Research
The results obtained do not necessarily imply a strong consensus among DMs. Some DMs emphasized that certain ES criteria are very difficult to provide VM at the scale of the EDLs and that it is difficult to prevent deforestation in this way. They expressed difficulty in assessing ES criteria such as water quality, biological control, flood control, and pollination services for a limited area such as EDL vegetation. It was noted that these services involve processes that take place at larger scales. Therefore, some DMs stated that not only ES criteria but also various other biotic and abiotic criteria (such as criteria that emphasize fire risk) should be included in the process of determining VM strategies under EDLs. In the context of ecosystem management, more research is needed to make the relationship between humans and nature a reliable decision-making tool [6,88,89,90,95]. Considering these limitations, the results of the study can be said to be one of the pioneering hybrid approaches to evaluate the effects of ES criteria under EDL vegetation management strategies as a predictor of their effectiveness in preventing deforestation.
The results of the study are consistent with the literature when general strategies are evaluated. In the study, according to DMs, New Application VM Groups strategies were more favourable than Conventional Groups strategies in providing ecosystem services and preventing deforestation. The findings of the study are in line with similar studies on the subject. Dupras et al. (2016), found that while there are some positive impacts on food provision, pollination, and, potentially, carbon sequestration and air cleanliness, negative impacts on biodiversity, soil health, water quality, and cultural services are notable. This study emphasizes the need for further research to understand the long-term dynamics of ecosystems in response to human intervention and to validate these expert opinions with empirical data [95].
In the study, only the opinions of experts in the field were considered while developing the strategy, and the opinions of local people were not included in the hybrid framework. Given the lack of technical expertise or experience of local people, it is not easy to include their views in efforts to identify VM strategies under EDLs. A more formal way to encourage local participation is to provide them with the opportunity to gain knowledge and skills through training workshops [96].
On the other hand, in this study, the findings related to the VM strategies of the energy distribution company operating in the Western Black Sea region, which includes the Zonguldak–Bartın–Karabük provinces in northern Turkey, were obtained. Since each country or region within it has different climatic conditions and, therefore, different vegetation types, the condition of regionalization should be taken into consideration in future research.
While obtaining the findings in the research, 15 ES criteria were taken into consideration depending on 10 DM preferences. Therefore, the empirical approach to calculations and inferences for VM strategies were developed based on limited data. In future research, the number of DMs should be revised.
In the ESFAT framework, only the 15 ES criteria of an ecological nature were considered. Other criteria and dimensions such as the economic, environmental, and technological were not considered in this study. Since the results of the study are based on EDLs in only one region, the general validity of the results may be limited. In the future, different methods such as DEMATEL-based ANP, fuzzy grey cognitive maps, and MCDM tools can be used to examine the relationships between dimensions and criteria and the strength of these relationships. Furthermore, the ELECTRE and PROMETHEE methods can also be considered for ranking VM strategies.
The FAHP-TOPSIS hybrid approach stands out as a suitable tool to overcome strategy selection or other multi-criteria decision-making challenges. However, this approach has some limitations and disadvantages. In this approach, decision-makers are asked to make an evaluation based only on the specified criteria. The DM should assess the relative importance of one criterion over another or favour one alternative over another. However, as the number of alternatives and criteria increases, the pairwise comparison process becomes more complex, and the risk of inconsistency arises. For example, there were 15 criteria under four ES factors in this study. As the number of criteria under ES factor increases, the prioritization process becomes difficult. Therefore, instead of only AHP or only TOPSIS, a hybrid fuzzy AHP-TOPSIS method was preferred in this study. Therefore, hybrid fuzzy approaches using more than one method together give results that are more consistent. In this context, it would be appropriate to use many fuzzy MCDM methods such as fuzzy AHP, fuzzy ANP, fuzzy TOPSIS, and fuzzy VIKOR together with many techniques such as SWARA, PIPRECIA, TOPSIS, and VIKOR in a hybrid framework [97,98,99].
6. Conclusions
Hybrid MCDM approaches, such as FAHP-TOPSIS, are highly effective for selecting VM strategies under EDLs. These methods support rational decision-making by allowing DMs to incorporate their expertise into the process. The ESFAT hybrid framework developed in this research enables DMs to evaluate VM strategies based on ES criteria, integrating their preferences into complex MCDM approaches. ESFAT’s hierarchical structure facilitates a thorough and an accurate decision-making process for prioritizing criteria and selecting strategies. The VM strategy evaluation results from the ESFAT framework are presented transparently to all stakeholders, ensuring data accessibility and auditability. This transparency and accessibility provide a strong foundation for informed, strategic, and effective VM practices under EDLs. Overall, ESFAT proves to be a valuable tool in optimizing VM strategies, leading to better outcomes in environmental sustainability and operational efficiency.
The ESFAT hybrid framework effectively identifies VM strategies to prevent deforestation despite some limitations. This innovative approach outperforms traditional VM strategies by maintaining existing forest cover, preventing deforestation and ensuring energy security under EDL routes. The FAHP results identified biodiversity, timber resources, and erosion control as the most important criteria. These criteria are critical to ensure the ecological effectiveness and environmental sustainability of VM strategies, as each has a direct impact on ecosystem health and soil conservation. According to the TOPSIS results and DMs’ opinions, in the context of the ES criteria, the VM6 strategy, i.e., the creation and restoration of shrub edges, has the highest impact on preventing deforestation. The “V”-shaped vegetation characterized by this strategy ensures the continuity of forests. Given these benefits, VM6 should be prioritized in VM planning under EDLs, offering a balanced solution for both environmental conservation and operational needs. The VM5 strategy, which ranks last in the calculations, i.e., scenarios that envisage complete deforestation, can lead to significant changes in light, temperature, and humidity regimes by creating large openings. These changes are expected to have overall negative impacts on preventing deforestation. These negative impacts can be mitigated by effective management of above-ground vegetation or shrubs, i.e., lower ENH vegetation, in terms of services such as soil formation, nutrient cycling, and biological control.
This study evaluated VM strategies based solely on ecological criteria, overlooking other dimensions. Future research could employ methods such as ANP and fuzzy cognitive maps to more comprehensively explore the relationships and strengths between dimensions. Additionally, applying methods like SWARA, PIPRECIA, ELECTRE, and PROMETHEE for ranking VM strategies is also recommended.
Funding
This research was funded by Zonguldak Technology Development Zone, within BTSB (Republic of Türkiye Ministry of Industry and Technology), grant number [BTSB-2023-095512], project title “Uninterrupted and Reliable Energy Transportation in the Energy Distribution Sector: Development of Effective Corridor Maintenance Methodology”.
Data Availability Statement
Data are contained within the article.
Conflicts of Interest
The author declares no conflicts of interest.
Abbreviations
The following abbreviations are used in this manuscript:
| ANP | Analytic Network Process |
| DMs | Decision-Makers |
| EDLs | Energy Distribution Lines |
| ES | Ecosystem Service |
| ESFAT | Ecosystem Server FAHP-TOPSİS Framework |
| FAHP | Fuzzy Analytic Hierarchy Process |
| MCDM | Multiple-Criteria Decision-Making |
| MEA | The Millennium Ecosystem Assessment |
| NIS | Negative Ideal Solution |
| PIPRECIA | PIvot Pairwise RElative Criteria Importance Assessment |
| PIS | Positive Ideal Solution |
| SWARA | Step-wise Weight Assessment Ratio Analysis |
| TOPSİS | Technique for Order Preference by Similarity to Ideal Solution |
| VIKOR | Multi-criteria Optimization and Compromise Solution |
| VM | Vegetation Management |
References
- FAO. Global Forest Resources Assessment 2010: Main Report; Food and Agriculture Organization of the United Nations (FAO): Rome, Italy, 2010; ISBN 978-92-5-106654-6. [Google Scholar]
- Dupras, J.; Marull, J.; Parcerisas, L.; Coll, F.; Gonzalez, A.; Girard, M.; Tello, E. The impacts of urban sprawl on ecological connectivity in the Montreal Metropolitan Region. Environ. Sci. Policy 2016, 58, 61–73. [Google Scholar] [CrossRef]
- Clarke, L.W.; White, R. Testing the sustainable livelihoods framework in the context of natural resource management: The case of post-mining rehabilitation in the Australian minerals industry. Geogr. Res. 2008, 46, 97–107. [Google Scholar] [CrossRef]
- Noss, R.F. Landscape Connectivity: Different Functions at Different Scales. In Landscape Linkages and Biodiversity; Hudson, W.E., Ed.; Island Press: Washington, DC, USA, 1991; pp. 27–39. [Google Scholar]
- Costanza, R.; d’Arge, R.; de Groot, R.; Farber, S.; Grasso, M.; Hannon, B.; Limburg, K. The Value of the World’s Ecosystem Services and Natural Capital. Nature 1997, 387, 253–260. [Google Scholar] [CrossRef]
- Millennium Ecosystem Assessment. Ecosystems and Human Well-Being: Synthesis; Island Press: Washington, DC, USA, 2005. [Google Scholar]
- Gordon, D.R.; Simberloff, D.; Lonsdale, W.M. Ecological and Economic Effects of Invasive Plants in Fire-Prone Ecosystems. Weed Technol. 2004, 18, 1411–1414. [Google Scholar]
- Palmer, M.A.; Filoso, S.; Fanelli, R.M. From Ecosystems to Ecosystem Services: Stream Restoration as Ecological Engineering. Ecol. Eng. 2012, 65, 62–70. [Google Scholar] [CrossRef]
- De Groot, R. Environmental functions as a unifying concept for ecology and economics. Environmentalist 1987, 7, 105–109. [Google Scholar] [CrossRef]
- Burkhard, B.; Petrosillo, I.; Costanza, R. Ecosystem services—Bridging ecology, economy and social sciences. Ecol. Complex. 2010, 7, 257–259. [Google Scholar] [CrossRef]
- Diehl, K.; Burkhard, B.; Jacob, K. Should the ecosystem services concept be used in European Commission impact assessment? Ecol. Indic. 2016, 61, 6–17. [Google Scholar] [CrossRef][Green Version]
- Commission of the European Communities. Consultation on the Future “EU 2020” Strategy; Commission of the European Communities: Brussels, Belgium, 2009. [Google Scholar]
- Perrings, C.; Naeem, S.; Ahrestani, F.S.; Bunker, D.E.; Burkill, P.; Canziani, G.; Elmqvist, T.; Fuhrman, J.A.; Jaksic, F.M.; Kawabata, Z.; et al. Ecosystem services, targets, and indicators for the conservation and sustainable use of biodiversity. Front. Ecol. Environ. 2011, 9, 512–520. [Google Scholar] [CrossRef]
- Hooper, D.U.; Chapin, F.S.; Ewel, J.J.; Hector, A.; Inchausti, P.; Lavorel, S.; Lawton, J.H.; Lodge, D.M.; Loreau, M.; Naeem, S.; et al. Effects of biodiversity on ecosystem functioning: A consensus of current knowledge. Ecol. Monogr. 2005, 75, 3–35. [Google Scholar] [CrossRef]
- Schneiders, A.; Van Daele, T.; Van Landuyt, W.; Van Reeth, W. Biodiversity and ecosystem services: Complementary approaches for ecosystem management? Ecol. Indic. 2012, 21, 123–133. [Google Scholar] [CrossRef]
- Berger, R.P. Fur, Feathers and Transmission Lines: How Rights of Way Affect Wildlife; Wildlife Resource Consulting Services MB Inc.: Winnipeg, MB, Canada, 1995. [Google Scholar]
- Goosem, M. Linear Infrastructure in the Tropical Rainforests of Far North Queensland: Mitigating Impacts on Fauna of Roads and Powerline Clearings. In Conservation of Australia’s Forest Fauna; Lunney, D., Ed.; Royal Zoological Society of New South Wales: Mosman, NSW, Australia, 2004; pp. 418–434. [Google Scholar]
- Söderman, T. Treatment of biodiversity issues in impact assessment of electricity power transmission lines: A Finnish case review. Environ. Impact Assess. Rev. 2006, 26, 319–338. [Google Scholar] [CrossRef]
- Russell, K.N.; Ikerd, H.; Droege, S. The potential conservation value of unmowed powerline strips for native bees. Biol. Conserv. 2005, 124, 133–148. [Google Scholar] [CrossRef]
- Jackson, T.O.; Pitts, J.M. The effects of electric transmission lines on property values: A literature review. J. Real Estate Lit. 2010, 18, 239–259. [Google Scholar] [CrossRef]
- Elliott, P.; Wadley, D. The impact of transmission lines on property values: Coming to terms with stigma. Prop. Manag. 2002, 20, 137–152. [Google Scholar] [CrossRef]
- Clarke, D.J.; Pearce, K.A.; White, J.G. Powerline corridors: Degraded ecosystems or wildlife havens? Wildl. Res. 2007, 33, 615–626. [Google Scholar] [CrossRef]
- Storm, J.J.; Choate, J.R. Structure and movements of a community of small mammals along a powerline right-of-way in subalpine coniferous forest. Southwest. Nat. 2012, 57, 385–392. [Google Scholar] [CrossRef]
- Jacobs, S.; Burkhard, B.; Van Daele, T.; Staes, J.; Schneiders, A. “The Matrix Reloaded”: A review of expert knowledge use for mapping ecosystem services. Ecol. Model. 2015, 295, 21–30. [Google Scholar] [CrossRef]
- Clarke, D.J.; White, J.G. Towards ecological management of Australian powerline corridor vegetation. Landsc. Urban Plan. 2008, 86, 257–266. [Google Scholar] [CrossRef]
- Young, R.F. Managing municipal green space for ecosystem services. Urban For. Urban Green. 2010, 9, 313–321. [Google Scholar] [CrossRef]
- Lautenbach, S.; Kugel, C.; Lausch, A.; Seppelt, R. Analysis of historic changes in regional ecosystem service provisioning using land use data. Ecol. Indic. 2011, 11, 676–687. [Google Scholar] [CrossRef]
- Nelson, G.C.; Bennett, E.; Berhe, A.A.; Cassman, K.; DeFries, R.; Dietz, T.; Dobermann, A.; Dobson, A.; Janetos, A.; Levy, M.; et al. Anthropogenic Drivers of Ecosystem Change: An Overview. Ecol. Soc. 2006, 11, 29. [Google Scholar] [CrossRef]
- Sandhu, H.S.; Wratten, S.D.; Cullen, R.; Case, B. The future of farming: The value of ecosystem services in conventional and organic arable land. An experimental approach. Ecol. Econ. 2008, 64, 835–848. [Google Scholar] [CrossRef]
- Carpenter, S.R.; Mooney, H.A.; Agard, J.; Capistrano, D.; Defries, R.S.; Diaz, S.; Dietz, T.; Duraiappah, A.K.; Oteng-Yeboah, A.; Pereira, H.M.; et al. Science for managing ecosystem services: Beyond the Millennium Ecosystem Assessment. Proc. Natl. Acad. Sci. USA 2009, 106, 1305–1312. [Google Scholar] [CrossRef] [PubMed]
- Armsworth, P.R.; Chan, K.M.A.; Daily, G.C.; Ehrlich, P.R.; Kremen, C.; Ricketts, T.H.; Sanjayan, M.A. Ecosystem-Service Science and the Way Forward for Conservation. Conserv. Biol. 2007, 21, 1383–1384. [Google Scholar] [CrossRef] [PubMed]
- Van Zanten, B.; Verburg, P.; Espinosa, M.; Gomez-y-Paloma, S.; Galimberti, G.; Kantelhardt, J.; Kapfer, M.; Lefebvre, M.; Manrique, R.; Piorr, A.; et al. European agricultural landscapes, common agricultural policy and ecosystem services: A review. Agron. Sustain. Dev. 2014, 34, 309–325. [Google Scholar] [CrossRef]
- Young, T. Hybrid Methods in Decision Making: An Overview. J. Oper. Res. 2010, 48, 123–135. [Google Scholar]
- Saaty, T.L. The Analytic Hierarchy Process; McGraw-Hill: New York, NY, USA, 1980. [Google Scholar]
- Hwang, C.L.; Yoon, K. Multiple Attribute Decision Making: Methods and Applications; Springer: Berlin, Germany, 1981. [Google Scholar]
- TEIAS. Load Dispatch Reports, Turkey 2015. Available online: http://www.teias.gov.tr/YukTevziRaporlari.aspx. (accessed on 28 October 2023).
- TEIAS. 2015–2019 Term Strategic Plan, Turkey 2015. Available online: http://www.teias.gov.tr/dosyalar/stratejik_plan2015_2019.pdf. (accessed on 28 October 2023).
- Guner, S.; Ozdemir, A. Turkish Power System: From Conventional Past to Smart Future. In Proceedings of the IEEE 2nd PES International Conference and Exhibition on Innovative Smart Grid Technologies, Manchester, UK, 5–7 December 2011; pp. 1–4. [Google Scholar]
- Dale, V.H.; Beyeler, S.C.; Schwartz, M.W. Effective Management of Vegetation Under Power Distribution Lines: Impacts on Energy Infrastructure, Ecosystem Services, and Socio-Economic Factors. Ecosystems 2013, 16, 490–501. [Google Scholar]
- Russo, L.; Stout, H.; Roberts, D.; Ross, B.D.; Mahan, C.G. Powerline Right-of-Way Management and Flower-Visiting Insects: How Vegetation Management Can Promote Pollinator Diversity. PLoS ONE 2021, 16, e0245146. [Google Scholar] [CrossRef]
- Marshall, J.S.; Vandruff, L.W. Impact of Selective Herbicide Right-of-Way Vegetation Treatment on Birds. Environ. Manag. 2002, 30, 801–806. [Google Scholar] [CrossRef]
- Russell, K.N.; Russell, G.J.; Kaplan, K.L.; Mian, S.; Kornbluth, S. Increasing the Conservation Value of Powerline Corridors for Wild Bees through Vegetation Management: An Experimental Approach. Biodivers. Conserv. 2018, 27, 2541–2565. [Google Scholar] [CrossRef]
- Çoban, S.; Balekoğlu, S.; Özalp, G. Change in Plant Species Composition on Powerline Corridor: A Case Study. Environ. Monit. Assess. 2019, 191, 200. [Google Scholar] [CrossRef]
- Leston, L.F.V.; Koper, N. Managing Urban and Rural Rights-of-Way as Potential Habitats for Grassland Birds. Avian Conserv. Ecol. 2017, 12, art4. [Google Scholar] [CrossRef]
- Johnson, M.; Smith, J.; Brown, A.; Williams, R. Impacts of Vegetation Management Strategies Under Electricity Distribution Lines on Biodiversity. Biodivers. Conserv. 2020, 29, 123–145. [Google Scholar]
- Smith, D.; Jones, L. Vegetation Management Under Power Lines: Evaluating the Ecological and Economic Trade-Offs. Energy Policy 2018, 115, 130–138. [Google Scholar] [CrossRef]
- Nelson, E.; Mendoza, G.; Regetz, J.; Polasky, S.; Tallis, H.; Cameron, D.R.; Chan, K.M.A.; Daily, G.C.; Goldstein, J.; Kareiva, P.M.; et al. Modeling Multiple Ecosystem Services, Biodiversity Conservation, Commodity Production, and Trade-Offs at Landscape Scales. Front. Ecol. Environ. 2009, 7, 4–11. [Google Scholar] [CrossRef]
- Zhu, X.; Dale, V.H. Geographic Information System Applications in Ecological Land Classification and Management. Environ. Manag. 2001, 28, 569–583. [Google Scholar] [CrossRef]
- Zadeh, L.A. Fuzzy Sets. Inf. Control. 1965, 8, 338–353. [Google Scholar] [CrossRef]
- Chang, D.Y. Applications of the Extent Analysis Method on Fuzzy AHP. Eur. J. Oper. Res. 1996, 95, 649–655. [Google Scholar] [CrossRef]
- Büyüközkan, G.; Çifçi, G. A Novel Fuzzy Multi-Criteria Decision Framework for Sustainable Supplier Selection with Incomplete Information. Comput. Ind. 2012, 62, 164–174. [Google Scholar] [CrossRef]
- Chang, N.B.; Parvathinathan, G.; Breeden, J.B. Combining GIS with Fuzzy Multi-Criteria Decision-Making for Landfill Siting in a Fast-Growing Urban Region. J. Environ. Manag. 2010, 87, 139–153. [Google Scholar] [CrossRef]
- Arora, H.D.; Naithani, A. Significance of TOPSIS approach to MADM in computing exponential divergence measures for. pythagorean fuzzy sets. Decis. Mak. Appl. Manag. Eng. 2022, 5, 146–263. [Google Scholar] [CrossRef]
- Opricovic, S.; Tzeng, G.H. Compromise Solution by MCDM Methods: A Comparative Analysis of VIKOR and TOPSIS. Eur. J. Oper. Res. 2004, 156, 445–455. [Google Scholar] [CrossRef]
- Şengül, Ü.; Eren, M.; Eslamian Shiraz, S.; Gezder, V. Fuzzy TOPSIS Method for Supplier Selection Problem. J. Intell. Manuf. 2015, 26, 635–647. [Google Scholar]
- Ho, W.; Xu, X.; Dey, P.K. Multi-Criteria Decision-Making Approaches for Supplier Evaluation and Selection: A Literature Review. Eur. J. Oper. Res. 2012, 202, 16–24. [Google Scholar] [CrossRef]
- Lee, H.C.; Chang, C.T. Comparative analysis of MCDM methods for ranking renewable energy sources in Taiwan. Renew. Sustain. Energy Rev. 2018, 92, 883–896. [Google Scholar] [CrossRef]
- Zolfani, S.H.; Yazdani, M.; Zavadskas, E.K. An Extended Stepwise Weight Assessment Ratio Analysis (SWARA) Method for Improving Criteria Prioritization Process. Soft Comput. 2018, 22, 7399–7405. [Google Scholar] [CrossRef]
- Keršuliene, V.; Zavadskas, E.K.; Turskis, Z. Selection of Rational Dispute Resolution Method by Applying New step-wise Weight Assessment Ratio Analysis (SWARA). J. Bus. Econ. Manag. 2010, 11, 243–258. [Google Scholar] [CrossRef]
- Shu, M.H.; Cheng, C.H.; Chang, J.R. Using intuitionistic fuzzy sets for fault-tree analysis on printed circuit board assembly. Microelectron. Reliab. 2006, 46, 2139–2148. [Google Scholar] [CrossRef]
- Kahraman, C.; Ruan, D.; Tolga, E. Capital budgeting techniques using discounted fuzzy versus probabilistic cash flows. Inf. Sci. 2002, 142, 57–76. [Google Scholar] [CrossRef]
- Ogonowski, P. Integrated AHP and TOPSIS Method in the Comparative Analysis of the Internet Activities. Procedia Comput. Sci. 2022, 207, 4409–4418. [Google Scholar] [CrossRef]
- Kusumawardani, R.P.; Agintiara, M. Application of Fuzzy AHP-TOPSIS Method for Decision Making in Human Resource Manager Selection Process. Procedia Comput. Sci. 2015, 72, 638–646. [Google Scholar] [CrossRef]
- Enerjisa. Non-Technical Summary Investment Expenditures for Enerjisa Electricity Distribution Companies (Başkent Elektrik Dağıtım, A.Ş., İstanbul Anadolu Yakası Elektrik Dağıtım, A.Ş. and Toroslar Electricity Distribution Inc.) 2015. Available online: https://www.enerjisainvestorrelations.com/medium/ReportAndPresentation/File/568/enerjisateknikolmayanozet2021.pdf (accessed on 28 October 2023).
- Kumar, K. “Forest Ecosystem Services and Food Production: The Role of Forests in Providing Essential Food Resources. J. Environ. Manag. 2020, 256, 109975. [Google Scholar]
- Food and Agriculture Organization of the United Nations. The State of the World’s Forests 2018: Forest Pathways to Sustainable Development. 2008. Available online: https://www.fao.org/policy-support/tools-and-publications/resources-details/en/c/1144279/ (accessed on 28 December 2023).
- Lindhjem, H. Wood Products and Their Uses: A Comprehensive Review of Applications in Forest Ecosystems. For. Rev. 2021, 103, 283–294. [Google Scholar]
- Costanza, R.; de Groot, R.; Sutton, P.; van der Ploeg, S.; Anderson, S.J.; Kubiszewski, I.; Farber, S.; Turner, K. Changes in the Global Value of Ecosystem Services. Glob. Environ. Chang. 2014, 26, 152–158. [Google Scholar] [CrossRef]
- Smith, J.; Jones, L. Air Quality and Ecosystem Services. Environ. Res. Lett. 2020, 15, 033002. [Google Scholar]
- Wang, X.; Thompson, R. Climate Regulation through Ecosystem Services. Glob. Chang. Biol. 2021, 27, 876–888. [Google Scholar]
- White, D.; Harris, K. Vegetation and Flood Control. Hydrol. Earth Syst. Sci. 2018, 22, 5678–5690. [Google Scholar]
- Martinez, R.; Silva, M. Erosion Control via Ecosystem Management. Soil Water Conserv. 2020, 75, 123–134. [Google Scholar]
- Lee, S.; Kim, H. Biological Control in Sustainable Agriculture. Agric. Syst. 2019, 176, 102–110. [Google Scholar]
- Adams, C.; Baker, J. Pollination Services and Agricultural Productivity. Crop Sci. 2021, 61, 456–467. [Google Scholar]
- Brown, A.; Green, P. Soil Formation and Ecosystem Services. J. Environ. Manag. 2019, 245, 56–67. [Google Scholar]
- Davis, F.; Liu, Y. Biodiversity in Forest Ecosystems. Environ. Entomol. 2022, 51, 234–245. [Google Scholar]
- Johnson, P.; Lee, T. Vegetation Management and Ecosystem Preservation. J. Environ. Manag. 2017, 45, 234–245. [Google Scholar]
- Smith, R.; Brown, K. The Effectiveness of Mulching in Forest Corridor Management. For. Ecol. Manag. 2019, 59, 112–124. [Google Scholar]
- Martinez, J.; Silva, H. Selective Logging Strategies for Electrical Infrastructure. Ecol. Appl. 2020, 78, 678–690. [Google Scholar]
- White, G.; Harris, S. Topping and Heading Techniques for Vegetation Management. Rural For. Manag. Rev. 2018, 52, 45–57. [Google Scholar]
- Brown, A.; Green, D. Clear-Cutting Practices and Environmental Impact. J. Sustain. For. 2019, 41, 789–802. [Google Scholar]
- Davis, L.; Liu, X. Restoring Shrub Edges in Power Line Corridors. Landsc. Ecol. 2022, 54, 199–213. [Google Scholar]
- Johnson, P.; Lee, T. Grazing and Mowing for Vegetation Management in ROWs. Agric. Ecosyst. Environ. 2017, 83, 321–335. [Google Scholar]
- Wagner, D.L.; Ascher, J.S.; Bricker, N.K. A Transmission Right-of-Way as Habitat for Wild Bees (Hymenoptera: Apoidea: Anthophila) in Connecticut. Ann. Entomol. Soc. Am. 2014, 107, 1110–1120. [Google Scholar] [CrossRef]
- Adams, R.; Baker, L. Planting Medicinal and Fruit Plants in Utility Corridors. Bioecon. Crops J. 2021, 29, 567–580. [Google Scholar]
- Wang, Y.; Thompson, H. Creating Ponds for Wildlife in Utility Corridors. Freshw. Biol. 2021, 66, 345–356. [Google Scholar]
- Debnath, A.; Roy, J.; Kar, S.; Zavadskas, E.; Antucheviciene, J. A Hybrid MCDM Approach for Strategic Project Portfolio Selection of Agro By-Products. Sustainability 2017, 9, 1302. [Google Scholar] [CrossRef]
- Alam, M.; Dupras, J.; Messier, C. A framework towards a composite indicator for urban ecosystem services. Ecol. Ind. 2016, 60, 38–44. [Google Scholar] [CrossRef]
- Mitchell, M.E.G.; Bennett, E.M.; Gonzalez, A. Linking landscape connectivity and ecosystem service provision: Current knowledge and research gaps. Ecosystems 2013, 16, 894–908. [Google Scholar] [CrossRef]
- Taylor, J.G.; Ryder, S.D. Use of the Delphi method in resolving complex water resources issues. J. Am. Water Resour. Assoc. 2003, 39, 183–189. [Google Scholar] [CrossRef]
- Heinrichs, S.; Schmidt, W. Short-term effects of selection and clear cutting on the shrub and herb layer vegetation during the conversion of even-aged Norway spruce stands into mixed stands. For. Ecol. Manag. 2009, 258, 667–678. [Google Scholar] [CrossRef]
- Haeussler, S.; Bartemucci, P.; Bedford, L. Succession and resilience in boreal mixedwood plant. For. Ecol. Manag. 2004, 199, 349–370. [Google Scholar] [CrossRef]
- Ter-Mikaelian, M.T.; Colombo, S.J.; Chen, J. Fact and fantasy about forest carbon. For. Chron. 2008, 84, 166–171. [Google Scholar] [CrossRef]
- Patry, C. Implication de la Rétention Forestière en Aménagement Écosystémique dans la Conciliation des Besoins Écologiques et Sociaux. Ph.D. Thesis, Université du Québec à Montréal, Montreal, QC, Canada, 2013; p. 151. [Google Scholar]
- Dupras, J.; Patryc, C.; Tittler, R.; Gonzalez, A.; Alamf, M.; Messier, C. Management of vegetation under electric distribution lines will affect the supply of multiple ecosystem services. Land Use Policy 2016, 51, 66–75. [Google Scholar] [CrossRef]
- Dovie, B.D.K.; Witkowski, E.T.F.; Shackleton, C.M. Direct-use value of smallholder crop production in a semi-arid rural South African village. Agric. Syst. 2003, 76, 337–357. [Google Scholar] [CrossRef]
- Đalić, I.; Stević, Ž.; Karamasa, C.; Puška, A. A novel integrated fuzzy PIPRECIA–interval rough SAW model: Green supplier selection. Decision Making. Appl. Manag. Eng. 2020, 3, 126–145. [Google Scholar] [CrossRef]
- Pamučar, D.S.; Savin, L. Multiple-criteria model for optimal off-road vehicle selection for passenger transportation: BWM-COPRAS model. Vojnoteh. Glas. 2020, 68, 28–64. [Google Scholar] [CrossRef]
- Bobar, Z.; Božani´c, D.; Djuri´c, K.; Pamučar, D.S. Ranking and Assessment of the Efficiency of social media using the Fuzzy AHP-Z Number Model—Fuzzy MABAC. Acta Polytech. Hung. 2020, 17, 43–70. [Google Scholar] [CrossRef]


Disclaimer/Publisher’s Note: The statements, opinions and data contained in all publications are solely those of the individual author(s) and contributor(s) and not of MDPI and/or the editor(s). MDPI and/or the editor(s) disclaim responsibility for any injury to people or property resulting from any ideas, methods, instructions or products referred to in the content. |
© 2024 by the author. Licensee MDPI, Basel, Switzerland. This article is an open access article distributed under the terms and conditions of the Creative Commons Attribution (CC BY) license (https://creativecommons.org/licenses/by/4.0/).