Abstract
Over the last 50 years, groundwater levels have been decreasing and air temperatures have been increasing in Poland. Maintaining this trend may make it impossible to maintain hydrogenic habitats in good condition. Reactions to ongoing climate change recorded in tree rings may be a good indicator describing the degree of this threat. The aim of this study was to determine the influence of climatic and hydrological changes on the growth of scotch pine (Pinus sylvestris L.) and black alder (Alnus glutinosa (L.) Gaertn) in the Narew National Park over past 50 years. The research was based on tree increment cores extracted from 42 pine trees and 57 alder trees that were randomly selected and ranged in age from 25 to 88 years, as well as climatic and hydrological data. Standardised data (5-year index) were analysed by species, generation (Y—21–40 years, M—41–60, O—61–90), and decade using correlation analysis. The results of the study show that pine responded more strongly to changes in air temperature and changes in precipitation totals, while alder growth was more strongly related to fluctuations in the water level of the Narew River and changes in precipitation totals. Our research showed that differences in response to environmental factors also occur between tree generations. The decrease in the water level of the Narew River that occurred over the last 50 years did not adversely affect the condition of the trees. Analysis of DBH growth rates showed that the younger generations (Y, M) grow faster than the older generation (O). This is positive news for managers of commercial and protected forests, but accelerated tree growth may be associated with specific consequences, such as increased wind damage as a result of reduced wood density or reduced sensitivity of trees to climate and hydrological changes.
1. Introduction
In the last 50 years, changes in the rate of tree growth have been observed in Europe and North America [1,2,3,4,5]. In central and northern Europe, there is an acceleration in the growth of the volume of tree stands, while in the southern part of the continent, there is a decrease [6]. This condition may be due to an increase in air temperature [7]. An increase in atmospheric CO2 concentration may also be the cause, but this is a matter of dispute. Some studies suggest that the increase resulting from increased atmospheric CO2 concentration is limited by air temperature [8], water scarcity [9], or nitrogen [10,11]. In contrast, other studies indicate that higher atmospheric CO2 concentrations not only accelerate plant growth but may also increase their drought tolerance [12,13].
In the range of temperature and monthly precipitation values found in the lowlands of Central Europe, water availability will become the main environmental factor affecting the variation of species growth in the future [14]. The predicted increase in inter-annual variability of precipitation will lead to an increased occurrence of drought phenomena, primarily affecting stands growing on light and shallow soils prone to water loss [15]. In many places, water-sensitive species such as alder and spruce can be expected to decline [14]. Species with large ranges, large populations, and high fecundity are likely to survive and adapt, but they may suffer from adaptation delays for several generations [16]. Climate change will be associated with changes in tree ranges. Studies show that these will mainly affect pine, oak, and beech [17]. At the same time, the dieback of black alder (Alnus glutinosa (L.) Gaertn.) has also been observed in Europe since the 1990s. Studies suggest the pathogen Phytophthora alni subsp. alni is behind the dieback, which is favoured by climate change and lowering groundwater levels [18]. The results of scenario analyses for the Narew National Park suggest that climate change by 2050 may be the most threatening factor to the maintenance of hydrogenic habitats. The threat of climate change is particularly high for a scenario with strong increases in air temperature and small changes in precipitation totals. A potential decrease in groundwater levels in the growing season could exacerbate some of the negative changes in soils and vegetation cover [19].
Groundwater and surface water are becoming crucial in the face of ongoing climate change and human activities [20]. However, little is known about long-term dynamics, especially of groundwater, due to the lack of long-lived historical records. One way may be to reconstruct these data using the relationship between water levels and radial growth of woody plants [21,22,23,24]. Periods of favourable and unfavourable growth conditions, as well as temporary disturbances, are recorded in the form of thinner and thicker annual tree rings. This property is used to date events that took place in the stand’s past, such as drought, flood, or fire [25,26,27]. The specifics of the species also play an important role in analysing the impact of climate and hydrological changes on trees. Oak, for example, is one of the more resilient species of Polish forests to flooding [28], so that this species often lacks a response to water fluctuations in the width of the tree rings [29]. Other studies suggest that the response to hydrological conditions in oak is pronounced, but only in trees growing in close proximity to a water body [21]. Black alder, because of the habitats it occupies, responds more strongly to changes in water levels (droughts and floods) than changes in air temperature [30,31]. Some studies indicate that the growth of black alder depends mainly on local environmental factors, including changing water saturation [32]. Other studies indicate that the response of alder to the influence of climatic and hydrological factors depends on habitat conditions, i.e., alder growing in drier habitats responded more strongly to climatic factors [30]. Numerous studies indicate the potential of black alder as an indicator of hydrological conditions and the possibility of using the species’ response to track environmental changes [31] and even manage water resources in areas threatened by periods of drought [32,33]. However, the possibility of using alder annual rings to reconstruct data on historical water levels may be limited to rivers only [34]. A solution to this problem may be the use of pine as an indicator [35,36]. This species is capable of inhabiting extreme habitats in terms of both soil and moisture conditions. Pine responds to changes in temperature and precipitation, making it suitable for describing the interaction between climatic conditions and tree growth [7].
The vegetation of Narew National Park is shaped by the influence of river water [37,38], so it becomes important to answer the question of how changes in climate and water conditions will modify the growth of the park’s forests. The methods of dendrochronology and the responses to these changes recorded in the widths of the annual rings of the trees can help in describing the changes that have occurred in the past. The purpose of this study was to examine the response of Scots pine (Pinus silvestris L.) and black alder (Alnus glutinosa (L.) Gaertn.) to climatic and hydrological changes that have occurred over the past 50 years in Narew National Park. In particular, the decrease in the level of the Narew River, the increase in average air temperature, and changes in the distribution of total precipitation were tested. We assumed that the influence of the river water level on the growth of pine would be smaller than on the growth of alder, which will make it possible to compare the strength of climatic and hydrological factors on tree growth. The reaction of trees to changes in factors will allow us to assess the degree of threat to the park’s vegetation. Narew National Park was the optimal choice to conduct this type of research.
2. Materials and Methods
This study was conducted in Narew National Park (Figure 1). The park is located in northeastern Poland. The park was established in 1996 to protect a part of the upper Narew River and its valley. Within the boundaries of the National Park, a vast mosaic of floodplains and marsh and terrestrial habitats has developed, filling almost the entire valley floor. Wetlands cover 90% of the area of the Narew National Park [https://npn.gov.pl/ accessed on 20 August 2024]. Forests are found on the periphery of the park. Two tree species dominate here: black alder (Alnus glutinosa (L.) Gaertn) growing in the wetlands, and scotch pine (Pinus sylvestris L.) growing on the exalted areas. The downy birch (Betula pubescens Ehrh.) and the silver birch (Betula pendula Roth) are also present but occupy a relatively small area of the park’s forests. Most of the park’s forests are 41–60 years old. Older and younger stands occur sporadically [https://www.bdl.lasy.gov.pl/portal/ accessed on 7 May 2023].
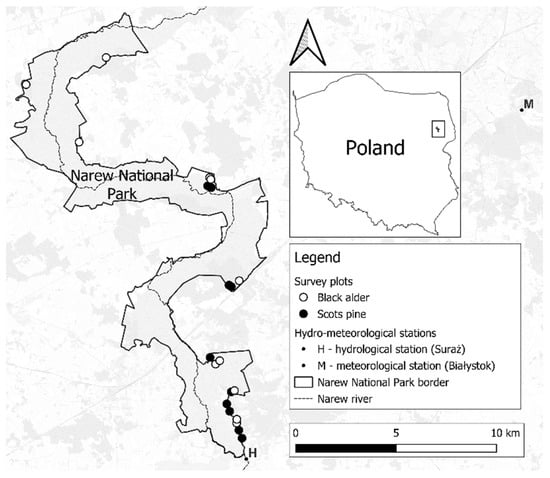
Figure 1.
Location of survey plots in Narew National Park.
The research plots selected for the study reflected the species composition of the forests, their age, and their spatial distribution within the park. We located the research within 21 stands—10 of pine (Peucedano-Pinetum), 10 of alder (Ribeso nigri-Alnetum), and 1 in which both species grew side by side (Molinio caeruleae-Pinetum). Most of the study material consisted of stands aged 41–60 years (15 tree-stands). For the purpose of comparing tree generations, part of the material included younger and older generations (6 stands). Within each stand, survey points were randomly drawn using QGIS 3.16 “Hannover” software. After finding the drawn point in the field with the help of a GPS receiver, the tree with the highest biosocial position within 10 m of the point was selected for the study. According to studies, typing trees with the highest biosocial position reduces variability due to natural processes of growth and differentiation of stand structure [39,40,41]. Trees with a single trunk were selected for the study, trees in a multi-stem form were avoided due to the risk of including regrowth. The selected trees were divided by age generation: young (Y)—21–40 years old, middle-aged (M)—41–60 years old, and old (O)—61–90 years old.
In selected trees, diameter at breast height (DBH) and tree height were measured. From each selected tree, a wood increment core was extracted at breast height (1.3 m from the ground) using a Pressler borer on the north-facing side of a trunk. In each stand, borings were obtained from 4 to 8 trees. A total of 99 samples were obtained in the survey. The final number of trees selected for the study and their characteristics are presented in Table 1. Measurements were taken in August 2023.

Table 1.
Characteristics of the study material.
Increment core samples obtained in field work were dried, sanded, and scanned at 2400 DPI. The widths of the annual rings were measured using the program CooRecorder 9.8.1. On this basis, individual sequences of annual ring widths were developed. Then, in the program CDdendro 9.8.1, the correctness of the measurements was checked, and the similarity of chronologies from individual trees was assessed. The database was enriched with meteorological (average annual, summer, and winter air temperatures for Białystok and annual, summer, and winter precipitation levels for Suraż for the period of 1971–2020) and hydrological data (water level in centimetres for the Narew River for the period of 1971–2020 for the Suraż station). Data were extracted from the Polish meteorological institute IMGW-PIB dataset [https://danepubliczne.imgw.pl/ accessed on 12 September 2023].
The obtained meteorological and hydrological data, as well as the thickness of measured annual tree rings, were standardised to form 5-year indices (1).
where I5 is the 5-year feature index in a given year n, r is the value of the feature (ring thickness, rainfall sum, average temperature) in a given year n and in the period of the two previous years (n − 1, n − 2) and the two following years (n + 1, n + 2).
I5 = rn/((rn−2 + rn−1 + rn + r n+1 + r n+2)/5)
During the data analysis, correlations were calculated between the index of annual tree ring thickness and indices of temperature, precipitation, and river water level. Analyses were conducted separately for pine and alder in three tree generations (Y, M, O) and five decades (1971–1980, 1981–1990, 1991–2000, 2001–2010, 2011–2020). We also checked the correlation between tree ring indices and climate feature indices with a five-year lag. An analysis of DBH growth rates by generation and species was also carried out.
Statistical analyses were performed using non-parametric tests: Kruskal–Wallis ANOVA with the Dunn–Bonferroni post hoc test, the Mann–Whitney test, and the Spearman rank correlation test. Tests were conducted at a significance level of α = 0.05. PQStat software version 1.8.6 was used for the analyses.
3. Results
Over the past 50 years, there has been a +1.7 °C increase in average annual air temperature, with the strongest increases in the 2011–2020 decade (+0.7 °C) and the 1981–1990 decade (+0.5 °C) (Table 2). Total precipitation oscillated around 550 mm/year for most of the analysis period. The highest annual precipitation occurred in the 1971–1980 decade (592.4 mm) and in the 2011–2020 decade (577.8 mm). The first and last decades were characterised by the greatest fluctuations in annual precipitation sum. During the analysis period, winter precipitation increased, and summer precipitation decreased. Over the past 5 decades, the average level of the Narew River has also decreased by more than 23 cm. However, it should be noted that the largest decrease was recorded from the 1971–1980 decade to the 1981–1990 decade (22 cm). For the last four decades, the level of the river oscillated between 178 and 181 cm. The annual climate and hydrological data are included in the graphs in Appendix A, Figure A1, Figure A2 and Figure A3.
Table 2.
Climatological and hydrological data for Narew National Park and the percentage of trees that reached extreme values of the tree width index (below 0.7 or above 1.3) by decade.
Analysing the extreme values of the ring width index, it is also possible to separate decades in which conditions were more variable and decades in which conditions were stable. Based on the average annual number of pine trees that reached extreme values of ring width index (above 1.3 or under 0.7), it was shown that in the decade 2011–2020, on average, annually more than 31% of trees reached extreme values of the index. About 13.9% reached an index above 1.3, and 17.5% reached an index value below 0.7. Similar values were shown for the 1971–1980 and 1981–1990 decades, while the 1991–2000 and 2001–2010 decades were more stable in this respect. In the case of alder, a smaller percentage of trees reaching extreme index values was found, averaging 15.5%. The largest number of trees exceeded the extreme value in the decade 1981–1990 (20.1%), and the smallest in the decade 1991–2000 (11.0%). Analysis for index values below 0.7 shows that alder growth conditions were increasingly stable. With each decade, fewer and fewer trees reached an index value below 0.7. The number of trees whose growth fell below the 0.7 value was 11.4% of trees per year in the 1971–1980 decade to 6.4% of trees per year in the 2011–2020 decade.
Years in which more than 20% of pine trees developed rings 30% thicker than the five-year average (positive characteristic year, index value above 1.3) were 2017, 2013, 1993, and 1972. Years in which more than 20% of pine trees developed rings 30% thinner than the five-year average (negative characteristic year, index value below 0.7) were 2019, 2015, 1995, 1986, 1985, 1980, 1979, 1977, and 1971. In the case of black alder, only two positive characteristic years were found—1985 and 2004. The negative characteristic years, however, were 2018, 2015, 2006, 2003, 1981, and 1979. A particularly heavy growth year for both species was 2015. Percentage share of trees with 5-year index below 0.7 or above 1.3 by year are included in the graphs in Appendix A, Figure A4.
Correlations between the ring width index and indices of temperature, precipitation, and river water level were relatively low, and their strength varied by decade (Figure 2). We recorded statistically significant correlations mainly in the last decade (2011–2020).
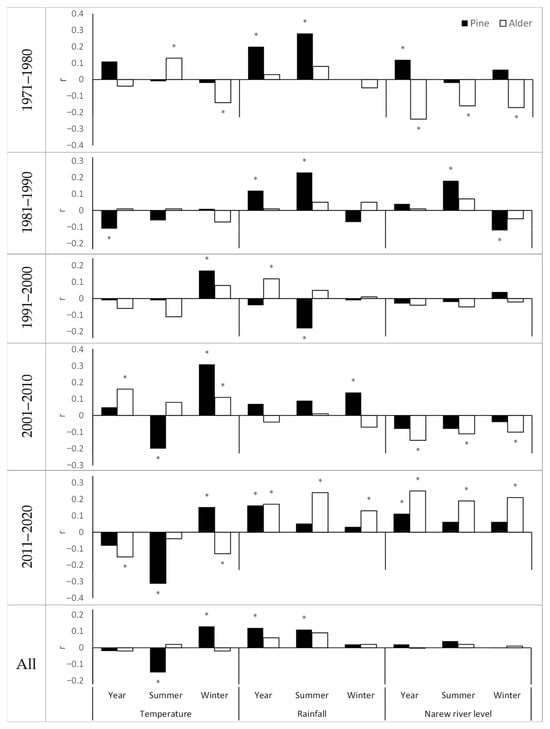
Figure 2.
The value of the correlation index between the ring width index and the indices of temperature, precipitation, and the water level of the Narew River depending on the species and decade. Yr—year, S—summer (April–September), W—winter (October–March). * Significant correlation at α = 0.05 (Spearman’s rank correlation coefficient).
Pine responded more strongly to changes in air temperature and changes in precipitation, and alder to changes in river levels and changes in precipitation. Pine growth was favoured by warm winters, while it was limited by warm summers. Also, higher rainfall was correlated positively with a greater increase in pine thickness. River level was marginally correlated with radial growth in pine. It should be noted, however, that the autocorrelation analysis with a 1- to 5-year lag indicates that the pine response to changes in river level may occur with a one-year delay (Figure A5, Appendix A). Similarly, in alder, higher temperature interacted negatively and higher precipitation positively with tree growth. River water level was relatively strongly correlated with radial growth in alder, with the relationship taking negative values in the first decade (1971–1980, r = −0.24) and positive values in the last decade (2011–2020, r = 0.25); for the remaining decades, the correlation was low and not statistically significant. Despite significant correlations within selected decades, for the material as a whole, the alder ring width index did not correlate with the temperature, precipitation, and Narew River level indexes.
The analysis showed that the age of trees also plays an important role in the trees’ response to climatic and hydrological factors (Figure 3). The influence of the analysed climatic and hydrological factors manifested itself differently depending on the age of the trees. The youngest generation of trees often reacted differently from the oldest generation. In the decade 2001–2010, pine from generation Y reacted negatively to an increase in annual air temperature, generation M was neutral, and generation O reacted positively. The increase in summer temperature negatively affected the growth of the young and middle-aged generation of pines but had little effect on the growth of the oldest generation. An increase in winter temperature and an increase in winter precipitation had a positive effect on the growth of pine trees, but the strength of the correlation increased with their age. In the decade 2011–2020, which was a decade characterised by harsher conditions compared to earlier decades, the trees’ responses changed. An increase in annual and summer air temperature began to negatively affect the oldest generation, and an increase in winter temperature began to negatively affect the growth of the youngest generation. At the same time, the increase in precipitation favoured the radial growth of pine trees of generation Y, while generations M and O were not significantly affected by this feature.
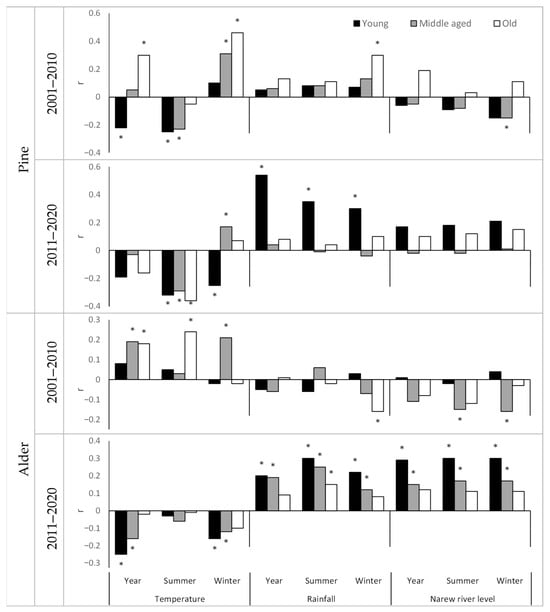
Figure 3.
The value of the correlation index between the ring width index and the indices of temperature, precipitation, and the water level of the Narew River depending on the species and generation in the decades 2001–2010 and 2011–2020. Yr—year, S—summer (April–September), W—winter (October–March). * Significant correlation at α = 0.05 (Spearman’s rank correlation coefficient).
Alder trees also responded differently to climatic and hydrological factors depending on the generation. The little variable growth conditions prevailing in the decade 2001–2010 meant that within the second generation, we did not show significant correlations between the ring width index and indices of temperature, precipitation, and river water level. However, significant correlations were present within the older generations. The tree thickness increment of the M and O generations was favoured by an increase in annual air temperature. Warmer summers favoured the growth of the O generation, and warmer winters favoured the growth of the M generation. Precipitation did not generally affect the growth of alder trees, with the exception of winter precipitation, whose increase negatively affected the thickness increment of the O generation. In the decade 2001–2010, changes in the river level also did not correlate with the growth of tree thickness, except for the O generation in which the increase in the river level in winter and summer negatively affected the growth of trees. In the decade 2011–2020, the situation changed. An increase in temperature had a negative effect, while an increase in precipitation or river level had a positive effect on the growth of alder trees. At the same time, the impact was greatest in the younger generation and decreased with the age of the trees. The oldest generation reacted the least to changes in climatic-hydrological factors during this decade. A significant correlation was shown only in the case of winter precipitation totals, which significantly affected the increase in the thickness of the annual tree rings of this generation.
Analysis of the rate of growth of DBH showed that the younger generations grow faster than the older generations. We found statistically significant differences mainly between old generation and the middle-aged and young generations. The differences increased with increasing DBH. For a DBH equal to 25 cm, statistically significant differences were found between all generations. It took the Y generation of pines an average of 24.5 years to reach DBH of 25 cm, the M generation reached it at 37.9 years, and the O generation at 62.1 years (Figure 4). In the case of alder, significant differences were shown only between the oldest generation and the other generations. It took alders of generation Y an average of 25.3 years to reach DBH of 25 cm, trees of generation M took 32.4 years, while alders of generation O reached this DBH at the age of 44.5 years (Figure 5).
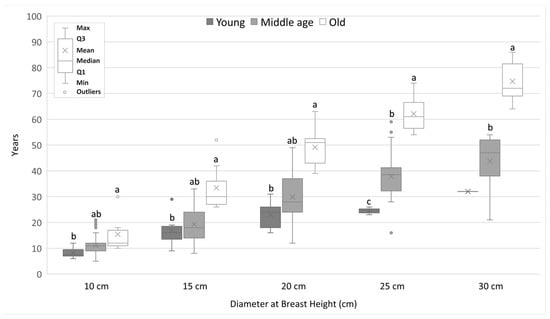
Figure 4.
The average number of years needed to achieve a given DBH value for pine trees from different generations. Different lowercase letters of the alphabet next to the number of years indicate statistically significant differences between means at α = 0.05 (Kruskal–Wallis test with Bonferroni’s post hoc test or Mann–Whitney test for 30 cm DBH; only one pine reach DBH equal 30 cm).
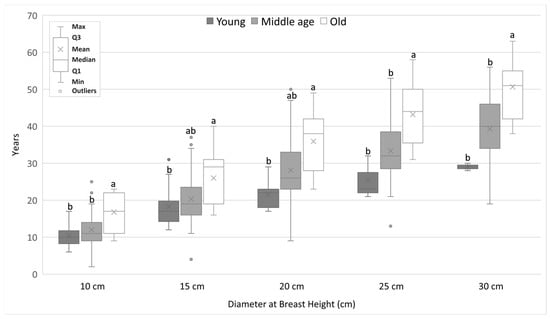
Figure 5.
The average number of years needed to achieve a given DBH value for alder trees from different generations. Different lowercase letters of the alphabet next to the number of years indicate statistically significant differences between means at α = 0.05 (Kruskal–Wallis test with Bonferroni’s post hoc test).
Analysis of the thickness increment of pine and alder trees growing in the same tree-stand (Molinio caeruleae-Pinetum) showed addition correlations between the values of increment indices of trees of both species, which means that the trees responded similarly to changing climatic and hydrological conditions.
4. Discussion
It was confirmed in studies that black alder, due to the environment of its occurrence, responds more strongly to changes in water levels and precipitation than changes in temperature [30,31] (Figure 2). Describing research also confirmed the results of Wilczynski [7] according to whom pine increases radial growth in years characterised by warm winters and years with abundant summer precipitation. The analogous result of our work confirms Wilczynski’s conclusion that the response of pine to climatic conditions may be transregional. It is worth noting that Wilczynski’s research was conducted in the south-eastern part of Poland while our research was conducted in the northeastern part. However, can alder be used as an indicator of hydrological conditions and pine as an indicator of climatic conditions? According to our research, yes, provided that generational changes are taken into account. The results of our study showed that the younger generation of trees often reacted differently than the oldest generation, both to changes in climatic and hydrological conditions (Figure 3). An increase in summer temperature could generate a decrease in growth in the young generation of pines and an increase in growth in the old generation of pines. Similarly, in alder, a year with high river water levels could generate higher growth in the younger generation of trees and have no effect on growth in the older generation. The results obtained correspond with those of Au et al. [42] on the effects of drought sensitivity of young and old trees across five continents. Their research showed that the response to drought of the young generation of trees is stronger than that of the older generation, but that the young generation regenerates more quickly after the drought subsides. Our research indicates that the response of the youngest generation of pines, both positive and negative, to changes in climatic conditions is usually stronger than that of the oldest generation. This occurs not only in pines, but also in alders in response to changes in fluctuations in river water levels and changes in air temperature. It should be noted that this phenomenon did not occur in decades characterised by favourable growth conditions. Given this, it may be a common phenomenon. This topic requires further research, especially in determining the reasons for the different response of trees of different ages to changes in climatic and hydrological conditions.
The above considerations lead to another point. In our study, we did not find deteriorating growth conditions for pine and alder in Narew National Park. During the study period, there were decades characterised by large fluctuations in river level and precipitation and temperature (1971–1980 and 2011–2020), which had a significant impact on tree growth. The decrease in the water level of the Narew River and the increase in average air temperature that occurred during this period and also changes in the distribution of precipitation did not negatively affect the condition of the trees. We have shown that with each successive decade in the alder population there were fewer and fewer trees with a ring width index below the value of 0.7 (Table 2). It was also noticed that subsequent generations of trees reach a given DBH value in a shorter time (Figure 4 and Figure 5). Thus, we did not confirm studies suggesting a decline in the ability of this species to adapt to changing climatic and hydrological conditions [14,18]. The reasons for this situation can be seen in the improvement of alder growth conditions as a result of partial drying of the habitat where it occurs. However, this thesis is contradicted by the fact that increased growth also occurred in pines growing in poor habitats and outside the river’s influence. Another cause may be the increase in CO2 concentration in the atmosphere. This would confirm research suggesting that as the concentration of CO2 in the atmosphere increases, plants not only grow faster but also increase their resistance to drought [5,6,12,13]. The cause may also be a phenomenon causing the wood to compress inside the tree trunk as its thickness increases. Explaining this issue requires research taking into account data from long-term tree measurements combined with dendrochronological data. The small sample size may also affect the results. Of the 99 trees included in the research, only 20 were of the young generation and 20 of the old generation. Of these, there were only six pines of the young generation and seven pines of the oldest generation. Nevertheless, these results correspond with the results of other studies indicating the acceleration of tree growth in recent decades [5].
Accelerated tree growth and increased resistance to drought may have certain consequences. Faster growth means wider rings and greater tree thickness, which, however, will result in lower wood density. This may generate a greater risk of tree breakage. Therefore, the accelerated growth rate of trees may generate greater damage to the tree stand as a result of wind activity. In protected areas such as national parks and reserves, this will not be seen as a problem, as higher susceptibility of trees to breakage can generate greater structural diversity of the forest. Higher tree susceptibility can be a significant problem in managed stands and will require changes in management techniques for such areas. Another consequence may be a decrease in the sensitivity of trees to climate and hydrological changes. Some studies indicate that oak may respond poorly to changes in water levels [29]. This property is due to the phenomenon of Cladoptosis, i.e., the shedding branches in response to stress. In the case of drought or prolonged flooding, this phenomenon helps the tree to reduce transpiration and survive the period of harsh conditions. Thanks to this, this species is highly resistant to droughts and flooding [28]. Assuming that an increase in CO2 concentration in the air will increase the resistance of other tree species to water level fluctuations, then species such as alder may become less useful as an indicator of hydrological conditions. Alder is considered a typical indicator species of hydrological conditions [31,32,33,34]. In a situation where trees are less sensitive to changes in climatic and hydrological conditions, the usefulness of some dendrochronological methods may also come into question. However, taking into account the research of Pila and Kaczka [21], it can be assumed that in trees growing in the immediate vicinity of water bodies, the response to hydrologic factors will always be strong. Considering the research of Au et al. [42], the response of young trees to changes in climatic conditions should be even stronger in situations of accelerated tree growth. The problem, if it occurs, may only apply to studies using old trees to describe the current state of the climate.
5. Conclusions
The results indicate that pine responded more strongly to climatic factors such as air temperature and annual precipitation, while alder thickness growth was more strongly related to water level fluctuations in the Narew River and annual precipitation. It should be noted, however, that the autocorrelation analysis with a 1- to 5-year lag indicates that the pine response to changes in river level may occur with a one-year delay. Our research has shown that the response to environmental factors may be age dependent. A given climatic or hydrological factor may generate a positive growth reaction in the younger generation and, at the same time, a negative growth reaction in the older generation. The response of the youngest generation of pines and alders, both positive and negative, to changes in climatic and hydrological conditions is usually stronger than that of the oldest generation. Analysis of DBH growth rates also showed that younger generations (Y, M) reach a given breast height value in a shorter time than older generations of pines and alders.
Author Contributions
Conceptualisation, S.P. and W.M.; methodology, S.P.; software, S.P.; validation, S.P., W.M. and J.M.d.C.; formal analysis, S.P. and W.M.; resources, J.M.d.C.; data curation, S.P.; writing—original draft preparation, S.P.; writing—review and editing, S.P.; visualisation, S.P.; supervision, S.P.; project administration, S.P.; funding acquisition, J.M.d.C. All authors have read and agreed to the published version of the manuscript.
Funding
The research work was funded by forest fund under an agreement between the General Directorate of State Forests in Warsaw and the Narew National Park. Contract number MZ.0290.1.10.2023.
Data Availability Statement
Data are available from the corresponding author upon reasonable request.
Conflicts of Interest
The authors declare no conflicts of interest.
Appendix A

Figure A1.
Average air temperatures for Białystok in the years 1970–2020.

Figure A2.
Average, maximum, and minimum annual water levels in the Narew River in the years 1970–2020.

Figure A3.
Total precipitation for the town of Suraż in the years 1970–2020.

Figure A4.
Percentage share of trees with 5-year tree ring index below 0.7 or above 1.3 by year.

Figure A5.
Correlation heatmap between the ring width index and the indices of temperature, precipitation, and the water level of the Narew River depending on the species and generation with 1- to 5-year lag. Yr—year, S—summer (April–September), W—winter (October–March). Black dot means statistically significant correlation at α = 0.05 (Spearman’s rank correlation coefficient).
References
- Elfving, B.; Tegnhammar, L.; Tveite, B. Studies on Growth Trends of Forests in Sweden and Norway. In Growth Trends in European Forests; Spiecker, H., Mielikäinen, K., Köhl, M., Skovsgaard, J.P., Eds.; Springer: Heidelberg/Berlin, Germany, 1996; pp. 61–70. [Google Scholar]
- Eriksson, H.; Karlsson, K. Long-Term Changes in Site Index in Growth and Yield Experiments with Norway Spruce (Picea abies, [L.] Karst) and Scots Pine (Pinus sylvestris, L.) in Sweden. In Growth Trends in European Forests; Spiecker, H., Mielikäinen, K., Köhl, M., Skovsgaard, J.P., Eds.; Springer: Heidelberg/Berlin, Germany, 1996; pp. 79–88. [Google Scholar]
- Boyer, W.D.A. Generational Change in Site Index for Naturally Established Longleaf Pine on a South Alabama Coastal Plain Site. South. J. Appl. For. 2001, 25, 88–92. [Google Scholar] [CrossRef]
- Westfall, J.A.; Amateis, R.L. A Model to Account for Potential Correlations Between Growth of Loblolly Pine and Changing Ambient Carbon Dioxide Concentrations. South. J. Appl. For. 2003, 27, 279–284. [Google Scholar] [CrossRef][Green Version]
- Pretzsch, H.; Biber, P.; Schütze, G.; Uhl, E.; Rötzer, T. Forest stand growth dynamics in Central Europe have accelerated since 1870. Nat. Commun. 2014, 5, 4967. [Google Scholar] [CrossRef]
- Vacek, Z.; Vacek, S.; Cukor, J. European forests under global climate change: Review of tree growth processes, crises and management strategies. J. Environ. Manag. 2023, 332, 117353. [Google Scholar] [CrossRef] [PubMed]
- Wilczyński, S. Wpływ klimatu na przyrost radialny sosny zwyczajnej na siedliskach suchych oraz bagiennych w trzech regionach Polski [Effect of climate on the radial growth of Scots pine growing at dry and boggy sites in three regions in Poland]. Sylwan 2020, 164, 896–905. [Google Scholar] [CrossRef]
- Kilpeläinen, A.; Peltola, H.; Ryyppö, A.; Kellomäki, S. Scots pine responses to elevated temperature and carbon dioxide concentration: Growth and wood properties. Tree Physiol. 2005, 25, 75–83. [Google Scholar] [CrossRef]
- Moore, D.J.P.; Aref, S.; Ho, R.M.; Pippen, J.S.; Hamilton, J.G.; de Lucia, E.H. Annual basal area increment and growth duration of Pinus taeda in response to eight years of free-air carbon dioxide enrichment. Glob. Chang. Biol. 2006, 12, 1367–1377. [Google Scholar] [CrossRef]
- Johnson, D.W.; Thomas, R.B.; Griffin, K.L.; Tissue, D.T.; Ball, J.T.; Strain, B.R.; Walker, R.F. Effects of carbon and nitrogen on growth and nitrogen uptake in Ponderosa and Lobolly Pine. J. Environ. Qual. 1998, 27, 414–425. [Google Scholar] [CrossRef]
- Finzi, A.C.; DeLucia, E.H.; Hamilton, J.G.; Richter, D.D.; Schlesinger, W.H. The nitrogen budget of a pine forest under free air CO2 enrichment. Oecologia 2002, 132, 567–578. [Google Scholar] [CrossRef]
- Jiang, M.; Kelly, J.W.G.; Atwell, B.J.; Tissue, D.T.; Medlyn, B.E. Drought by CO2 interactions in trees: A test of the water savings mechanism. New Phytol. 2021, 230, 1421–1434. [Google Scholar] [CrossRef]
- Gardner, A.; Jiang, M.; Ellsworth, D.S.; MacKenzie, A.R.; Pritchard, J.; Bader, M.K.F.; Barton, C.V.; Bernacchi, C.; Calfapietra, C.; Crous, K.Y.; et al. Optimal stomatal theory predicts CO2 responses of stomatal conductance in both gymnosperm andangiosperm trees. New Phytol. 2023, 237, 1229–1241. [Google Scholar] [CrossRef] [PubMed]
- Zajączkowski, J.; Brzeziecki, B.; Perzanowski, K.; Kozak, I. Wpływ potencjalnych zmian klimatycznych na zdolność konkurencyjną głównych gatunków drzew w Polsce [Impact of potential climate changes on competitive ability of main forest tree species in Poland]. Sylwan 2013, 157, 253–261. [Google Scholar] [CrossRef]
- Giorgi, F.; Xunqiang, B.; Pal, J. Mean, interannual variability and trends in a regional climate change experiment over Europe. II: Climate change scenarios (2071−2100). Clim. Dyn. 2004, 23, 839–858. [Google Scholar] [CrossRef]
- Aitken, S.N.; Yeaman, S.; Holliday, J.A.; Wang, T.; Curtis-McLane, S. Adaptation, migration or extirpation: Climate change outcomes for tree populations. Evol. Appl. 2008, 1, 95–111. [Google Scholar] [CrossRef]
- Cheaib, A.; Badeau, V.; Boe, J.; Chuine, I.; Delire, C.; Dufrêne, E.; François, C.; Gritti, E.S.; Legay, M.; Pagé, C.; et al. Climate change impacts on tree ranges: Model intercomparison facilitates understanding and quantification of uncertainty. Ecol. Lett. 2012, 15, 533–544. [Google Scholar] [CrossRef] [PubMed]
- Tulik, M.; Grochowina, A.; Jura-Morawiec, J.; Bijak, S. Groundwater Level Fluctuations Affect the Mortality of Black Alder (Alnus glutinosa Gaertn.). Forests 2020, 11, 134. [Google Scholar] [CrossRef]
- Szporak-Wasilewska, S.; Piniewski, M.; Kubrak, J.; Okruszko, T. What we can learn from a wetland water balance? Narew National Park case study. Ecohydrol. Hydrobiol. 2015, 15, 136–149. [Google Scholar] [CrossRef]
- Grabińska, B.; Szymczyk, S. Przyrodnicze i antropogeniczne uwarunkowania rozwoju koryta Narwi (wielkie zakole poniżej Różana) [Natural and anthropogenic conditions for the development of the Narew riverbed (the great bend below Różan)]. Inż. Ekol. 2012, 31, 27–37. [Google Scholar]
- Piela, M.; Kaczka, R.J. Przyrosty radialne dębu szypułkowego (Quercus robur L.) jako bioarchiwum stanów wody Wisły w Kotlinie Oświęcimskiej [Radial growths of pedunculate oak (Quercus robur L.) as a bioarchive of water levels on the Vistula River in the Oświęcim Basin]. Stud. Mater. CEPL Rogowie 2012, 14, 246–252. [Google Scholar]
- Okoński, B.; Koprowski, M.; Danielewicz, W.; Miler, A.T.; Kasztelank, A. Wykorzystanie lat wskaźnikowych do oceny wpływu reżimu rzecznego na warunki wzrostu drzew w dolinie Warty [Use of index years to assess the impact of the river regime on tree growth conditions in the Warta Valley]. Stud. Mater. CEPL Rogowie 2014, 16, 156–163. [Google Scholar]
- Wójcik, A.; Czajka, A.; Kaczka, R.J. Wpływ regulacji środkowego biegu Nidy na stan lasu łęgowego—Zapis procesu w przyrostach rocznych olszy czarnej Alnus glutinosa (L.) Gaertn. [The influence of the regulation of the middle reaches of the Nida on the condition of the riparian forest—A record of the process in the annual increments of the black alder Alnus glutinosa (L.) Gaertn]. Stud. Mater. CEPL Rogowie 2014, 16, 174–182. [Google Scholar]
- Zhou, H.; Chen, Y.; Hao, X.; Zhao, Y.; Fang, G.; Yang, Y. Tree rings: A key ecological indicator for reconstruction of groundwater depth in the lower Tarim River, Northwest China. Ecohydrology 2019, 12, e2142. [Google Scholar] [CrossRef]
- George, S.S.; Nielsen, E. Signatures of high-magnitude 19th-century floods in Quercus macrocarpa tree rings along the Red River, Manitoba, Canada. Geology 2000, 28, 899–902. [Google Scholar] [CrossRef]
- Malik, I.; Wistuba, M.; Stopka, R.; Trąbka, K. Rzeźbotwórcza rola wezbrań o różnej wielkości zapisana w anatomii drewna drzew, przykład z Hrubégo Jeseníka (Sudety Wschodnie) [The sculptural role of floods of various sizes recorded in the anatomy of tree wood, example from Hrubégo Jeseníka (Eastern Sudetes)]. Stud. Mater. CEPL Rogowie 2012, 30, 157–165. [Google Scholar]
- Copini, P.; den Ouden, J.; Robert, E.M.R.; Tardif, J.C.; Loesberg, W.A.; Goudzwaard, L.; Sass-Klaassen, U. Flood-Ring Formation and Root Development in Response to Experimental Flooding of Young Quercus robur Trees. Front. Plant Sci. 2016, 7, 775. [Google Scholar] [CrossRef] [PubMed]
- Gorzelak, A.; Sierota, Z. Stan Środowiska Leśnego w Dolinie Środkowej Odry po Powodzi w 1997 r. [The Condition of the Forest Environment in the Middle Odra Valley after the Flood in 1997]; IBL: Warsaw, Poland, 1999; pp. 8–29. [Google Scholar]
- Tulik, M.; Bijak, S. Are climatic factors responsible for the process of oak decline in Poland? Dendrochronologia 2016, 38, 18–25. [Google Scholar] [CrossRef]
- Elferts, D.; Dauðkane, I.; Ûsele, G.; Treimane, A. Effect of water level and climatic factors on the radial growth of black alder. Proc. Latv. Acad. Sci. 2011, 65, 164–169. [Google Scholar] [CrossRef]
- Rodríguez-González, P.M.; Campelo, F.; Albuquerque, A.; Rivaes, R.; Ferreira, T.; Pereira, J.S. Sensitivity of black alder (Alnus glutinosa [L.] Gaertn.) growth to hydrological changes in wetland forests at the rear edge of the species distribution. Plant Ecol. 2014, 215, 233–245. [Google Scholar] [CrossRef]
- Schilling, O.S.; Doherty, J.; Kinzelbach, W.; Wang, H.; Yang, P.N.; Brunner, P. Using tree ring data as a proxy for transpiration to reduce predictive uncertainty of a model simulating groundwater-surface water-vegetation interactions. J. Hydrol. 2014, 519, 2258–2271. [Google Scholar] [CrossRef]
- Gholami, V.; Chau, K.W.; Fadaee, F.; Torkaman, J.; Ghaffari, A. Modelling of groundwater level fluctuations using dendrochronology in alluvial aquifers. J. Hydrol. 2015, 529, 1060–1069. [Google Scholar] [CrossRef]
- van der Maaten, E.; van der Maaten-Theunissen, M.; Buras, A.; Scharnweber, T.; Simard, S.; Kaiser, K.; Lorenz, S.; Wilmking, M. Can We Use Tree Rings of Black Alder to Reconstruct Lake Levels? A Case Study for the Mecklenburg Lake District, Northeastern Germany. PLoS ONE 2015, 10, e0137054. [Google Scholar] [CrossRef] [PubMed]
- Tuovinen, M. Response of tree-ring width and density of Pinus sylvestris to climate beyond the continuous northern forest line in Finland. Dendrochronologia 2005, 22, 83–91. [Google Scholar] [CrossRef]
- Cedro, A.; Lamentowicz, M. Contrasting responses to environmental changes by pine (Pinus sylvestris L.) growing on peat and mineral soil: An example from a Polish Baltic bog. Dendrochronologia 2011, 29, 211–217. [Google Scholar] [CrossRef]
- Kowalewski, Z.; Stankiewicz, J.; Kierasiński, B. Kształtowanie się stanów wód w dolinie Narwi na granicy Narwiańskiego Parku Narodowego i w jego strefie buforowej [Water levels in the Narew river valley at the border of the Narwiański National Park and its buffer zone]. Woda Sr. Obsz. Wiej. 2014, 14, 27–40. [Google Scholar]
- Mioduszewski, W.; Napiórkowski, J.; Okruszko, T. Wody Narwiańskiego Parku Narodowego [Waters of the Narew National Park]. In Narwiański Park Narodowy—Krajobraz, Przyroda, Człowiek; Banaszuk, P., Wołkowycki, D., Eds.; Narew National Park: Białystok, Poland, 2016; pp. 51–64. [Google Scholar]
- Cook, E.R.; Kairiukstis, L.A. Methods of Dendrochronology: Applications in the Environmental Sciences; Kluwer Academic Publishers: Boston, MA, USA, 1990; pp. 23–50. [Google Scholar]
- Zielski, A.; Krąpiec, M. Dendrochronologia, 1st ed.; [Dendrochronology]; Wydawnictwo Naukowe PWN: Warszawa, Poland, 2004; pp. 131–156. [Google Scholar]
- Olesiak, A.; Tomusiak, R.; Kędziora, W.; Wojtan, R. Charakterystyka dendrochronologiczna drzew rosnących na wydmach nadmorskich [Dendrochronological characteristics of trees growing on coastal dunes]. Stud. Mater. CEPL Rogowie 2014, 16, 211–219. [Google Scholar]
- Au, T.F.; Maxwell, J.T.; Robeson, S.M.; Li, J.; Siani, S.M.; Novick, K.A.; Dannenberg, M.P.; Phillips, R.P.; Li, T.; Chen, Z.; et al. Younger trees in the upper canopy are more sensitive but also more resilient to drought. Nat. Clim. Change 2022, 12, 1168–1174. [Google Scholar] [CrossRef]
Disclaimer/Publisher’s Note: The statements, opinions and data contained in all publications are solely those of the individual author(s) and contributor(s) and not of MDPI and/or the editor(s). MDPI and/or the editor(s) disclaim responsibility for any injury to people or property resulting from any ideas, methods, instructions or products referred to in the content. |
© 2024 by the authors. Licensee MDPI, Basel, Switzerland. This article is an open access article distributed under the terms and conditions of the Creative Commons Attribution (CC BY) license (https://creativecommons.org/licenses/by/4.0/).