Article

Effects of Forest Conversion on the Stocks and Stoichiometry of Soil Carbon, Nitrogen, and Phosphorus at a County Scale in Subtropical China

College of Ecology and Resource Engineering, Wuyi University, Wuyishan 354300, China
*
Author to whom correspondence should be addressed.
Forests 2024, 15(9), 1515; https://doi.org/10.3390/f15091515 (registering DOI)
Submission received: 12 July 2024 / Revised: 23 August 2024 / Accepted: 26 August 2024 / Published: 29 August 2024
(This article belongs to the Section Forest Soil)

Abstract

:
The decline in primary natural forests worldwide has intensified research on the effects of forest transformation on soil carbon (C), nitrogen (N), and phosphorus (P) cycles and stocks. However, the extent to which soil C, N, and P stocks and stoichiometry are affected by forest conversion remains unclear. Here, we examined the effects of forest transformation on soil nutrient storage capacity and stoichiometric characteristics in native broadleaf forests (BFs), plantation forests (PFs), tea gardens (TGs), cultivated lands (CLs), and urban artificial green spaces (GSs) at a county scale in subtropical China. The results showed that the other forest types exhibited significantly reduced soil C and N contents and stocks but increased soil P content and stock compared to BFs. The soil C:N:P stoichiometric ratios for BFs and the converted PFs, TGs, GSs, and CLs were sequentially decreased as follows: 444.8:24.2:1, 95.0:10.0:1, 30.2:3.9:1, 23.1:3.7:1, and 19.4:1.9:1, respectively. Within the altitude (AL) span of 180 to 1200 m surveyed, the AL decided the type of forest conversion and significantly influenced the stock levels and stoichiometric ratios of soil C, N, and P. The results of this study highlight the importance of the ecological management of TGs and the optimization of soil P production in CLs, TGs, and GSs.

Graphical Abstract

1. Introduction

Carbon (C), nitrogen (N), and phosphorus (P) are fundamental primary elements of biological ecosystems that play crucial roles in the regulation of plant growth, nutrient supply, and energy cycling [1]. These elements serve as the principal structural components and nutrients within the soil, and their contents and stocks reflect the soil’s capacity to provide nutrients to vegetation as well as determine the stability of the flow of matter and energy in the ecosystem [2]. The interaction among soil C, N, and P can be represented by the ecological C:N:P stoichiometry, which is driven by changes in their contents and stocks. These changes affect the structure and function of the ecosystem [1]. Soil C:N:P stoichiometry is widely recognized as an important indicator of soil fertility and plant nutrient status in terrestrial ecosystems [1,2]. In general, a lower soil C:N or C:P ratio indicates a faster mineralization rate of N or P, which in turn implies a greater availability of N or P to plants [3,4]. Consequently, the quantitative analysis of changes in soil C, N, and P stocks and stoichiometry can provide a theoretical framework for evaluating the C, N, and P pools of terrestrial ecosystems and ecosystem stability [1].
Forests are the mainstay of terrestrial ecosystems and represent the Earth’s most important carbon stores [5]. With the development of forestry activities, agricultural expansion, and urbanization, the trend of clearing natural forests and shifting toward monoculture plantations is increasing worldwide [6,7,8,9]. Forest conversion, as a major form of land use change, is a key driver of global ecological transformation, nutrient cycling, and climate change [10,11]. Forest conversion alters vegetation types and community structures as well as changes the physical, chemical, and biological properties of the soil, which in turn affects the mineralization rate and decomposition potential of soil organic matter, ultimately leading to changes in soil C, N, and P stocks and stoichiometry [10,11,12,13,14]. The conversion of natural forests to plantation forests or secondary forests leads to changes in the contents and stocks of C, N, and P in the soils [1,10]. In particular, soil nutrition at 0–10 cm depth exhibits a heightened sensitivity to forest conversion compared to the other depths [1,10]. Previous studies have shown that after forest conversion, the surface soil C and N contents of various monoculture plantations (e.g., tea trees, peaches, and loquats) and the C:N:P ratio are decreased, whereas the P content is significantly increased [6,10]. In addition, agricultural practices can disrupt the balance of soil C, N, and P, leading to the decoupling of C, N, and P cycles in agricultural soil (dryland and paddy fields) and a decline in stoichiometric ratios [1,15,16]. The effects of changes in soil C, N, and P stoichiometry under different types of forest conversion and agricultural practices are not the same [10,17,18]. However, the details of how C, N, and P stocks and stoichiometry ratios in the soils change under different types of forest conversion and then different agricultural practices remain unclear [10].
In China, subtropical forests account for 33% of the global subtropical forest area and constitute 67% of the total national forest area [19]. Several studies have examined the status of soil C, N, and P following forest conversion in these areas, but these studies have typically been conducted at the site or regional scale [18,19,20,21]. Site-scale studies tend to focus on a limited number of plots, which can lead to certain limitations in the research findings [1,18,19,20,21]. Although regional-scale studies usually involve a larger number of plots, they may overlook the differential impacts of complex environmental factors at broader scales, such as lithology, topography, soil types, and climate [8,10,12,22,23]. Conversely, there remains a lack of studies at the county scale; such studies are beneficial as they account for more stable environmental factors and a sampling area that is statistically representative [18], especially in mountainous and hilly areas with large altitude (AL) changes [3]. Wuyishan City, characterized by typical subtropical mountainous and hilly regions, is one of the most ecologically fragile areas in China. It is home to one of the best-preserved and largest typical subtropical forest ecosystems in the world and is a premier tea-producing region [24,25]. This area has experienced significant transformation due to socioeconomic development, intensive timber harvesting, large-scale plantation forestry, and tea gardens (TGs) expansion, which has resulted in a sharp decline in the extent of native natural forests [7,26]. In recent years, with the promotion of national farming and ecological policies, both cultivated lands (CLs) and urban artificial green spaces (GSs) have been further protected and developed, resulting in an annual increase in the GSs area. Nevertheless, there is a lack of understanding of the response mechanisms of soil C, N, and P stocks and stoichiometry to different types of forest conversion.
In this study, we tested two hypotheses: (1) soil C, N, and P stocks and stoichiometric ratios are significantly impacted by forest conversion; and (2) the AL gradient essentially determines the type of forest conversion and affects soil properties, as well as the content and ratios of C, N, and P. Therefore, the present study aimed to (1) quantify C, N, and P contents and stocks in the soils from different types of forest conversion; (2) compare changes in C, N, and P stoichiometry in the soils under different types of forest conversion; and (3) identify factors (including AL) that affect changes in C, N, and P stocks and ratios in soils. The findings of this study are expected to provide a scientific basis for the nutrient cycling of forest ecosystems and the management of forest conservation.

2. Materials and Methods
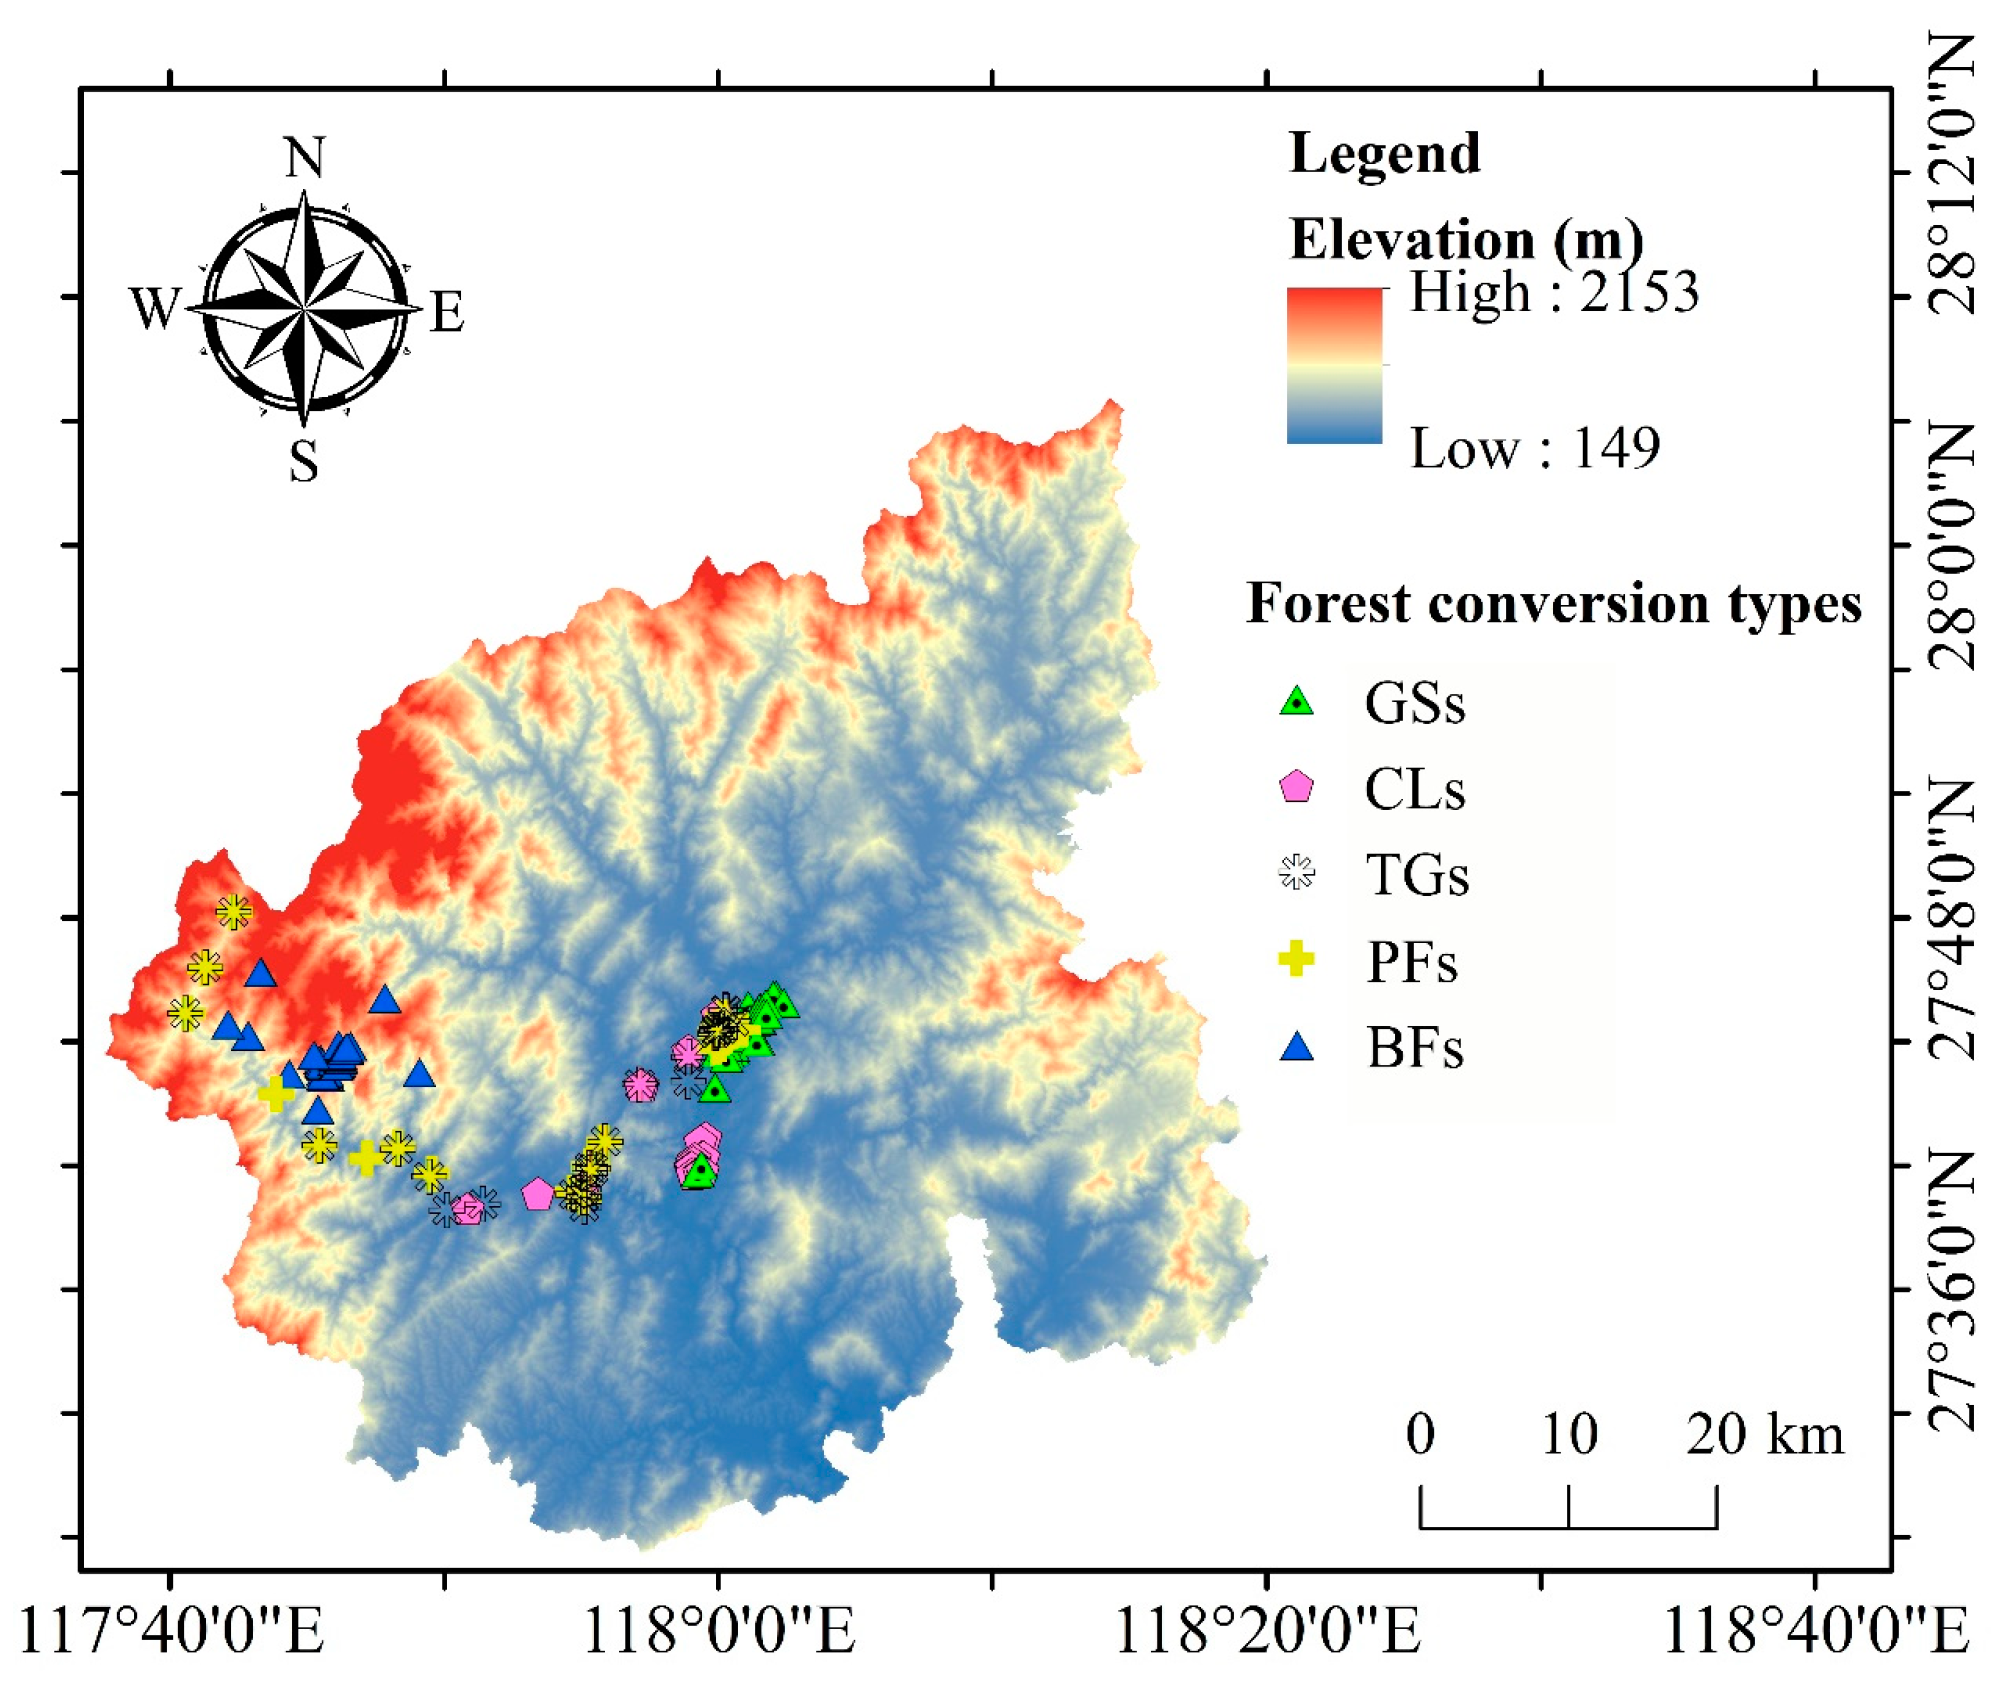
2.1. Study Area

Wuyishan City is a county-level city and is located in southeastern China. It experiences an average annual precipitation of 1960 mm and an average annual temperature of 17–19 °C. The city’s varied topography, with elevations ranging from 149 to 2153 m, is characterized by a distinctive vertical zonation of vegetation [21]. The city possesses a forest cover of approximately 80.5%, with an existing TGs area of 98.67 km2. Due to the abundant and concentrated rainfall, the steep terrain, and the vulnerability of the soil quality and vegetation to degradation, it has become a key region for global biodiversity conservation [17]. The zonal vegetation of the study area is evergreen broad-leaved forest, which is mainly distributed in the AL range of 800–1100 m. The parent rocks are primarily granite (mainly distributed below 1500 m in the mountains) and volcanic rocks (in the upper part of the mountains), with a small number of metamorphic rocks [27]. The terrain of the study area varies greatly, resulting in a distinct vertical zonation of the soil, including laterite (below 700 m), yellow-red soil zone (700–1100 m), and yellow soil (1100–1800 m) [27]. Laterite is the most widely distributed soil in this area (approximately 75%), and its parent material is mainly coarse-grained granite, with strong chemical weathering. The parent material of yellow-red soil primarily consists of coarse-grained granite, functioning as a transition from yellow soil to laterite. The parent material of yellow soil is mainly volcanic rock, along with a small amount of slope deposits or residual materials from the weathering of granitic rocks. In addition, the combined effects of natural and human activities have influenced the main genetic processes of the soils to a certain extent.

2.2. Experimental Design and Sampling

In this study, we selected primary native broadleaf forests (BFs) and four types of forest conversion for examination: plantation forests (PFs), TGs, CLs, and GSs. BFs consist of evergreen BFs dominated by Castanopsis and Lithocarpus and are unfertilized and unharvested. PFs include Chinese fir forests, Masson pine forests, and bamboo forests, all of which receive a small amount of N fertilizer or compound fertilizer and remain largely uncut. TGs are dominated by black tea and rock tea plantations, with tea harvested in April–May each year. The CLs category includes paddy fields and vegetable fields, whereas the GSs category comprises grasslands in parks, along roads, and in residential areas. CLs and GSs are harvested according to the growing season of different plants. The latter three forest conversion types apply mainly N and P fertilizers or complex fertilizers.
From July to August 2022, plots with similar or identical soil parent material were selected based on the distribution of the forest conversion types in different plot types (Figure 1). We selected yellow-red soil and lateritic soil with predominant parent material for coarse-grained granite from 180 to 1200 m. In total, 152 plots (52 BFs, 22 PFs, 25 TGs, 18 CLs, and 35 GSs) were included in this investigation. An area of 20 m × 20 m with homogenous and typical vegetation was marked out in each plot, then this area was divided into four smaller plots of 10 m × 10 m [21]. In each subplot, three points were randomly selected for soil sampling at a depth of 0–20 cm, which were combined into one mixed soil sample. Therefore, the number of mixed soil samples was the same as the number of plots. In addition, soil core samples from each subplot were collected at a depth of 5–15 cm using a standard soil corer with a volume of 100 cm3. A total of 4 soil core samples were taken from each plot, totaling 608 samples. During the sampling process, information such as land use type, vegetation type, AL, and the geographic coordinates of each plot was recorded (Table S1).

2.3. Soil Testing

Soil core samples were taken along the diagonals of the four subplots and directly measured for soil water content (WC) and bulk density (BD) [11]. Subsequently, gravel (particles greater than 2 mm) in the mixed surface soil samples and plant roots were carefully removed and the samples were left to air-dry. Then, the samples were sifted through a 2 mm mesh (gravel samples on the sieve were minimal and could be ignored [1]) for soil particle size analysis or further milled and sieved through a 0.149 mm sieve for the determination of the levels of soil organic C (SOC), total N (TN), and total P (TP). The soil particle size was determined using the wet method with a laser particle size analyzer (Bettersize2600E, Dandong Bettersize Instruments Co., Ltd., Dandong, China) in accordance with the standard particle size classification of clay (<0.002 mm), silt (0.05–0.002 mm), and sand (2.0–0.05 mm). The contents of SOC, TN, and TP were sequentially determined using conventional methods, including the dichromate volumetric method, alkaline potassium persulfate digestion, ultraviolet spectrophotometry, and molybdenum spectrophotometry [28]. To ensure the accuracy of the experimental results, the mean value of three replicate experimental results for each mixed soil sample was taken as the measured statistical value. The WC and BD were represented by the mean of two soil core tests.

2.4. Statistical Analysis

The SOC, TN, and TP stocks were determined using the methods described in Equations (1)–(3) [10,29]:
Soil   SOC   stock   ( Cs )   ( Mg / ha ) = C SOC × B D × H 10
Soil   TN   stock   ( Ns )   ( Mg / ha ) = C TN × B D × H 10
Soil   TP   stock   ( Ps )   ( Mg / ha ) = C TP × B D × H 10
where CSOC, CTN, and CTP represent the SOC, TN, and TP contents (g/kg); BD represents the soil bulk density in grams per cubic centimeter (g/cm3); and H represents the soil depth (20 cm).
The digital AL data was taken from Google Earth (resolution, 4 m), and the map was generated using Geographic Information System software (ArcGIS 10.7, Esri, Redlands, CA, USA). Based on the latitude and longitude information of each plot, a schematic diagram of the soil sampling points was created using ArcMap 10.8 software (Esri, Redlands, CA, USA). The primary data were analyzed without any transformation. Microsoft Excel 2019 (Microsoft Corporation, Redmond, WA, USA) was used to conduct a descriptive statistical analysis of the data. SPSS 27 software (SPSS Inc., Chicago, IL, USA) was employed to perform univariate analysis of variance (ANOVA) (p < 0.05) for soil C, N, and P contents, stocks, and stoichiometric ratios. Correlation heatmaps between the basic physicochemical properties of the soil were constructed using GraphPad Prism 5 (GraphPad Software. Inc., La Jolla, CA, USA) and Origin 2021 (Origin Lab. Inc., Northampton, MA, USA). Redundancy analysis (RDA) was conducted using the Canoco 5.15 (Shanghai Cabit Information Technology Co., Ltd., Shanghai, China) to identify the key factors influencing soil C, N, and P stocks and stoichiometric ratios. During RDA, explanatory factors exhibiting clear collinearity trends were removed to ensure the accuracy of the model operation. Logarithmic normalization was also performed on the variables to mitigate the impact of dimensional differences on the results, facilitating a better measure of the contribution of explanatory variables to the constraint axis through the absolute value of the canonical coefficient (the regression coefficient of the model).

3. Results

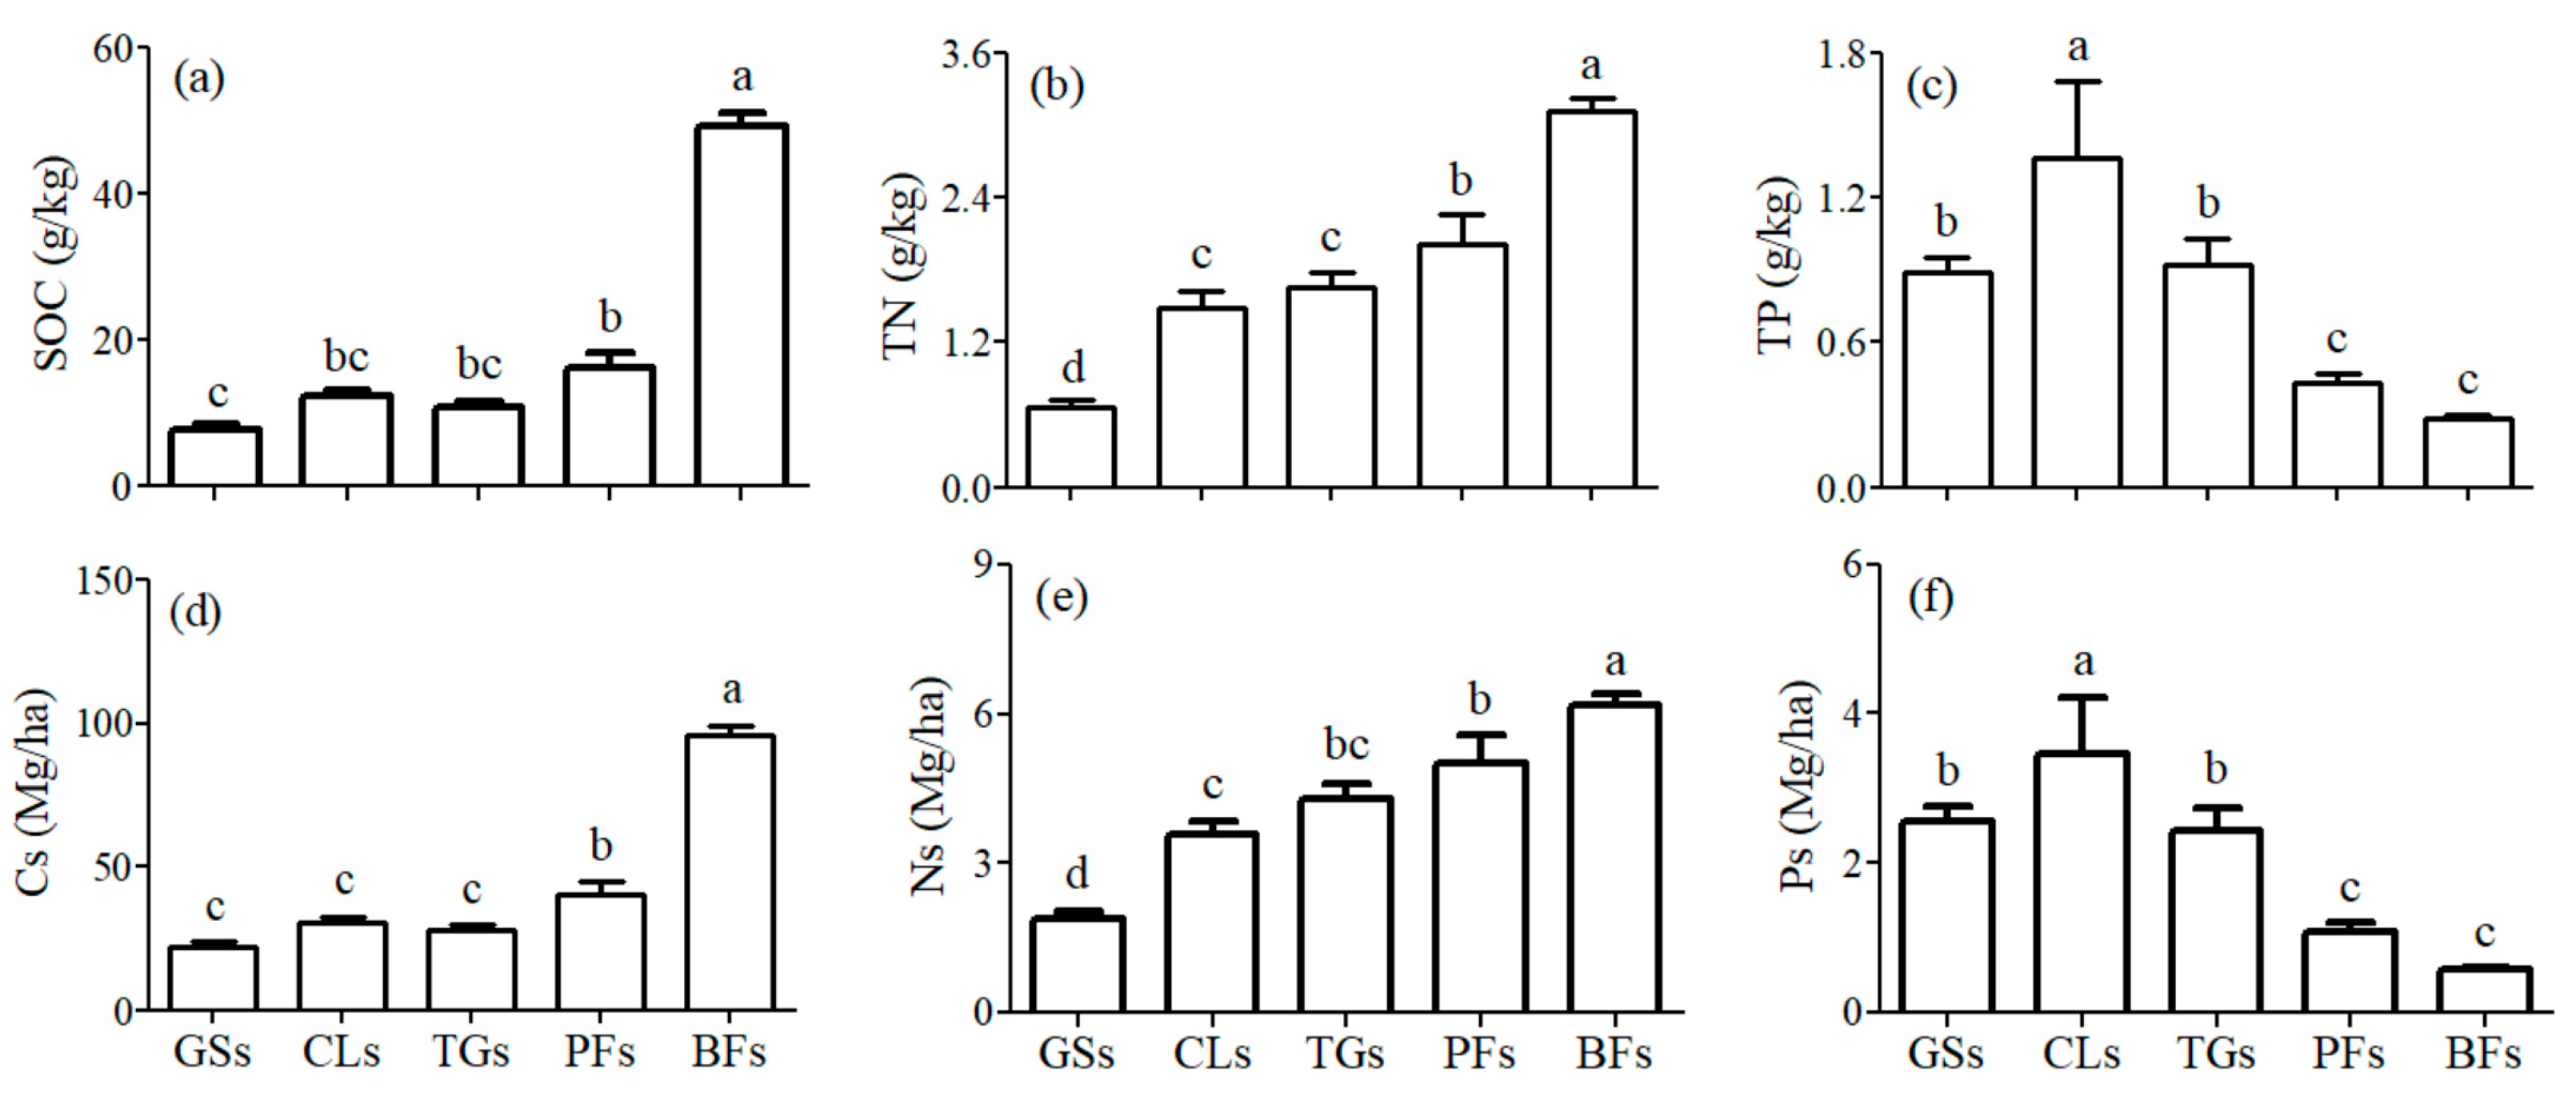
3.1. Distribution of Soil C, N, and P Contents and Stocks

Forest conversion significantly affected the distribution of soil C, N, and P contents and stocks (p < 0.01) (Figure 2a–f). The average SOC and TN contents and stock levels across different forest conversion types followed the order of BFs > PFs > TGs, CLs > GSs. In contrast, the average TP content and stock levels followed the order of CLs > TGs, GSs > PFs > BFs.
The mean values of SOC and TN contents in BFs were 49.11 ± 14.68 g/kg and 3.12 ± 0.80 g/kg, respectively (Figure 2a,b). The mean SOC contents in PFs, TGs, CLs, and GSs were 33.1%, 21.9%, 25.1%, and 15.9%, respectively (Figure 2a), whereas the mean TN contents in these areas were 64.7%, 52.9%, 47.8%, and 21.5%, respectively (Figure 2b). CLs soil exhibited the highest TP content, at 1.37 ± 1.34 g/kg (Figure 2c). GSs and TGs showed TP contents of 0.89 ± 0.38 and 0.92 ± 0.55 g/kg, respectively (Figure 2c). The lowest TP content was observed in BFs soil (0.29 ± 0.10 g/kg) (Figure 2c).
The mean SOC stock (Cs) in GSs, CLs, and TGs were closely comparable, at 22.16 ± 10.83, 30.37 ± 9.29, and 28.04 ± 9.95 Mg/ha, respectively (Figure 2d). These values were all lower than the Cs in PFs and BFs (40.25 ± 20.57 and 95.79 ± 22.97 Mg/ha, respectively) (Figure 2d). The mean TN stock (Ns) in BFs soil was 6.17 ± 1.56 Mg/ha, which was significantly higher than the Ns in PFs (4.99 ± 2.71 Mg/ha), TGs (4.30 ± 1.52 Mg/ha), CLs (3.58 ± 1.06 Mg/ha), and GS(1.90 ± 0.89 Mg/ha) soils (Figure 2e). In terms of soil TP stock (Ps), CLs soil demonstrated a significantly higher mean value of 3.46 ± 3.22 Mg/ha than GSs (2.56 ± 1.21 Mg/ha), TGs (2.44 ± 1.49 Mg/ha), PFs (1.09 ± 0.49 Mg/ha), and BFs (0.57 ± 0.21 Mg/ha) (Figure 2f).

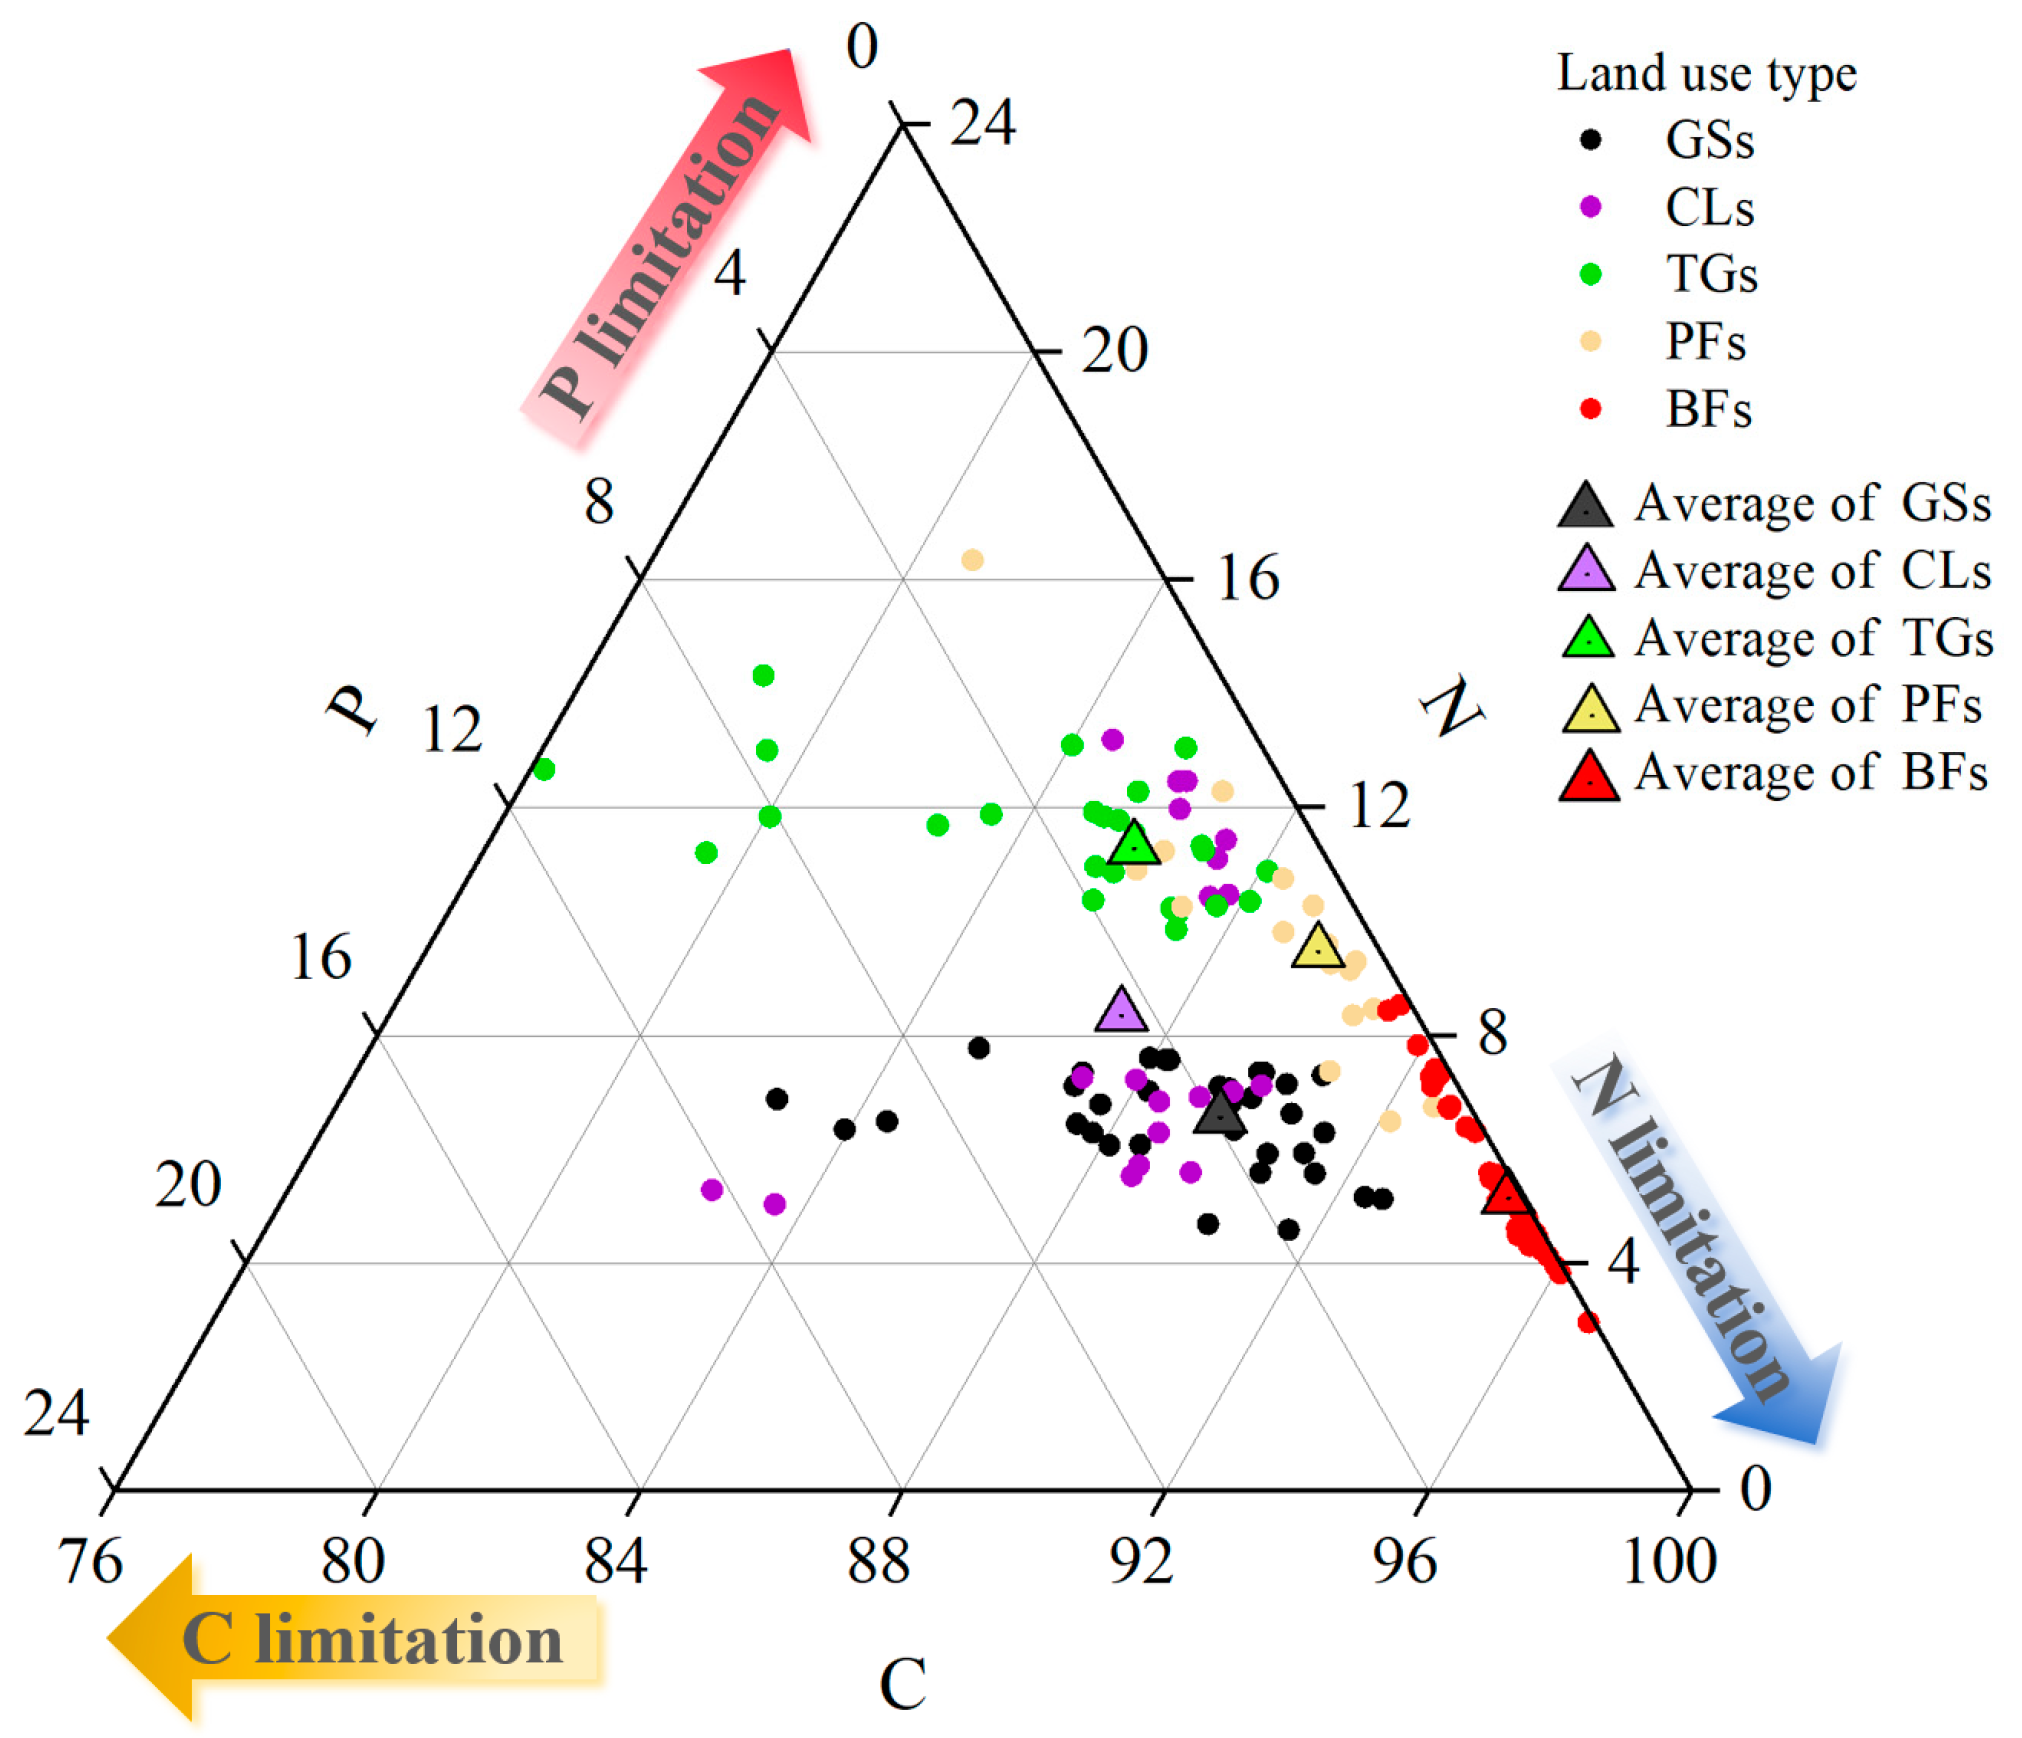
3.2. Variations in Soil C, N, and P Stoichiometry

The soil C:N ratio in BFs (18.7 ± 0.6) was significantly higher than that in GSs (13.7 ± 0.5), CLs (10.3 ± 0.8), PFs (9.5 ± 0.4), and TGs (7.6 ± 0.2) (Figure 3a). The soil C:P and N:P ratios in BFs and PFs were higher than those in the other three types of forest (Figure 3b). Both the C:P and N:P ratios displayed similar distribution patterns (BFs > PFs > TGs, CLs > GSs) (Figure 3c).
The average C:N:P of the soils was 88.3:6.0:1 (Figure 4). BFs soil showed the broadest range of C:N:P ratios (from 360.3:30.7:1 to 1033.8:31.6:1) (Figure 4). The results indicated that when BFs were converted to PFs, TGs, GSs, or CLs, the soil C:N:P ratios decreased in the following order: 95.0:10.0:1, 30.2:3.9:1, 23.1:3.7:1, and 19.4:1.9:1.

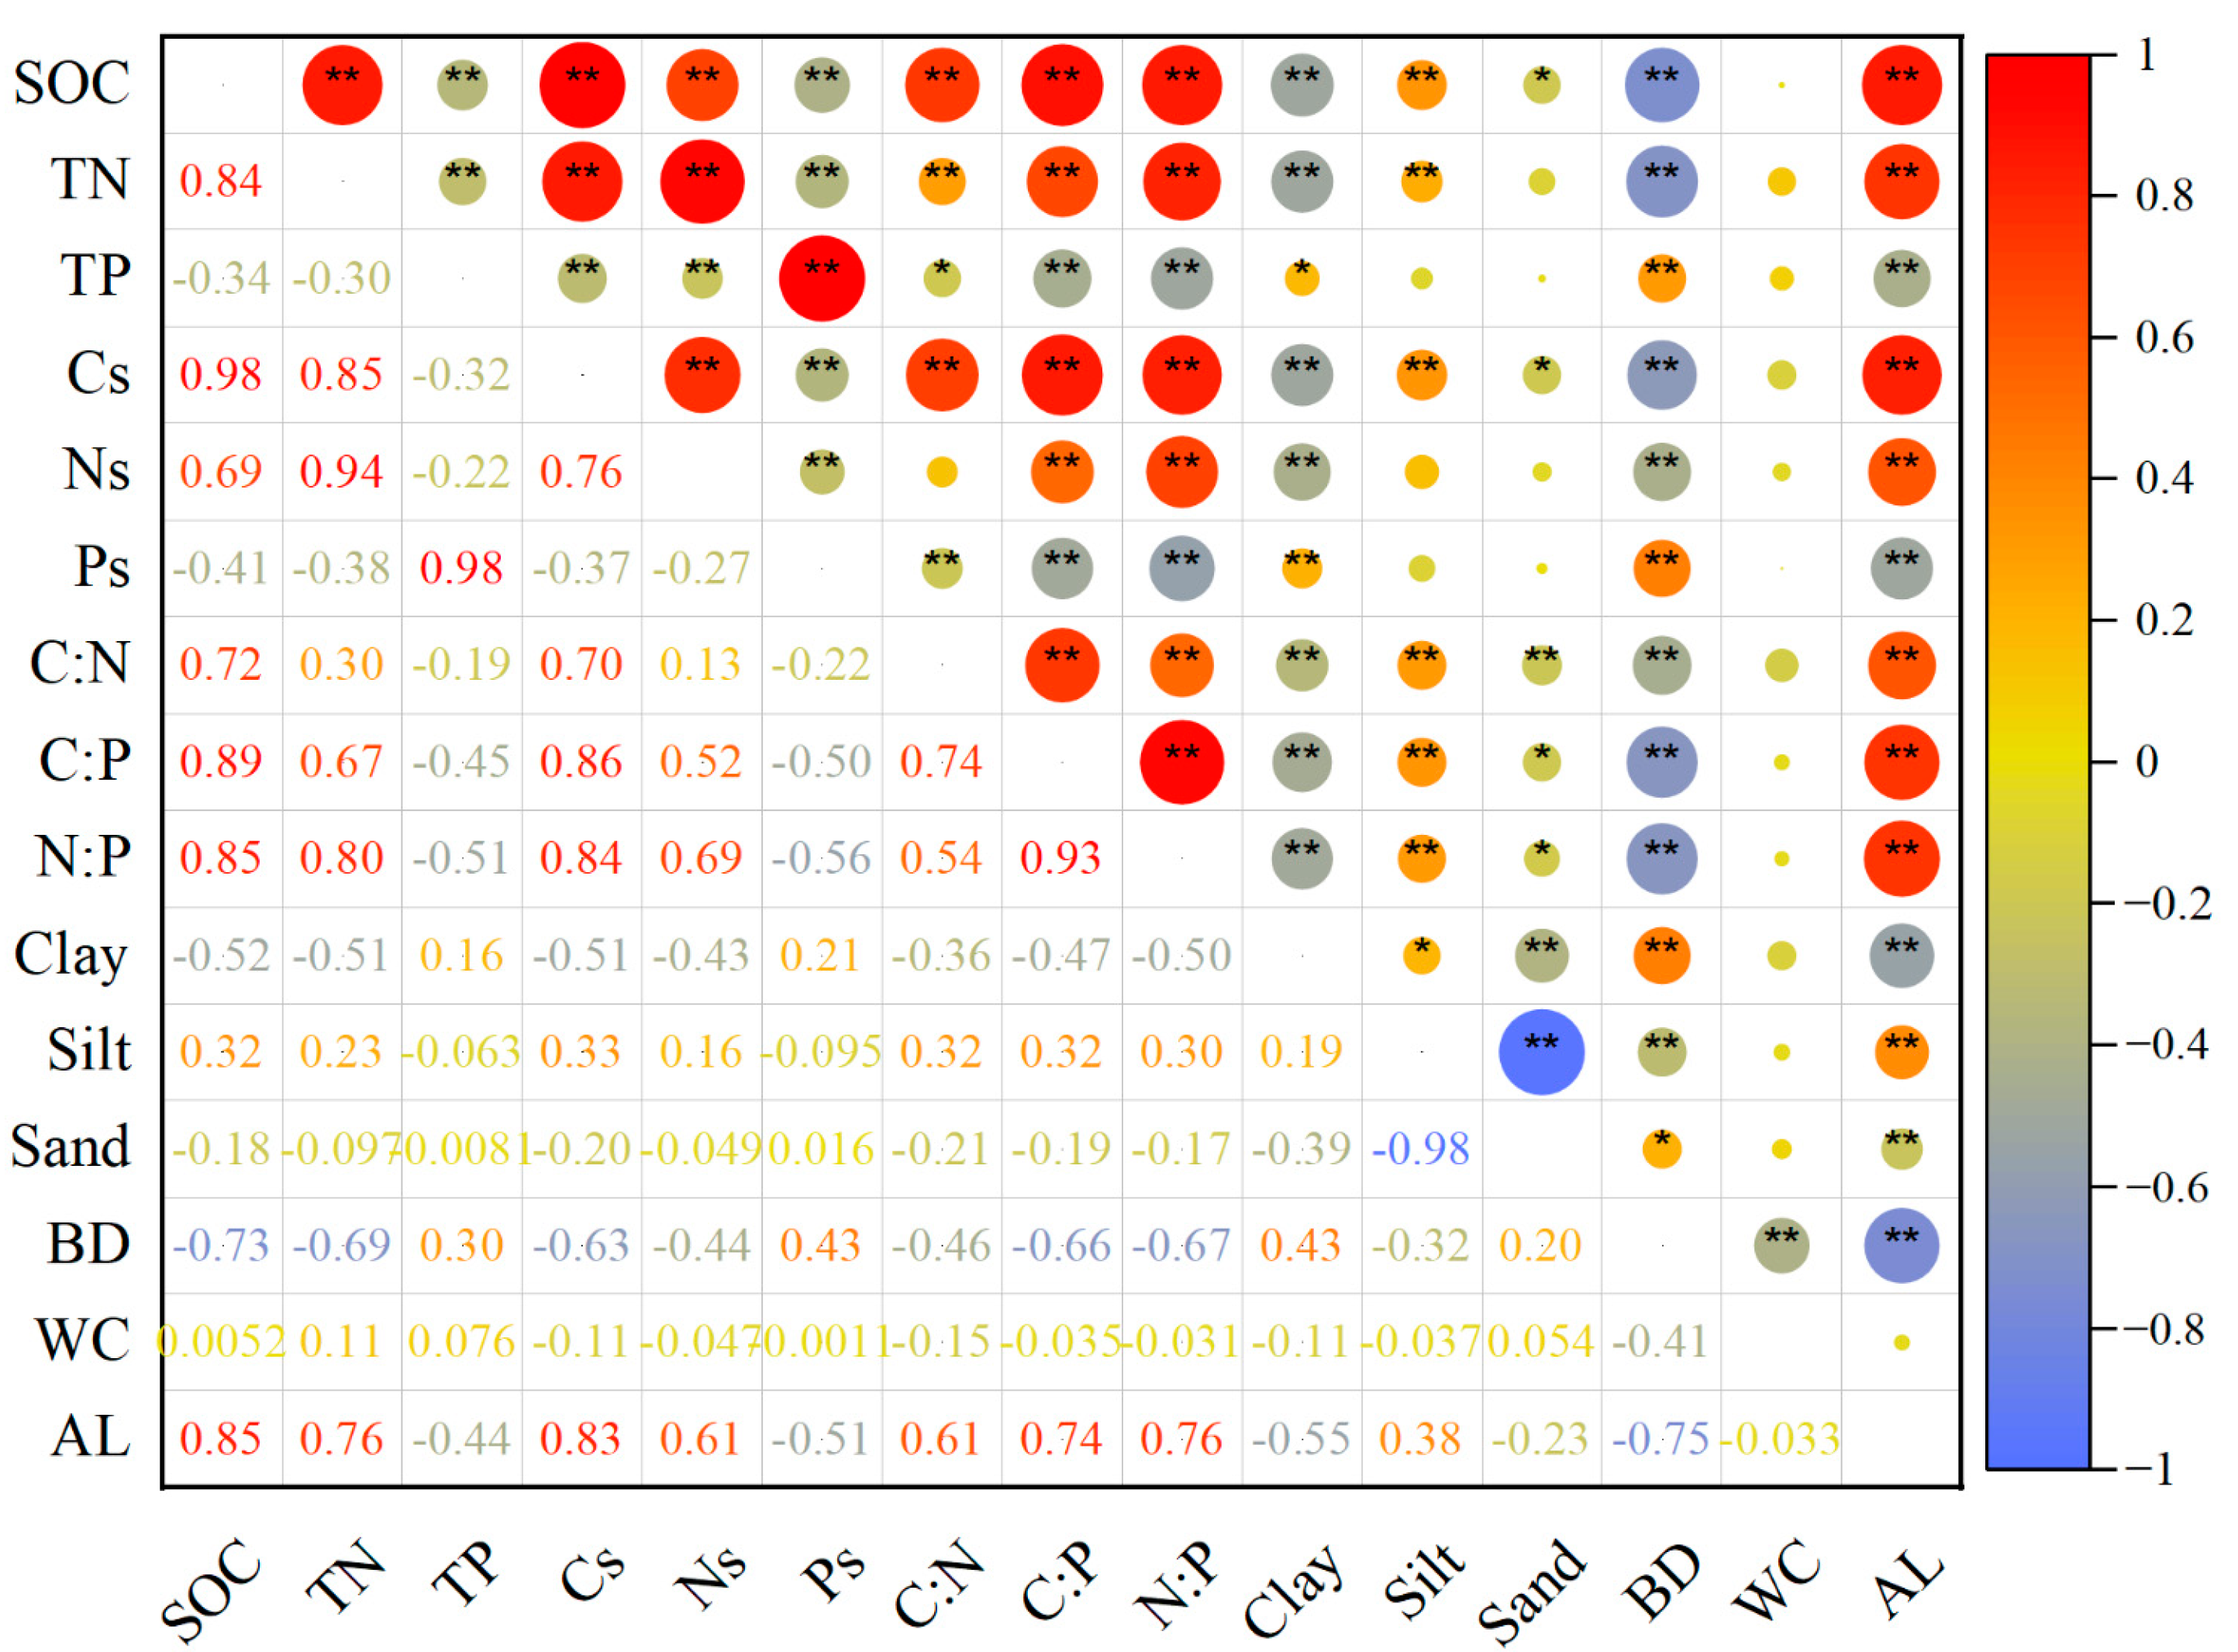
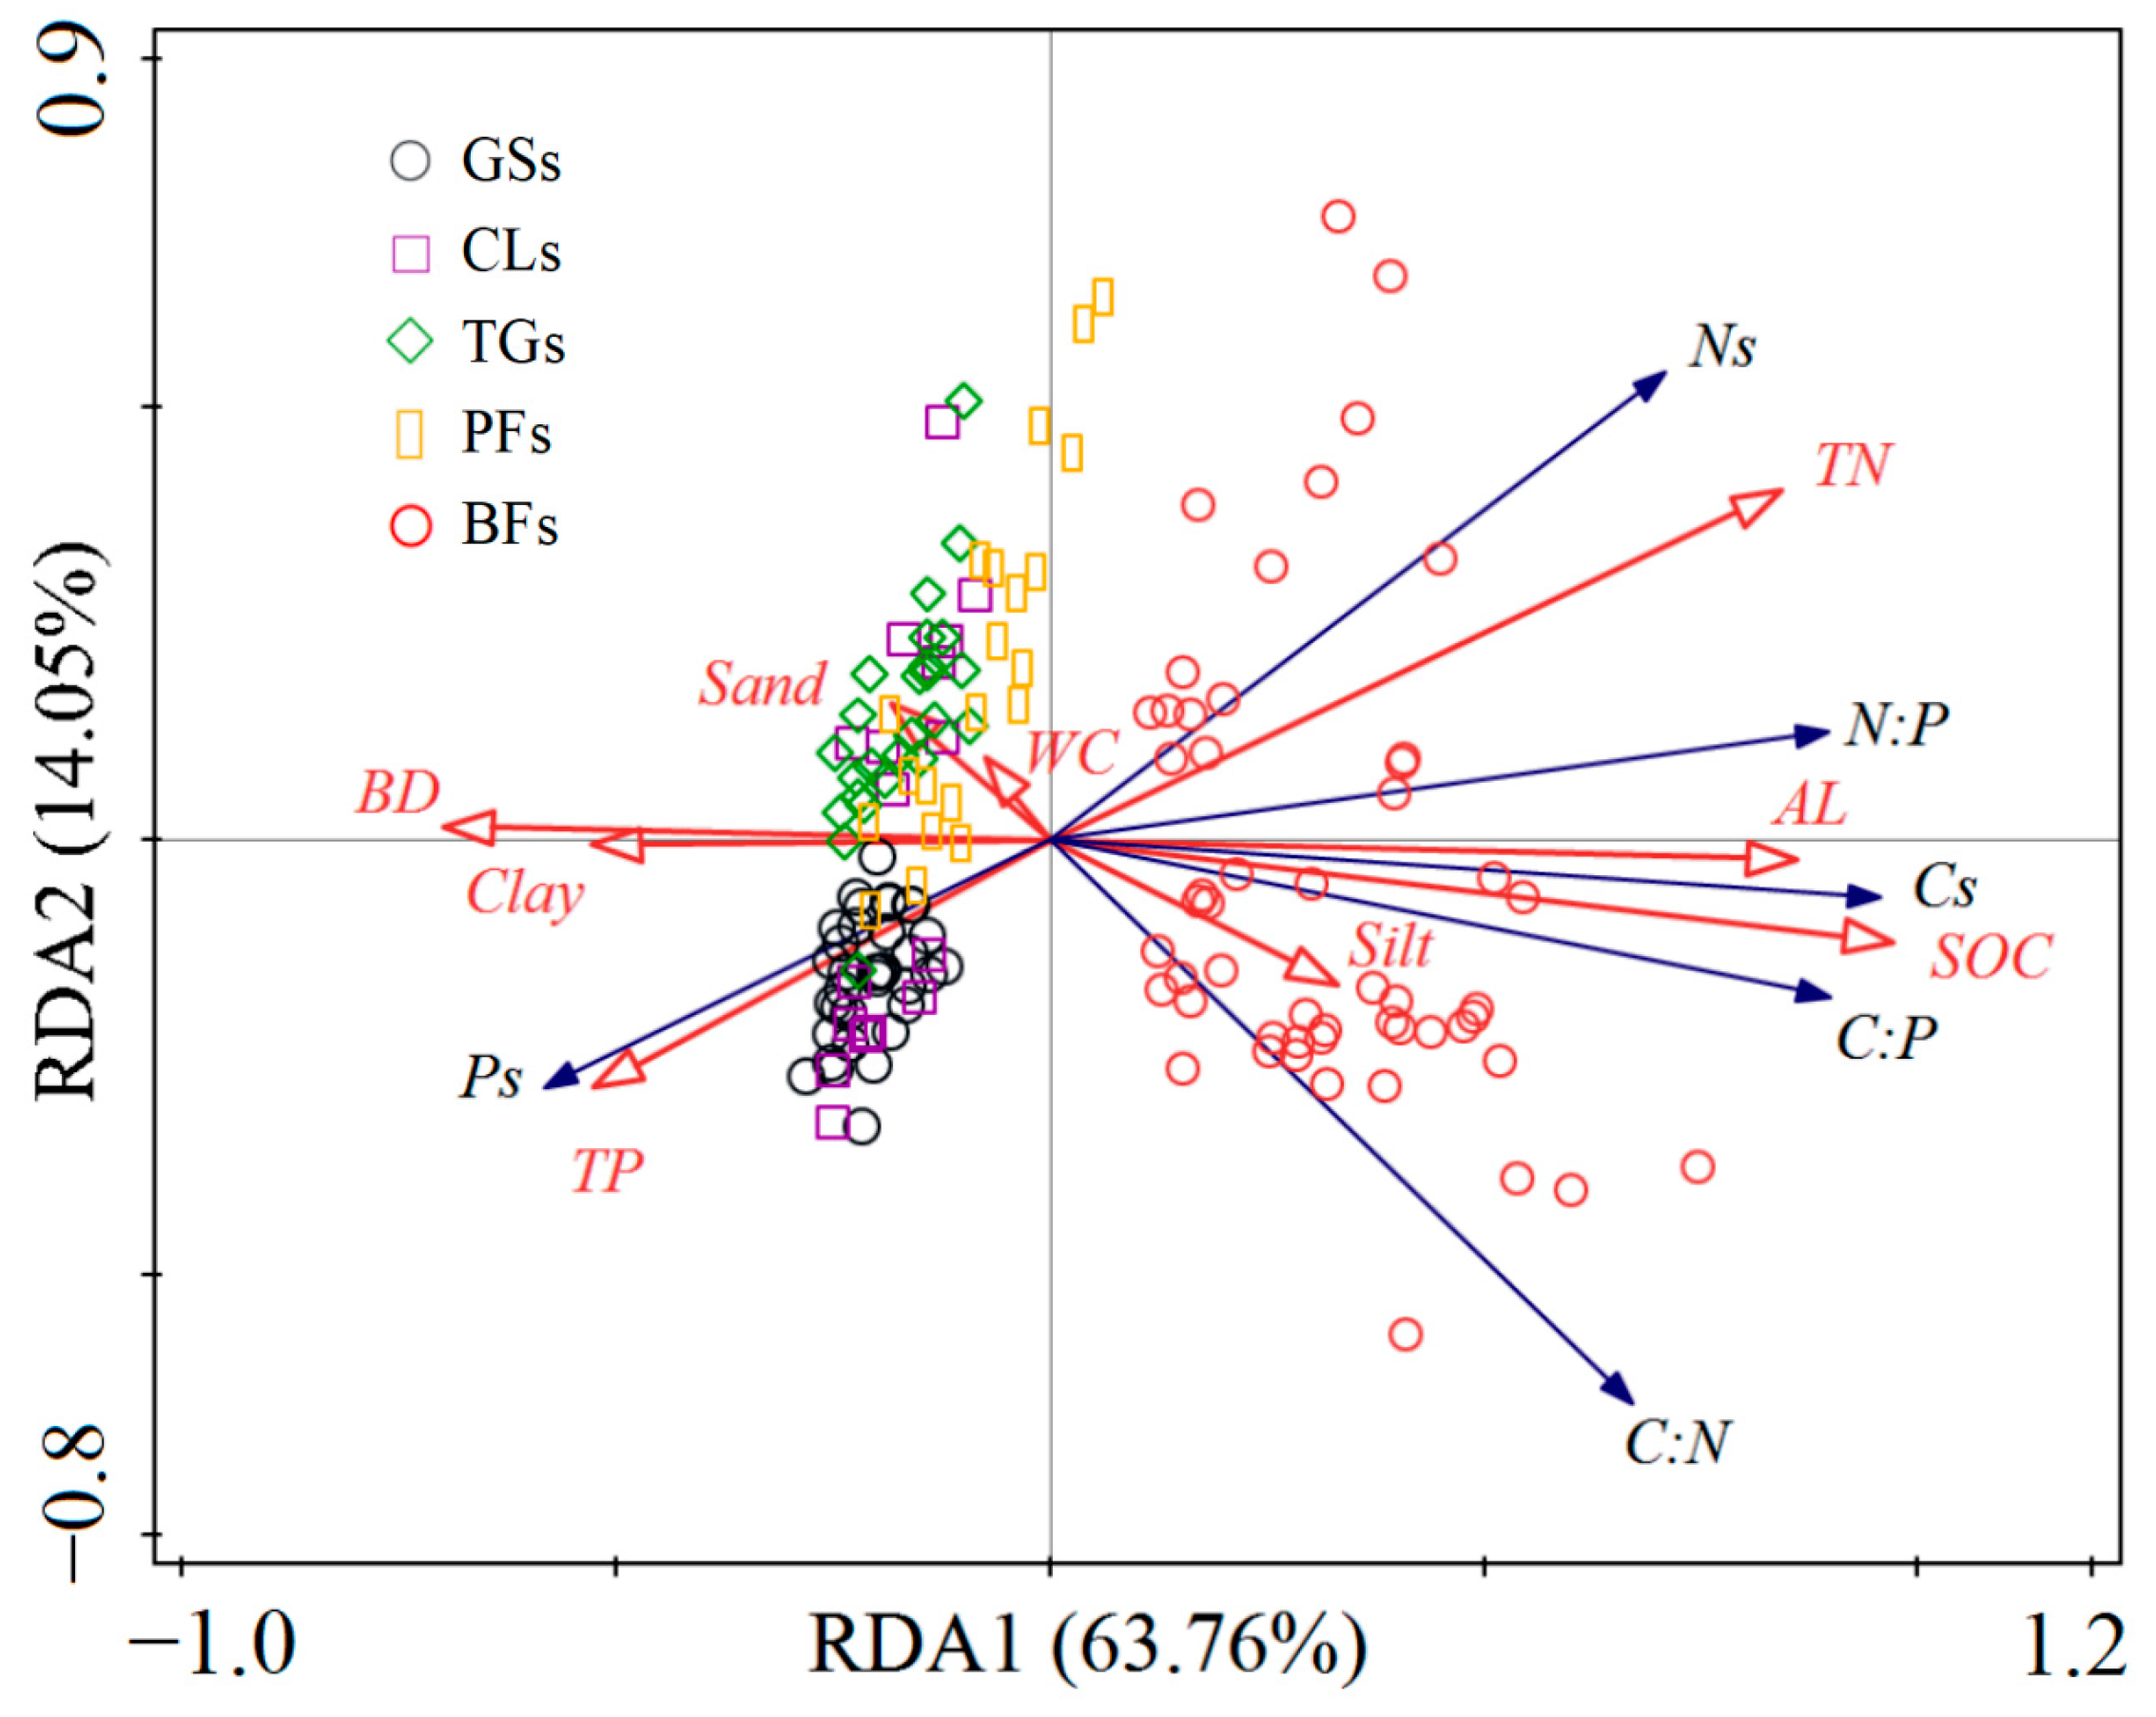
3.3. Key Factors Affecting Soil C, N, and P Stocks and Stoichiometry

In this study, a significant positive correlation was observed between the Cs and Ns for all soil samples, with a correlation coefficient of 0.76 (Figure 5). Both Cs and Ns were significantly and positively correlated with SOC, TN, C:P, N:P, and AL (p < 0.01), whereas they were negatively correlated with clay content and BD (p < 0.01). Furthermore, the correlation coefficient between Cs and the C:N ratio was 0.70 (p < 0.01). Ps was significantly positively correlated with TP and BD (p < 0.01) and significantly negatively correlated with SOC, TN, C:P, N:P, Cs, Ns, and AL (p < 0.01). Moreover, C:N, C:P, and N:P were significantly positively correlated with each other (p < 0.01), especially C:P and N:P (correlation coefficient: 0.93). These three ratios also showed a significant positive correlation with SOC and AL (p < 0.01) and a significant negative correlation with clay content and BD (p < 0.01). Furthermore, C:P and N:P showed a significant positive correlation with TN (p < 0.01).
The RDA results showed that the first and second axes accounted for 63.76% and 14.05% of the total variance, respectively (Figure 6). SOC emerged as the most significant contributor, accounting for 66.1% of the total variance (p = 0.002) (Figure 6). TN and TP also made notable contributions, at 14.6% and 16.0%, respectively (p = 0.002) (Figure 6).

4. Discussion

4.1. Responses of Soil C, N, and P Contents and Stocks to Forest Conversion

Soil nutrient contents and stocks markedly exhibit significant differences among various vegetation coverage types [18]. This study demonstrated a notable decline in the contents and stocks of SOC and TN and a substantial increase in the content of stock of TP after forest conversion (Figure 2c,f). These results were consistent with previous studies [6], but do not support other reports [16,18,23]. For instance, the C content of the agricultural soils (paddy and upland) in Ningbo City is 1.74 times higher than woodland soils [11]. Furthermore, the content of C, N, and P in the subtropical paddy soils of eastern China also increases by 5.8, 0.9, and 0.3 g/kg compared to the woodland soils, respectively [16]. In Hangzhou City, China, the soil C content experienced a dynamic transition following the conversion of BFs to TGs: an initial decline within the first 10 years, a subsequent recovery by 40 years, and a notable increase by 100 years. Concurrently, the N content exhibited a steady upward trend [7]. The conversion of BFs to PFs or other monoculture plantations significantly reduced the contents and stocks of C, N, and P in the topsoil (0–20 cm) in southern China [10,23]. Therefore, comprehensively considering the changes in soil C, N, and P contents and stocks in the context of both forest conversion and agricultural practices is necessary at the county scale and small regional scale [18].
In this study, BFs were found to have higher C and N contents and stocks and lower P content and stock than global subtropical forests and temperate broadleaf forests [30]. This result was likely due to the fact that BFs in Wuyishan City are under strict protection, with extremely abundant biomass and litterfall, which is beneficial for the accumulation of C and N [21]. Furthermore, BFs are primarily located in mountainous and hilly areas with relatively high ALs and steep slopes, coupled with a warm and rainy climate, which accelerates soil weathering and erosion, leading to continuous depletion and severe loss of soil P [29,31,32]. The soil C contents in GSs, CLs, and TGs were lower than the global average of croplands (13.86 g/kg) [30]. This result indicated that cultivation practices, which facilitate material decomposition, enhance soil aeration, and accelerate carbon mineralization, are responsible for the significant C loss observed in the soil after forest conversion [15,32]. With the exception of GSs, the soil N contents were also higher than the global average of croplands (1.32 g/kg) [30]. This is directly related to the fact that as a developing country, China’s urban artificial GSs areas have developed relatively late and frequently change vegetation, leading to low C and N inputs in these areas [33].
Notably, in our study, the soil P content and stock in GSs, CLs, and TGs were significantly higher than those in PFs and BFs, exceeding the croplands (0.46 g/kg), grasslands (0.65 g/kg), and subtropical forests (0.39 g/kg) on a global scale [30]. The elevated P pool in these soils can be attributed to three main factors: intensive application of P-containing fertilizers, robust P retention capacity of cultivated crops, and suboptimal P utilization efficiency [34]. The phenomenon may also be linked to the inherently low mobility of soil P and its reduced biological availability [16]. Consequently, the soil C and N status in southern China is predominantly determined by the type of forest conversion [1]. In contrast, the soil P enrichment in CLs, TGs, and GSs appears to be influenced by a combination of agricultural practices and intrinsic soil characteristics.

4.2. Soil C, N, and P Stoichiometry in Response to Forest Conversion

The findings of this study indicated that forest conversion and agricultural practices had differential impacts on the content and stock of surface soil C, N, and P, leading to a significant reduction in the soil C:N:P stoichiometric ratio, which was consistent with the findings of previous studies in southern China [1,10]. Alterations in forest structure and function, characterized by shifts in the quantity and quality of litterfall input and the rate of its decomposition [21,35], are compounded by agricultural practices and improved agricultural management strategies. These strategies include the application of N and P fertilizers, tillage, and irrigation, which can significantly alter the natural cycling and coupling processes of nutrients [30,33,36].
The C:N ratio ranges from 1 to 15, triggering the process of rapid mineralization and N release, making the N readily available for plant absorption [37]. A ratio exceeding 35 leads to microbial immobilization of N [37]. The average ratio observed in our study was below 20, indicating that the rate of microbial immobilization of soil is relatively low, favoring mineralization and N release [37]. In particular, the widespread excessive application of nitrogenous fertilizers has led to an average C:N ratio in TGs soil of <8, promoting rapid degradation of C by soil microbes and shifting towards C limitation [38,39]. Therefore, the adoption of ecological TGs management practices is recommended; these practices include intercropping with suitable herbaceous or woody plants to increase the biomass of TGs and increasing the proportion of organic fertilizer application to prevent soil nutrient imbalance and reduce the risk of leaching and runoff of N and P [38].
The background P content in the soils of southern China is low [28], with the lowest level observed in forestland (BFs and PFs) soils, where soil P is primarily in the form of rock phosphate and is subjected to P limitation. In particular, the C:N:P ratio in the BFs soil in this study was found to be significantly higher (444.8:24.2:1) than that in Chinese national-scale soil (134:9:1) [28] and in global-scale surface soil (186:13.1:1) [40]. The C:N:P ratio was found to be even higher than the corresponding ratios in the soil of global temperate BFs (391:21:1) [30]. However, the P enrichment observed in CLs, TGs, and GSs soils (Figure 2) directly contributes to the low soil C:P and N:P ratios. The average C:N:P ratios of these soils were significantly lower than the stoichiometric ratios of soils in the subtropical regions of China (78:6.4:1) [28] and global arable land (64:5:1) [30]. It is therefore recommended that the substantial but underutilized soil P stocks be mobilized (rather than merely the volume and frequency of fertilizer inputs augmented) to enhance the P utilization efficiency of crops and green vegetation [15]. Consequently, long-term forest conversion and agricultural practices in southern China have significantly altered the quantity and balance of soil C, N, and P [1,16]. Our results supported the first hypothesis. Our findings underscore the critical need for strategies that can unlock the latent potential of soil P, thereby optimizing its availability to plants and fostering more sustainable agricultural practices.

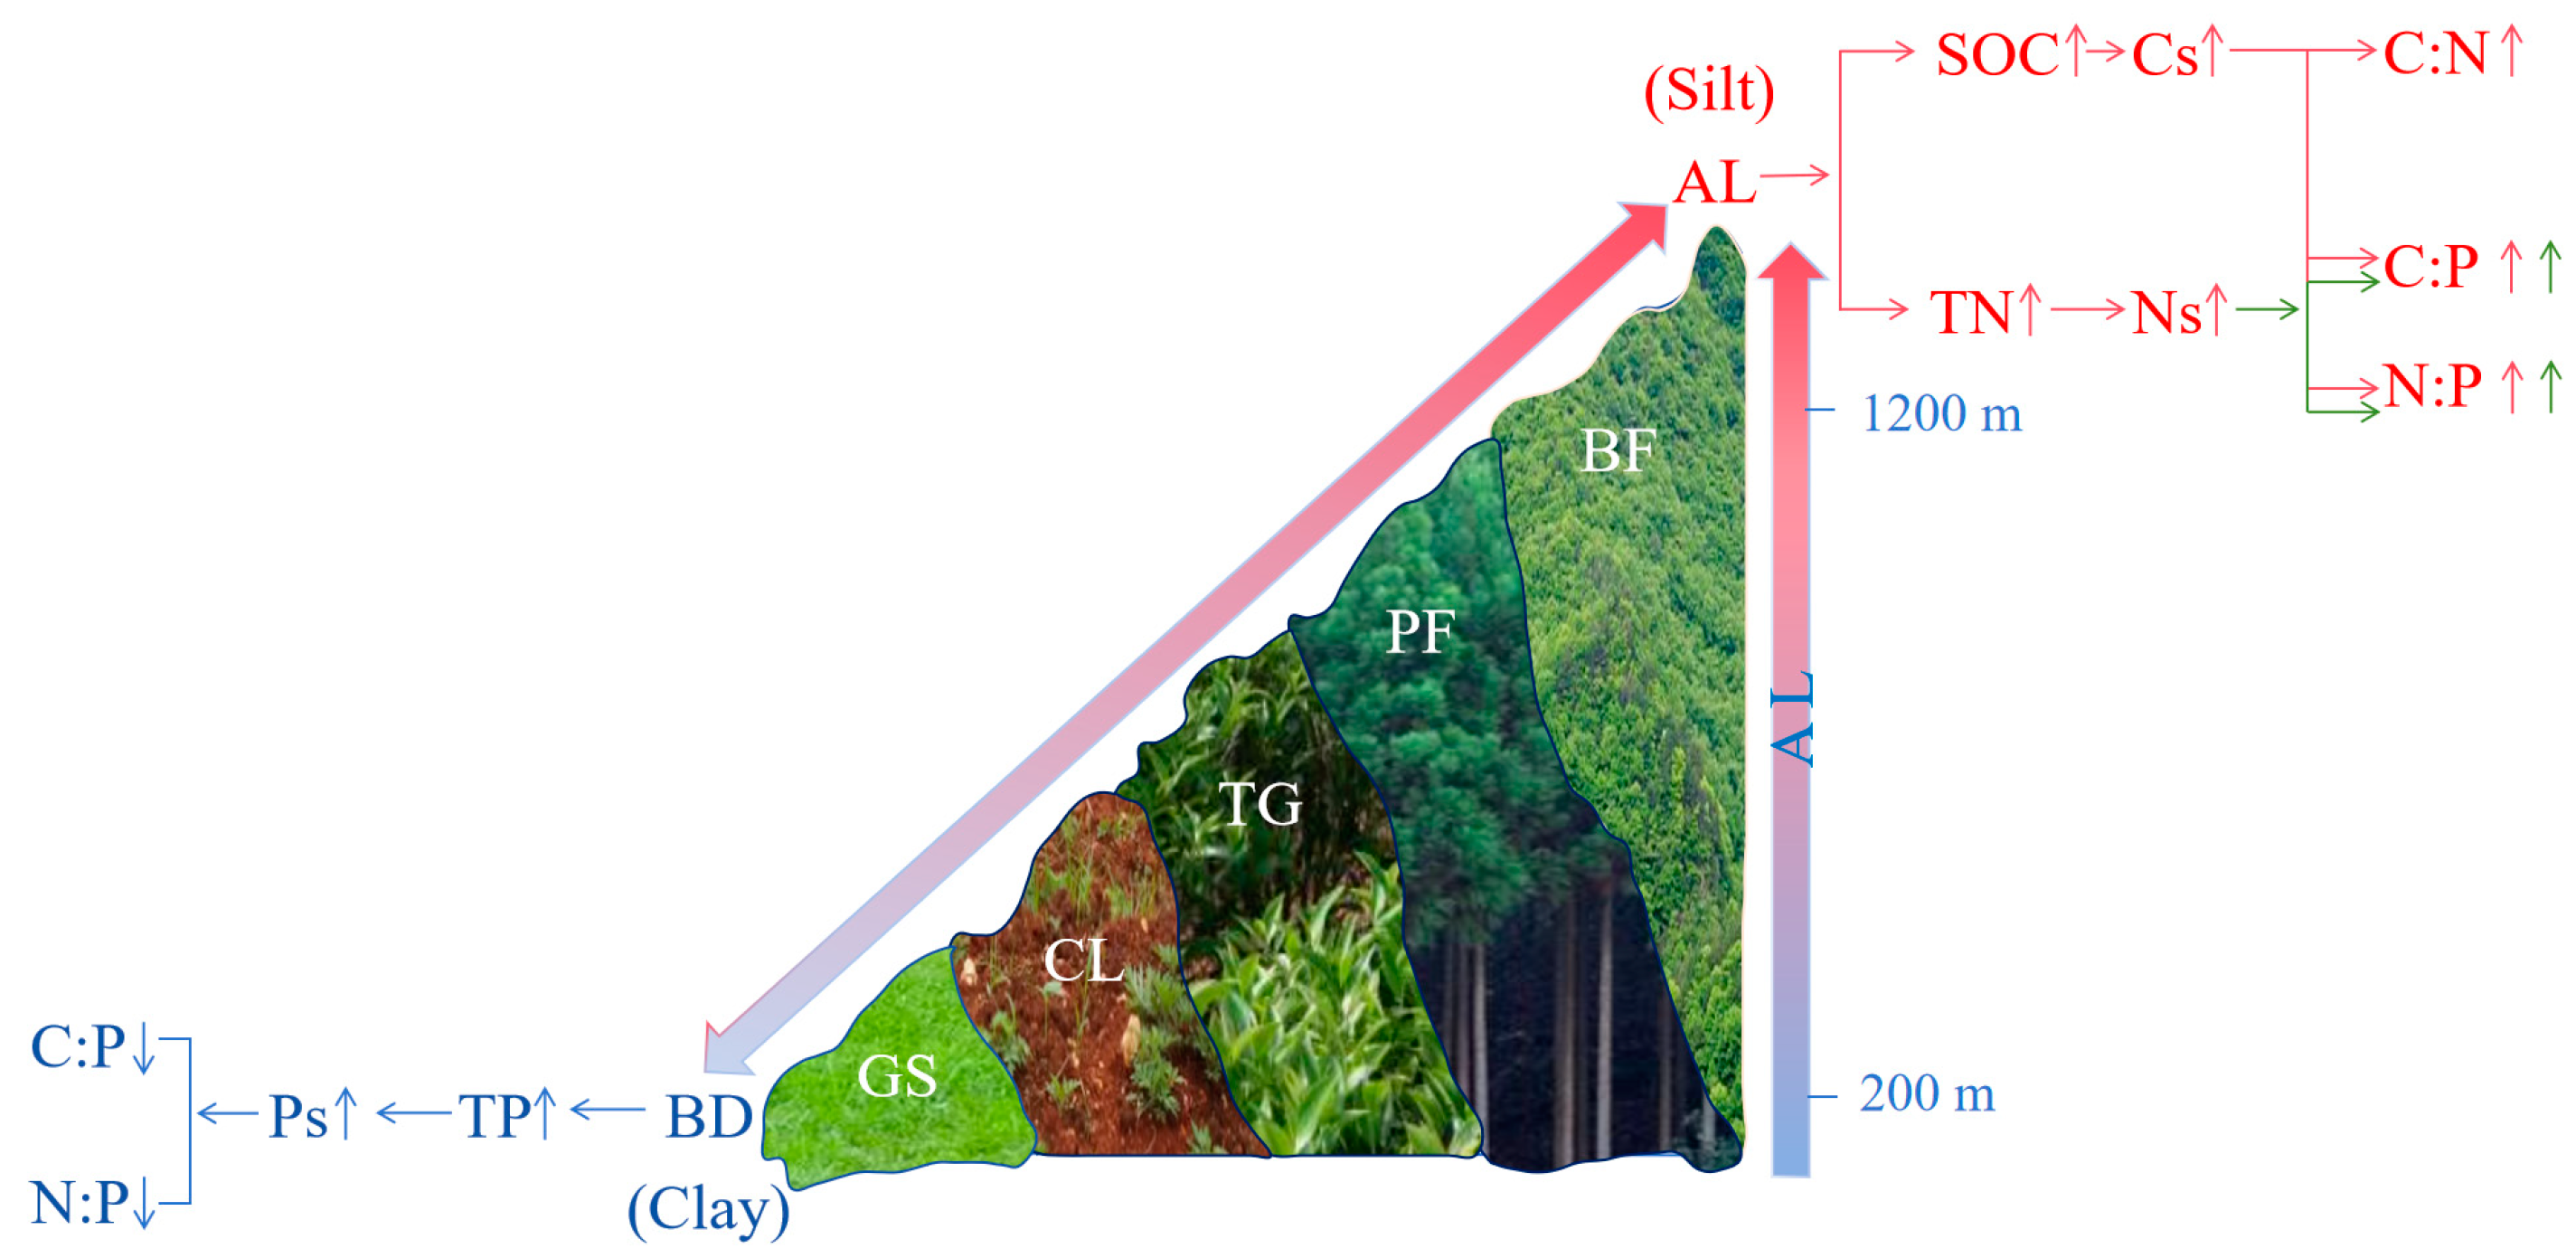
4.3. The Impact Path of Soil C, N, and P Stocks and Stoichiometry

The results of the RDA demonstrated that the contents of C, N, and P in the soil predominantly determined their stocks and stoichiometric ratios, with a particular emphasis on C content. Furthermore, several soil physicochemical properties, including particle size distribution, WC, and BD, as well as AL, demonstrated significant correlations with the concentrations of soil C, N, and P. Meanwhile, significant differences were observed in soil physiochemical properties and AL distribution among various forest conversion types (Table S2). These results suggest that these factors indirectly modulate the stocks and stoichiometric ratios of soil C, N, and P, underscoring the complexity of soil nutrient dynamics [21,35].
In mountainous and hilly ecosystems, changes in AL are typically accompanied by alterations in various environmental factors, including climatic conditions, microbial activity, vegetation types, and soil properties [41,42,43]. These changes are thought to influence the accumulation of C and N [41,42,43]. Our study revealed a distinct vertical distribution pattern of forest conversion type along the gradient of AL (Figure 1). The plant communities and litter and soil C:N:P ratios vary significantly across ecosystem types and biomes, with generally higher ratios observed in forest ecosystems in China [4]. As a representative of the integrated factors in mountainous and hilly regions, AL exerts a dominant influence on the abundance of soil organic matter and is significantly correlated with the soil C, N, and P contents and stocks and particularly the C:N:P ratio in Wuyishan City (Figure 5 and Figure 6). This finding was consistent with that of a previous study [21]. However, the findings from different regions are not entirely consistent [43,44,45]. Indeed, the effects of soil–climate interactions on forest tissue types are the main drivers of changes in C, N, and P contents and stoichiometry across AL gradients [44,45]. In the present study, as the AL increased, the content and stock of soil C and N increased, whereas the content and stock of P decreased, explaining the increase in the C:N:P ratio (Figure 7). This was further verified by the RDA results of AL on soil C, N, and P contents, stocks, and stoichiometry (Figure S1). As illustrated in Figure S1, AL was the main driver of the RDA results, with a substantial contribution of 86.8%.
In addition, changes in soil texture (an increase in silt and a decrease in clay) were found to correlate with increasing AL in alignment with the shifts in C, N, and P stocks (an increase in Cs and Ns and a decrease in Ps) and the increase in the C:N:P ratio (Figure 6 and Figure 7). Furthermore, as AL increased, a decline in soil BD was observed, which inversely impacted the stoichiometric ratios of soil C, N, and P (Figure 5, Figure 6 and Figure 7). This suggests to a certain extent that the increase in soil organic matter accumulation due to higher AL promotes a more porous soil structure, which in turn leads to a reduction in soil BD [43,44,45]. However, soil WC and sand content did not exhibit a significant trend in relation to altitude (Figure 5 and Figure 6), suggesting that within a complex and dynamically fluctuating environment, the impact of these two factors is likely to be overshadowed or diminished [46,47]. In conclusion, AL profoundly shapes forest conversation and its resultant soil characteristics with the change in climatic and topographic elements, including soil BD and texture defined by grain size composition. Thus, AL is a key factor regulating soil C, N, and P contents, stocks, and stoichiometric ratios in mountainous and hilly areas. These findings supported the second hypothesis.

5. Conclusions

In this study, the impact of forest conversion on the surface soil C, N, and P stocks and stoichiometry was comprehensively assessed through field surveys in Wuyishan City. Lower soil C and N contents and stocks in PFs, TGs, CLs, and GSs than BFs due to lower vegetation productivity and higher losses of C and N were mainly attributed to lower plant litter and tillage management. In contrast, soil P content and stock increased after forest conversion, especially in croplands due to the adoption of agricultural farming and fertilization practices. Consequently, forest conversion has notably diminished soil C:N:P stoichiometric ratios, following the descending order of BFs, PFs, TGs, CLs, and GSs. Meanwhile, the AL gradient essentially determined the type of forest conversion and significantly influenced soil properties as well as the content, stock, and ratios of C, N, and P in the subtropical mountainous and hilly regions. The findings of this study can help develop ecological management strategies for TGs and demonstrate the critical importance of optimizing the productive potential of soil P in CLs, TGs, and GSs. This study also provides valuable insights into the storage, utilization, and balance of soil C, N, and P following forest conversion. Given the diverse ecological contexts of hilly and mountainous regions and the variability in natural resource management practices, future research should simultaneously quantify factors such as altitude, years of cultivation, and their management practices (e.g., fertilization, plowing, or harvesting) and comprehensively examine soil physicochemical and biological properties to delve into the decoupling mechanisms of soil C, N, and P during forest conversion.

Supplementary Materials

The following supporting information can be downloaded at: https://www.mdpi.com/article/10.3390/f15091515/s1, Table S1: Geographical coordinates information and altitude distribution for sampling sites of various forest conversion types; Table S2: Soil physiochemical properties and altitude distribution of various forest conversion types; Figure S1: Two-dimensional sequence diagram of redundancy analysis (RDA) between soil properties and C, N, and P contents, stocks, and stoichiometry in different forest conversion types. GSs, urban artificial green spaces (n = 35); CLs, cultivated lands (n = 18); TGs, tea gardens (n = 25); PFs, plantation forests (n = 22); BFs, primary native broadleaf forests (n = 52); BD, soil bulk density; WC, soil water content; AL, altitude; Cs, SOC stock; Ns, TN stock; Ps, TP stock.

Author Contributions

Conceptualization, H.Y. and D.Z.; methodology, H.Y., Y.H. and S.Z.; software, Y.H., X.T. and J.W.; validation, Y.H., X.T., J.W. and S.G.; formal analysis, H.Y., D.Z. and Y.H.; investigation, H.Y., D.Z., Y.H., X.T., J.W. and S.G.; resources, H.Y., D.Z. and S.Z.; data curation, H.Y. and Y.H.; writing-original draft preparation, H.Y.; writing-review and editing, H.Y., D.Z. and Y.H.; visualization, S.Z., X.T. and J.W.; supervision, D.Z., H.Y., Y.H. and S.Z.; project administration, H.Y., D.Z. and S.Z.; funding acquisition, H.Y. and D.Z. All authors have read and agreed to the published version of the manuscript.

Funding

This research was funded by the Postdoctoral Science Foundation Project of China (Grant number 2019M661874), the Natural Science Foundation of Fujian Province, China (Grant number 2021J011141, 2021J05248), and Science and Technology Projects of Nanping City (Grant number N2023J005, NP2021KTS02).

Data Availability Statement

The original contributions presented in the study are included in the article and supplementary material.

Acknowledgments

The authors express their gratitude and appreciation to all staff members involved in the collection and processing of soil samples in this research. The authors also thank Haiyan Zhang for their technical support during the data survey and analysis.

Conflicts of Interest

The authors declare no conflicts of interest.

References

  1. Tang, X.; Hu, J.; Lu, Y.; Qiu, J.; Dong, Y.; Li, B. Soil C, N, P stocks and stoichiometry as related to land use types and erosion conditions in lateritic red soil region, south China. Catena 2022, 210, 105888. [Google Scholar] [CrossRef]
  2. Xu, H.; Qu, Q.; Li, P.; Guo, Z.; Wulan, E.; Xue, S. Stocks and stoichiometry of soil organic carbon, total nitrogen, and total phosphorus after vegetation restoration in the Loess Hilly Region, China. Forests 2019, 10, 27. [Google Scholar] [CrossRef]
  3. Hu, Q.; Sheng, M.; Bai, Y.; Jie, Y.; Xiao, H. Response of C, N, and P stoichiometry characteristics of Broussonetia papyrifera to altitude gradients and soil nutrients in the karst rocky ecosystem, SW China. Plant Soil 2022, 475, 123–136. [Google Scholar] [CrossRef]
  4. Zhang, J.; Li, M.; Xu, L.; Zhu, J.; Dai, G.; He, N. C:N:P stoichiometry in terrestrial ecosystems in China. Sci. Total Environ. 2021, 795, 148849. [Google Scholar] [CrossRef]
  5. Qi, D.; Feng, F.; Lu, C.; Fu, Y. C:N:P stoichiometry of different soil components after the transition of temperate primary coniferous and broad-leaved mixed forests to secondary forests. Soil Tillage Res. 2022, 216, 105260. [Google Scholar] [CrossRef]
  6. Liu, T.; Wu, X.; Li, H.; Ning, C.; Li, Y.; Zhang, X.; He, J.; Filimonenko, E.; Chen, S.; Chen, X.; et al. Soil quality and r-K fungal communities in plantations after conversion from subtropical forest. Catena 2022, 219, 106584. [Google Scholar] [CrossRef]
  7. Fan, L.; Han, W. Soil respiration after forest conversion to tea gardens: A chronosequence study. Catena 2020, 190, 104532. [Google Scholar] [CrossRef]
  8. Rocha, F.I.; Da Conceição Jesus, E.; Teixeira, W.G.; Lumbreras, J.F.; De Paula Clemente, E.; Da Motta, P.E.F.; Borsanelli, A.C.; Dutra, I.D.S.; De Oliveira, A.P. Soil type determines the magnitude of soil fertility changes by forest-to-pasture conversion in Western Amazonia. Sci. Total Environ. 2023, 856, 158955. [Google Scholar] [CrossRef]
  9. Zeferino, L.B.; Filho, J.F.L.; Santos, A.C.D.; Cerri, C.E.P.; De Oliveira, T.S. Soil carbon and nitrogen stocks following forest conversion to long-term pasture in Amazon rainforest-Cerrado transition environment. Catena 2023, 231, 107346. [Google Scholar] [CrossRef]
  10. Luo, X.; Hou, E.; Chen, J.; Li, J.; Zhang, L.; Zang, X.; Wen, D. Dynamics of carbon, nitrogen, and phosphorus stocks and stoichiometry resulting from conversion of primary broadleaf forest to plantation and secondary forest in subtropical China. Catena 2020, 193, 104606. [Google Scholar] [CrossRef]
  11. Wang, X.; Zhang, H.; Cao, D.; Wu, C.; Wang, X.; Wei, L.; Guo, B.; Wang, S.; Ding, J.; Chen, H.; et al. Microbial carbon and phosphorus metabolism regulated by C:N:P stoichiometry stimulates organic carbon accumulation in agricultural soils. Soil Tillage Res. 2024, 242, 106152. [Google Scholar] [CrossRef]
  12. Luo, X.; Zhang, R.; Zhang, L.; Frew, A.; Yu, H.; Hou, E.; Wen, D. Mechanisms of soil organic carbon stabilization and its response to conversion of primary natural broadleaf forests to secondary forests and plantation forests. Catena 2024, 240, 108021. [Google Scholar] [CrossRef]
  13. Joshi, R.K.; Garkoti, S.C. Influence of vegetation types on soil physical and chemical properties, microbial biomass and stoichiometry in the central Himalaya. Catena 2023, 222, 106835. [Google Scholar] [CrossRef]
  14. Guan, F.; Tang, X.; Fan, S.; Zhao, J.; Peng, C. Changes in soil carbon and nitrogen stocks followed the conversion from secondary forest to Chinese fir and Moso bamboo plantations. Catena 2015, 133, 455–460. [Google Scholar] [CrossRef]
  15. Wang, W.; Wang, C.; Sardans, J.; Min, Q.; Zeng, C.; Tong, C.; Peñuelas, J. Agricultural land use decouples soil nutrient cycles in a subtropical riparian wetland in China. Catena 2015, 133, 171–178. [Google Scholar] [CrossRef]
  16. Zheng, S.; Xia, Y.; Hu, Y.; Chen, X.; Rui, Y.; Gunina, A.; He, X.; Ge, T.; Wu, J.; Su, Y.; et al. Stoichiometry of carbon, nitrogen, and phosphorus in soil: Effects of agricultural land use and climate at a continental scale. Soil Tillage Res. 2021, 209, 104903. [Google Scholar] [CrossRef]
  17. Wang, Z.; He, G.; Hou, Z.; Luo, Z.; Chen, S.; Lu, J.; Zhao, J. Soil C:N:P stoichiometry of typical coniferous (Cunninghamia lanceolata) and/or evergreen broadleaved (Phoebe bournei) plantations in south China. For. Ecol. Manag. 2021, 486, 118974. [Google Scholar] [CrossRef]
  18. Wang, M.; Chen, H.; Zhang, W.; Wang, K. Soil nutrients and stoichiometric ratios as affected by land use and lithology at county scale in a karst area, southwest China. Sci. Total Environ. 2018, 619–620, 1299–1307. [Google Scholar]
  19. Holttum, R.E. Tropical and sub-tropical plant ecology. Nature 1965, 207, 117–118. [Google Scholar] [CrossRef]
  20. Fan, H.; Wu, J.; Liu, W.; Yuan, Y.; Hu, L.; Cai, Q. Linkages of plant and soil C:N:P stoichiometry and their relationships to forest growth in subtropical plantations. Plant Soil 2015, 392, 127–138. [Google Scholar] [CrossRef]
  21. Zhu, D.; Zhou, Y.; Peng, S.; Hua, W.; Luo, B.; Hui, D. Impacts of altitude on plant green leaf, fresh litter, and soil stoichiometry in subtropical forests. Front. For. Glob. Chang. 2024, 7, 1331623. [Google Scholar] [CrossRef]
  22. Qiao, Y.; Wang, J.; Liu, H.; Huang, K.; Yang, Q.; Lu, R.; Yan, L.; Wang, X.; Xia, J. Depth-dependent soil C-N-P stoichiometry in a mature subtropical broadleaf forest. Geoderma 2020, 370, 114357. [Google Scholar] [CrossRef]
  23. Luo, X.; Hou, E.; Zhang, L.; Zang, X.; Yi, Y.; Zhang, G.; Wen, D. Effects of forest conversion on carbon-degrading enzyme activities in subtropical China. Sci. Total Environ. 2019, 696, 133968. [Google Scholar] [CrossRef] [PubMed]
  24. Guo, L.; Xue, P.; Li, M.; Shao, X. Seed bank and regeneration dynamics of Emmenopterys henryi population on the western side of Wuyi Mountain, South China. J. For. Res. 2017, 28, 943–952. [Google Scholar] [CrossRef]
  25. You, W.; Lin, L.; Wu, L.; Ji, Z.; Yu, J.; Zhu, J.; Fan, Y.; He, D. Geographical information system-based forest fire risk assessment integrating national forest inventory data and analysis of its spatiotemporal variability. Ecol. Indic. 2017, 77, 176–184. [Google Scholar] [CrossRef]
  26. Xu, D.; Geng, Q.; Jin, C.; Xu, Z.; Xu, X. Tree line identification and dynamics under climate change in Wuyishan National Park based on Landsat Images. Int. J. Remote Sens. 2020, 12, 2890. [Google Scholar] [CrossRef]
  27. Zhao, X.F. Comprehensive Survey Report of Wuyi Mountain Nature Reserve; Fujian Science and Technology Press: Fuzhou, China, 1993. [Google Scholar]
  28. Tian, H.; Chen, G.; Zhang, C.; Melillo, J.M.; Hall, C.A.S. Pattern and variation of C:N:P ratios in China’s soils: A synthesis of observational data. Biogeochemistry 2010, 98, 139–151. [Google Scholar] [CrossRef]
  29. Hu, Y.; Shu, X.; He, J.; Zhang, Y.; Xiao, H.; Tang, X.; Gu, Y.; Lan, T.; Xia, J.; Ling, J.; et al. Storage of C, N, and P affected by afforestation with Salix cupularis in an alpine semiarid desert ecosystem. Land Degrad. Dev. 2018, 29, 188–198. [Google Scholar] [CrossRef]
  30. Xu, X.; Thornton, P.E.; Post, W.M. A global analysis of soil microbial biomass carbon, nitrogen and phosphorus in terrestrial ecosystems. Glob. Ecol. Biogeogr. 2013, 22, 737–749. [Google Scholar] [CrossRef]
  31. Yu, Z.; Wang, M.; Huang, Z.; Lin, T.; Vadeboncoeur, M.A.; Searle, E.B.; Chen, H.Y.H. Temporal changes in soil C-N-P stoichiometry over the past 60 years across subtropical China. Glob. Chang. Biol. 2018, 24, 1308–1320. [Google Scholar] [CrossRef]
  32. Li, D.; Niu, S.; Luo, Y. Global patterns of the dynamics of soil carbon and nitrogen stocks following afforestation: A meta-analysis. New Phytol. 2012, 195, 172–181. [Google Scholar] [CrossRef]
  33. Guo, H.; Du, E.; Terrer, C.; Jackson, R.B. Global distribution of surface soil organic carbon in urban greenspaces. Nat. Commun. 2024, 15, 806. [Google Scholar] [CrossRef] [PubMed]
  34. Rodrigues, M.; Withers, P.J.A.; Soltangheisi, A.; Vargas, V.; Holzschuh, M.; Pavinato, P.S. Tillage systems and cover crops affecting soil phosphorus bioavailability in Brazilian Cerrado Oxisols. Soil Tillage Res. 2021, 205, 104770. [Google Scholar] [CrossRef]
  35. Yang, Y.; Liu, B.; An, S. Ecological stoichiometry in leaves, roots, litters and soil among different plant communities in a desertified region of Northern China. Catena 2018, 166, 328–338. [Google Scholar] [CrossRef]
  36. Xia, L.; Lam, S.K.; Wang, S.; Zhou, W.; Chen, D.; Yan, X. Optimizing nitrogen fertilization rate to enhance soil carbon storage and decrease nitrogen pollution in paddy ecosystems with simultaneous straw incorporation. Agric. Ecosyst. Environ. 2020, 298, 106968. [Google Scholar] [CrossRef]
  37. Brust, G. Management strategies for organic vegetable fertility. In Safety and Practice for Organic Food; Academic Press: Cambridge, MA, USA, 2019; pp. 193–212. [Google Scholar]
  38. Yan, P.; Shen, C.; Fan, L.; Li, X.; Zhang, L.; Zhang, L.; Han, W. Tea planting affects soil acidification and nitrogen and phosphorus distribution in soil. Agric. Ecosyst. Environ. 2018, 254, 20–25. [Google Scholar] [CrossRef]
  39. Norby, R.J.; Cotrufo, M.F. Global change: A question of litter quality. Nature 1998, 396, 17–18. [Google Scholar] [CrossRef]
  40. Cleveland, C.C.; Liptzin, D. C:N:P stoichiometry in soil: Is there a “Redfield ratio” for the microbial biomass? Biogeochemistry 2007, 85, 235–252. [Google Scholar] [CrossRef]
  41. He, X.; Hou, E.; Veen, G.F.; Ellwood, M.D.F.; Dijkstra, P.; Sui, X.; Zhang, S.; Wen, D.; Chu, C. Soil microbial biomass increases along elevational gradients in the tropics and subtropics but not elsewhere. Glob. Ecol. Biogeogr. 2020, 29, 345–354. [Google Scholar] [CrossRef]
  42. Carvalho-Rocha, V.; Peres, C.A.; Neckel-Oliveira, S. Seasonal variation in patterns of anuran diversity along a subtropical elevational gradient. J. Biogeogr. 2023, 50, 1866–1878. [Google Scholar] [CrossRef]
  43. Bangroo, S.A.; Najar, G.R.; Rasool, A. Effect of altitude and aspect on soil organic carbon and nitrogen stocks in the Himalay-an Mawer Forest Range. Catena 2017, 158, 63–68. [Google Scholar] [CrossRef]
  44. Jiang, L.; He, Z.; Liu, J.; Xing, C.; Gu, X.; Wei, C.; Zhu, J.; Wang, X. Elevation gradient altered soil C, N, and P stoichiometry of Pinus taiwanensis forest on Daiyun Mountain. Forests 2019, 10, 1089. [Google Scholar] [CrossRef]
  45. Qin, H.; Jiao, L.; Zhou, Y.; Wu, J.; Chen, X. Elevation affects the ecological stoichiometry of Qinghai spruce in the Qilian Mountains of northwest China. Front. Plant Sci. 2022, 13, 917755. [Google Scholar] [CrossRef] [PubMed]
  46. Lu, J.; Feng, S.; Wang, S.; Zhang, B.; Ning, Z.; Wang, R.; Chen, X.; Yu, L.; Zhao, H.; Lan, D.; et al. Patterns and driving mechanism of soil organic carbon, nitrogen, and phosphorus stoichiometry across northern China’s desert-grassland transition zone. Catena 2023, 220, 106695. [Google Scholar] [CrossRef]
  47. Wu, G.; Gao, J.; Li, H.; Ren, F.; Liang, D.; Li, X. Shifts in plant and soil C, N, and P concentrations and C:N:P stoichiometry associated with environmental factors in alpine marshy wetlands in West China. Catena 2023, 221, 106801. [Google Scholar] [CrossRef]
Figure 1. The location of the study plots in Wuyishan City, China. GSs, urban artificial green spaces (n = 35); CLs, cultivated lands (n = 18); TGs, tea gardens (n = 25); PFs, plantation forests (n = 22); BFs, primary native broadleaf forests (n = 52).
Forests 15 01515 g001
Figure 2. Distribution of soil C, N, and P contents (ac) and stocks (df). Bars represent the mean and standard error. Different lowercase letters in the same significant difference condition indicate significant differences among forest conversion types at p < 0.05. GSs, urban artificial green spaces (n = 35); CLs, cultivated lands (n = 18); TGs, tea gardens (n = 25); PFs, plantation forests (n = 22); BFs, primary native broadleaf forests (n = 52); Cs, soil organic carbon (SOC) stock; Ns, total nitrogen (TN) stock; Ps, total phosphorus (TP) stock.
Forests 15 01515 g002
Figure 3. Soil C:N (a), C:P (b), and N:P (c) stoichiometric ratios. Bars represent the mean and standard error. Different lowercase letters in the same significant difference condition indicate significant differences among forest conversion types at p < 0.05. GSs, urban artificial green spaces (n = 35); CLs, cultivated lands (n = 18); TGs, tea gardens (n = 25); PFs, plantation forests (n = 22); BFs, primary native broadleaf forests (n = 52). Different lowercase letters indicate significant differences in the same index of different forest conversion types.
Forests 15 01515 g003
Figure 4. Ternary diagram of soil C:N:P stoichiometric ratios. GSs, urban artificial green spaces (n = 35); CLs, cultivated lands (n = 18); TGs, tea gardens (n = 25); PFs, plantation forests (n = 22); BFs, primary native broadleaf forests (n = 52).
Forests 15 01515 g004
Figure 5. Correlation analysis between soil C, N, and P stocks and stoichiometry and other physicochemical properties (* p < 0.05; ** p < 0.01). AL, altitude; WC, soil water content; BD, soil bulk density; Cs, SOC stock; Ns, TN stock; Ps, TP stock. Blue and red denote positive and negative correlations, respectively.
Forests 15 01515 g005
Figure 6. Redundancy analysis (RDA) between soil properties and C, N, and P stocks and stoichiometry for different forest conversion types. GSs, urban artificial green spaces (n = 35); CLs, cultivated lands (n = 18); TGs, tea gardens (n = 25); PFs, plantation forests (n = 22); BFs, primary native broadleaf forests (n = 52); AL, altitude; WC, soil water content; BD, soil bulk density; Cs, SOC stock; Ns, TN stock; Ps, TP stock.
Forests 15 01515 g006
Figure 7. Conceptual diagram depicting the key factors affecting soil C, N, and P stocks and stoichiometry. GSs, urban artificial green spaces (n = 35); CLs, cultivated lands (n = 18); TGs, tea gardens (n = 25); PFs, plantation forests (n = 22); BFs, primary native broadleaf forests (n = 52); AL, altitude; BD, soil bulk density; Cs, SOC stock; Ns, TN stock; Ps, TP stock. The red font highlights the indicators that demonstrate a positive correlation with AL. Conversely, the blue font denotes the indicators that exhibit growth as AL diminishes. The red arrows specifically direct attention to the variations in the C and N content, as well as their respective stocks and the ratios of C:N, C:P, and N:P. The green arrows isolate the trend alterations induced solely by the augmentation of Ns. The blue font is dedicated to illustrating the shifts in the P content and stock, along with the consequential impacts on the C:P and N:P ratios.
Forests 15 01515 g007
Disclaimer/Publisher’s Note: The statements, opinions and data contained in all publications are solely those of the individual author(s) and contributor(s) and not of MDPI and/or the editor(s). MDPI and/or the editor(s) disclaim responsibility for any injury to people or property resulting from any ideas, methods, instructions or products referred to in the content.

