Article

Partial Organic Substitution Fertilization Improves Soil Fertility While Reducing N Mineralization in Rubber Plantations

1
Rubber Research Institute, Chinese Academy of Tropical Agricultural Sciences, Haikou 571101, China
2
College of Ecology and Environment, Hainan University, Haikou 570228, China
3
College of Tropical Crops, Hainan University, Haikou 570228, China
4
Sanya Tropical Ecosystem Carbon Source and Sink Field Scientific Observation and Research Station, Sanya 572022, China
*
Author to whom correspondence should be addressed.
Forests 2024, 15(9), 1521; https://doi.org/10.3390/f15091521
Submission received: 18 July 2024 / Revised: 15 August 2024 / Accepted: 26 August 2024 / Published: 29 August 2024
(This article belongs to the Special Issue Forest Soil Physical, Chemical, and Biological Properties)

Abstract

:
Overuse of chemical nitrogen (N) fertilizers leads to N leaching and soil degradation. Replacing chemical N fertilizers with organic fertilizers can enhance soil nutrition, reduce N loss, and improve soil productivity. However, the effects of combining organic and chemical fertilizers on soil N components and N transformation remain unclear. A 12-year field study included four treatments: no fertilizer (CK), chemical fertilizer alone (CF), 50% chemical N fertilizer combined with co-composted organic fertilizer (CFM), and composted (CFMC) organic fertilizer. The results showed that CFM and CFMC significantly enhanced SOC, TN, LFON, DON, NH4+-N, and MIN levels compared to CF. The CFM and CFMC treatments enhanced the soil N supply capacity and N pool stability by increasing the N mineralization potential (N0) and decreasing the N0/TN ratio. The CFM and CFMC treatments decreased net N ammonification rates by 108.03%–139.83% and 0.44%–64.91% and net mineralization rates by 60.60%–66.30% and 1.74%–30.38%, respectively. Changes in N transformation have been attributed to increased soil pH, enzyme activity, and substrate availability. These findings suggest that partial organic fertilizer substitution, particularly with co-composted organic fertilizers, is a viable strategy for enhancing soil fertility, improving soil N supply and stability, and reducing N loss in rubber plantations.

1. Introduction

The sustainable development of the natural rubber (Hevea brasiliensis Muell. Arg.) industry is of great significance to the economic development and ecological security of the tropics. It is extensively cultivated on approximately 13.30 million hectares in the tropical regions of the world (e.g., Southeast Asia and West Africa) [1]. Since its introduction to China in 1904, rubber plantations have progressively become the most economically significant plantation ecosystems in tropical Yunnan and Hainan provinces of China [2]. In 2021, China reached its natural rubber tree planting area of 1.13 million hectares, producing 0.85 million tons [3]. However, the prolonged cultivation of rubber has resulted in negative ecological effects, such as soil nitrogen (N) leaching, soil quality decrease, and land degradation [4,5,6,7]. According to Garousi et al. [7], the soils of rubber plantations have significantly lower concentrations of organic matter (SOM) and total nitrogen (TN) than those of natural forests. Cheng et al. [4] found a 48% reduction in SOC within the top 40 cm of soil on Hainan Island, China, after 40 years of rubber cultivation. Sun et al. [5] also found that the TN content and N storage decreased by 0.2 g kg−1 and 1.3 Mg hm−2 after 34 years of rubber plantation. Therefore, addressing the issues of enhancing soil fertility levels and preserving soil ecosystem functionality is crucial in rubber plantation systems.
Fertilization is a crucial strategy in promoting sustainable agroecosystem development. The application of mineral N fertilizers in agroecosystems has increased more than 10 times over the past 50 years [8]. However, the environmental impacts of excessive chemical N fertilizer use have been raised as a worldwide concern [9,10,11]. Siemens et al. [9] demonstrated that the primary cause of soil nitrate nitrogen accumulation and leaching is the excessive or improper use of N fertilizer. Moreover, excessive use of N fertilizer will produce a “priming effect” and cause the mineralization and loss of soil original N [10]. Therefore, achieving the balance between high N input and low N utilization efficiency is essential for the long-term sustainability of agricultural ecosystems [12]. Partially substituting chemical N fertilizer with organic fertilizers (partial organic fertilizer substitution) (e.g., organic manure, straw, and green manure) is considered a beneficial strategy for regulating soil nutrient availability, reducing N loss, and improving soil fertility [10,13,14]. Compared with other organic materials, the use of manure as an alternative organic source of fertilizer is not only an important way to implement the “Action to Achieve Zero Growth of Chemical Fertilizer Use”, and the resourceful use of manure can also contribute to improvement environmental conditions in rural areas [15,16]. For instance, Salehi et al. [13] discovered that integrating cattle manure with chemical fertilizer resulted in a significant increase in the levels of TN by 3.27% and SOC by 2.45%, respectively. Huang et al. [10] demonstrated that the substitution of organic N fertilizer led to a significant improvement in soil N utilization by 16.34% and reduced fertilizer N leaching loss by 35.46% compared to traditional fertilization. Moreover, partial organic N fertilizer substitution application also significantly increases the concentration of labile N components, the key indicators of soil N pool that could reflect N availability and soil fertility [17,18]. For example, soil particulate organic nitrogen (PON) is considered to be an intermediate between active and chronic nitrogen components, and it responds sensitively to modifications in soil management practices [19]. The synergistic use of inorganic fertilizer and manure substantially improved the contents of PON and MBN in sub-humid tropical soil [13]. Consequently, it is important to determine the impact of different fertilization approaches on soil N content and components to optimize fertilizer management, improve N use efficiency, and reduce environmental risks.
Soil N mineralization (NMin) is an essential biochemical process in the soil N cycle that converts soil organic nitrogen (SON) into plant-available inorganic forms with the participation of microorganisms [20]. Approximately 47%–68% of the inorganic N that plants absorb comes from the SON mineralization [21]. Soil NMin is determined by the dynamic balance of soil gross N fixation and N mineralization, which are regulated by soil properties and field management practices [22,23,24]. Fertilization could impact net NMin by elevating the soil's physicochemical properties and labile N content [23]. Thomas et al. [25] found that the soil Nmin rates and mineralization potential (N0) were significantly improved after 10 years of organic fertilizer application. Additionally, soil texture [26], pH [22], enzyme activity [27], microorganism [28], and even the C:N ratio of fertilizer [29,30] also affected soil N mineralization. According to Watts et al. [29] research, the application of a low C:N ratio fertilizer results in soil N mineralization, whereas a high C:N ratio fertilizer leads to N immobilization. Therefore, quantifying the soil N transformation characteristics and its impact factors is very important for further understanding the fertilization response and, consequently, optimizing the fertilization regime in the rubber plantation ecosystem.
Rubber plantations are the most typical artificial economic forest on Hainan Island, with an area of approximately 5.4 × 10⁵ hectares, and boast covering nearly 25% of the island’s total flora coverage [31]. Partial substitution of organic fertilizers is an environmentally friendly fertilization practice that is widely used in rubber plantations [2,32,33]. Li et al. [33] reported that a combination of chemical and organic fertilizers enhanced the growth of rubber seedlings and enriched the soil C and N levels. According to Fu et al. [34], the use of organic fertilizers instead of chemical fertilizers results in increased levels of SOC and TN in rubber plantations. Nevertheless, the majority of current studies focusing on the effects of various fertilization methods on soil total nutrient level, the impact of different fertilization regimes on soil labile N components, and N transformation characteristics in rubber plantations on Hainan Island remain unclear. Here, a long-term experimental site was utilized within the rubber plantations of Wushi Farm, which was established in 2007. Four distinct treatments were implemented, and assessments were made on the soil properties, activities of N-acquiring enzyme, labile N components, and SON transformation at 0–20 cm soil depth. This study mainly discusses two issues: (1) the effects of various fertilization methods on the soil N components and mineralization characteristics in rubber plantations and (2) the mechanisms influencing soil N transformation characteristics under partial organic fertilizer substitution.

2. Materials and Methods

2.1. Study Site

The experimental sites were located in Wushi Farm in central Hainan Island, South China (19°5.6′38.48″–19°5′59.70″ N, 109°55′15.45″–109°56′18.51″ E, a.s.l. 182–255 m) (Figure S1). The climate in this region is typically classified as a tropical monsoon climate, which is characterized by a rainy season from May to October and a dry season from November to April of the following year. The annual average temperature in this region is 23.5 °C (16.4–26.7 °C), and the annual mean solar radiation is 4579 MJ·m−2·y−1. The region receives an average annual precipitation of 2462 mm (1709.7–3252.5 mm) [35]. The primary soil type in the area is latosol, which originates from granite, and the soil thickness measures approximately one meter. This soil is classified as gravelly sandy loam [35,36]. The depiction of precipitation and temperature fluctuations in the research region from 1999 to 2018 is provided in Figure S2. In this study, we selected four mature rubber plantations of the same age and species (clone PR-107) planted in 1999. The planting density is 3 m × 7 m. The typical height of the rubber tree canopy is often between 20 and 30 m. Typically, rubber tapping commences in the eighth year after the establishment of a plantation, and the tapping season generally lasts from April to December each year. The properties of the initial soil (mixed sample collected in July 2007; the trees were 8 years old at the beginning of the experiment) in the rubber plantation are shown in Table S1.

2.2. Experimental Design

The long-term field fertilizer experiment was established in 2007. A randomized complete block design with three replications was implemented for four fertilization treatments: (1) CK, unfertilized as control; (2) CF, chemical fertilizer application alone; (3) CFM, integrated application of 50% chemical N fertilizer and 50% co-composted organic N fertilizer; (4) CFMC, integrated application of 50% chemical N fertilizer and 50% composted organic N fertilizer. There were 12 plots we selected in this study, each plot having an area of 667 m2 and a 20 m transition zone between each plot (Figure S1).
According to the local farm standards for fertilizing rubber trees, we applied an annual amount of 1.0 kg of synthetic fertilizer (N: P2O5: K2O = 15:9:6) to each rubber tree, up to a rate of 75 kg N ha−1·y−1, 45 kg P ha−1·y−1 and 30 kg K ha−1·y−1. N is available in the form of urea, containing 46% N; phosphorus is supplied as superphosphate phosphate, with a content of 12% P2O5, and potassium is provided as potassium chloride, with a concentration of 60% K2O. It is important to note that all fertilization treatments had the same overall N application. Furthermore, the CFM and CFMC treatments achieved the same levels of P and K as the CF treatment by supplementing with super phosphate and potassium chloride, respectively. The organic fertilizer was cow manure from a nearby farm, which was applied directly without composting in the CFM treatment and composted for two months before application in the CFMC treatment. Co-composted cattle manure contained 5.76 g·kg−1 N, 0.66 g·kg−1 P2O5, and 0.32 g·kg−1 K2O, whereas composted cattle manure, had 4.88 g·kg−1 N, 0.86 g·kg−1 P2O5, and 0.33 g·kg−1 K2O. Organic fertilizer was used as a basal fertilizer in January, while chemical N fertilizer was applied as the top dressing in April, July, and September at a ratio of 2:1:1. Fertilizer was positioned within a trench that measured 150 cm in length, 20 cm in width, and 10 cm in depth, which was located between two rubber trees [37].

2.3. Soil Collection and Analysis

In June 2019, soil samples were obtained (the sampling site was located 50 cm from the rubber tree trunk between the inter-rows) at depths of 0–10 cm (topsoil layer) and 10–20 cm (subsoil layer). Briefly, five samples were collected from each plot, and the same layer of soil was mixed into a composite sample. From this, we obtained 24 mixed soil samples. A 2 mm screen was used to sieve the samples, and the two parts were separated: one portion was stored at 4 °C for the incubation experiment and measurement of other indicators that required fresh soil, including soil microbial biomass nitrogen and carbon (MBN and MBC), extracellular enzyme activities, dissolved organic nitrogen (DON), mineral N nitrate nitrogen (NO3-N) and (ammonium nitrogen (NH4+-N)). The other portion was air-dried in a ventilated place to determine the light fraction of organic nitrogen (LFON) and PON, and the rest was sieved to 100 mesh to determine TN and other soil properties.
Soil physicochemical properties were determined according to Lu. [38]. Soil bulk density (BD) was measured using stainless steel rings. Soil moisture content was determined by the gravimetrical method of drying at 105 °C. Soil texture was analyzed using the pipette method to classify clay (<0.002 mm), silt (0.002–0.05 mm), and sand (>0.05 mm) [38]. Soil pH was recorded in a 1:2.5 soil–water suspension with a pH electrode. SOC was measured via the dichromate oxidation method, and TN was assessed using the Kjeldahl method after H2SO4 digestion [2].
Soil MBN and MBC were measured using the chloroform fumigation–extraction method [39]. Fumigated and non-fumigated soil samples were extracted with 0.5 M K2SO4 (soil : solution = 1:5 w/v) for 30 min and filtered through a 0.45 μm membrane measured using a TOC analyzer (Multi N/C 3100 TOC/TN, Analytik-Jena, Germany) [39]. DON was extracted with water (soil : solution = 1:5 w/v), shaken for 1 h at 250 rpm, filtered through a 0.45 μm filter, and measured by a TOC analyzer [40]. NO3-N and NH4+-N were extracted with 2 M KCl, shaken for 30 min, and analyzed using an automated flow-injection analyzer (Proxima1022/1/1, Alliance Scientific Instruments, Frépillon, France). PON and LFOC were determined as described by Cambardella et al. [41] and Gregorich et al. [42], respectively.
The activities of N-acetyl-glucosaminidase (NAG) and leucine aminopeptidase (LAP) were determined using DeForest’s method [43] in polystyrene 96-well and 300 mL microplates. Briefly, to prepare the soil suspension, 1.0 g of fresh soil was mixed with 125 mL of sodium acetate buffer (pH = 5.0) and stirred for 5 min using a magnetic mixer. The blank, standard, negative control, and sample wells were established. The soil suspension, buffer, and substrate working solution were then added to the microtiter plate and incubated in the dark at 25 °C for 4 h. The reactions were stopped by adding 10 µL 0.5 M NaOH. The microplates were then scanned using a microplate fluorometer (Synergy, Epoch™ 2, BioTek Instruments, Inc., Winooski, VT, USA) with excitation and emission filters at 365 and 450 nm, respectively. The activity of urease (UE) was assayed using a UV–Vis spectrophotometer (Spectrophotometer UV-2300 from Techcomp Com (Shanghai, China) [44].

2.4. Soil N Mineralization Incubation and Analysis

Six weeks of aerobic incubation were utilized to evaluate soil N mineralization in accordance with the methodology described by Marzi et al. [45]. Briefly, for the objective of reviving soil activity, we initiated a pre-incubated process for fresh soil samples at 60% WHC and 25 °C for a period of one week. Following the preincubation phase, we weighed each 100 g of soil into a 500 mL polypropylene tube. To ensure proper ventilation, we secured a single layer of gas-permeable parafilm over the polypropylene tube, which was then placed inside a wide-mouthed bottle. The entire setup was incubated at 25 °C in an incubator. Following the initiation of the experiment, samples were removed and analyzed for mineral N concentrations, including NH4+-N and NO3-N, at intervals of 1, 3, 5, 7, 14, 21, 28, and 42 days using a destructive sampling method. Soil cumulative N mineralization was determined by the summation of all mineral N (MIN) after the incubation process had been completed. According to Ali et al. [46], the pseudo-first-order kinetic model was applied to determine the mineralization potential (N0) of N:
N t = N 0 × 1 e k t
where the Nt in the formula represents cumulative mineralized N (mg kg−1), the N0 in the formula represents mineralizable N potential (mg kg−1), and k in the formula represents net mineralization rate constant (d−1).
During the incubation period, we assessed the levels of net N mineralization (NMin), nitrification (NNM), and ammonification (NAM) by comparing the initial and 42nd days’ concentrations of NH4+-N and NO3-N, respectively [47].
N A M = c ( N H 4 + N ) t c ( N H 4 + N ) 0 T t T 0
N N M = c ( N O 3 N ) t c ( N O 3 N ) 0 T t T 0
N M i n = c ( N H 4 + N + N O 3 N ) t c ( N H 4 + N + N O 3 N ) 0 T t T 0
where Tt and T0 in the formula represent the initial and 42nd days’ incubation dates, respectively; c (NO3-N)0, c (NH4+-N)0, and c (NH4+-N + NO3-N)0 in the formula represent the initial concentrations of NO3-N, NH4+-N, and MIN (mg kg−1), respectively, whereas c (NO3-N)t, c(NH4+-N)t, and c (NH4+-N + NO3-N)t in the formula represent the 42nd day’s concentrations of NO3-N, NH4+-N, and MIN (mg·kg−1), respectively.

2.5. Statistical Analysis

The Shapiro–Wilk test was applied to assess the normality of all data prior to conducting an analysis of variance (ANOVA). A one-way ANOVA and Tukey’s tests were used to determine significant differences in soil biological factors (including the soil enzyme activity and MBC), N components, and net transformation of soil N net parameters. A two-way ANOVA repeated measures test was used to identify the effects of fertilization treatment, soil depth, and their interaction on the soil physicochemical properties, the proportions of labile N components contributing to TN, and kinetic parameters for N mineralization.
The identification of the main soil factors for N transformation characteristics was achieved through random forest (RF) analysis. In the RF models, soil physicochemical and biological properties, as well as soil N components, were used as predictors for soil N transformation characteristics.
To determine the importance of these parameters, we utilized the percentage increases in the mean squared error (MSE) of variables, where higher MSE% values indicate more important variables. To further identify the possible pathways through which attributes controlled N mineralization potentials (N0) in the rubber plantation ecosystem, partial least squares path modeling (PLS-PM) was employed. The model was constructed using the “linkET” and “plspm” packages in R version 4.1.1 software, respectively. Statistics analysis was conducted using IBM SPSS 21.0 (IBM SPSS Predictive Analytics Community, Chicago, IL, USA). Origin 2021 software was used to create graphics.

3. Results

3.1. Soil Properties

The CF treatment showed a significant improvement in soil pH values, sand and clay content, and SOC and MBC contents compared to the CK. Additionally, CF treatment led to increased activities of NAG and LAP while significantly decreasing the silt content in both soil layers. Moreover, UE activities were substantially elevated in the topsoil (0–10 cm depth) (Table 1; Figure 1). Compared to the CF treatment, CFM treatment produced a notable increase in sand and SOC levels in both soil layers. In the 0–10 cm soil layer, NAG and LAP activities were noticeably higher, while UE activities and MBC concentration demonstrated a significant increase in the 10–20 cm soil layer. Furthermore, the CFMC treatment resulted in a substantial increase in NAG activities and MBC, silt, and SOC content. However, there was a significant decrease in clay and sand contents in both soil layers. Additionally, LAP activities were significantly lower in the 0–10 cm soil layer, while pH showed a significantly higher in the 10–20 cm soil depth (Table 1; Figure 1).
The ANOVA results showed that fertilization treatment had a highly significant effect on all soil physicochemical and biological properties (p < 0.05), while soil depth had no significant effect on soil clay content, pH, and C:N ratios (p > 0.05). Additionally, all soil factors but BD and C:N ratio were affected by the interactive effect of fertilization treatment and soil layer (Table 1 and Table S2).

3.2. Soil TN and Labile N Components

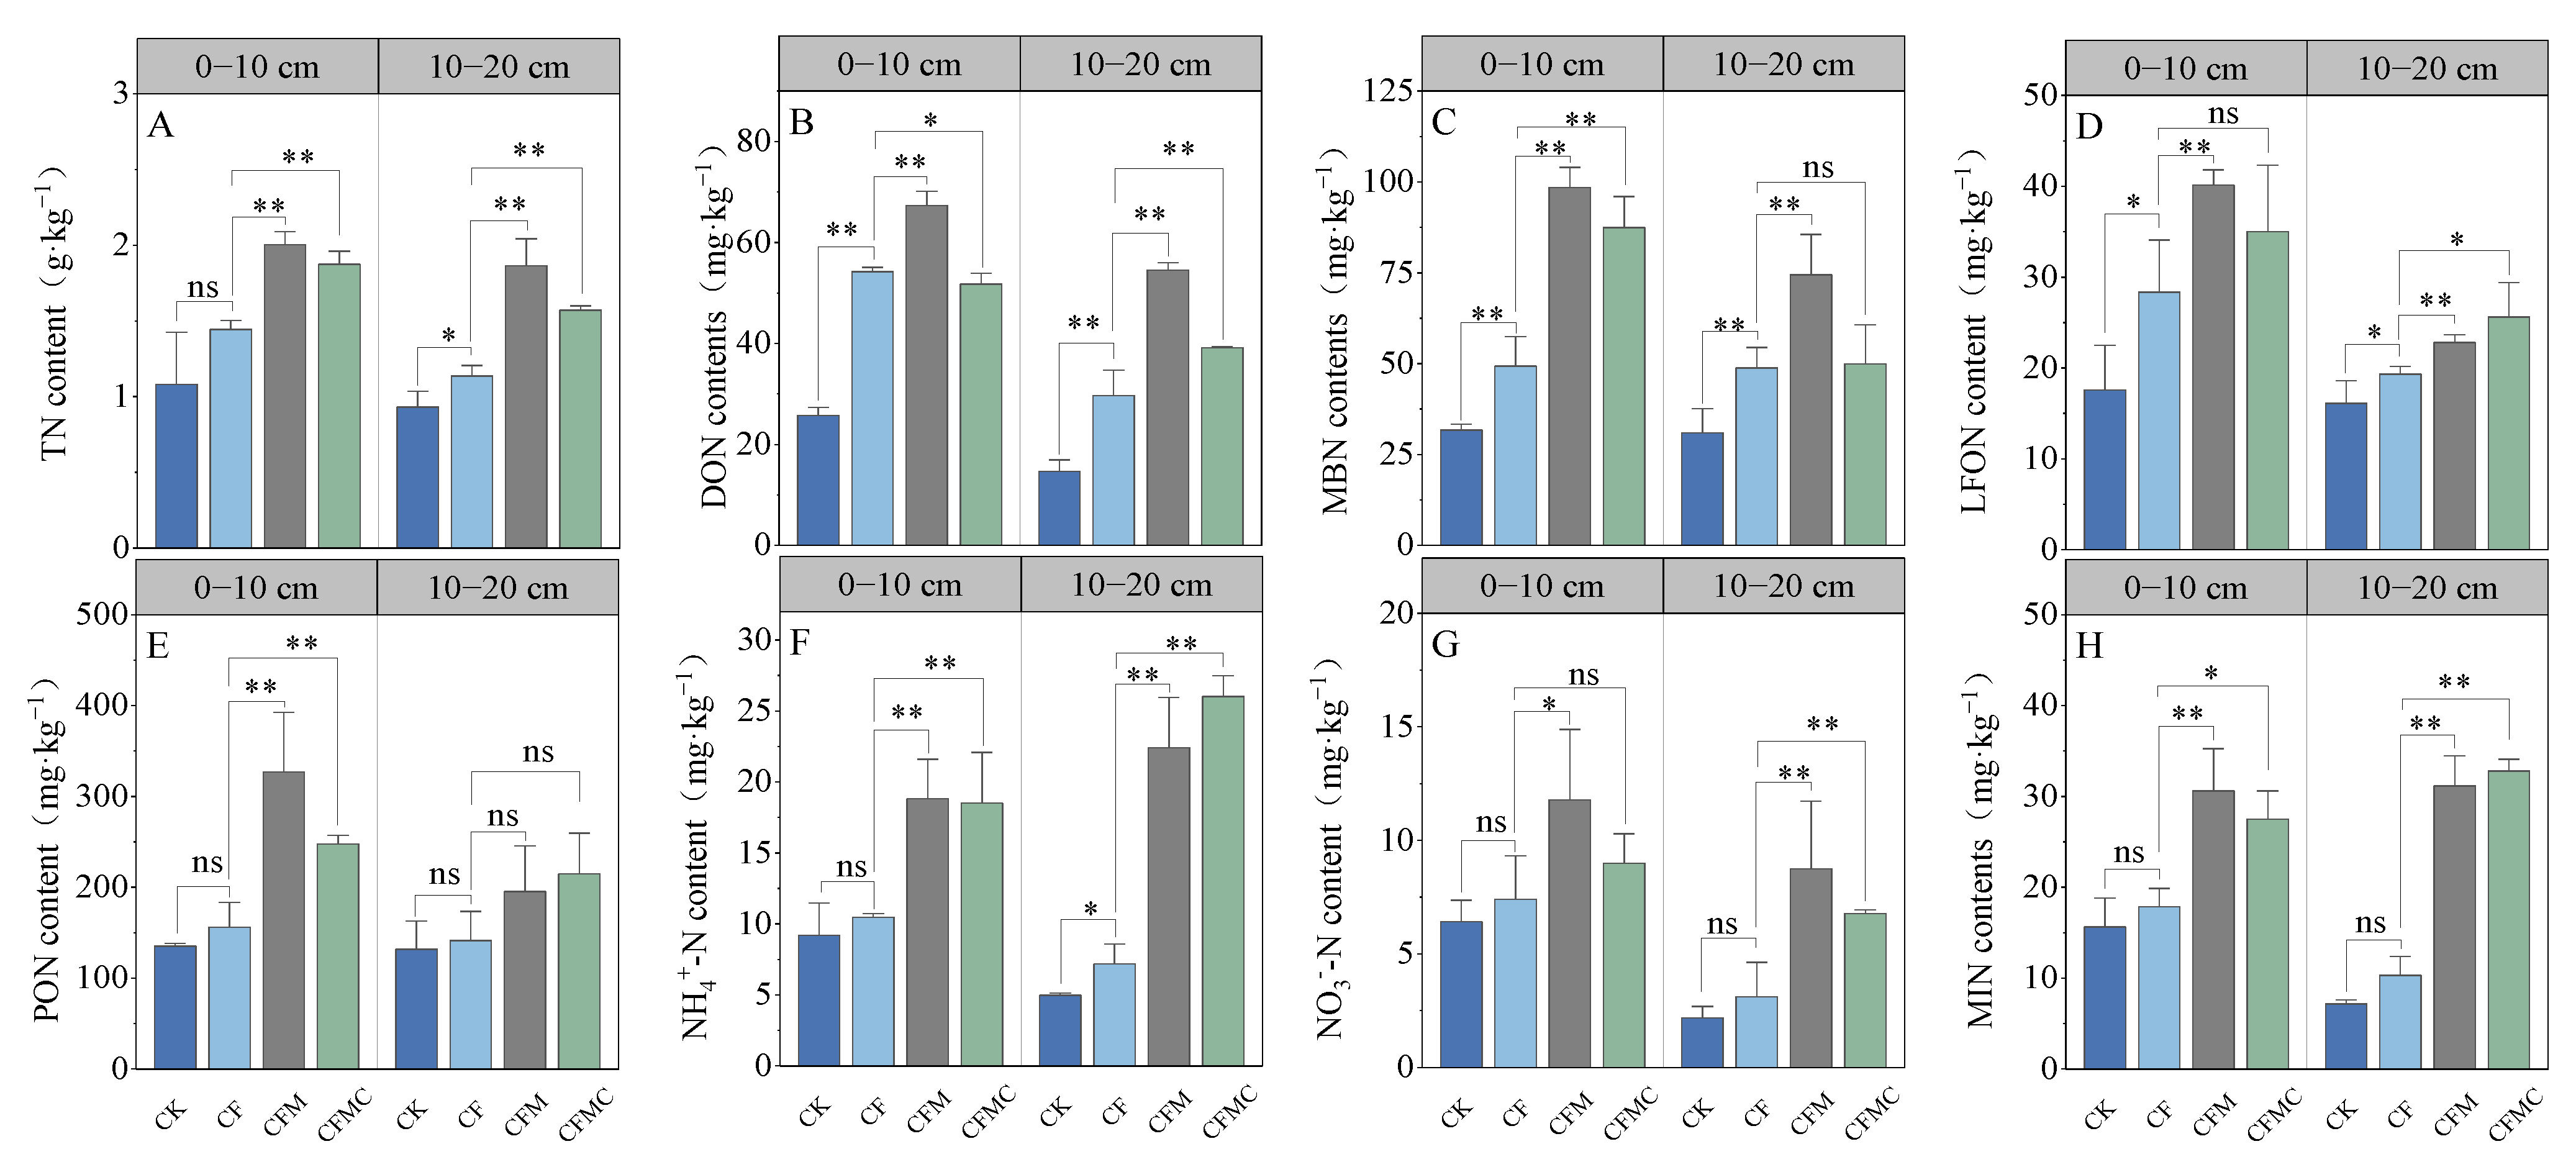
Compared with the CF treatment, substituting with partial organic fertilizers (CFM and CFMC) caused a significant increase in TN and labile N components (excluding MBN in the 10–20 cm soil depth under CFMC treatment) in both soil depths (Figure 2). Specifically, TN, DON, MBN, LFON, PON, NH4+-N, NO3-N, and MIN showed an increase of 29.74%–38.95%, 4.75%–29.94%, 77.11%–99.47%, 23.45%–41.50%, 58.74%–109.65%, 76.95%–79.94%, 21.25%–59.05%, and 53.85%–71.28% in the topsoil layer, and 37.89%–63.61%, 32.10%–83.92%, 2.33%–52.47%, 17.95%–32.60%, 38.13%–51.87%, 212.22%–262.50%, 117.86%–180.93%, and 202.76%–218.74% in the subsoil layer, respectively. The highest levels of TN, LFON, PON, DON, MBN, and NO3-N were observed in the 0–10 cm soil under the CFM treatment, while the highest NH4+-N and MIN levels were found in the 10–20 cm soil under the CFMC treatment (Figure 2). The soil layer, fertilization, and their interaction had significant impacts on LFON, PON, DON, MIN, and MBN contents (p < 0.01). The NH4+-N content was more influenced by fertilization (p < 0.01) than by the soil layer (p = 0.171). The interaction effects of soil layer and fertilization on NO3-N (p = 0.416) and TN (p = 0.331) content were deemed insignificant (Table S2).
The proportion of PON (PON/TN) ranged from 10.43% to 16.30% in this study. Labile N components of TN were found to proportion in the order of PON > MBN > DON > LFON > MIN > NH4+-N > NO3-N, indicating that the PON is a major component of TN (Table 2). Compared to the CF treatment, both the CFM and CFMC treatments significantly increased the NH4+-N/TN and MIN/TN ratios in both soil layers. Additionally, these substitution treatments led to increased ratios of MBN/TN in the topsoil depth and NO3-N/TN in the subsoil depth. Moreover, the CFM treatment increased PON/TN in the topsoil layer but decreased LFON/TN in the subsoil layer. Similarly, the CFMC treatment significantly decreased the ratios of DON/TN and MBN/TN in the topsoil and subsoil depths, respectively. Significant interactive impacts of fertilization and soil layer on the ratios of LFON/TN, DON/TN, MBN/TN, NH4+-N/TN, PON/TN, NO3-N/TN, and MIN/TN (p < 0.05) (Table 2).

3.3. Soil N Mineralization Characteristic

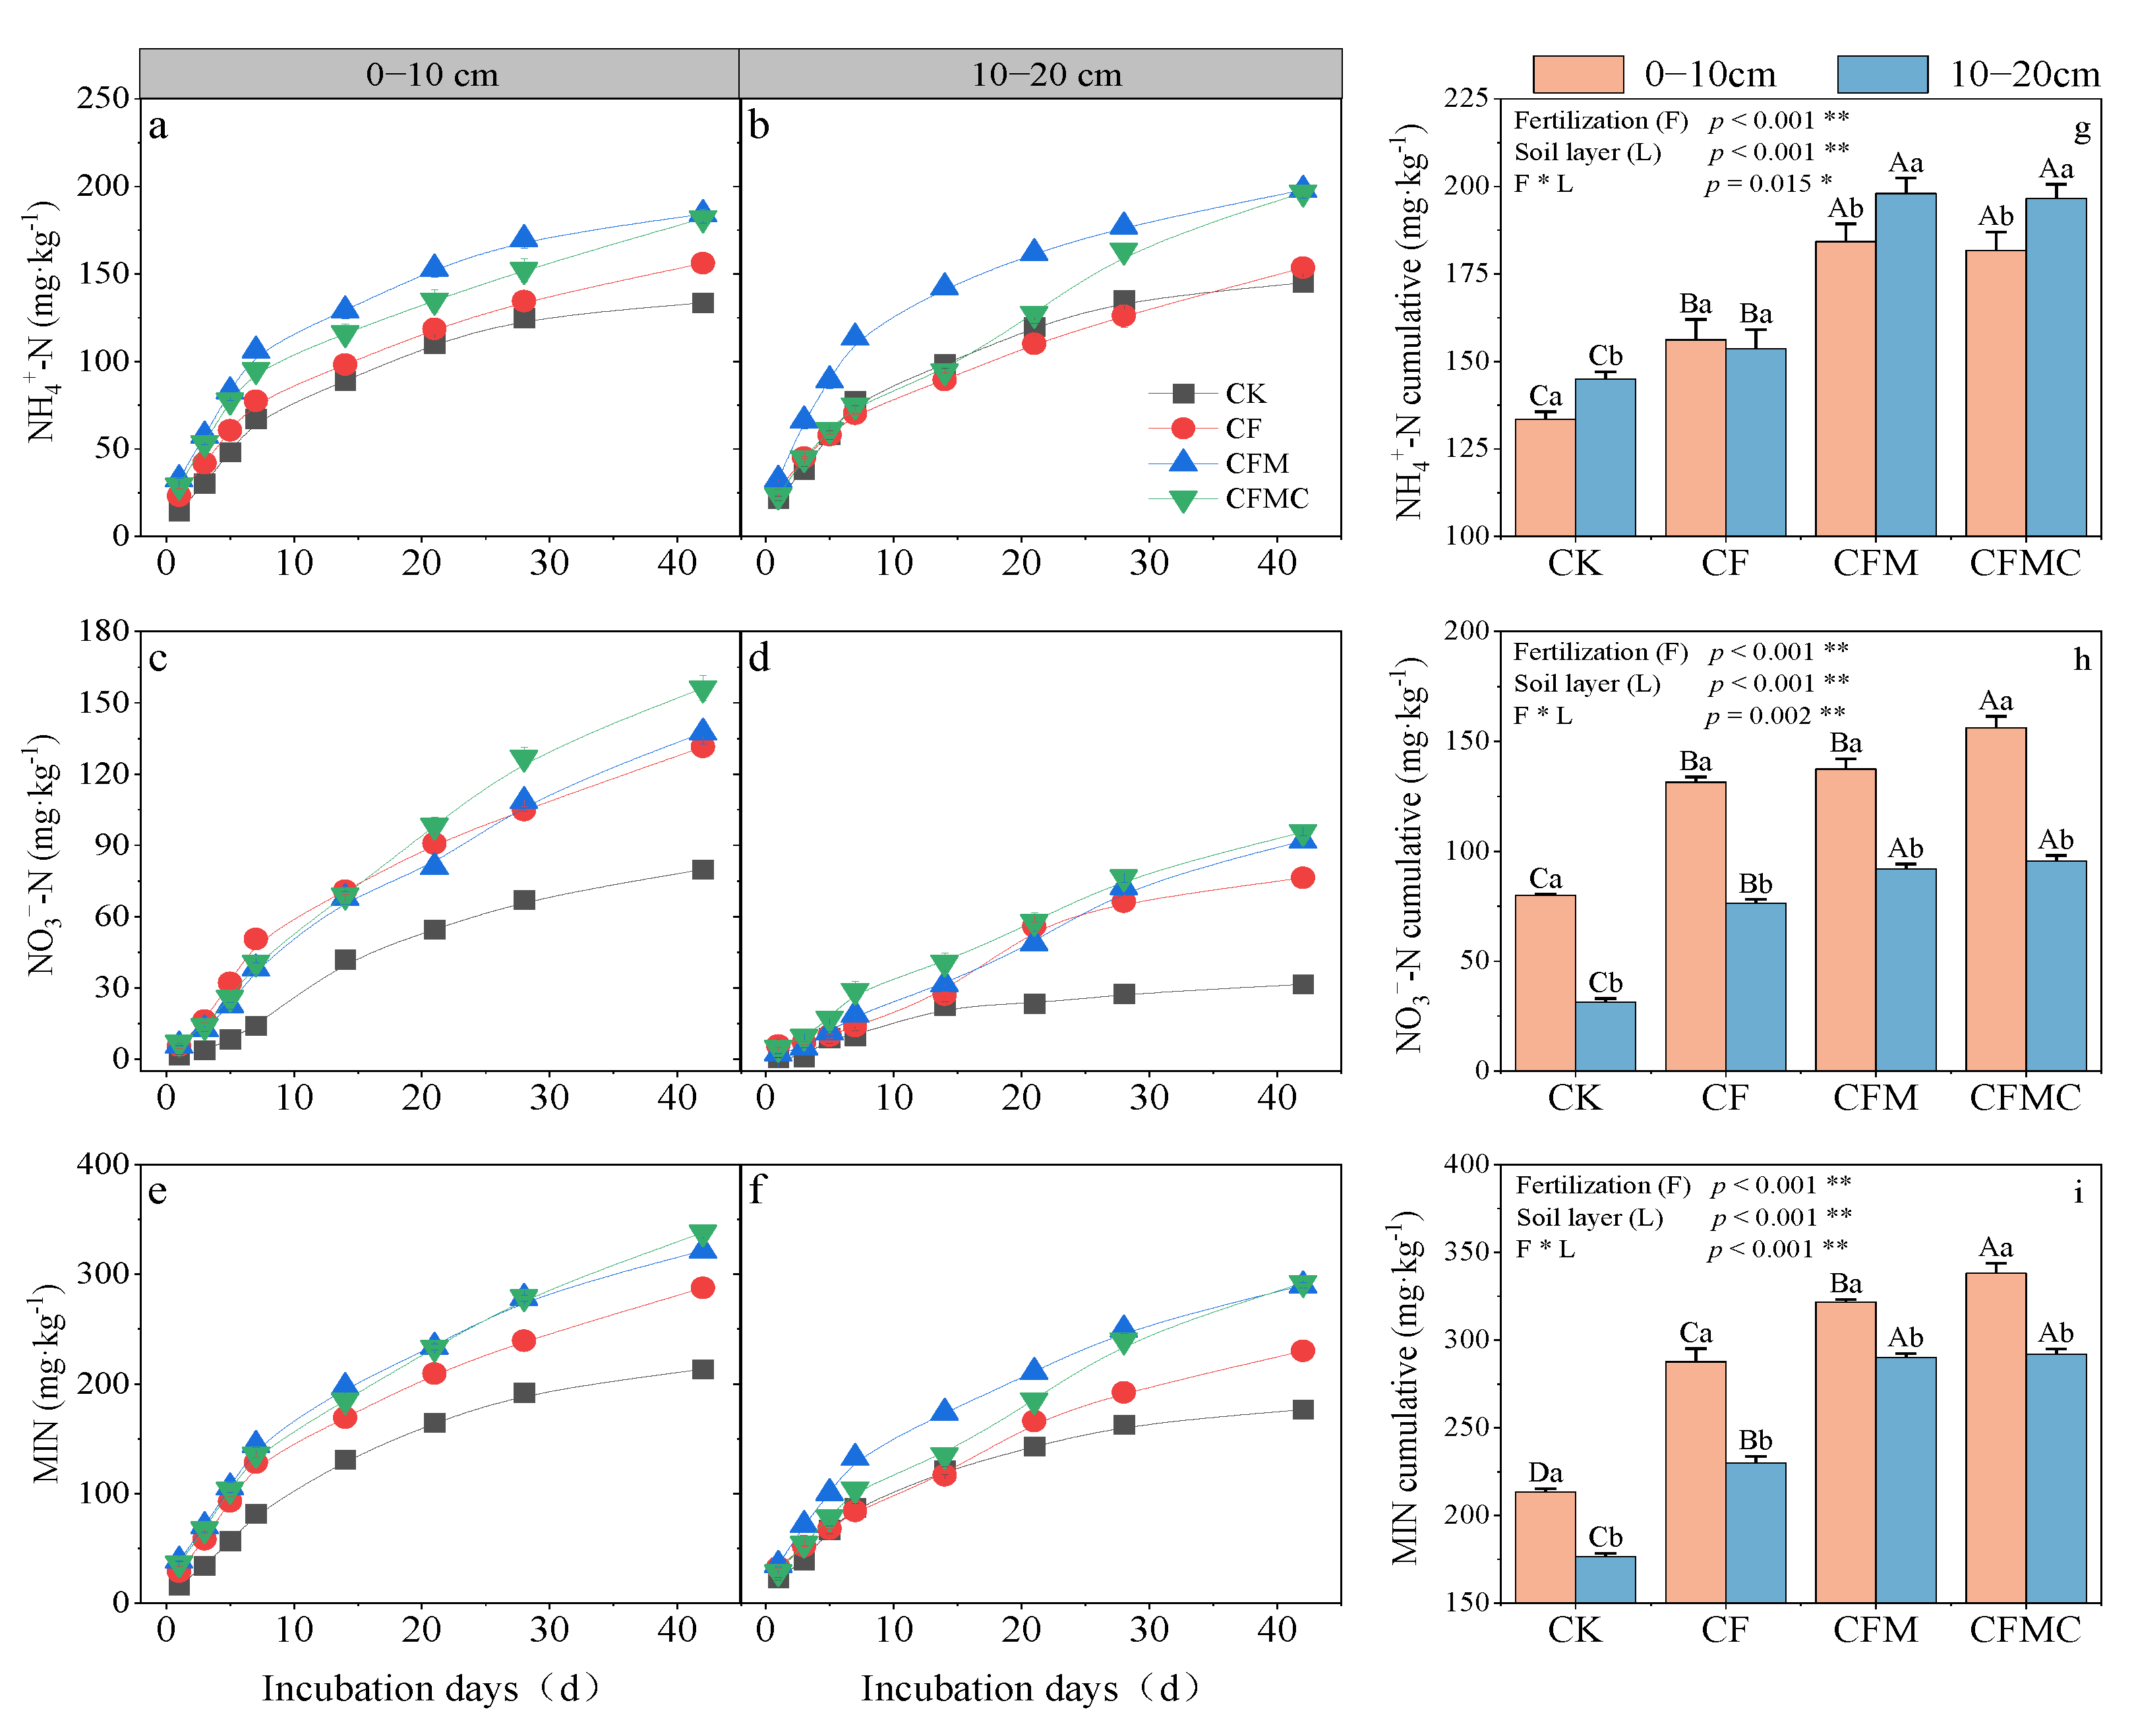
Variation trends of NH4+-N, NO3-N, and MIN concentrations were found in the four fertilization treatments, showing an initial rapid decrease followed by relative stability after 14 days (Figure S3). The cumulative production of NH4+-N, NO3-N, and MIN in the CK and CF treatments was lower than those in the CFM and CFMC treatments (Figure 3a–f). Additionally, the cumulative NO3-N and MIN concentrations in the topsoil layer were higher than those in the subsoil layer, while the NH4+-N concentrations in the topsoil layer were lower than those in the subsoil layer across all fertilization treatments. Fertilization, soil layer, and their interaction significantly influenced cumulative NH4+-N, NO3-N, and MIN production (p < 0.05) (Figure 3A–C).
First-order kinetic equations effectively modeled the changes in cumulative mineral N production (Nt) across four fertilizer treatments at two soil depths (Table 3). The N mineralization potentials (N0) ranged from 235.58 to 354.40 mg·kg−1 in the topsoil layer and from 176.60 to 312.73 mg·kg−1 in the subsoil layer. N0 in the CFM and CFMC treatments was substantially higher than that in the CF treatment for both soil layers. The ratios of N0 to TN (N0/TN) ranged from 15.40 to 20.27%, with the highest value during CK treatment and the lowest value during CFM treatment. In comparison to CF, CFM and CFMC treatments led to significant decreases in N0/TN ratios by 19.47% and 5.48% in the topsoil layer and by 24.00% and 1.77% in the subsoil layer, respectively. The N0/TN ratios were significantly influenced by fertilization, soil depth, and their interaction (p < 0.01) (Table 3).
During the incubation period, the soil net NAM, NNM, and NMin showed a range of −0.14 to 0.49, 0.04 to 0.49, and 0.10 to 0.76 mg·kg−1·d−1, respectively, across four different fertilization treatments (Figure 4). Compared to the CF, both the CFM and CFMC treatments led to a significant decrease in NAM and NMin while increasing NNM within the subsoil layers. Additionally, the CFM treatment notably reduced NAM, NNM, and NMin in the topsoil layer, with no significant differences observed under the CFMC treatment as compared to the CF treatment. It was found that fertilization, soil layer, and their interaction had significant impacts on NAM, NNM, and NMin (p < 0.01) (Table S2).

3.4. Relationship between Soil N Mineralization Parameters and Soil Factors and N Components

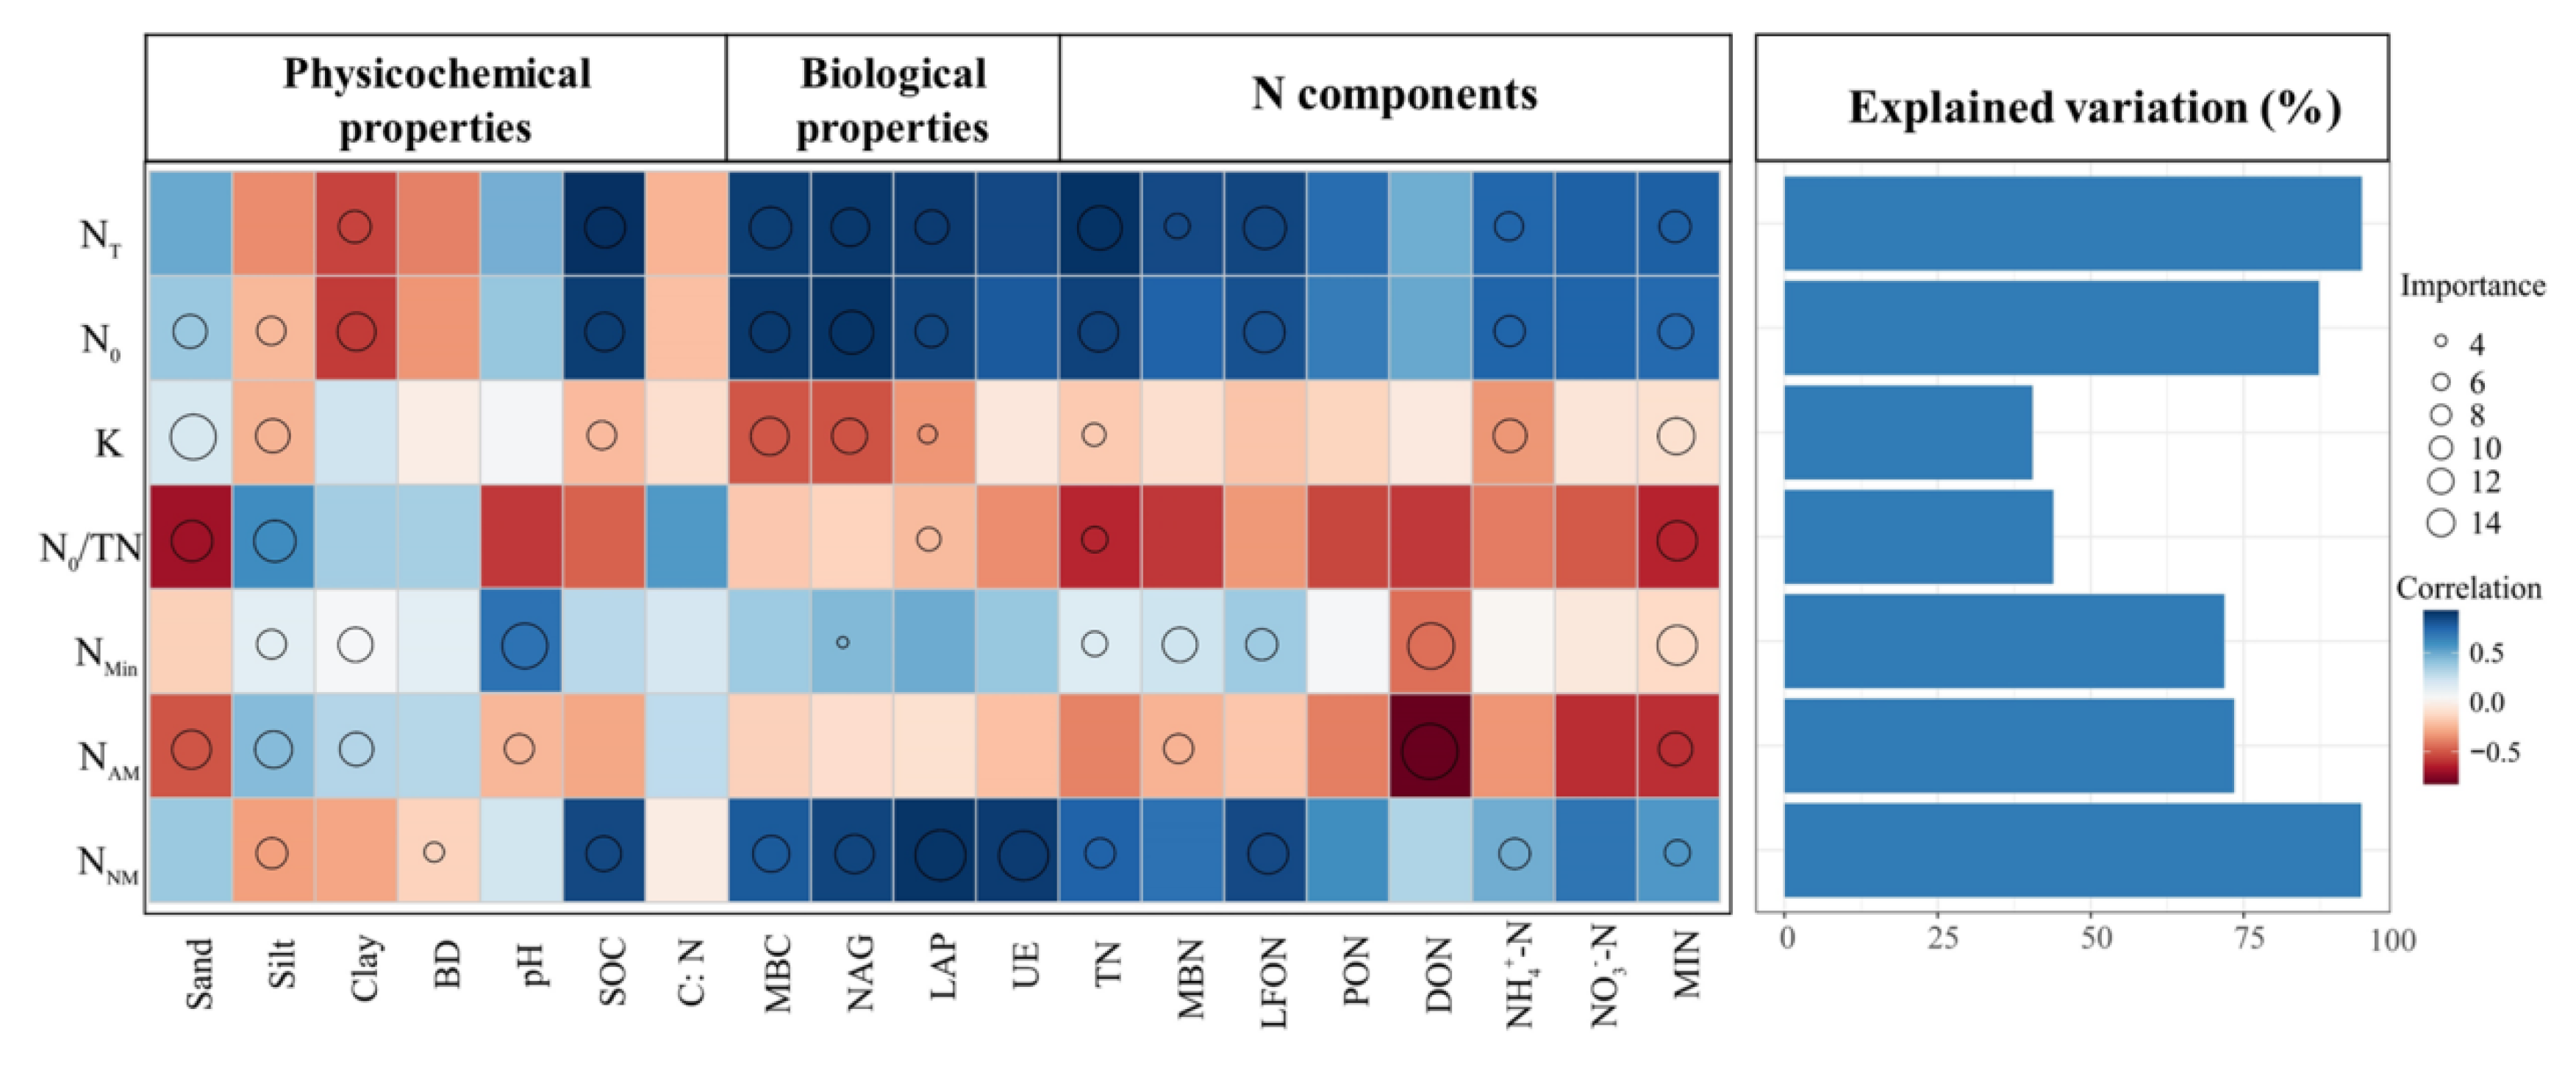
To identify the key factors that influence N mineralization characteristics, random forest regression (RFR) analysis was performed. The results indicated that the soil physicochemical properties, biological properties, and N components combined explained variation for N mineralization parameters was 40.47%–94.28% (Figure 5). Soil texture, SOC, soil biological properties, TN, LFON, and mineral N were the most important factors affecting N0. The pH, DON, and MIN were identified as the most influential factors on net mineralization rates (NMin). Similarly, biological properties and LFON were found to be key factors affecting net nitrification rates (NNM), whereas soil texture and DON were highlighted as crucial factors influencing net ammonification rates (NAM). In addition, the correlation analysis showed that the Nt, N0, and NNM exhibited positive correlations with SOC, biological properties, and N components but negative correlations with soil physical properties. The K, N0/TN, and NAM showed negative correlations with soil biological properties and N components (Figure 5).
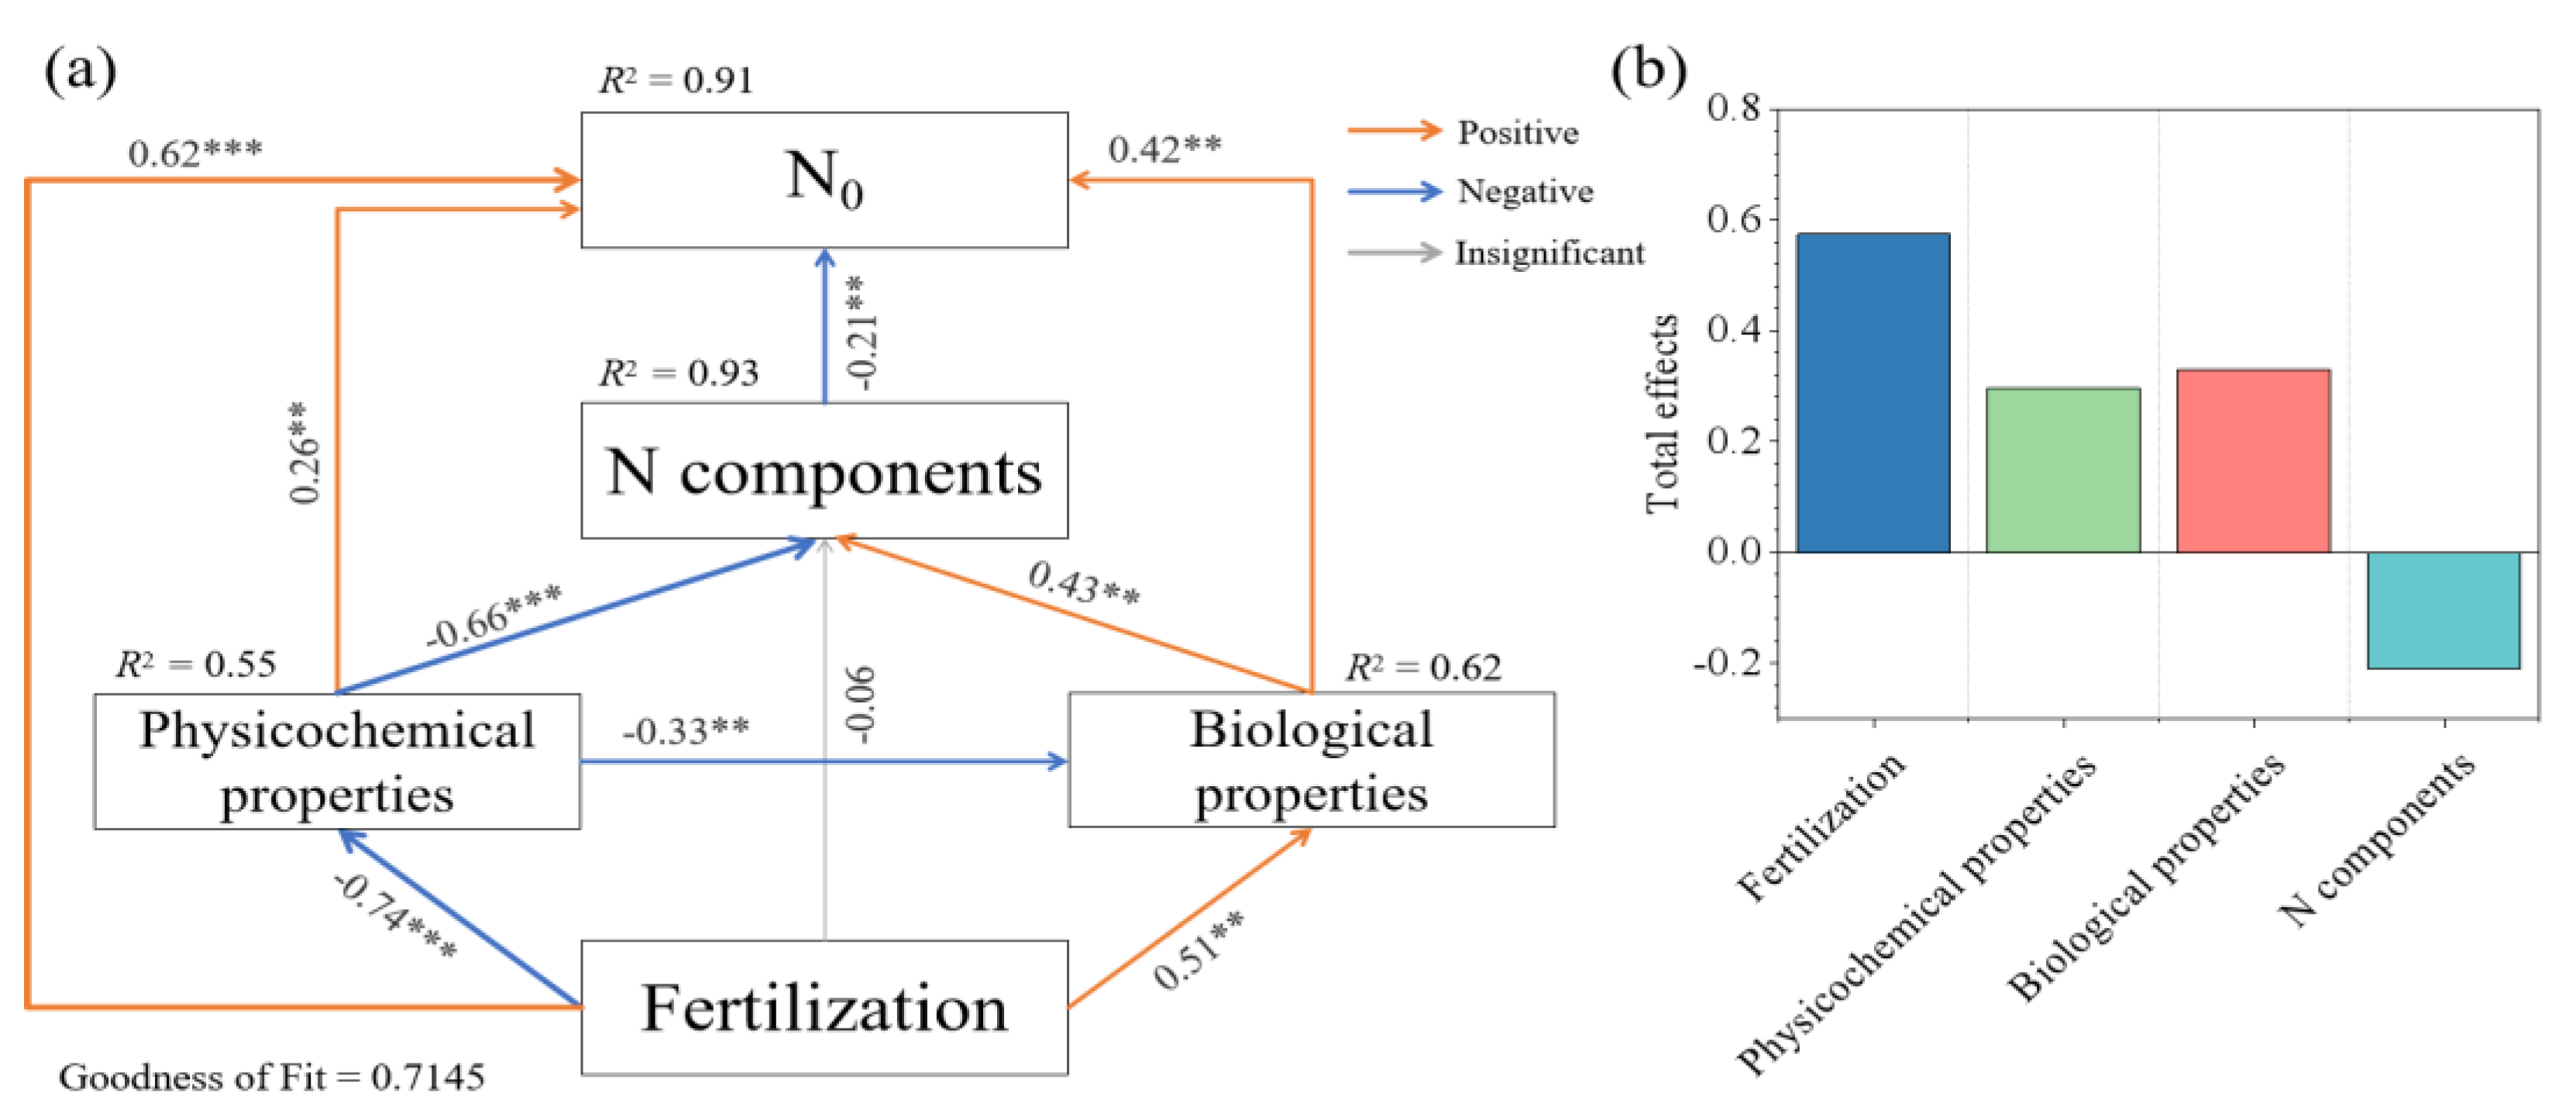
The PLS-PM identified direct and indirect fertilization treatments, soil physicochemical and biological properties, and N components on the mineralizable N potential (N0) (Figure 6). The SEM model showed that soil factors explained 91% of the variation in N0. The fertilization treatment (0.57), soil physicochemical (0.30), and biological properties (0.33) had a positive total effect on N0, while the N components (−0.21) showed a negative total effect on it (Figure 6b). Fertilization treatments were the major factor influencing the mineralizable N potential (Figure 6).

4. Discussion

4.1. Effect of Partial Organic Fertilizer Substitution on Contents of Soil TN and Labile N Components in Rubber Plantation

Comparatively to the CF treatment, the combination application of chemical and organic fertilizer resulted in significant increases in TN and labile N component contents in both soil layers (Figure 2). These results align with previous studies [13,48,49]. Zhang et al. [48] found that soil TN levels increased over 16 years in the manure and the partial substitution of chemical NPK fertilizer with manure. Conversely, TN levels decreased in the treatments solely using chemical fertilizers (NP, PK, and NPK). Similarly, Cai et al. [49] reported a significant increase in TN levels in maize crops after 32 years of continuous combined application of synthetic fertilizers and manure. In this study, the CFM and CFMC treatments exhibited significantly higher TN levels than the CF treatment despite all treatments receiving the same amount of N input (Figure 2). This difference can be attributed to two factors. Firstly, manure application increased the direct source of soil organic matter, which may have stimulated biological N fixation, resulting in higher TN levels in the partial CFM and CFMC treatments compared to the CF treatment [50,51]. Secondly, organic manure has a lower release rate of N compared to chemical fertilization, and combining chemical fertilizer with organic manure can potentially reduce N losses in soil due to leaching or denitrification, leading to more N being kept in the soil [52,53]. Additionally, organic fertilizer application has been shown to increase both above- and below-ground biomass in runner plantations, resulting in higher litter mass and a wider range of residual inputs, which can contribute to increased N levels [54,55,56]. For instance, Xu et al. [56] found that litter input has an immediate impact on soil nutrients, leading to significant decreases in soil N concentrations and soil organic matter with litter removal. Consequently, the combination application of chemicals and manure significantly enhanced TN content by 29.74%–63.61%, compared to the CF treatment (Figure 2).
Soil N availability is significantly influenced by labile N, which is the most active component in the soil N pool [57]. This study showed that the variation trend of labile N components (LFON, PON, DON, MBN, NH4+-N, NO3-N, and MIN) was consistent with that of TN, the concentrations of labile N in the CFM and CFMC treatments were higher than those in the CF treatment in both soil layers (Figure 2). This can be attributed to fertilization enhancing the decomposition of plant roots rich in nitrogen, with plant residues serving as the primary sources of PON and LFON in the soil. Additionally, organic fertilizers contain nitrogen components similar to those found in active forms. Moreover, organic fertilizers may harbor a substantial amount of microorganisms, which accelerate the decomposition of organic matter and consequently increase the active nitrogen components in the soil [58,59]. For example, Fang et al. [59] demonstrated that organic fertilizer could promote the decomposition of organic matter in the soil, resulting in the formation of DON. Moreover, the application of organic fertilizer led to an improvement in the root biomass of the rubber tree, which resulted in increased soil organic matter inputs from the process of rhizodeposition [21]. Therefore, in this study, the concentration of inorganic N was significantly higher in the partial organic fertilizer substitution treatments than in the CK and CF treatments (Figure 2). Furthermore, we observed that the NH4+-N concentration in the subsoil layer was higher than that in the topsoil layer in both organic fertilizer substitution treatments (Figure 2; Table 1). This difference may be attributed to the characteristics of soil nitrogen transportation in rubber plantations [60,61]. Ren et al. [61] found that soil N was mainly transported vertically in rubber plantations under different fertilization treatments. In addition, soil properties, such as cation exchange capacity, also affect the distribution of nitrogen in the vertical direction within the soil. The cation exchange site increases with the depth of the soil layer, which promotes nitrogen migration to the deeper soil, leading to higher NH4+-N concentrations in the 10–20 cm soil layer [47,62].

4.2. Effect of Partial Organic Fertilizer Substitution on Characteristics of Soil N Mineralization in Rubber Plantation

Compared with the CF treatment, the highest cumulative mineral N production (Nt) was recorded in the CFMC treatment, as well as the cumulative amount of NO3-N, while the cumulative NH4+-N in the CFM treatment (Figure 3). This suggests that organic fertilizer substitution application provided higher amounts of minerals N in the soil for the rubber plantations, which is consistent with previous studies [30,55,63,64]. Mailto et al. [30] reported that 26 years of a combination of mineral fertilizer and manure application significantly improved soil N mineralization and increased soil mineral N cumulative. The reason may be that organic fertilizers can enhance the activity of soil microorganisms, which are essential for soil N mineralization, by providing energy and nutrients [55]. Some organic compounds in manure can be decomposed into soluble organic nitrogen with small molecules, thereby increasing the pool of mineralizable organic N in the soil [65,66]. Moreover, the application of organic fertilizer can stimulate the metabolism of rubber tree roots, leading to increased root exudates and providing a rich source of nutrients for enzyme-producing microorganisms, ultimately increasing soil enzyme activity (Figure 1). The recalcitrant components in organic fertilizer and soil were decomposed under the catalysis of enzymes, resulting in the production of more mineral N. Both Nt and N0 were significantly positively correlated with enzyme activity, which also supported this conclusion (Figure 5).
In the present study, the N0 values ranged from 176.60 to 354.40 mg kg−1, with higher N0 levels observed in the CFM and CFMC treatments compared to the CF treatment (Table 2). This indicates that partial substitution of organic fertilizer enhances the soil N supply capacity, aligning with previous research [26,67,68]. However, our results differ from those of Mohanty et al. [69] (44.5–59.4 mg kg−1) and Maitlo et al. [30] (46–51 mg kg−1). The variability in these findings may be attributed to factors like study conditions, soil types, and fertility levels [23,28]. For example, Yang et al. [28] demonstrated that pH and SOM play a crucial role in regulating substrate supply, the primary factor influencing N mineralization. Fan et al. [29] also reported that microbial substrate availability predominantly impacts N mineralization in forest soil. Our study area is located in tropical regions with hot and humid climates, experiencing heightened microbial activity, leading to accelerated N turnover and increased N mineralization potential [31,70]. Furthermore, the sandy latosol soil in our study area, characterized by acidity and low organic matter content, exhibits a high sensitivity of soil microorganisms to external nutrient inputs (Figure 6). Consequently, in this study, we observed relatively high N0 and Nt values, and both of them were significantly correlated with soil texture, biological properties, and N components across various fertilization treatments (Figure 5).

4.3. Mechanism Influencing Net Soil N Transformation

The study found a significant relationship between the physicochemical and biological properties of soil and the process of soil N transformation. Soil texture, pH, SOC, and enzyme activities were identified as the most important factors influencing soil net N transformations (NAM, NNM, and NMin) (Figure 5), consistent with previous research [26,47,71]. Soil pH significantly influences soil fertility by impacting the form, conversion, and accessibility of soil N components [72]. The RFR results indicated that pH, clay, and silt content were the most important factors influencing NMin (Figure 5). NMin levels increased with higher soil pH, potentially due to the acidic nature and low pH values of the study site, leading to enhanced substrate availability as pH increased. Additionally, higher pH levels promote soil microorganism activity, particularly favoring the development of fungi that can efficiently break down more resistant organic materials and utilize more NO3-N as an energy source [2,71]. Consequently, the increase in fungal growth and activity due to rising soil pH could enhance soil net N mineralization.
In this study, compared with CK treatment, the long-term fertilizer applications can stimulate soil net N transformation (except for net NAM), while all soil net N transformation parameters in the CFM and CFMC treatments were lower than those in CF treatment (Figure 4). These results indicate that the supply of nitrogen and the form of nitrogen are the key factors affecting the net soil N transformation. However, we unexpectedly found that the net ammonification rate (NAM) in the CFM treatment was significantly lower than that in other fertilization treatments and even lower than that in the CK treatment (Figure 4A). First, NH4+-N is an intermediate product of organic N mineralization and is affected by the activity of nitrifying bacteria in well-ventilated soils with moderate pH. Under such conditions, a significant enhancement in the activity of nitrifying bacteria leads to the simultaneous oxidation of the large amount of ammonium nitrogen produced by organic nitrogen mineralization to NO3-N. Consequently, fewer intermediate products are accumulated in the soil [59]. Second, microbial nitrogen fixation is an important mechanism of soil nitrogen fixation [73]. The growth of soil microorganisms is more inclined to NH4+-N than to NO3-N because the energy consumed by microbial cells to absorb NO3-N is higher than the energy consumed to absorb NH4+-N [74]. Additionally, the soil nitrogen fixation rate is influenced by the soil microbial biomass, microbial diversity, and soil pH when the nitrogen content in the soil is adequate [75]. This study found that the application of organic fertilizer led to a significant increase in pH values in both soil layers compared with chemical fertilizer alone (Table 1). Despite receiving the same amount of nitrogen input, organic fertilizer not only supplied nitrogen but also other nutrients, creating a more favorable environment for microorganisms (e.g., MBC and MBN contents in the CFM and CFMC treatments were considerably greater than those in the CF treatment) (Figure 1D and Figure 2C). This promoted the oxidation and fixation of ammonium nitrogen, resulting in a significantly lower net ammonification rate in the CFM treatment than in the CF (Figure 4A).
Moreover, we also found that the soil net N transformation rate in the CFM treatment was lower than that in the CFMC treatment (Figure 4). It may be that the organic fertilizer in the CFMC treatment was composted before application. Due to rapid fermentation in the first two months of application to the experimental field, the proportion of active organic matter in the organic fertilizer was low. Organic compounds of plant origin can be rapidly consumed by various microorganisms. However, stable and hydrophobic organic compounds, such as phenols derived from lignin and microbial carbohydrates, increase with the intensity of humification of organic matter [2,76]. These exogenous organic impurities introduced into the soil cannot be completely degraded by microorganisms. This could be a possible reason for the low soil net N transformation rate in CFM treatment. In addition, the differences in soil texture may also have an impact on nitrogen transformation (Table 1).

5. Conclusions

The results demonstrated that the long-term application of chemical and organic fertilizers significantly enhanced soil fertility in rubber plantations by improving soil physicochemical properties, biological properties, and labile N components in both soil layers. Compared to CF treatment, the partial organic fertilizer substitution treatments improve the soil Nt and N0 levels, thereby increasing the availability of N for rubber tree growth and enhancing soil N supply capacity. Fertilization treatments were the major factor influencing mineralization N potential. Additionally, the rates of soil net N transformation (net NAM, NNM, and NMin) were higher in the CF treatment compared to the CFM and CFMC treatments. These findings indicate that incorporating partial organic fertilizer substitution could be an effective management strategy for improving soil fertility, enhancing soil nitrogen supply capacity, and reducing N loss by mediating soil nutrient availability and N conversion processes in rubber plantations on Hainan Island.

Supplementary Materials

The following supporting information can be downloaded at https://www.mdpi.com/article/10.3390/f15091521/s1, Figure S1. Locations of the studied sites. Figure S2. Precipitation and temperature from 1999 to 2018. Figure S3. Effect of substituting chemical N fertilizers with organic alternatives on soil N mineralization rates of rubber plantations under four fertilization regimes. CK, unfertilized as control; CF, chemical fertilizer application alone; CFM, the combination of 50% chemical N fertilizer and 50% co-composted organic N fertilizer application; CFMC, the combination of 50% chemical N fertilizer and 50% composted organic N fertilizer application. Table S1. Basic physicochemical properties of soil before planting of rubber tree (mixed soil samples). Table S2. Statistical results from ANOVA showing the effects of fertilization, soil layer, and their interactions on soil biological properties, N components, and net N mineralization parameters in rubber plantations.

Author Contributions

W.X.: Conceptualization, Investigation, Writing—original draft, Writing—review and editing; Z.W.: Funding acquisition, Conceptualization; Y.J., R.S., X.G., and M.F.: Methodology, Formal analysis; Q.Y., W.L. (Wenjie Liu), and W.L. (Wei Luo): Investigation, Supervision, Validation. All authors have read and agreed to the published version of the manuscript.

Funding

This work was financially supported by the National Natural Science Foundation of China (No. 32371637; No. 42367034; No. 32160291), the Earmarked Fund for China Agriculture Research System (No. CARS-33-ZP3), the postdoctoral research grants of Hainan Province (327908), and the Central Public-interest Scientific Institution Basal Research Fund (No. 1630022022003).

Data Availability Statement

All data are contained within the article and supplementary materials.

Conflicts of Interest

The authors declare that they have no known competing financial interests or personal relationships that could have appeared to influence the work reported in this paper.

Abbreviations

SOC, soil organic carbon; TN, total nitrogen; DON, dissolved organic nitrogen; LFON, light fraction organic nitrogen; NH4+-N, ammonium nitrogen; MIN, mineral nitrogen.

References

  1. Cheng, H.; Song, X.; Hu, Y.; Wu, T.; Yang, Q.; An, Z.; Feng, S.; Deng, Z.; Wu, W.; Zeng, X.; et al. Chromosome-level wild Hevea brasiliensis genome provides new tools for genomic-assisted breeding and valuable loci to elevate rubber yield. Plant Biotechnol. J. 2023, 21, 1058–1072. [Google Scholar] [CrossRef] [PubMed]
  2. Xu, W.X.; Liu, W.J.; Tang, S.R.; Yang, Q.; Meng, L.; Wu, Y.Z.; Wang, J.J.; Wu, L.; Wu, M.; Xue, X.X.; et al. Long-term partial substitution of chemical nitrogen fertilizer with organic fertilizers increased SOC stability by mediating soil C mineralization and enzyme activities in a rubber plantation of Hainan Island, China. Appl. Soil Ecol. 2023, 182, 104691. [Google Scholar] [CrossRef]
  3. Bai, R.; Wang, J.; Li, N. Climate change increases the suitable area and suitability degree of rubber tree powdery mildew in China. Ind. Crop. Prod. 2022, 189, 115888. [Google Scholar] [CrossRef]
  4. Cheng, C.M.; Wang, R.; Jiang, J.S. Variation of soil fertility and carbon sequestration by planting Hevea brasiliensis in Hainan Island, China. J. Environ. Sci. 2007, 19, 348–352. [Google Scholar] [CrossRef] [PubMed]
  5. Sun, Y.C.; Ma, Y.X.; Cao, K.F.; Li, H.M.; He, J.F.; Liu, C.P.; Liu, H.P.; Li, B. Impacts of Long-term Rubber Plantation on Soil Carbon and Nitrogen Sequestration in Xishuangbanna. Chin. J. Soil Sci. 2015, 46, 412–419. [Google Scholar] [CrossRef]
  6. Rao, X.; Liu, C.A.; Tang, J.W.; Nie, Y.; Liang, M.Y.; Shen, W.J.; Siddique, K.H. Rubber-leguminous shrub systems stimulate soil N2O but reduce CO2 and CH4 emissions. Forest. Ecol. Manag. 2021, 480, 118665. [Google Scholar] [CrossRef]
  7. Garousi, F.; Shan, Z.J.; Ni, K.; Yang, H.; Shan, J.; Cao, J.H.; Jiang, Z.C.; Yang, J.L.; Zhu, T.B.; Müller, C. Decreased inorganic N supply capacity and turnover in calcareous soil under degraded rubber plantation in the tropical karst region. Geoderma 2021, 381, 114754. [Google Scholar] [CrossRef]
  8. Ouyang, Y.; Norton, J.M. Short-term nitrogen fertilization affects microbial community composition and nitrogen mineralization functions in an agricultural soil. Appl. Environ. Microbiol. 2020, 86, e02278-19. [Google Scholar] [CrossRef]
  9. Siemens, J.; Kaupenjohann, M. Contribution of dissolved organic nitrogen to N leaching from four German agricultural soils. J. Plant Nutr. Soil Sci. 2002, 165, 675–681. [Google Scholar] [CrossRef]
  10. Huang, L.N.; Cheng, S.M.; Liu, H.L.; Zhao, Z.X.; Wei, S.X.; Sun, S.L. Effects of nitrogen reduction combined with organic fertilizer on growth and nitrogen fate in banana at the seedling stage. Environ. Res. 2022, 214, 113826. [Google Scholar] [CrossRef]
  11. Fujii, K.; Hayakawa, C.; Panitkasate, T.; Maskhao, I.; Funakawa, S.; Kosaki, T.; Nawata, E. Acidification and buffering mechanisms of tropical sandy soil in northeast Thailand. Soil Tillage Res. 2017, 165, 80–87. [Google Scholar] [CrossRef]
  12. Tilman, D.; Cassman, K.G.; Matson, P.A.; Naylor, R.; Polasky, S. Agricultural sustainability and intensive production practices. Nature 2017, 418, 671–677. [Google Scholar] [CrossRef] [PubMed]
  13. Salehi, A.; Fallah, S.; Sourki, A.A. Organic and inorganic fertilizer effect on soil CO2 flux, microbial biomass, and growth of Nigella sativa L. Int. Agrophys. 2017, 31, 103–116. [Google Scholar] [CrossRef]
  14. Han, Z.; Hou, H.; Yao, X.; Qian, X.; Zhou, M. Substituting Partial Chemical Fertilizers with Bio-Organic Fertilizers to Reduce Greenhouse Gas Emissions in Water-Saving Irrigated Rice Fields. Agronomy 2024, 14, 544. [Google Scholar] [CrossRef]
  15. Jin, S.Q.; Zhou, F. Zero growth of chemical fertilizer and pesticide use: China’s objectives, progress and challenges. J. Res. Ecol. 2018, 9, 50–58. [Google Scholar] [CrossRef]
  16. Zeng, Y.; He, K.; Zhang, J.; Li, P. Adoption and ex-post impacts of sustainable manure management practices on income and happiness: Evidence from swine breeding farmers in rural Hubei, China. Ecol. Econ. 2023, 208, 107809. [Google Scholar] [CrossRef]
  17. Ros, G.H.; Hoffland, E.; Kessel, C.V.; Temminghoff, E.J.M. Extractable and dissolved soil organic nitrogen–a quantitative assessment. Soil Biol. Biochem. 2009, 41, 1029–1039. [Google Scholar] [CrossRef]
  18. Wu, H.Q.; Du, S.Y.; Zhang, Y.L.; An, J.; Zou, H.T.; Zhang, Y.L.; Yu, N. Effects of irrigation and nitrogen fertilization on greenhouse soil organic nitrogen fractions and soil-soluble nitrogen pools. Agric. Water Manag. 2019, 216, 415–424. [Google Scholar] [CrossRef]
  19. Zhang, H.H.; Zhang, Y.Q.; Yan, C.R.; Liu, E.K.; Chen, B.Q. Soil nitrogen and its fractions between long-term conventional and no-tillage systems with straw retention in dryland farming in northern China. Geoderma 2016, 269, 138–144. [Google Scholar] [CrossRef]
  20. Hu, R.; Wang, X.P.; Pan, Y.X.; Zhang, Y.F.; Zhang, H.; Chen, N. Seasonal variation of net N mineralization under different biological soil crusts in Tengger Desert, North China. Catena 2015, 127, 9–16. [Google Scholar] [CrossRef]
  21. Li, Z.L.; Zeng, Z.Q.; Tian, D.S.; Wang, J.S.; Fu, Z.; Wang, B.X.; Tang, Z.; Chen, W.N.; Chen, H.Y.H.; Wang, C.H.; et al. The stoichiometry of soil microbial biomass determines the metabolic quotient of nitrogen mineralization. Environ. Res. Lett. 2020, 15, 034005. [Google Scholar] [CrossRef]
  22. Clarholm, M.; Skyllberg, U. Translocation of metals by trees and fungi regulates pH, soil organic matter turnover, and nitrogen availability in acidic forest soil. Soil Biol. Biochem. 2013, 63, 142–153. [Google Scholar] [CrossRef]
  23. Ashraf, M.N.; Hu, C.; Xu, X.R.; Aziz, T.; Wu, L.; Waqas, M.A.; Farooq, M.; Hu, X.; Zhang, W.J.; Xu, M.G. Long-term manure application increased soil organic carbon and nitrogen mineralization through the accumulation of unprotected and physically protected carbon fractions. Pedosphere 2023, 33, 343–354. [Google Scholar] [CrossRef]
  24. Yu, S.Q.; Sayer, E.J.; Li, Z.A.; Mo, Q.F.; Wang, M.; Li, Y.W.; Li, Y.X.; Xu, G.L.; Hu, Z.M.; Wang, F.M. Delayed wet season increases soil net N mineralization in a seasonally dry tropical forest. Sci. Total Environ. 2022, 823, 153314. [Google Scholar] [CrossRef]
  25. Thomas, B.W.; Sharifi, M.; Whalen, J.K.; Chantigny, M.H. Mineralizable nitrogen responds differently to manure type in contrasting soil textures. Soil Sci. Soc. Am. J. 2020, 79, 1396–1405. [Google Scholar] [CrossRef]
  26. Yang, Z.L.; Chen, X.H.; Hou, J.T.; Liu, H.Y.; Tan, W.F. Soil texture and pH exhibit important effects on biological nitrogen fixation in paddy soil. Appl. Soil Ecol. 2022, 178, 104571. [Google Scholar] [CrossRef]
  27. Zhang, L.G.; Chen, X.; Xu, Y.J.; Jin, M.C.; Ye, X.X.; Gao, H.J.; Chu, W.Y.; Mao, J.D.; Thompson, M.L. Soil labile organic carbon fractions and soil enzyme activities after 10 years of continuous fertilization and wheat residue incorporation. Sci. Rep. 2020, 10, 11318. [Google Scholar] [CrossRef]
  28. Fan, B.; Yin, L.M.; Dijkstra, F.A.; Lu, J.Y.; Shao, S.; Wang, P.; Wang, Q.K.; Cheng, W.X. Potential gross nitrogen mineralization and its linkage with microbial respiration along a forest transect in eastern China. Appl. Soil Ecol. 2022, 171, 104347. [Google Scholar] [CrossRef]
  29. Watts, D.B.; Torbert, H.A.; Prior, S.A.; Huluka, G. Long-term tillage and poultry litter impacts soil carbon and nitrogen mineralization and fertility. Soil Sci. Soc. Ame. J. 2010, 74, 1239–1247. [Google Scholar] [CrossRef]
  30. Maitlo, A.A.; Zhang, S.Q.; Ahmed, W.; Jangid, K.; Ali, S.; Yang, H.B.; Bhatti, S.M.; Duan, Y.H.; Xu, M.G. Potential nitrogen mineralization and its availability in response to long-term fertilization in a Chinese Fluvo-Aquic Soil. Agronomy 2022, 12, 1260. [Google Scholar] [CrossRef]
  31. Lan, G.Y.; Li, Y.W.; Lesueur, D.; Wu, Z.X.; Xie, G.S. Seasonal changes impact soil bacterial communities in a rubber plantation on Hainan Island, China. Sci. Total Environ. 2018, 626, 826–834. [Google Scholar] [CrossRef] [PubMed]
  32. Wang, S.; Zhang, Y.F.; Ren, C.Q.; Luo, X.H.; Xue, X.X.; Zhao, C.M.; Ma, J.Y.; Geng, J.M.; Wang, W.B. Transport of Inorganic Nitrogen in the Soil of Rubber Plantation under Different Nitrogen Application Rates at Early Stage. Chin. J. Trop. Crop. 2021, 42, 3514–3520. [Google Scholar] [CrossRef]
  33. Li, J.L.; Liang, Y.Y.; Liu, W.J.; Yang, Q.; Xu, W.X.; Tang, S.R.; Wang, J.J. Effects of manure substituting chemical nitrogen fertilizer on rubber seedling growth and soil environment. Chin. J. Appl. Ecol. 2022, 33, 431–438. [Google Scholar] [CrossRef]
  34. Fu, X.; Wei, K.; Luo, W.; Zhang, Q.; Liu, J. Effect of Organic Fertilizer Replacing Chemical Fertilizer on Growth of Rubber Cutting Tree. Spec. Econ. Anim. Plant 2022, 25, 23–28. [Google Scholar]
  35. Tang, Q.; Wu, B.; Cao, Q.; Guo, P.; Qin, J.; Liu, Z. Fertility evaluation and spatial distribution characteristics of soil nutrients of rubber plantations in Hainan Wushi farm. Guizhou Agric. Sci. 2007, 41, 116–121. [Google Scholar]
  36. Zhang, H.; Zhang, G.; Zhao, Y.; Zhao, W.; Qi, Z. Chemical degradation of a Ferralsol (Oxisol) under intensive rubber (Hevea brasiliensis) farming in tropical China. Soil Tillage Res. 2007, 93, 109–116. [Google Scholar] [CrossRef]
  37. Zhou, W.J.; Ji, H.L.; Zhu, J.; Zhang, Y.P.; Sha, L.Q.; Liu, Y.T.; Zhang, X.; Zhao, W.; Dong, Y.X.; Bai, X.L.; et al. The effects of nitrogen fertilization on N2O emissions from a rubber plantation. Sci. Rep. 2016, 6, 28230. [Google Scholar] [CrossRef]
  38. Lu, R.K. Chemical Analysis of Agricultural Soil; China Agricultural Science and Technology Press: Beijing, China, 1999. [Google Scholar]
  39. Wu, J.S.; Joergensen, R.G.; Pommerening, B.; Chaussod, R.; Brookes, P.C. Measurement of soil microbial biomass C by fumigation-extraction-an automated procedure. Soil Biol. Biochem. 1990, 22, 1167–1169. [Google Scholar] [CrossRef]
  40. Tang, S.; Cheng, W.; Hu, R.; Guigue, J.; Hattori, S.; Tawaraya, K.; Tokida, T.; Fukuoka, M.; Yoshimoto, M.; Sakai, H.; et al. Five-year soil warming changes soil C and N dynamics in a single rice paddy field in Japan. Sci. Total Environ. 2021, 756, 143845. [Google Scholar] [CrossRef]
  41. Cambardella, C.A.; Elliott, E.T. Particulate soil organic matter changes across a grassland cultivation sequence. Soil Sci. Soc. Am. J. 1992, 56, 777–783. [Google Scholar] [CrossRef]
  42. Gregorich, E.G.; Ellert, B.H. Light fraction and macro organic matter in mineral soil. In Soil Sampling and Methods of Analysis; Carter, M.R., Ed.; Lewis Publishers: Boca Raton, FL, USA, 1993; pp. 397–407. [Google Scholar]
  43. DeForest, J.L. The influence of time, storage temperature, and substrate age on potential soil enzyme activity in acidic forest soils using MUB-linked substrates and l–DOPA. Soil Biol. Biochem. 2009, 41, 1180–1186. [Google Scholar] [CrossRef]
  44. Guan, S.Y. Soil Enzyme Research Methods; Agricultural Press: Beijing, China, 1986. [Google Scholar]
  45. Marzi, M.; Shahbazi, K.; Kharazi, N.; Rezaei, M. The influence of organic amendment sources on carbon and nitrogen mineralization in different soils. J. Soil Sci. Plant Nut. 2020, 20, 177–191. [Google Scholar] [CrossRef]
  46. Ali, S.; Li, D.C.; Huang, J.; Ahmed, W.; Abbas, M.; Qaswar, M.; Anthonio, C.K.; Zhang, L.; Wang, B.R.; Xu, Y.M.; et al. Soil microbial biomass and extracellular enzymes regulate nitrogen mineralization in a wheat-maize cropping system after three decades of fertilization in a Chinese Ferrosol. J. Soil Sediment. 2020, 21, 281–294. [Google Scholar] [CrossRef]
  47. Feng, N.; Liu, D.D.; Li, Y.; Liu, P. Soil net N mineralization and hydraulic properties of carbonate-derived laterite under different vegetation types in Karst forests of China. Sci. Total Environ. 2023, 856, 159116. [Google Scholar] [CrossRef] [PubMed]
  48. Zhang, J.; Qin, J.; Yao, W.; Bi, L.; Lai, T.; Yu, X. Effect of long-term application of manure and mineral fertilizers on nitrogen mineralization and microbial biomass in paddy soil during rice growth stages. Plant Soil Environ. 2009, 55, 101–109. [Google Scholar] [CrossRef]
  49. Cai, A.D.; Xu, H.; Shao, X.F.; Zhu, P.; Zhang, W.J.; Xu, M.G.; Murphy, D.V. Carbon and Nitrogen Mineralization in Relation to Soil Particle-Size Fractions after 32 Years of Chemical and Manure Application in a Continuous Maize Cropping System. PLoS ONE 2016, 11, e0152521. [Google Scholar] [CrossRef]
  50. Bhattacharyya, R.; Kundu, S.; Prakash, V.; Gupta, H.S. Sustainability under combined application of mineral and organic fertilizers in a rainfed soybean–wheat system of the Indian Himalayas. Eur. J. Agron. 2008, 28, 33–46. [Google Scholar] [CrossRef]
  51. Yang, L.J.; Zhang, L.L.; Geisseler, D.; Wu, Z.J.; Gong, P.; Xue, Y.; Yu, C.X.; Juan, Y.H.; Horwath, W.R. Available C and N affect the utilization of glycine by soil microorganisms. Geoderma 2016, 283, 32–38. [Google Scholar] [CrossRef]
  52. Kundu, S.; Bhattacharyya, R.; Prakash, V.; Gupta, H.S.; Pathak, H.; Ladha, J.K. Long-term yield trend and sustainability of rainfed soybean–wheat system through farmyard manure application in a sandy loam soil of the Indian Himalayas. Biol. Fertil. Soil. 2007, 43, 271–280. [Google Scholar] [CrossRef]
  53. Ahmad, R.; Naveed, M.; Aslam, M.; Zahir, Z.A.; Arshad, M.; Jilani, G. Economizing the use of nitrogen fertilizer in wheat production through enriched compost. Renew. Agric. Food Syst. 2008, 23, 243–249. [Google Scholar] [CrossRef]
  54. Liu, C.A.; Nie, Y.; Zhang, Y.M.; Tang, J.W.; Siddique, K.H.M. Introduction of a leguminous shrub to a rubber plantation changed the soil carbon and nitrogen fractions and ameliorated soil environments. Sci. Rep. 2018, 8, 17324. [Google Scholar] [CrossRef]
  55. Muhdi, H.D.S.; Butar-Butar, R.D. Diversity, biomass, and carbon stock of understorey plants in the rubber agroforestry and rubber monoculture systems in Central Tapanuli District, North Sumatra, Indonesia. Biodiversitas 2020, 21, 3508–3518. [Google Scholar] [CrossRef]
  56. Xu, S.; Sayer, E.J.; Eisenhauer, N.; Lu, X.; Wang, J.; Liu, C. Aboveground litter inputs determine carbon storage across soil profiles: A meta-analysis. Plant Soil 2021, 462, 429–444. [Google Scholar] [CrossRef]
  57. Hou, Q.; Ni, Y.M.; Huang, S.; Zuo, T.; Wang, J.; Ni, W.Z. Effects of substituting chemical fertilizers with manure on rice yield and soil labile nitrogen in paddy fields of China: A meta-analysis. Pedosphere 2023, 33, 172–184. [Google Scholar] [CrossRef]
  58. Hossain, M.E.; Mei, X.R.; Zhang, W.Y.; Dong, W.Y.; Yan, Z.X.; Liu, X.; Rachit, S.; Gopalakrishnan, S.; Liu, E.K. Substitution of chemical fertilizer with organic fertilizer affects soil total nitrogen and its fractions in northern China. Int. J. Environ. Res. Public Health 2021, 18, 12848. [Google Scholar] [CrossRef] [PubMed]
  59. Fang, S.Z.; Gao, J.R.; Wang, H.Q.; Liu, J.; Yu, N.; Zhang, Y.L. Effects of combined application of nitrogen fertilizer and manure on the dynamics of net mineralized nitrogen in greenhouse soil. Chin. J. Soil Sci. 2021, 52, 1173–1181. [Google Scholar] [CrossRef]
  60. Chen, Y.C.; Liu, Z.M.; Xu, M.G.; Li, X.Q.; Ding, H.P.; Yang, C.X.; Li, C.L. Spatial distribution of soil nitrogen of rubber tree plantation and its relationship with rubber tree growth in Xishuangbanna. Southwest Chin. J. Agric. Sci. 2019, 32, 584–589. [Google Scholar] [CrossRef]
  61. Ren, C.Q.; Zhang, Y.F.; Wang, S.; Luo, X.H.; Xue, X.X.; Zhao, C.M.; Wang, W.B. Effects of different nitrogen application and ratios on the transportion Ccharacteristics of soil inorganic nitrogen in rubber plantations. Chin. J. Trop. Crop. 2023, 44, 1605–1614. [Google Scholar] [CrossRef]
  62. Wei, X.; Reich, P.B.; Hobbie, S.E.; Kazanski, C.E. Disentangling species and functional group richness effects on soil N cycling in a grassland ecosystem. Glob. Chang. Biol. 2017, 23, 4717–4727. [Google Scholar] [CrossRef]
  63. Zhang, J.B.; Zhu, T.B.; Cai, Z.C.; Qin, S.W.; Müller, C. Effects of long-term repeated mineral and organic fertilizer applications on soil nitrogen transformations. Eur. J. Soil Sci. 2012, 63, 75–85. [Google Scholar] [CrossRef]
  64. Ahmed, W.; Liu, K.L.; Qaswar, M.; Huang, J.; Huang, Q.H.; Xu, Y.M.; Ali, S.; Mehmood, S.; Asghar, R.M.; Mahmood, M.; et al. Long-term mineral fertilization improved the grain yield and phosphorus use efficiency by changing soil P fractions in ferralic cambisol. Agronomy 2019, 9, 784. [Google Scholar] [CrossRef]
  65. Wu, H.; Cai, A.; Xing, T.; Huai, S.; Zhu, P.; Xu, M.; Lu, C. Fertilization enhances mineralization of soil carbon and nitrogen pools by regulating the bacterial community and biomass. J. Soil Sediment. 2021, 21, 1633–1643. [Google Scholar] [CrossRef]
  66. Liu, W.; Chen, X.L.; Zhao, Y.Y.; Wang, D.X.; Xie, T.Q.; Lv, J.G.; Jin, D.F.; Shi, H.Z. Effects of organic fertilizers on nitrogen mineralization, soil enzyme activities and microbial communities in tobacco-planting soil. Soil 2023, 55, 1025–1034. [Google Scholar]
  67. Benedetti, A.; Sebastiani, G. Determination of potentially mineralizable nitrogen in agricultural soil. Biol. Fertil. Soils 1996, 21, 114–120. [Google Scholar] [CrossRef]
  68. Lv, Z.Z.; Wu, X.D.; Liu, Y.R.; Lan, J.X.; Hou, H.Q.; Ji, J.H.; Liu, X.M. Nitrogen mineralization characteristics of red paddy soil under long-term different proportions of organic and inorganic fertilization. Soil Fertr. Sci. Chin. 2021, 21, 47–53. [Google Scholar] [CrossRef]
  69. Mohanty, S.; Nayak, A.K.; Kumar, A.; Tripathi, R.; Shahid, M.; Bhattacharyya, P.; Raja, R.; Panda, B.B. Carbon and nitrogen mineralization kinetics in soil of rice–rice system under long term application of chemical fertilizers and farmyard manure. Eur. J. Soil Biol. 2013, 58, 113–121. [Google Scholar] [CrossRef]
  70. Luce, M.S.; Whalen, J.K.; Ziadi, N.; Zebarth, B.J. Net nitrogen mineralization is enhanced with the addition of nitrogen-rich particulate organic matter. Geoderma 2016, 262, 112–118. [Google Scholar] [CrossRef]
  71. Zhu, T.B.; Meng, T.Z.; Zhang, J.B.; Yin, Y.F.; Cai, Z.C.; Yang, W.Y.; Zhong, W.H. Nitregon mineralization, immobilization turnover, heterotrophic nitrification, and microbial groups in acid forest soils of subtropical China. Biol. Fertil. Soil 2013, 49, 323–331. [Google Scholar] [CrossRef]
  72. Huang, T.T.; Yang, N.; Lu, C.; Qin, X.L.; Siddique, K.H. Soil organic carbon, total nitrogen, available nutrients, and yield under different straw returning methods. Soil Tillage Res. 2021, 214, 105171. [Google Scholar] [CrossRef]
  73. Zhao, H.T.; Zhang, X.L.; Xu, S.T.; Zhao, X.G.; Xie, Z.B.; Wang, Q.B. Effect of freezing on soil N mineralization under different plant communities in a semi-arid area during a non-growing season. Appl. Soil Ecol. 2010, 45, 187–192. [Google Scholar] [CrossRef]
  74. Lu, M.; Cheng, S.; Fang, H.; Xu, M.; Yang, Y.; Li, Y.; Zhang, J.; Müller, C. Organic nitrogen addition causes decoupling of microbial nitrogen cycles by stimulating gross nitrogen transformation in a temperate forest soil. Geoderma 2021, 385, 114886. [Google Scholar] [CrossRef]
  75. Chen, D.; Xing, W.; Lan, Z.; Saleem, M.; Wu, Y.; Hu, S.; Bai, Y. Direct and indirect effects of nitrogen enrichment on soil organisms and carbon and nitrogen mineralization in a semi-arid grassland. Funct. Ecol. 2019, 33, 175–187. [Google Scholar] [CrossRef]
  76. Leogrande, R.; Vitti, C.; Castellini, M.; Garofalo, P.; Samarelli, I.; Lacolla, G.; Montesano, F.F.; Spagnuolo, M.; Mastrangelo, M.; Stellacci, A.M. Residual effect of compost and biochar amendment on soil chemical, biological, and physical properties and durum wheat response. Agronomy 2024, 14, 749. [Google Scholar] [CrossRef]
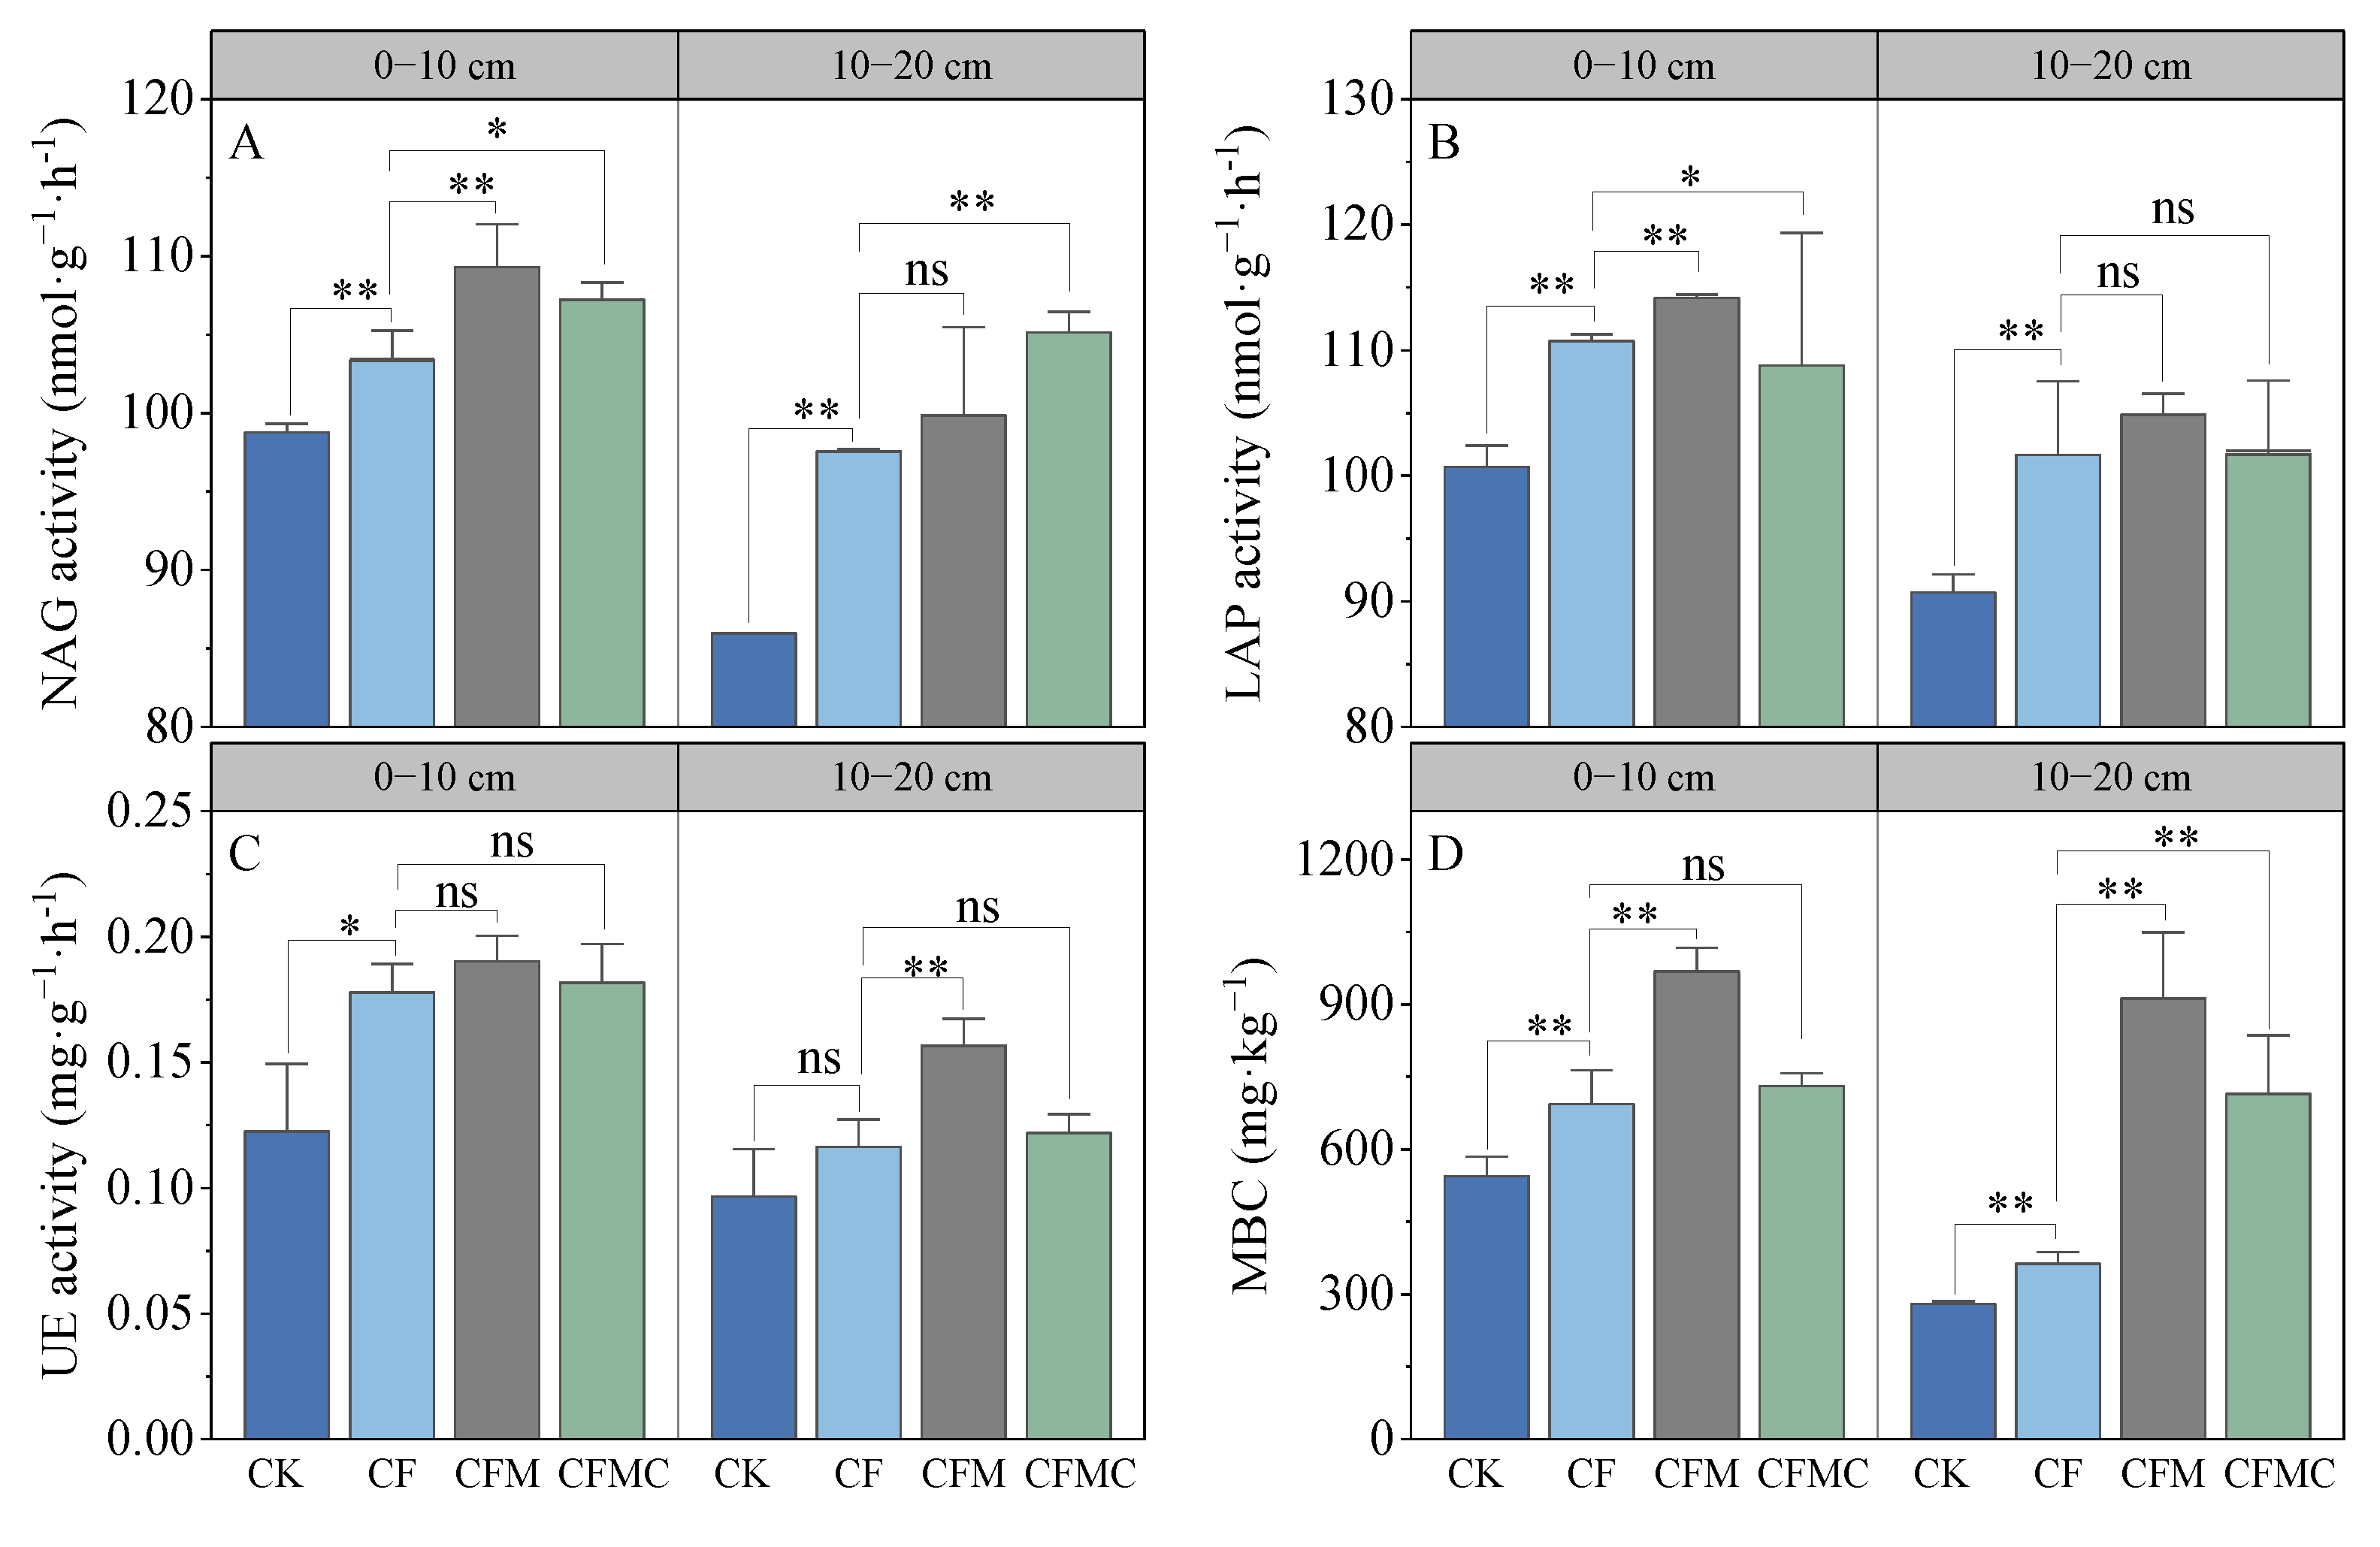
Figure 1. Effect of substituting chemical N fertilizers with organic alternatives on soil biological properties: (A) β-1, 4-N-acetyl-Glycosaminidase activity (NAG), (B) L-Leucine aminopeptidase activity (LAP), (C) urease activity (UE), and (D) microbial biomass carbon (MBC) in rubber plantations. CK, unfertilized as control; CF, chemical fertilizer application alone; CFM, the combination of 50% chemical N fertilizer and 50% co-composted organic N fertilizer application; CFMC, the combination of 50% chemical N fertilizer and 50% composted organic N fertilizer application. **, p < 0.01; *, p < 0.05; ns, p > 0.05.
Forests 15 01521 g001
Figure 2. Effect of substituting chemical N fertilizers with organic alternatives on (A) total nitrogen (TN); (B) dissolved organic nitrogen (DON); (C) microbial biomass nitrogen (MBN); (D) light fraction organic nitrogen (LFON); (E) particulate organic nitrogen (PON); (F) ammonium nitrogen (NH4+-N); (G) nitrate nitrogen (NO3-N); (H) mineral nitrogen (MIN). CK, unfertilized as control; CF, chemical fertilizer application alone; CFM, the combination of 50% chemical N fertilizer and 50% co-composted organic N fertilizer application; CFMC, the combination of 50% chemical N fertilizer and 50% composted organic N fertilizer application. **, p < 0.01; *, p < 0.05; ns, p > 0.05.
Forests 15 01521 g002
Figure 3. Effect of substituting chemical N fertilizers with organic alternatives on N mineralization characteristics (af) and accumulated inorganic N production after 6 weeks of incubation (gi) of rubber plantations under four fertilization regimes. CK, unfertilized as control; CF, chemical fertilizer application alone; CFM, the combination of 50% chemical N fertilizer and 50% co-composted organic N fertilizer application; CFMC, the combination of 50% chemical N fertilizer and 50% composted organic N fertilizer application. Uppercase and lowercase letters signify significant differences (p < 0.05) in soil factors among four fertilization treatments within the same soil layer and between two soil layers for the same treatment, respectively. **, p < 0.01; *, p < 0.05.
Forests 15 01521 g003
Figure 4. Effect of substituting chemical N fertilizers with organic alternatives on (A) net soil N ammonification rates (Net NAM); (B) net soil N nitrification rates (Net NNM); (C) net soil N mineralization rates (Net NMin) of rubber plantations. CK, unfertilized as control; CF, chemical fertilizer application alone; CFM, the combination of 50% chemical N fertilizer and 50% co-composted organic N fertilizer application; CFMC, the combination of 50% chemical N fertilizer and 50% composted organic N fertilizer application. **, p < 0.01; *, p < 0.05; ns, p > 0.05.
Forests 15 01521 g004
Figure 5. Contributions of soil physicochemical properties, biological properties, and N components to N mineralization parameters based on correlation and random forest model. Circle size represents the variables' importance (percentage of increase in mean square error calculated via random forest model). Colors represent Spearman correlations. Blue bars illustrate the cumulative contribution of environmental factors to nitrogen mineralization.
Forests 15 01521 g005
Figure 6. Partial least squares path modelling disentangling major pathways of the influences of fertilization, soil physicochemical properties, biological properties, and N components on N mineralization potentials (N0) (a) and their standardized total effects derived from the model (b). Numbers adjacent to measured variables are their coefficients with composite variables. Numbers adjacent to arrows are path coefficients are the directly standardized effect size of the relationship. **: p < 0.01, ***: p < 0.001.
Forests 15 01521 g006
Table 1. Effect of substituting chemical N fertilizers with organic alternatives on soil physicochemical properties of rubber plantations.
TreatmentsSoil Layer Sand
(%)
Silt
(%)
Clay
(%)
BD
(g·cm−3)
pHSOC
(g·kg−1)
C:N
Ratio
CK0–10
cm
42.87 ± 1.29 Ca46.67 ± 1.40 Bb10.46 ± 0.31 Ba1.68 ± 0.03 Aa4.98 ± 0.02 Bb13.58 ± 0.25 Ca11.41 ± 1.05 Aa
CF49.68 ± 0.75 Ba37.33 ± 0.56 Cb12.98 ± 0.19 Aa1.66 ± 0.06 Aa5.13 ± 0.03 Aa16.58 ± 0.12 Ba11.49 ± 0.25 Aa
CFM64.29 ± 0.36 Aa29.27 ± 0.29 Da6.46 ± 0.06 Cb1.50 ± 0.16 Aa5.23 ± 0.13 Ab19.04 ± 1.47 Aa9.50 ± 0.86 Ba
CFMC41.16 ± 0.62 Ca53.33 ± 0.80 Aa5.50 ± 0.08 Cb1.63 ± 0.04 Aa5.18 ± 0.07 Ab19.62 ± 0.10 Aa10.48 ± 0.30 ABa
CK10–20 cm36.03 ± 0.54 Db54.58 ± 0.75 Aa9.45 ± 0.32 Bb1.67 ± 0.03 Aa5.03 ± 0.01 Da9.46 ± 0.89 Db10.19 ± 0.94 Aa
CF45.19 ± 0.18 Bb43.97 ± 0.18 Ca10.84 ± 0.04 Ab1.60 ± 0.11 ABa5.15 ± 0.04 Ca12.21 ± 0.23 Cb10.72 ± 0.23 Ab
CFM62.88 ± 1.07 Aa28.63 ± 0.57 Da8.63 ± 0.15 Ca1.49 ± 0.06 Ba5.68 ± 0.05 Aa18.59 ± 0.98 Aa10.02 ± 1.07 Aa
CFMC40.74 ± 1.22 Ca52.61 ± 1.45 Ba6.75 ± 0.19 Da1.55 ± 0.08 ABa5.33 ± 0.02 Ba15.18 ± 0.71 Bb9.66 ± 0.36 Ab
ANOVA results (F-values)
Fertilization (F)1029.45 **957.87 **1032.87 **4.75 *63.54 **111.40 **4.46 *
Soil layer (L)91.51 **86.81 **0.72 ns1.39 ns49.32 **117.90 **3.80 ns
F × L18.16 **42.64 **155.39 **0.24 ns17.23 **9.91 **1.63 ns
CK, unfertilized as control; CF, chemical fertilizer application alone; CFM, the combination of 50% chemical N fertilizer and 50% co-composted organic N fertilizer application; CFMC, the combination of 50% chemical N fertilizer and 50% composted organic N fertilizer application. Uppercase and lowercase letters signify significant differences (p < 0.05) in soil factors among four fertilization treatments within the same soil layer and between two soil layers for the same treatment, respectively. Numbers mean F-values, **, p < 0.01; *, p < 0.05; ns, p > 0.05.
Table 2. The proportions of labile N components accounting for TN of rubber plantations under four fertilization regimes.
TreatmentsSoil LayerLFON/TNPON/TNDON/TNMBN/TNNH4+-N/TNNO3-N/TNMIN/TN
(%)
CK0–10
cm
1.63 ± 0.10 Ba12.95 ± 3.02 ABa2.44 ± 0.43 Ba3.04 ± 0.76 Ba0.86 ± 0.04 ABa0.60 ± 0.07 Aa1.46 ± 0.12 Aa
CF1.96 ± 0.23 ABa10.80 ± 1.15 Ba3.76 ± 0.08 Aa3.42 ± 0.39 Bb0.73 ± 0.03 Ba0.52 ± 0.10 Aa1.24 ± 0.13 Ba
CFM2.00 ± 0.01 Aa16.30 ± 2.20 Aa3.36 ± 0.18 Aa4.91 ± 0.17 Aa0.94 ± 0.11 Ab0.59 ± 0.11 Aa1.53 ± 0.19 Aa
CFMC1.87 ± 0.23 ABa13.23 ± 0.70 ABa2.77 ± 0.11 Ba4.68 ± 0.43 Aa0.99 ± 0.15 Ab0.48 ± 0.04 Aa1.47 ± 0.14 Ab
CK10–20
cm
1.73 ± 0.07 Aa14.26 ± 2.76 Aa1.58 ± 0.08 Cb3.34 ± 0.51 BCa0.54 ± 0.03 Cb0.24 ± 0.05 Bb0.77 ± 0.08 Cb
CF1.70 ± 0.10 Aa12.38 ± 1.45 ABa2.61 ± 0.39 ABb4.28 ± 0.23 Aa0.63 ± 0.06 Ca0.27 ± 0.10 Bb0.90 ± 0.12 Cb
CFM1.23 ± 0.10 Bb10.43 ± 1.20 Bb2.93 ± 0.18 Ab3.99 ± 0.17 ABb1.20 ± 0.06 Ba0.47 ± 0.12 Aa1.67 ± 0.07 Ba
CFMC1.63 ± 0.17 Aa13.66 ± 1.79 Aa2.49 ± 0.03 Bb3.18 ± 0.49 Cb1.66 ± 0.04 Aa0.43 ± 0.01 Aa2.09 ± 0.03 Aa
ANOVA results (F-values)
Fertilization (F)2.45 ns1.43 ns33.57 **8.38 **96.29 **3.07 ns52.53 **
Soil layer (L)24.37 **0.64 ns51.29 **3.12 ns15.60 **31.62 **1.93 ns
F × L9.07 **4.94 *4.50 *9.26 **46.36 **4.12 *34.79 **
CK, unfertilized as control; CF, chemical fertilizer application alone; CFM, the combination of 50% chemical N fertilizer and 50% co-composted organic N fertilizer application; CFMC, the combination of 50% chemical N fertilizer and 50% composted organic N fertilizer application. Uppercase and lowercase letters signify significant differences (p < 0.05) in soil factors among four fertilization treatments within the same soil layer and between two soil layers for the same treatment, respectively. Numbers mean F-values, **, p < 0.01; *, p < 0.05; ns, p > 0.05.
Table 3. First-order kinetic parameters for N mineralization of rubber plantations under four fertilization regimes.
TreatmentsSoil Layer
(cm)
Fitting ParametersN0/TN (%)
N0 (mg·kg−1)k (d−1)R2
CK0–10235.58 ± 4.49 Da0.058 ± 0.002 Ab0.99819.80 ± 1.81 Aa
CF289.43 ± 16.4 Ca0.069 ± 0.009 Aa0.98320.04 ± 0.57 Aa
CFM323.24 ± 17.19 Ba0.073 ± 0.009 Aa0.98316.14 ± 1.26 Ba
CFMC354.40 ± 8.02 Aa0.058 ± 0.009 Aa0.97618.95 ± 0.97 ABa
CK10–20176.60 ± 5.30 Db0.089 ± 0.007 Aa0.99219.03 ± 0.87 Ba
CF230.21 ± 20.57 Cb0.059 ± 0.011 Ba0.96720.27 ± 2.50 Aa
CFM286.21 ± 17.28 Bb0.077 ± 0.011 ABa0.97515.40 ± 1.51 Ca
CFMC312.73 ± 7.92 Ab0.041 ± 0.009 Ca0.97119.91 ± 0.35 Ab
ANOVA results (F-values)
Fertilization (F)131.322 **9.562 ** 15.135 **
Soil layer (L)37.878 **3.063 ns 2.473 ns
F × L12.327 **7.563 ** 5.566 **
CK, no fertilizer application as control; CF, conventional fertilizer application; CFM, the combination of 50% chemical N fertilizer and 50% co-composted organic N fertilizer application; CFMC, the combination of 50% chemical N fertilizer and 50% composted organic N fertilizer application. Uppercase and lowercase letters signify significant differences (p < 0.05) in soil factors among four fertilization treatments within the same soil layer and between two soil layers for the same treatment, respectively. Numbers mean F-values, **, p < 0.01; ns, p > 0.05.
Disclaimer/Publisher’s Note: The statements, opinions and data contained in all publications are solely those of the individual author(s) and contributor(s) and not of MDPI and/or the editor(s). MDPI and/or the editor(s) disclaim responsibility for any injury to people or property resulting from any ideas, methods, instructions or products referred to in the content.