Article

Forest Wildfire Risk Assessment of Anning River Valley in Sichuan Province Based on Driving Factors with Multi-Source Data

1
School of Smart City, Chongqing Jiaotong University, Chongqing 400074, China
2
Aerospace Information Research Institute, Chinese Academy of Sciences, Beijing 100094, China
3
State Key Laboratory of Geohazard Prevention and Geo-Environment Protection, Chengdu University of Technology, Chengdu 610059, China
4
State Environmental Protection Key Laboratory of Synergetic Control and Joint Remediation for Soil & Water Pollution, Chengdu University of Technology, Chengdu 610059, China
5
International Research Center of Big Data for Sustainable Development Goals, Beijing 100094, China
6
China Meteorological Services Association, Beijing 100081, China
7
Forest Fire Warning and Monitoring Information Center, Ministry of Emergency Management, Beijing 100054, China
*
Authors to whom correspondence should be addressed.
Forests 2024, 15(9), 1523; https://doi.org/10.3390/f15091523
Submission received: 20 July 2024 / Revised: 16 August 2024 / Accepted: 27 August 2024 / Published: 29 August 2024
(This article belongs to the Special Issue Forest Fires Prediction and Detection—2nd Edition)

Abstract

:
Forest fires can lead to a decline in ecosystem functions, such as biodiversity, soil quality, and carbon cycling, causing economic losses and health threats to human societies. Therefore, it is imperative to map forest-fire risk to mitigate the likelihood of forest-fire occurrence. In this study, we utilized the hierarchical analysis process (AHP), a comprehensive weighting method (CWM), and random forest to map the forest-fire risk in the Anning River Valley of Sichuan Province. We selected non-photosynthetic vegetation (NPV), photosynthetic vegetation (PV), normalized difference vegetation index (NDVI), plant species, land use, soil type, temperature, humidity, rainfall, wind speed, elevation, slope, aspect, distance to road, and distance to residential as forest-fire predisposing factors. We derived the following conclusions. (1) Overlaying historical fire points with mapped forest-fire risk revealed an accuracy that exceeded 86%, indicating the reliability of the results. (2) Forest fires in the Anning River Valley primarily occur in February, March, and April, typically months characterized by very low rainfall and dry conditions. (3) Areas with high and medium forest-fire risk were mainly distributed in Dechang and Xide counties, while low-risk areas were most prevalent in Xichang city and Mianning country. (4) Rainfall, temperature, elevation, and NPV emerged as the main influencing factors, exerting a dominant role in the occurrence of forest fires. Specifically, a higher NPV coverage correlates with an increased risk of forest fire. In conclusion, this study represents a novel approach by incorporating NPV and PV as key factors in triggering forest fires. By mapping forest-fire risk, we have provided a robust scientific foundation and decision-making support for effective fire management strategies. This research significantly contributes to advancing ecological civilization and fostering sustainable development.

1. Introduction

Forest fires, as natural disasters, have enormous ecological, economic, and social impacts [1]. The acceleration of global climate change and the expansion of human activities have contributed to a continuous upward trajectory in the frequency and scale of forest fires [2,3]. This growth trend has not only led to a dramatic decline in forest ecosystems globally but also poses a serious threat to ecological balance and environmental health [4]. Over the past few decades, forest fires have caused hundreds of deaths and injuries, led to the extinction or endangerment of thousands of wildlife, and destroyed large areas of forest resources [5]. Therefore, we need to take measures to mitigate the likelihood of forest-fire occurrence.
In recent years, mapping forest-fire risk for forest-fire prevention has emerged as a prominent research area [6,7,8]. Regarding influencing factors, previous studies have shown that mapping forest-fire risk necessitates climate, topography, and land-use data as crucial elements [9]. The evaluation factors are also concentrated on temperature, rainfall, wind speed, land use, soil type, normalized difference vegetation index (NDVI), elevation, slope, aspect, distance to road, etc. [10,11]. For instance, Araca et al. selected elevation, slope, aspect, distance to road and settlement, land surface temperature, and stand type as forest fire’s influencing factors. They utilized multi-criteria decision analysis and frequency ratio methods to successfully produce a forest-fire susceptibility map for the Merkez and Ovacık districts of Karabük province [12].
Technically, geographic information systems (GIS) are extensively utilized for forest-fire risk mapping due to their strengths in processing and overlaying spatial data [13,14]. Concurrently, remote-sensing technology, with its wide detection range, rapid data collection, and comprehensive data acquisition, offers unique advantages for mapping forest-fire risk areas [15,16]. In previous research, scholars predominantly utilized multi-criteria decision analysis methods, such as the analytic hierarchy process (AHP), to integrate GIS and remote-sensing data for more effective forest-fire risk assessment [17,18]. Additionally, statistical methods, like binary logistic regression and multivariate linear regression, widely utilized in forest-fire modeling, can enhance our understanding of the relationship between fire occurrence likelihood and its influencing factors [19]. In recent years, there has been a clear trend in the application of machine-learning algorithms for assessing various natural hazards, including landslides, floods, rainfall, forest fires, etc. [20,21,22,23]. Machine-learning algorithms excel at handling nonlinear and high-dimensional data, effectively addressing significant challenges that traditional methods struggle to overcome [24]. Machine-learning algorithms can be trained using extensive datasets, enabling the extraction of complex patterns and laws for predicting and modeling the occurrence and impact of natural disasters. For instance, Su et al. integrated fire data derived from multiple remote-sensing sources with machine-learning techniques to forecast fires in forest ecosystems in Northeastern China [25]. Mehmood et al. employed three machine-learning models, namely random forest, XGBoost, and logistic regression, to map the risk of forest-fire occurrence in Balochistan, Pakistan. The results showed that the random forest model had the highest accuracy, followed by XGBoost [26]. Additionally, deep-learning algorithms, recognized as an emerging research focus for forest-fire monitoring, have high accuracy [27,28] and, consequently, have been extensively employed in forest-fire risk mapping [29]. For instance, Zheng et al. proposed a modified deep convolutional neural network (MDCNN) model to recognize forest fires. The experimental results show that this MDCNN model has a false alarm rate of only 0.563% and a miss rate of 12.7%. Meanwhile, the miss detection rate is 5.3%, and the recall rate reaches 95.4%, with an overall accuracy of 95.8%. These data show that the proposed model has significantly improved the accuracy of flame identification [30]. However, despite the widespread application of these models in different fields, such as environmental and ecological sciences, selecting an appropriate model remains challenging because each algorithm exhibits some shortcomings that cause its results to suffer [31,32].
The Anning River Valley in Sichuan Province, China, serves as a significant natural barrier in the upper reaches of the Yangtze River. It features a diverse array of plant species and a subtropical highland monsoon climate. It is also one of the forest-fire-prone areas in China [33]. Previous research on forest fires in this region has focused on forest combustibles or the construction of forest-fire risk databases [34,35], while little research has been conducted on forest-fire risk prediction. Therefore, there is an urgent need to strengthen research and prevention and control of forest fires in this region. This is not only a need to protect the ecological environment and human safety, but also an important effort to promote sustainable development. In this study, we innovatively incorporated two novel forest-fire predisposing factors—photosynthetic vegetation (PV) and non-photosynthetic vegetation (NPV)—and employed the analytic hierarchy process (AHP), comprehensive weighting method, and random forest model for predicting forest-fire risk. Utilizing these methodologies, we successfully generated a forest-fire risk map for the Anning River Valley and identified the primary fire-triggering factors, offering a critical reference for forest-fire prevention and management in the region.

2. Study Area and Data Resource

2.1. Study Area

The Anning River Valley is located in the southern part of Sichuan Province, China. The river valley area contains Mianning County, Xide County, Xichang City, and Dechang County (Figure 1). The region is characterized by hilly and mountainous terrain, intersected by rivers, with complex and diverse topography. The region pre-dominantly experiences a subtropical monsoon climate, influenced by both the Tibetan Plateau monsoon and the Indian Ocean monsoon [36]. Summers are warm with abundant precipitation, while winters are relatively dry with significant temperature fluctuations. These conditions favor plant growth, leading to high vegetation cover. However, high summer temperatures and abundant vegetation also increase fire risk [37]. Statistical data indicate that 184 fires occurred in the Anning River Valley between 2010 and 2021, causing various degrees of ecological and economic losses.

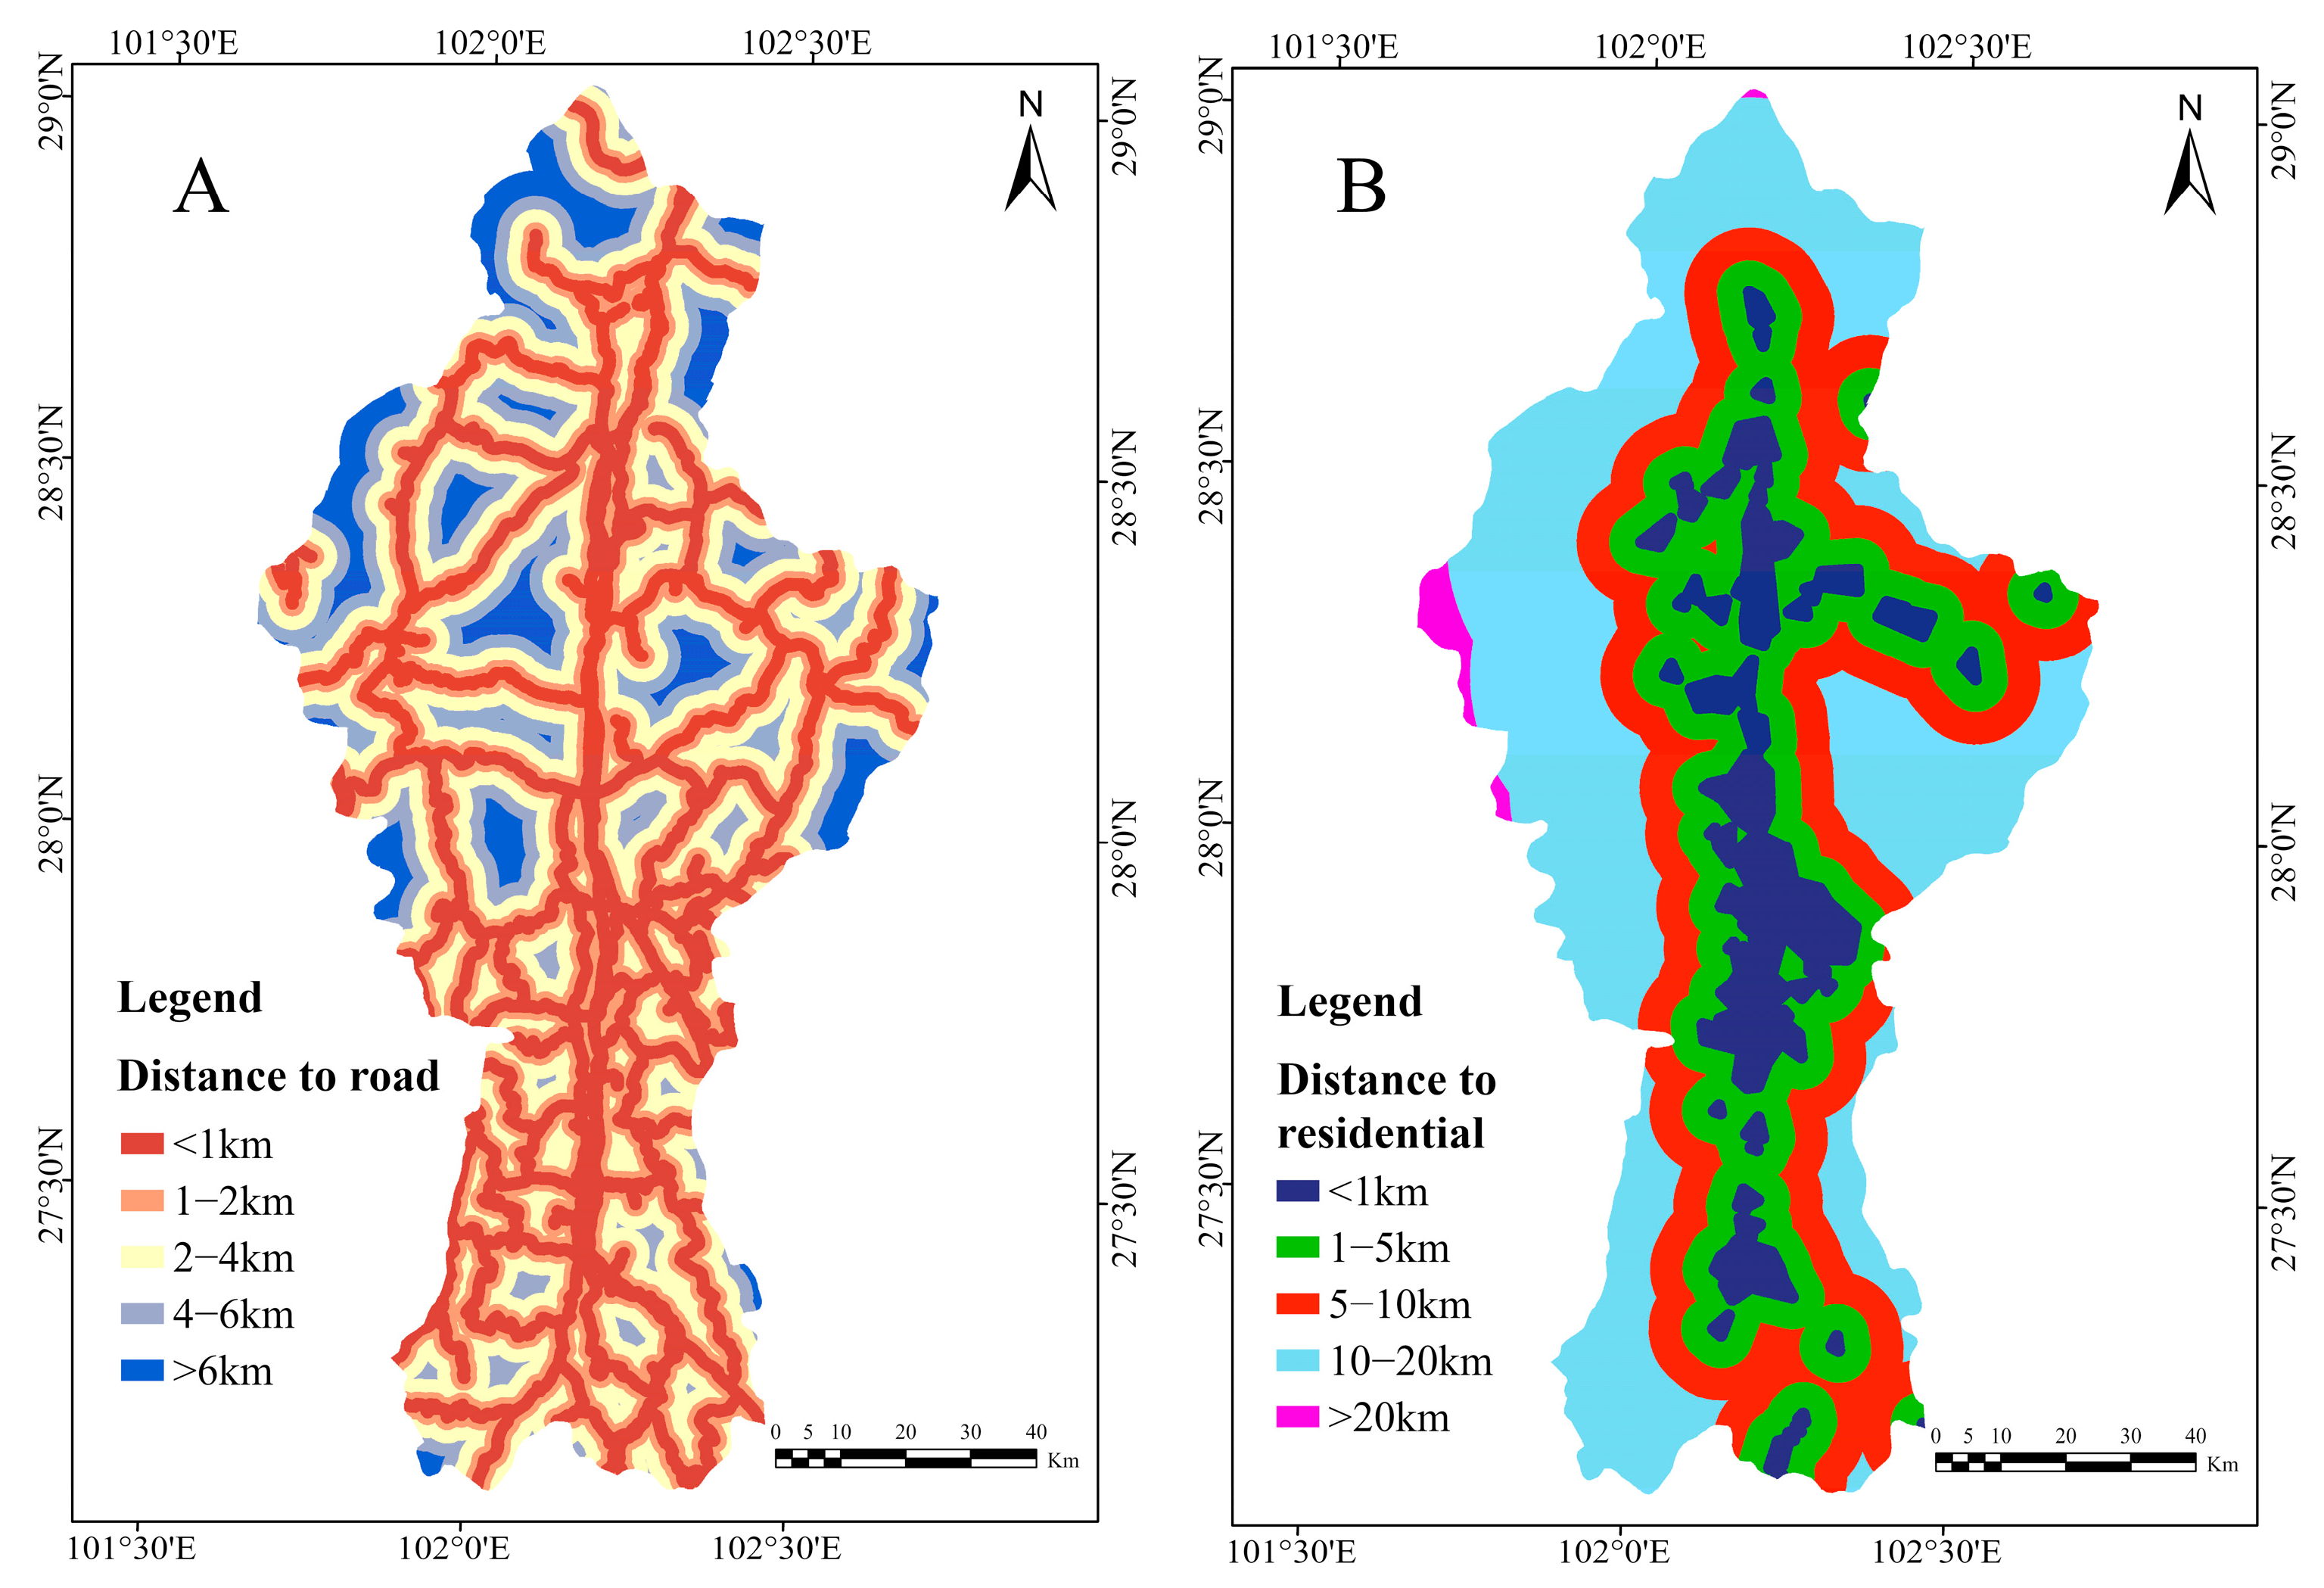
2.2. Data Resource and Processing

Forest fires in the Anning River Valley area are mainly triggered by improper human activities and electrical wire short circuits. Most forest fires occur within the agricultural and forestry interwoven zone at elevations ranging from 1200 to 2700 m, particularly in regions dominated by coniferous forests. This zone is characterized by a substantial accumulation of combustible materials, especially beneath the dense coniferous canopy, thereby increasing the likelihood of fire. Additionally, the exacerbation of arid climatic conditions and the increase in hot, dry, and windy weather patterns further amplify the risk of forest-fire occurrence and spread. Through a comprehensive analysis of these factors, we finally selected NPV, PV, NDVI, plant species, land use, soil type, temperature, humidity, rainfall, wind speed, elevation, slope, aspect, distance to road, and distance to residential as evaluation indicators among vegetation, climate, topography, and anthropogenic factors. We graded all the indicators based on the research results of Tsangaratos et al. [38], and the sources of these forest-fire data are detailed in Table 1.
Vegetation factors are crucial in providing fuel for fires [4]. Flammable vegetation types, high vegetation densities, and vegetation with low water content collectively increase the severity of forest fires [39]. In this study, the PV and NPV (Figure 2A) were calculated using Liner spectral mixing analysis with Equations (3)–(9). We used the maximum value synthesis method (MVC) to obtain the maximum annual PV/NPV values of the study area from 2010 to 2022.
NDVI (Figure 2B) was calculated according to Equation (2) [40]. In this study, we used the maximum value synthesis method (MVC) to obtain the maximum annual NDVI values of the study area from 2010 to 2022. NDVI has a value of 0–1, where higher values indicate higher vegetation cover. It was divided into five groups, including (1) 0–0.3, (2) 0.3–0.6, (3) 0.6–0.8, (4) 0.8–0.9, and (5) 0.9–1.
N D V I = ( N I R R E D ) / ( N I R + R E D )
where NIR and RED mean the reflectance in the red and near-infrared bands, respectively.
Land use (Figure 2C) was divided into nine categories, including water, woodland, grassland, sparse shrub and grass, cultivated land, shrub, artificial surface, bare land, and ice and snow. Plant species (Figure 2D) were categorized into five classes, namely broad-leaved forest, coniferous forest, cultivated plant, shrubland, and meadow. Soil types (Figure 2E) were divided into six categories, namely anthrosols, alpine soil, ferralisols, luvisol, rock, dark semi-hydromorphic soils, and skeletol primitive soils.
Climatic factors are the primary influence on the occurrence and spread of fires. Extreme weather conditions, such as high temperatures, high winds, and drought, significantly increase the risk and intensity of fires [41,42]. In this study, the B10 thermal infrared band of Landsat 8 OLI was selected for temperature inversion (Equation (2)). Temperature (Figure 2F) was classified into five classes, including (1) 5.74–12 °C, (2) 12–16 °C, (3) 16–20 °C, (4) 20–24 °C, and (5) 24–28.19 °C.
T e m p e r a t u r e = S T _ B 10 273.15
where ST_B10 means the reflectance in the thermal infrared band of Landsat 8 OLI images.
The rainfall (Figure 3A) was classified into five groups, including (1) 906–1000 mm, (2) 1000–1100 mm, (3) 1100–1200 mm, (4) 1200–1300 mm, and (5) 1300–1451 mm. In this study, humidity (Figure 3B) was calculated according to Equation (3). The humidity (Figure 3C) was classified into five groups, including (1) 0–0.29, (2) 0.29–0.32, (3) 0.32–0.34, (4) 0.34–0.38, and (5) 0.38–1. The wind speed (Figure 3C) was classified into five groups, including (1) −4.5–3.5 m/s, (2) −3.5–1.5 m/s, (3) −1.5–0.5 m/s, (4) 0.5–1.5 m/s, and (5) 1.5–5.5 m/s.
H u m i d i t y = 0.1509 ρ B l u e + 0.1973 ρ G r e e n + 0.3279 ρ R e d + 0.3406 ρ N I R 0.7112 ρ S W I R 1 0.4572 ρ S W I R 2
where ρ B l u e means reflectance of the blue band, ρ G r e e n means reflectance of the green band, ρ R e d means reflectance of the red band, ρ N I R means reflectance of the near-infrared band, ρ S W I R 1 means reflectance of the shortwave infrared 1 band. ρ S W I R 2 means reflectance of the shortwave infrared 2 band.
Topographic factors, on the other hand, primarily affect the path and rate of forest-fire spread. Slope and terrain complexity play a key role in fire spread [43,44]. The elevation (Figure 3D) was classified into five groups, including (1) 1098–1500 m, (2) 1500–2100 m, (3) 2100–2700 m, (4) 2700–3500 m, and (5) 3500–5267 m. Slope (Figure 3E) was divided into five classes, including (1) 0–10, (2) 10–20, (3) 20–30, (4) 30–40, and (5) 40–83.52. Aspect (Figure 3F) was divided into eight categories, namely north, northeast, east, southeast, south, southwest, west, and northwest. Distance to road (Figure 4A) was divided into five classes, namely (1) 0–1 km, (2) 1–2 km, (3) 2–4 km, (4) 4–6 km, and (5) over 6 km. Distance to residential (Figure 4B) was divided into five classes, including (1) 0–1 km, (2) 1–5 km, (3) 5–10 km, (4) 10–20 km, and (5) over 20 km.

3. Methods

The research in this paper is divided into the following two steps (Figure 5):
Step 1. Obtaining and calculating factors from vegetation, topography, climate, and anthropogenic data;
Step 2. Conduct a forest-fire risk assessment using the analytic hierarchy process (AHP), the comprehensive weighting method, and the random forest. Draw a forest-fire risk map of the Anning River Valley and identify the main forest-fire predisposing factors.

3.1. Establishment of Forest-Fire Database

In this study, the forest-fire database comprises 15 predisposing factors and 184 fire points. To address multicollinearity among the fire-factor data, we employed LASSO regression when using the random forest method [45]. And we standardized the spatial resolution of each factor to 30 m. The processing of these factors and fire point locations was performed in ArcGIS Pro 3.0 software. For predicting forest-fire risk using the random forest method, it was essential to prepare a dataset containing non-fire point locations, as the task is a binary classification problem [9] For this purpose, we generated non-fire point locations in ArcGIS Pro 3.0, selecting areas with land-use attributes such as water bodies and buildings, as well as regions with low normalized difference vegetation index (NDVI) values, where the probability of forest fires is virtually zero [9].

3.2. Setting Up Training and Validation Datasets

Upon obtaining the prediction results, it is essential to validate them. In this study, we partitioned the forest-fire and non-fire samples collected from field surveys into a training set and a validation set at a 70:30 ratio. Consequently, 350 fire and non-fire points were utilized to train the model, while the remaining 150 points were employed to validate it, thereby assessing the accuracy of the forest-fire risk map.

3.3. Liner Spectral Mixing Analysis

The linear spectral mixing model (LSMM) is a model used in the field of hyperspectral remote sensing to describe the spectral formation mechanism of mixed image elements. The model is based on the assumption that the spectrum of each image element is mixed by several pure spectra (endmember spectra) in a certain ratio, and there is no interaction between these endmember spectra. Following the method of collecting spectral data from the endmember mentioned in the previous article, we acquired the endmember spectra of the study area to build a library of endmember spectra [46]. The spectrum of an image element in LSMM can be expressed as:
R i = j = 1 m ( f j W i , j ) + ε i
where Ri is the reflectance of the ith image endmember in a certain band. Wij is the reflectance of the jth endmember in the ith band. fj is fractions of the jth endmember, and m is the number of endmembers. εi is the equation residual. And two constraints were added, namely (1) fj ≥ 0 for j = 1, …, m (abundance nonnegativity constraint, ANC) and (2) j = 1 m f j = 1 (abundance sum to one constraint, ASC).
Subsequently, we apply the fully constrained least squares (FCLS) method to Equation (1) for the calculation of fj. The main steps of the FCLS method are as follows [47,48]:
i n ε i = i = 1 n ( j = 1 m ( f j w W i , j ) R i ) 2
where n is the number of bands. εi is the equation residuals. In order to satisfy the ASC constraints, the matrices M and F are added. The matrices M and F can be expressed as:
M = δ W I T
F = δ R 1
where δ is a contribution factor that is weighted as the ratio of the sum to a constraint, I = i = 1 m ( 1,1 , , 1 ) T , and m is the number of endmembers.
The non-negatively constrained least squares method was used to constrain the abundance coefficients with ANC constraints. The iterative technique is also applied to introduce the Lagrange multiplier vector λ into Equations (7) and (8) to calculate the results [47].
f ^ F C L S = ( M T M ) 1 M T F ( M T M ) 1 λ
λ = M T ( F M F f ^ F C L S )
In order to remove the effect of solar shadow on the endmember fractions, the following equation was used to remove the proportion of shading [49].
f j = f j / ( 1 f s h a d o w )
where fj is the fraction of the jth endmember in a mixed pixel without shadow endmembers, and fshadow is the fraction of the shadow endmembers.

3.4. Hierarchical Analysis Process

The hierarchical analysis process (AHP) is a system analysis method that models and quantifies the decision-making process of decision-makers on complex systems and analyzes them mathematically to provide a quantitative basis for decision-making, and it is also an effective method for the quantitative analysis of non-quantitative events. The application of the hierarchical analysis process to forest-fire risk assessment and other environmental assessments is both a novel and successful method [50,51,52]. The principle of hierarchical analysis is as follows.
First, we should conduct the evaluation system and create the judgment matrix based on Table 2 to compare the level of importance between indicators.
Then, we calculated the weights of the indicators with the following expression:
m i = i = 1 n b i j i = 1 , 2 , 3…… n
w i ¯ = m i n
W i = w i ¯ i = 1 n w i ¯ , i = 1 , 2 , 3…… n
where mi is the product of the elements of each row in the matrix, W ¯ i is the nth square root of mi, and Wi is the normalized value.

3.5. Entropy Weight Method

The entropy weight method belongs to one of the objective assignment methods, and the specific steps for calculating the weights are as follows [53]:
R i j = V i j i = 1 n V i j
E j = 1 ln n i = 1 n R i j ln R i j
W j = 1 E j j = 1 n 1 E j
where Rij is the weight of the j th indicator in year i. Vij is the indicator. Ej is the entropy value of the j th indicator. Wj is the indicator weight.

3.6. Comprehensive Weight Method

To consider the influence of subjective and objective factors on the weight of fire factors, we utilized the Euclidean distance to combine the hierarchical analysis method and entropy weight method to calculate the comprehensive weight of fire factors. The specific steps for calculating the weights are as follows:
W i j = α W i + β W j
D W i , W j = m = 1 n ( W i W j ) 2
D ( W i , W j ) 2 = ( α β ) 2
α + β = 1
where Wij is the comprehensive weight, Wi is the weight calculated by the AHP, Wj is the weight calculated by the entropy weight method, and D (Wi, Wj) is the Euclidean distance between the weights of two factors.

3.7. Random Forest

Random forest is a widely utilized ensemble learning method, which is particularly effective for tasks such as classification, prediction, and regression. It was proposed by Leo Breiman in 2001 [54]. It enhances the accuracy and robustness of the model by aggregating multiple decision trees. To further enhance model diversity, each node randomly selects a subset of features at each split, rather than utilizing all available features. The final prediction is derived by either majority voting or averaging the outputs of all decision trees [54]. This approach effectively mitigates the risk of individual decision trees overfitting while enhancing the model’s performance when handling high-dimensional and complex datasets.

4. Results

4.1. Forest-Fire Risk Mapping

Figure 6 shows the distribution of the forest-fire risk in the Anning River Valley. From Figure 6, there is no obvious difference between the forest-fire risk maps produced by the hierarchical analysis process (AHP), comprehensive weighting method (CWM), and random forest (RF). All three maps show that the proportion of high-risk and medium-risk areas reached 58.92%, 59.56%, and 61.75%, respectively, which covers more than half of the Anning River Valley. Therefore, immediate measures are required to address the forest-fire risks in the valley. The forest-fire risk distribution for Xichang city, Mianning, Xide, and Dechang counties are illustrated in Figure 7. As shown in Figure 7, areas with high and medium risk were mainly distributed in Dechang and Xide counties, while areas with low risk were also the most prevalent in Xichang city and Mianning country.

4.2. Accuracy Verification

We validated the accuracy by overlaying forest-fire risk maps of the Anning River Valley with historical fire point analyses (Table 3). The validation results show that historical fire occurrences were correctly predicted with an accuracy of 86.31%, 86.31%, and 92.39% within the high- and medium-risk areas, as determined by AHP, CWM, and RF. Meanwhile, by applying the random forest method for forest-fire sensitivity prediction, we obtained training and testing accuracies of 0.9425 and 0.87, respectively. This indicates that the methodology employed in this study for predicting fire risk areas is highly reliable.

5. Discussion

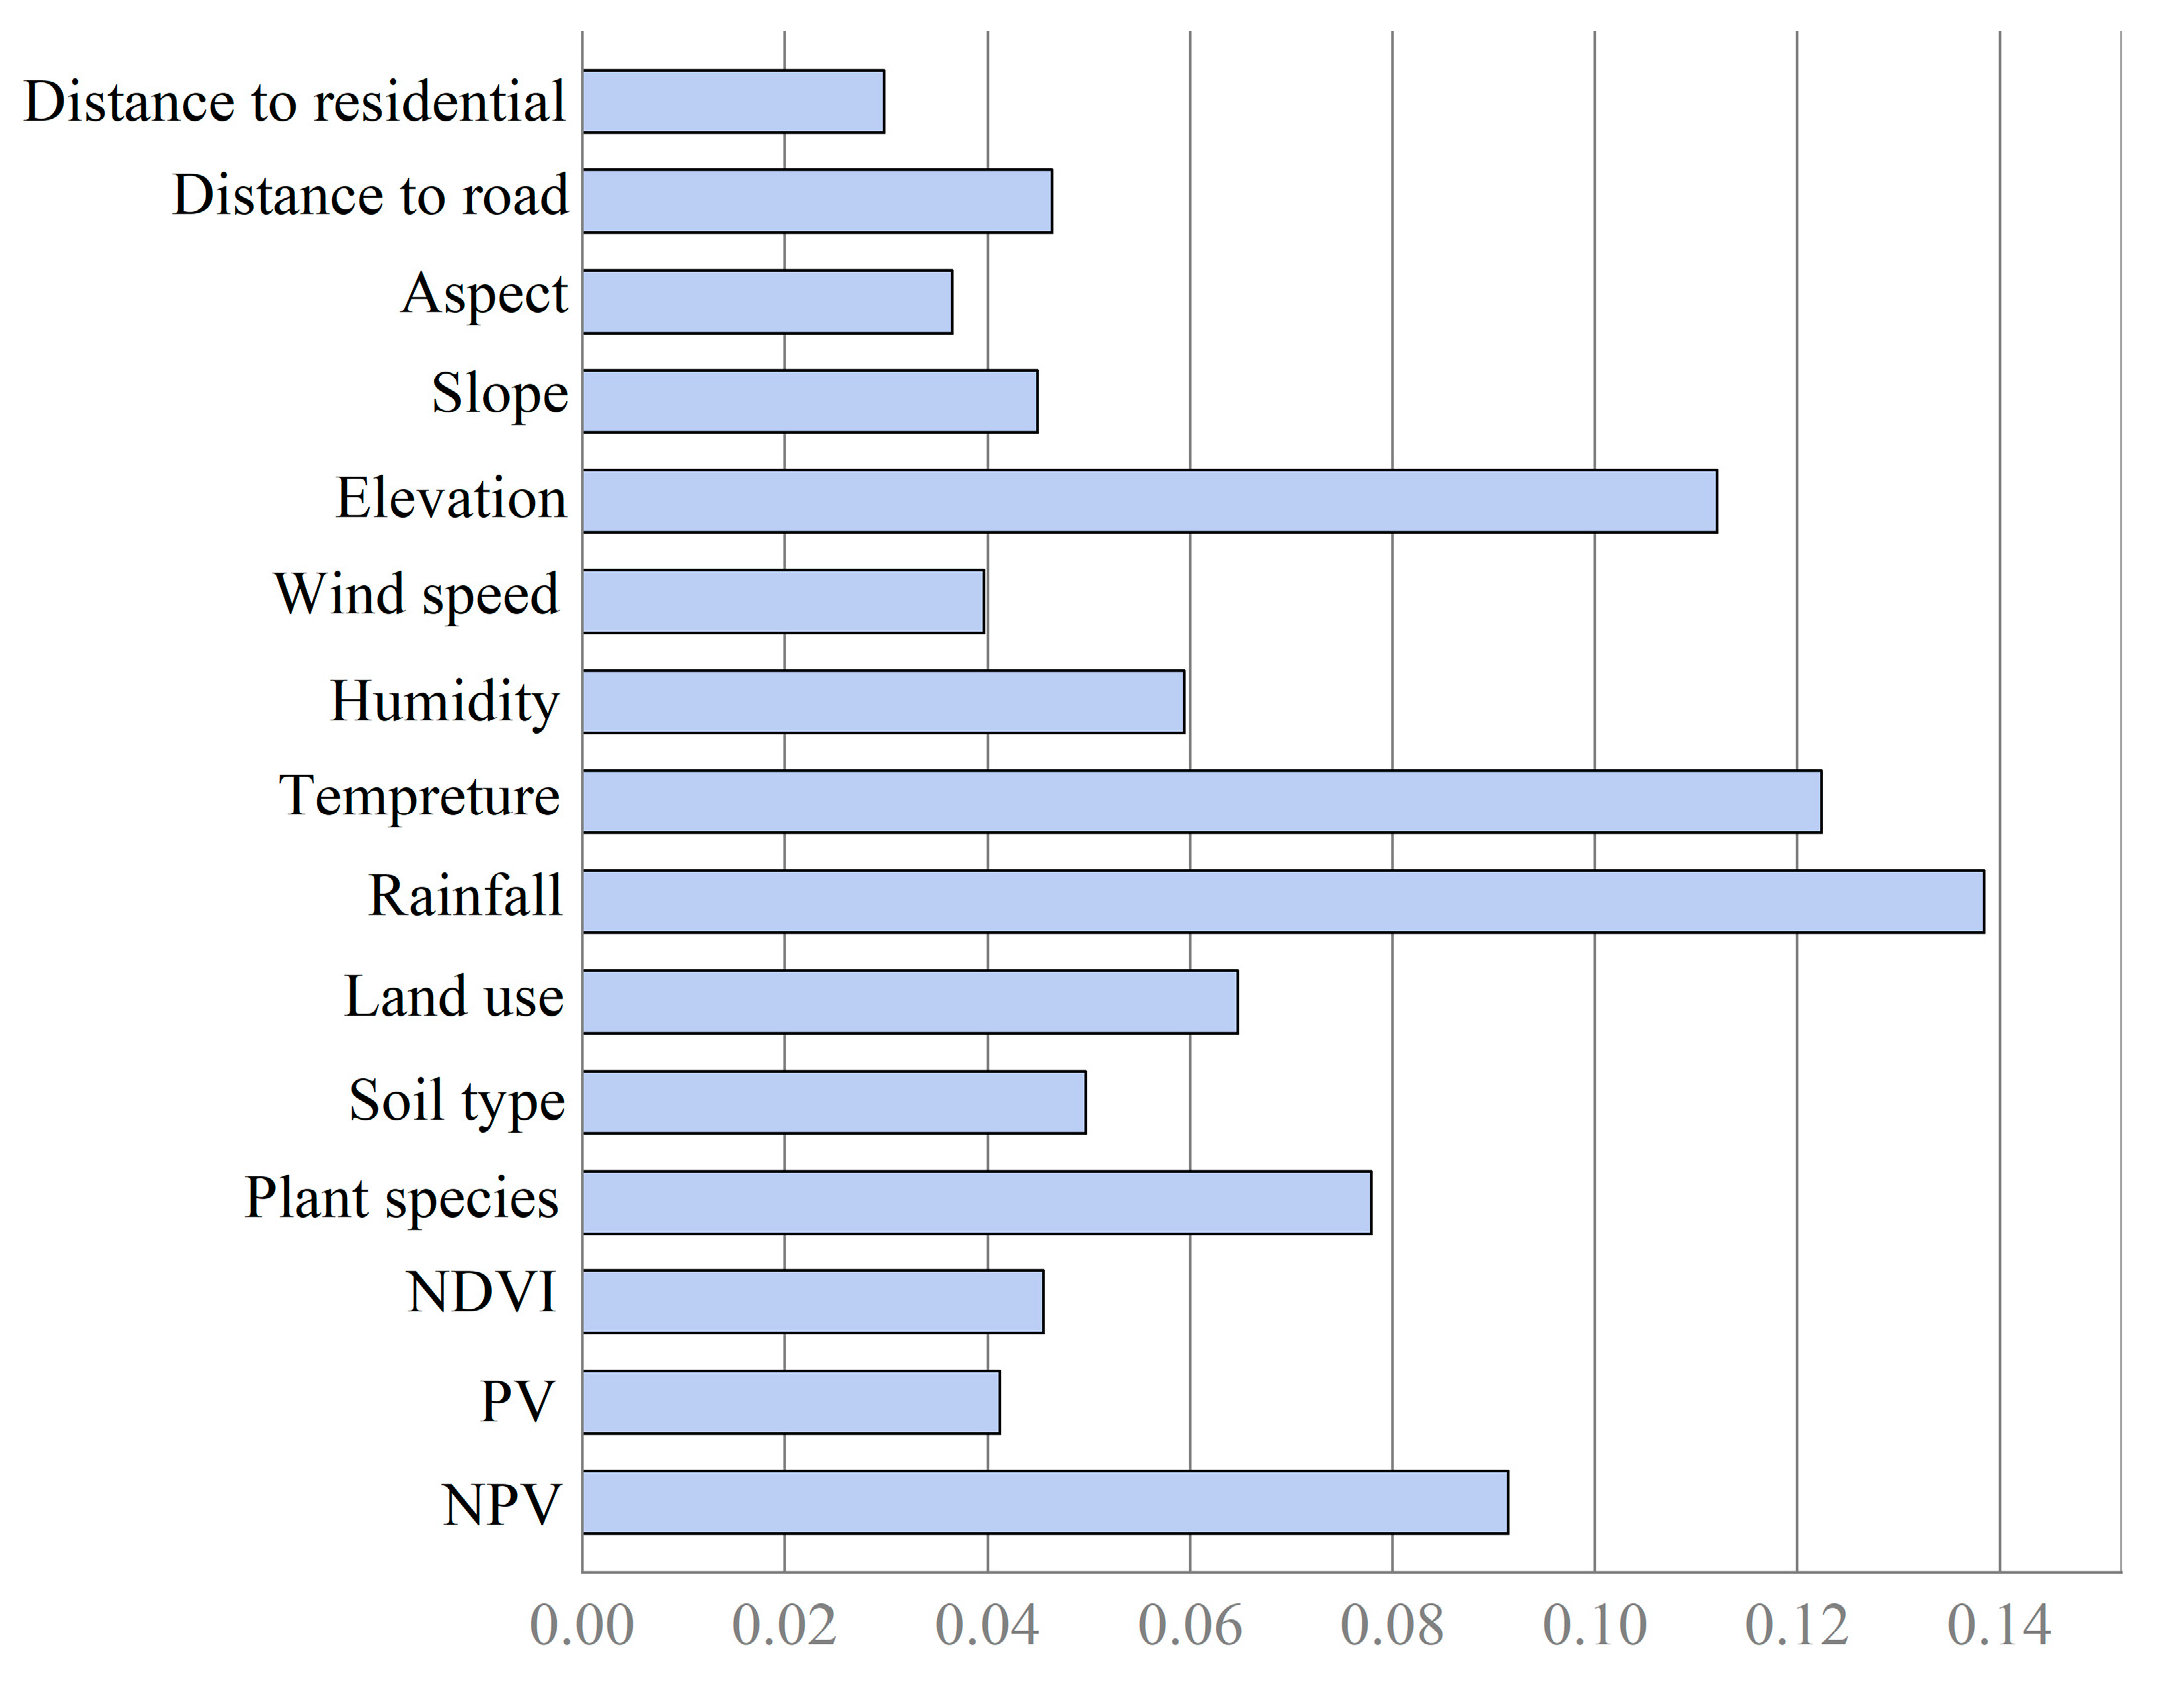
5.1. The Importance of Conditioning Forest-Fire Factors

Figure 8 illustrates the weight distribution of forest-fire predisposing factors. In this study, rainfall emerged as the most influential climatic factor for forest fires, followed by temperature. Among vegetation factors, NPV was the most influential. Elevation was identified as the most influential topographic factor, while slope was the least influential, which is consistent with previous research [15,55]. Previous studies on forest fires in and around the Anning River Valley rarely included PV and NPV in forest-fire susceptibility mapping [37,56]. In this study, we successfully incorporated PV and NPV into forest-fire risk mapping, highlighting that NPV and PV were significant secondary factors in addition to rainfall.

5.2. Impact of Climatic Factors on Forest Fires

Rainfall, temperature, and wind speed are crucial climatic factors in the occurrence and development of forest fires. Rainfall can increase the humidity and reduce vegetation dryness, thereby decreasing the likelihood of forest fires [57]. High humidity makes vegetation more difficult to ignite. Rain can directly extinguish fires that have already started or slow down the rate of fire spread [58]. As shown in Figure 9, the dry and low rainfall seasons from February to April are the main periods for forest-fire occurrence. With the increased rainfall from May to October, the forest-fire frequency in the study area showed a substantial decrease. Notably, when rainfall reaches 200 mm per month, forest fires are virtually absent. Prolonged rainfall keeps forest interior vegetation moist, reducing the risk of drought-induced fires and providing a sustained fire-suppression effect. When analyzing the spatial distribution of rainfall in the Anning River Valley (Figure 3A), it is evident that Xide County experiences significantly lower average annual rainfall compared to the other three cities and counties, including Xichang. Concurrently, the forest-fire risk distribution map for each district and county (Figure 7) reveals that Xide County has the highest proportion of medium- and high-risk areas, underscoring the critical influence of rainfall on forest-fire occurrence. Temperature directly affects vegetation dryness and flammability. High temperatures cause vegetation to lose moisture, making it more flammable and increasing the probability of forest fires [59]. High temperatures and dry climatic conditions accelerate forest fires’ spread, making forest fires more difficult to control. High temperatures accelerate vegetation evaporation, facilitating forest-fire spread [60]. On the other hand, the higher the wind speed, the faster the fire spreads [61]. Wind can carry flames, sparks, and burning material to new areas, thus rapidly expanding the fire. Strong winds can increase the height and intensity of flames. The higher the wind speed, the more fiercely the flames will burn. And the heat will spread quickly, making it more difficult to extinguish the fire.

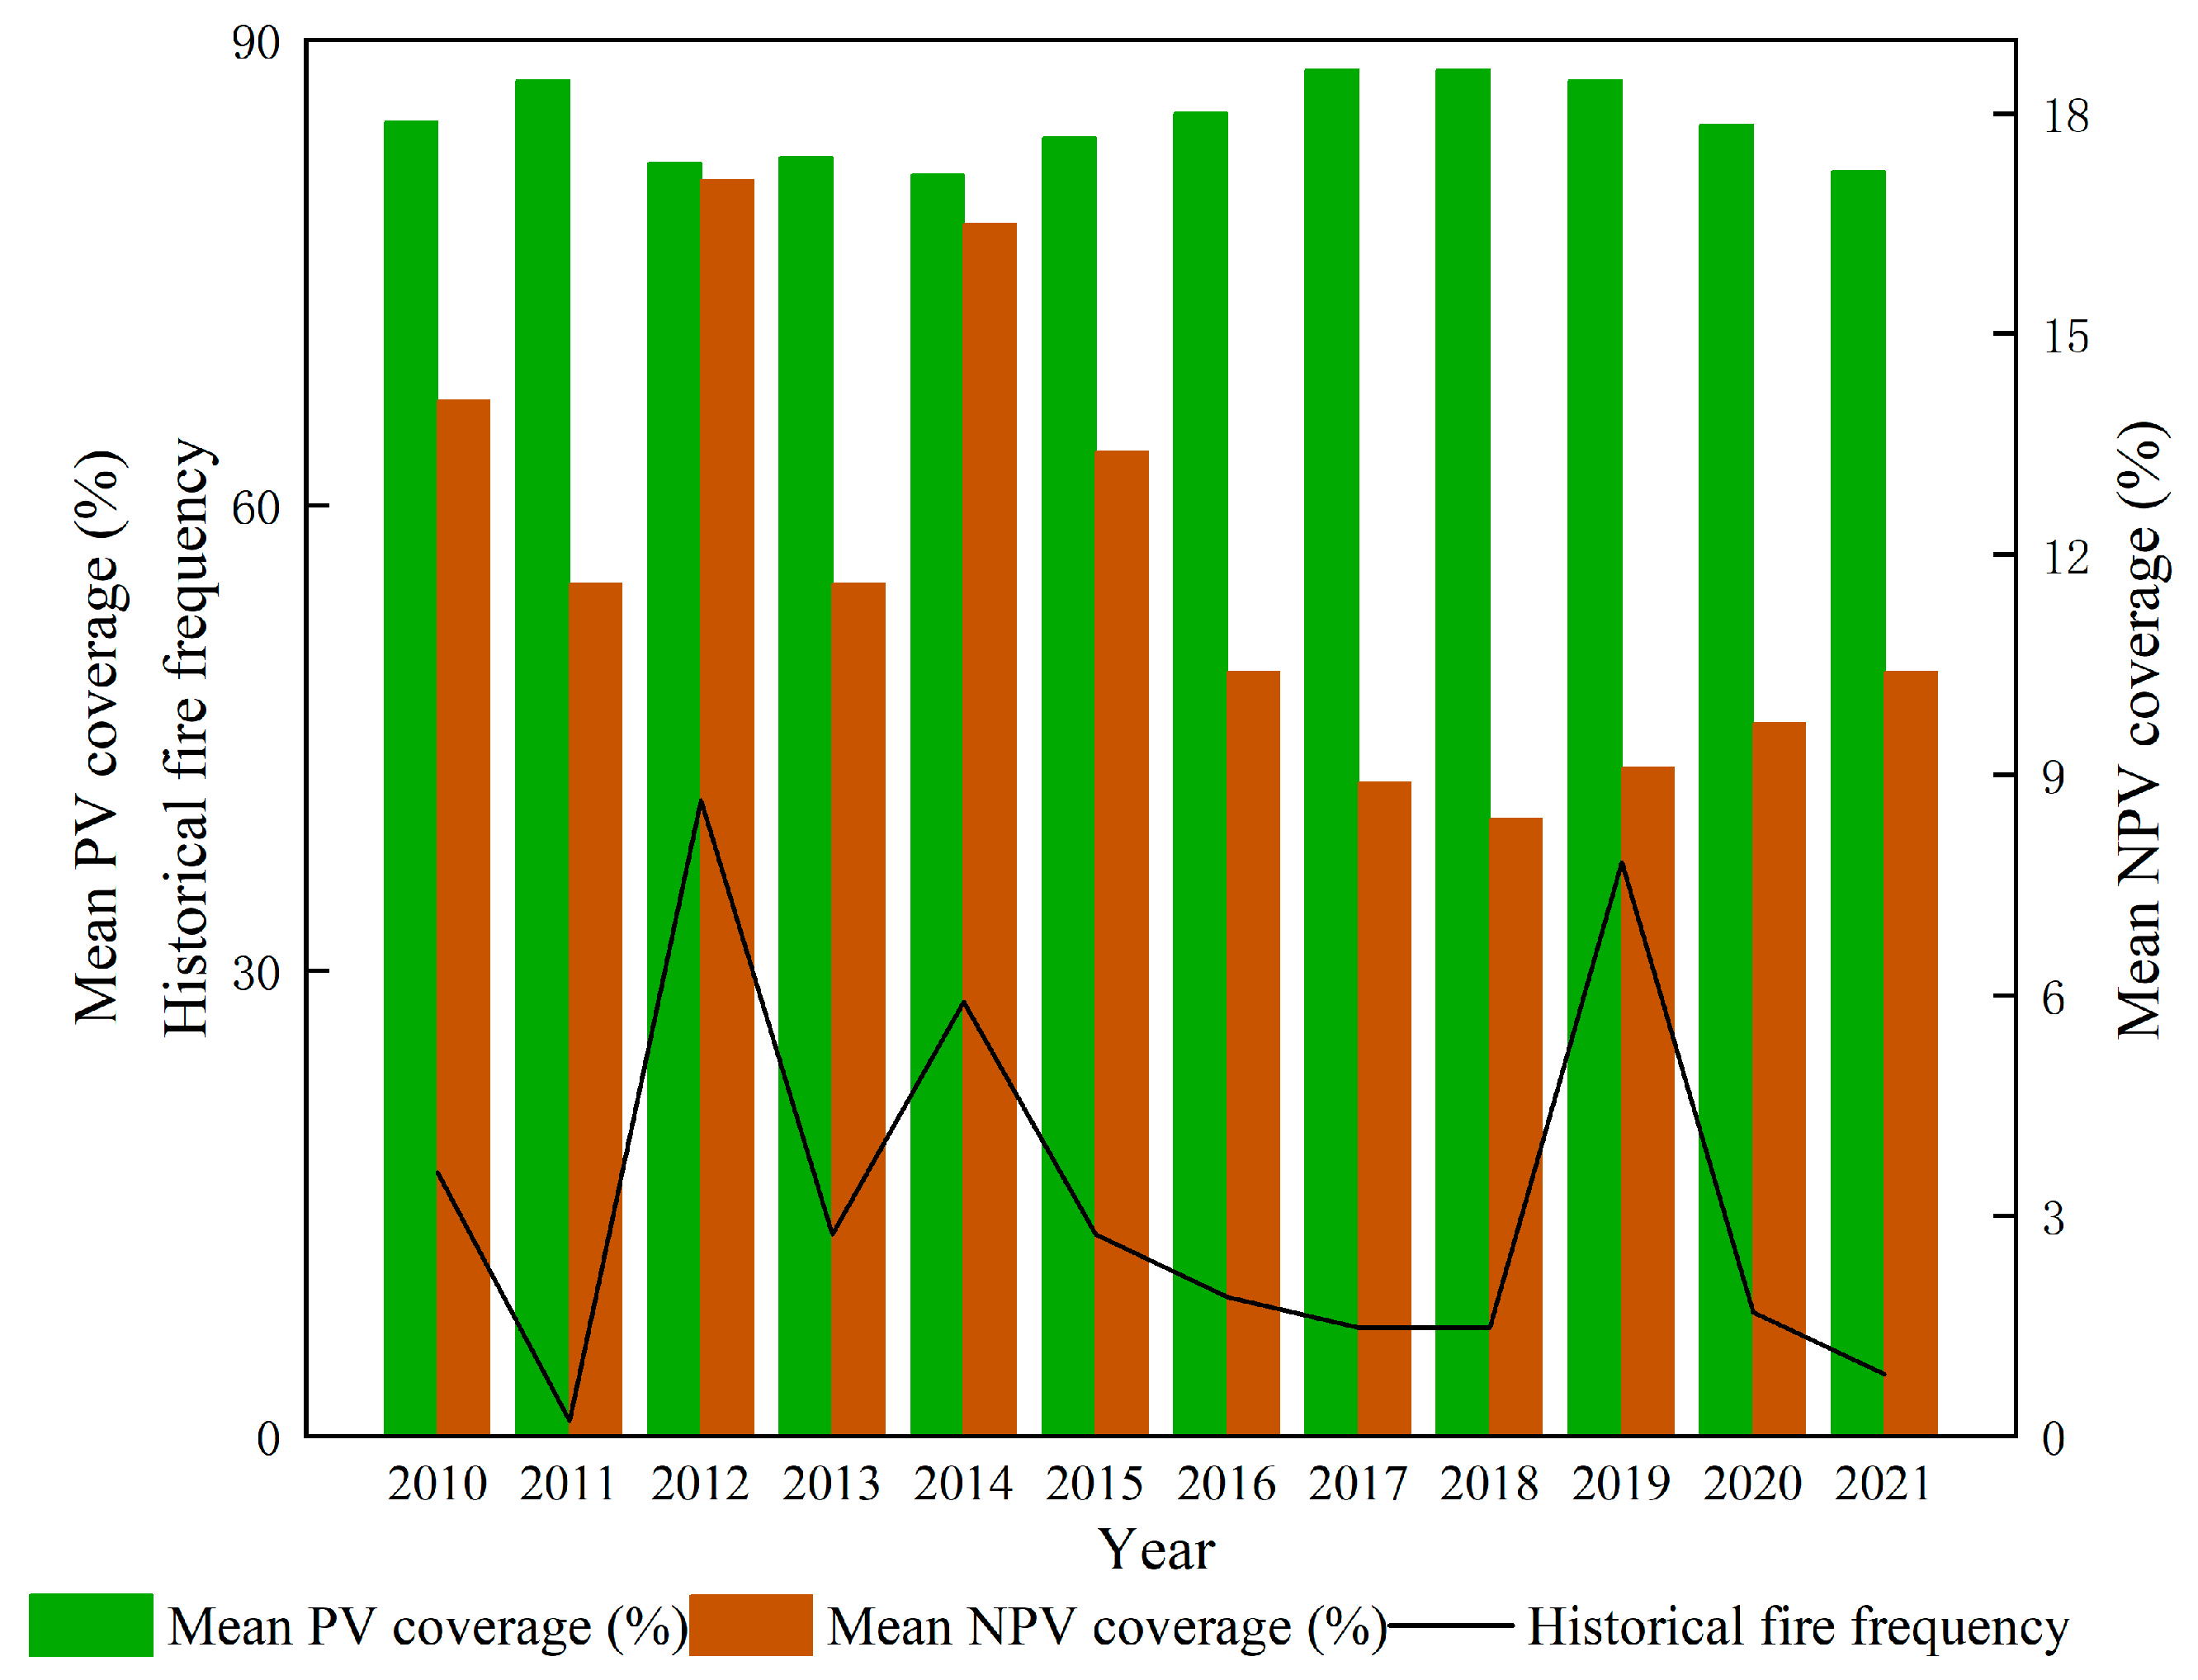
5.3. Impact of Vegetation Factors on Forest Fires

From a functional perspective, vegetation can be categorized as photosynthetic vegetation (PV, mainly green leaves) and non-photosynthetic vegetation (NPV, mainly apomictic litter, crop residues, dried leaves, branches and stems, etc.) [62]. PV is usually rich in water, but also contains combustible materials, making it capable of supporting fire development. In contrast, NPV accumulates more flammable material, such as wilted litter and dead branches, during the dry season, significantly contributing to fire extension and expansion [63]. As shown in Table 4, Figure 10, the NPV cover was higher in 2012, 2014, and 2019, coinciding with an increased forest-fire frequency in those years. This indicates that high NPV cover correlates with increased forest-fire frequency and decreased PV cover, demonstrating that NPV, as a flammable material, plays a dominant role in triggering fires.
The vegetation types in the Anning River Valley include coniferous forests, broad-leaved forests, scrub, meadows, and cultivated vegetation (Figure 2D). Coniferous forests account for the largest proportion of the total forests in the Anning Valley. These forests typically have high resin content and contain volatile compounds that make them highly flammable when forest fires start [41]. The understory of coniferous forests is typically drier and has less cover, making the ground more susceptible to fire. Additionally, the understory vegetation in coniferous forests mainly consists of coniferous tree litter, such as dried needles and twigs, which are highly flammable and can spread rapidly during a fire.
By analyzing the NDVI changes over the year of the fire and the four years preceding and following it (Table 5, Figure 11), it is visually evident that the average NDVI sharply declines in the year of the fire, begins to recover in the second year, and gradually increases thereafter. However, it is important to note that NDVI reflects the recovery of the vegetation canopy, and the underlying vegetation is not detected. Moreover, the gradual increase in NDVI indicates that the vegetation growth is getting better and better. Further analysis and research are needed to determine whether this phenomenon is related to the invasion of new species. As shown in Figure 11, the NDVI for common forest fires exceeds 50%, whereas for larger and severe fires, the NDVI surpasses 60% before the event. This indicates that high coverage of combustible materials is the primary cause of fires.
Based on the changes in vegetation cover before and after the occurrence of forest fires in the Anning River Valley region shown in Figure 12, it can be seen that the vegetation cover in the fire area decreased dramatically within one year after the fire. However, after one year, the vegetation began to recover gradually, and the cover increased. This trend is consistent with the changes in NDVI in the year of the fire, the year before, and the year after in Figure 11.

5.4. Impact of Topographic Factors on Forest Fires

Elevation is typically correlated with climatic conditions, which directly affects how vegetation grows and dries out. Higher elevations typically have cooler temperatures, higher humidity, and relatively moist vegetation, leading to fewer forest fires [64,65]. In a study of the Penticton Creek watershed in Southwestern Canada, Spittlehouse and Dymond found that the fire risk decreased significantly with an increasing elevation, based on both historical data and future projections [66]. However, fires may be more difficult to control in high mountainous areas due to lower temperatures and a thinner atmosphere. Limited mobilization and operational capacity of manpower, supplies, and equipment at higher elevations exacerbate this difficulty. Larger slopes accelerate the rate of fire propagation because flames can spread rapidly uphill, and air currents intensify with the slope, furthering the spread of the fire [67]. The rate of fire propagation on a hillside is influenced by the direction of the slope. Typically, southern slopes receive more solar radiation, causing vegetation to dry out more and the fire to spread faster. Conversely, northern slopes are relatively wetter, resulting in lower fire propagation [68]. Slope orientation also influences the direction of airflow, which subsequently affects the direction of fire spread. In some cases, fires may exhibit asymmetrical spread characteristics influenced by slope orientation.

5.5. Limitations of the Study

Although this study successfully produced the forest-fire risk map of the Anning River Valley area using the AHP, the CWM, and the random forest, some deficiencies remain. First, there are limitations to the selection of forest-fire influence factors in this paper. To consider the influence of multiple factors on forest fire comprehensively, we selected rainfall, temperature, humidity, wind speed, NPV, PV, NDVI, plant species, land use, soil type, elevation, slope, aspect, distance to road, and distance to residential as influence factors. However, certain potential influence factors, such as solar radiation and intensity of human activity, were ignored. Meanwhile, there are regional differences in forest-fire influence factors, and these factors need to be adjusted over time, even within the same region [59]. Second, in comparison to the AHP, CWM, and random forest models used in this paper, future research could consider introducing deep-learning and statistical methods, alternative approaches that may have advantages in forest-fire modeling [69,70,71].

6. Conclusions

In this study, we utilized the hierarchical analysis process (AHP), a comprehensive weighting method (CWM), and random forest (RF) to map the forest-fire risk in the Anning River Valley of Sichuan Province. We derived the following conclusions. (1) The forest-fire risk map of the Anning River Valley produced by coupling 15 forest-fire factors, such as NPV and PV, through AHP, CWM, and RF was verified to have an accuracy rate of more than 86% when superimposed on the historical fire points, which indicates that the prediction results have a high degree of reliability. (2) Forest fires in the Anning River Valley primarily occur in February, March, and April, typically months characterized by very low rainfall and dry conditions. (3) Areas with high and medium forest-fire risk were mainly distributed in Dechang and Xide counties, while low-risk areas were most prevalent in Xichang city and Mianning country. (4) Rainfall, temperature, elevation, and NPV emerged as the main influencing factors, exerting a dominant role in the occurrence of forest fires. Specifically, a higher NPV coverage correlates with an increased risk of forest fire. By mapping the risk of forest fires in the Anning River Valley, this study can provide researchers engaged in forest-fire risk assessment with a reference to the evaluation index system, which can help to improve the accuracy and applicability of the model. At the same time, for researchers who are not involved in the field of forest fires, the methodology and evaluation factors selected in this paper can also be applied to the study of other environmental risks or natural disasters, which can help researchers to establish a reliable risk-assessment system.

Author Contributions

C.J. contributed to conceptualization, supervision, methodology, funding acquisition, and writing—review and editing. H.Y. (Hengcong Yang) contributed to visualization, writing—original draft, and writing—review and editing. X.L. contributed to investigation and writing—review and editing. X.P. contributed to investigation and writing—review and editing. M.L. contributed to project administration and writing—review and editing. L.C. contributed to project administration and writing—review and editing. F.S. contributed to investigation and writing—review and editing. H.Y. (Hao Yuan) contributed to data curation, investigation, and visualization. Y.C. contributed to data curation and visualization. B.C. contributed to methodology and visualization. S.Q., N.Z., L.C. and L.S. contributed to visualization. F.S. contributed to project administration. All authors have read and agreed to the published version of the manuscript.

Funding

This research was supported by the China Meteorological Services Association Meteorological Science and Technology Innovation Platform Project (No. CMSA2023MC002), the National Science Foundation of China (No. 42301459), the China Postdoctoral Science Foundation (No. 2023M740418), and the General Project of Chongqing Natural Science Foundation (No. CSTB2023NSCQ-MSX0967).

Data Availability Statement

Data will be made available on reasonable request.

Conflicts of Interest

The authors declare no conflicts of interest.

References

  1. Giannakidou, S.; Radoglou-Grammatikis, P.; Lagkas, T.; Argyriou, V.; Goudos, S.; Markakis, E.K.; Sarigiannidis, P. Leveraging the power of internet of things and artificial intelligence in forest fire prevention, detection, and restoration: A comprehensive survey. Internet Things 2024, 26, 101171. [Google Scholar] [CrossRef]
  2. Dastour, H.; Ahmed, M.R.; Hassan, Q.K. Analysis of forest fire patterns and their relationship with climate variables in Alberta’s natural subregions. Ecol. Inform. 2024, 80, 102531. [Google Scholar] [CrossRef]
  3. Hu, M.; Liu, Y.; Sun, Z.; Zhang, K.; Liu, Y.; Miao, R.; Wan, S. Fire rather than nitrogen addition affects understory plant communities in the short term in a coniferous-broadleaf mixed forest. Ecol. Evol. 2018, 8, 8135–8148. [Google Scholar] [CrossRef] [PubMed]
  4. Mohajane, M.; Costache, R.; Karimi, F.; Bao Pham, Q.; Essahlaoui, A.; Nguyen, H.; Laneve, G.; Oudija, F. Application of remote sensing and machine learning algorithms for forest fire mapping in a Mediterranean area. Ecol. Indic. 2021, 129, 107869. [Google Scholar] [CrossRef]
  5. Siddique, A.A.; Alasbali, N.; Driss, M.; Boulila, W.; Alshehri, M.S.; Ahmad, J. Sustainable collaboration: Federated learning for environmentally conscious forest fire classification in Green Internet of Things (IoT). Internet Things 2024, 25, 101013. [Google Scholar] [CrossRef]
  6. Pfoch, K.A.; Pflugmacher, D.; Okujeni, A.; Hostert, P. Mapping forest fire severity using bi-temporal unmixing of Sentinel-2 data—Towards a quantitative understanding of fire impacts. Sci. Remote Sens. 2023, 8, 100097. [Google Scholar] [CrossRef]
  7. Sari, F. Forest fire susceptibility mapping via multi-criteria decision analysis techniques for Mugla, Turkey: A comparative analysis of VIKOR and TOPSIS. For. Ecol. Manag. 2021, 480, 118644. [Google Scholar] [CrossRef]
  8. Sivrikaya, F.; Günlü, A.; Küçük, Ö.; Ürker, O. Forest fire risk mapping with Landsat 8 OLI images: Evaluation of the potential use of vegetation indices. Ecol. Inform. 2024, 79, 102461. [Google Scholar] [CrossRef]
  9. Tien Bui, D.; Bui, Q.-T.; Nguyen, Q.-P.; Pradhan, B.; Nampak, H.; Trinh, P.T. A hybrid artificial intelligence approach using GIS-based neural-fuzzy inference system and particle swarm optimization for forest fire susceptibility modeling at a tropical area. Agric. For. Meteorol. 2017, 233, 32–44. [Google Scholar] [CrossRef]
  10. Das, J.; Mahato, S.; Joshi, P.K.; Liou, Y.-A. Forest Fire Susceptibility Zonation in Eastern India Using Statistical and Weighted Modelling Approaches. Remote Sens. 2023, 15, 1340. [Google Scholar] [CrossRef]
  11. Moayedi, H.; Mehrabi, M.; Bui, D.T.; Pradhan, B.; Foong, L.K. Fuzzy-metaheuristic ensembles for spatial assessment of forest fire susceptibility. J. Environ. Manag. 2020, 260, 109867. [Google Scholar] [CrossRef] [PubMed]
  12. Arca, D.; Hacısalihoğlu, M.; Kutoğlu, Ş.H. Producing forest fire susceptibility map via multi-criteria decision analysis and frequency ratio methods. Nat. Hazards 2020, 104, 73–89. [Google Scholar] [CrossRef]
  13. Makumbura, R.K.; Dissanayake, P.; Gunathilake, M.B.; Rathnayake, N.; Kantamaneni, K.; Rathnayake, U. Spatial mapping and analysis of forest fire risk areas in Sri Lanka—Understanding environmental significance. Case Stud. Chem. Environ. Eng. 2024, 9, 100680. [Google Scholar] [CrossRef]
  14. Parajuli, A.; Manzoor, S.A.; Lukac, M. Areas of the Terai Arc landscape in Nepal at risk of forest fire identified by fuzzy analytic hierarchy process. Environ. Dev. 2023, 45, 100810. [Google Scholar] [CrossRef]
  15. Pham, V.T.; Do, T.A.T.; Tran, H.D.; Do, A.N.T. Classifying forest cover and mapping forest fire susceptibility in Dak Nong province, Vietnam utilizing remote sensing and machine learning. Ecol. Inform. 2024, 79, 102392. [Google Scholar] [CrossRef]
  16. Xu, H.; Zhang, G.; Chu, R.; Zhang, J.; Yang, Z.; Wu, X.; Xiao, H. Detecting forest fire omission error based on data fusion at subpixel scale. Int. J. Appl. Earth Obs. Geoinf. 2024, 128, 103737. [Google Scholar] [CrossRef]
  17. Kayet, N.; Chakrabarty, A.; Pathak, K.; Sahoo, S.; Dutta, T.; Hatai, B.K. Comparative analysis of multi-criteria probabilistic FR and AHP models for forest fire risk (FFR) mapping in Melghat Tiger Reserve (MTR) forest. J. For. Res. 2020, 31, 565–579. [Google Scholar] [CrossRef]
  18. Nuthammachot, N.; Stratoulias, D. Multi-criteria decision analysis for forest fire risk assessment by coupling AHP and GIS: Method and case study. Environ. Dev. Sustain. 2021, 23, 17443–17458. [Google Scholar] [CrossRef]
  19. Joshi, K.P.; Adhikari, G.; Bhattarai, D.; Adhikari, A.; Lamichanne, S. Forest fire vulnerability in Nepal’s chure region: Investigating the influencing factors using generalized linear model. Heliyon 2024, 10, e28525. [Google Scholar] [CrossRef]
  20. Barrera-Animas, A.Y.; Oyedele, L.O.; Bilal, M.; Akinosho, T.D.; Delgado, J.M.D.; Akanbi, L.A. Rainfall prediction: A comparative analysis of modern machine learning algorithms for time-series forecasting. Mach. Learn. Appl. 2022, 7, 100204. [Google Scholar] [CrossRef]
  21. Conciatori, M.; Valletta, A.; Segalini, A. Improving the quality evaluation process of machine learning algorithms applied to landslide time series analysis. Comput. Geosci. 2024, 184, 105531. [Google Scholar] [CrossRef]
  22. Islam, R.; Chowdhury, P. Local-scale flash flood susceptibility assessment in northeastern Bangladesh using machine learning algorithms. Environ. Chall. 2024, 14, 100833. [Google Scholar] [CrossRef]
  23. Surbhi Singh, S.; Jeganathan, C. Using ensemble machine learning algorithm to predict forest fire occurrence probability in Madhya Pradesh and Chhattisgarh, India. Adv. Space Res. 2024, 73, 2969–2987. [Google Scholar] [CrossRef]
  24. Chen, W.; Yan, X.; Zhao, Z.; Hong, H.; Bui, D.T.; Pradhan, B. Spatial prediction of landslide susceptibility using data mining-based kernel logistic regression, naive Bayes and RBFNetwork models for the Long County area (China). Bull. Eng. Geol. Environ. 2018, 78, 247–266. [Google Scholar] [CrossRef]
  25. Su, H.; Wang, X.; Chen, W.; Ding, N.; Cui, X.; Bai, M.; Chen, Z.; Li, M. A novel framework for identifying causes of forest fire events using environmental and temporal characteristics of the ignition point in fire footprint. Ecol. Indic. 2024, 160, 111899. [Google Scholar] [CrossRef]
  26. Mehmood, K.; Anees, S.A.; Luo, M.; Akram, M.; Zubair, M.; Khan, K.A.; Khan, W.R. Assessing Chilgoza Pine (Pinus gerardiana) forest fire severity: Remote sensing analysis, correlations, and predictive modeling for enhanced management strategies. Trees For. People 2024, 16, 100521. [Google Scholar] [CrossRef]
  27. Reis, H.C.; Turk, V. Detection of forest fire using deep convolutional neural networks with transfer learning approach. Appl. Soft Comput. 2023, 143, 110362. [Google Scholar] [CrossRef]
  28. Saleh, A.; Zulkifley, M.A.; Harun, H.H.; Gaudreault, F.; Davison, I.; Spraggon, M. Forest fire surveillance systems: A review of deep learning methods. Heliyon 2024, 10, e23127. [Google Scholar] [CrossRef]
  29. Rihan, M.; Ali Bindajam, A.; Talukdar, S.; Shahfahad; Waseem Naikoo, M.; Mallick, J.; Rahman, A. Forest fire susceptibility mapping with sensitivity and uncertainty analysis using machine learning and deep learning algorithms. Adv. Space Res. 2023, 72, 426–443. [Google Scholar] [CrossRef]
  30. Zheng, S.; Zou, X.; Gao, P.; Zhang, Q.; Hu, F.; Zhou, Y.; Wu, Z.; Wang, W.; Chen, S. A Forest Fire Recognition Method Based on Modified Deep CNN Model. Forests 2024, 15, 111. [Google Scholar] [CrossRef]
  31. Jaafari, A.; Panahi, M.; Pham, B.T.; Shahabi, H.; Bui, D.T.; Rezaie, F.; Lee, S. Meta optimization of an adaptive neuro-fuzzy inference system with grey wolf optimizer and biogeography-based optimization algorithms for spatial prediction of landslide susceptibility. CATENA 2019, 175, 430–445. [Google Scholar] [CrossRef]
  32. Tien Bui, D.; Hoang, N.-D.; Samui, P. Spatial pattern analysis and prediction of forest fire using new machine learning approach of Multivariate Adaptive Regression Splines and Differential Flower Pollination optimization: A case study at Lao Cai province (Viet Nam). J. Environ. Manag. 2019, 237, 476–487. [Google Scholar] [CrossRef] [PubMed]
  33. Wang, X. Morphological Characteristics and Influencing Factors of Fine Grooves on the Road Surface of Forest Fire Prevention Passages in the Anning River Valley Area; China West Normal University: Nanchong, China, 2023. [Google Scholar] [CrossRef]
  34. Wang, S.; Niu, S. Fuel Classes in Conifer Forests of Southwest Sichuan, China, and Their Implications for Fire Susceptibility. Forests 2016, 7, 52. [Google Scholar] [CrossRef]
  35. Peng, Y.; Su, H.; Sun, M.; Li, M. Reconstructing historical forest fire risk in the non-satellite era using the improved forest fire danger index and long short-term memory deep learning-a case study in Sichuan Province, southwestern China. For. Ecosyst. 2024, 11, 100170. [Google Scholar] [CrossRef]
  36. Li, H.; Long, Z.; Yang, Z.; Xu, Z.; Li, Y. Analysis of forest fire risk in Sichuan Liangshan based on Logistic model. J. Saf. Environ. 2021, 21, 498–505. [Google Scholar] [CrossRef]
  37. Zhu, P. A Study on the Prediction of Forest Fires in Liangshan Prefecture under the Role of Multiple Factors; Southwest University of Science and Technology: Mianyang, China, 2024. [Google Scholar] [CrossRef]
  38. Tsangaratos, P.; Ilia, I.; Hong, H.; Chen, W.; Xu, C. Applying Information Theory and GIS-based quantitative methods to produce landslide susceptibility maps in Nancheng County, China. Landslides 2016, 14, 1091–1111. [Google Scholar] [CrossRef]
  39. Ruan, Y.; Mohtadi, M.; Dupont, L.M.; Hebbeln, D.; van der Kaars, S.; Hopmans, E.C.; Schouten, S.; Hyer, E.J.; Schefuß, E. Interaction of Fire, Vegetation, and Climate in Tropical Ecosystems: A Multiproxy Study Over the Past 22,000 Years. Glob. Biogeochem. Cycles 2020, 34, e2020GB006677. [Google Scholar] [CrossRef]
  40. Rouse, J.W.; Haas, R.H.; Schell, J.A.; Deering, D.W. Monitoring vegetation systems in the Great Plains with ERTS. NASA Spec. Publ. 1974, 351, 309. [Google Scholar]
  41. Mina, U.; Dimri, A.P.; Farswan, S. Forest fires and climate attributes interact in central Himalayas: An overview and assessment. Fire Ecol. 2023, 19, 14. [Google Scholar] [CrossRef]
  42. Wasserman, T.N.; Mueller, S.E. Climate influences on future fire severity: A synthesis of climate-fire interactions and impacts on fire regimes, high-severity fire, and forests in the western United States. Fire Ecol. 2023, 19, 43. [Google Scholar] [CrossRef]
  43. Nami, M.H.; Jaafari, A.; Fallah, M.; Nabiuni, S. Spatial prediction of wildfire probability in the Hyrcanian ecoregion using evidential belief function model and GIS. Int. J. Environ. Sci. Technol. 2018, 15, 373–384. [Google Scholar] [CrossRef]
  44. Tehrany, M.S.; Jones, S.; Shabani, F.; Martínez-Álvarez, F.; Tien Bui, D. A novel ensemble modeling approach for the spatial prediction of tropical forest fire susceptibility using LogitBoost machine learning classifier and multi-source geospatial data. Theor. Appl. Climatol. 2019, 137, 637–653. [Google Scholar] [CrossRef]
  45. Alshqaq, S.S.; Abuzaid, A.H. An Efficient Method for Variable Selection Based on Diagnostic-Lasso Regression. Symmetry 2023, 15, 2155. [Google Scholar] [CrossRef]
  46. Ji, C.; Li, X.; Wei, H.; Li, S. Comparison of Different Multispectral Sensors for Photosynthetic and Non-Photosynthetic Vegetation-Fraction Retrieval. Remote Sens. 2020, 12, 115. [Google Scholar] [CrossRef]
  47. Chein, I.C.; Heinz, D.C. Constrained subpixel target detection for remotely sensed imagery. IEEE Trans. Geosci. Remote Sens. 2000, 38, 1144–1159. [Google Scholar] [CrossRef]
  48. Heinz, D.C.; Chein, I.C. Fully constrained least squares linear spectral mixture analysis method for material quantification in hyperspectral imagery. IEEE Trans. Geosci. Remote Sens. 2001, 39, 529–545. [Google Scholar] [CrossRef]
  49. Adams, J.; Smith, M.; Gillespie, A. Imaging spectroscopy: Interpretation based on spectral mixture analysis. In Remote Geochemical Analysis: Elemental and Mineralogical Composition; Cambridge University Press: Cambridge, UK, 1993. [Google Scholar]
  50. Dolui, S. Chapter 15—Forest fire susceptibility mapping and risk assessment using integrated AHP and DEMATEL method for Purulia District, West Bengal (India). In Water, Land, and Forest Susceptibility and Sustainability; Elsevier: Amsterdam, The Netherlands, 2023; Volume 1, pp. 401–452. [Google Scholar] [CrossRef]
  51. Ji, C.; Yang, H.; Pei, X.; Zhang, X.; Chen, L.; Liang, D.; Cao, Y.; Pan, J.; Chen, M. Dynamic Integrated Ecological Assessment along the Corridor of the Sichuan–Tibet Railway. Land 2024, 13, 857. [Google Scholar] [CrossRef]
  52. Sivrikaya, F.; Küçük, Ö. Modeling forest fire risk based on GIS-based analytical hierarchy process and statistical analysis in Mediterranean region. Ecol. Inform. 2022, 68, 101537. [Google Scholar] [CrossRef]
  53. Roszkowska, E.; Wachowicz, T. Impact of Normalization on Entropy-Based Weights in Hellwig’s Method: A Case Study on Evaluating Sustainable Development in the Education Area. Entropy 2024, 26, 365. [Google Scholar] [CrossRef]
  54. Breiman, L. Random Forests. Mach. Learn. 2001, 45, 5–32. [Google Scholar] [CrossRef]
  55. Thi Hang, H.; Mallick, J.; Alqadhi, S.; Bindajam, A.A.; Abdo, H.G. Exploring Forest Fire Susceptibility and Management Strategies in Western Himalaya: Integrating Ensemble Machine Learning and explainable AI for Accurate Prediction and Comprehensive Analysis. Environ. Technol. Innov. 2024, 35, 103655. [Google Scholar] [CrossRef]
  56. Sun, X. Research on Forest Fire Risk Prediction Method Based on Remote Sensing Technology in Liangshan Prefecture; National Institute of Natural Hazards: Beijing, China, 2023. [Google Scholar] [CrossRef]
  57. Zumbrunnen, T.; Pezzatti, G.B.; Menéndez, P.; Bugmann, H.; Bürgi, M.; Conedera, M. Weather and human impacts on forest fires: 100 years of fire history in two climatic regions of Switzerland. For. Ecol. Manag. 2011, 261, 2188–2199. [Google Scholar] [CrossRef]
  58. Chang, C.; Chang, Y.; Xiong, Z.; Ping, X.; Zhang, H.; Guo, M.; Hu, Y. Predicting Grassland Fire-Occurrence Probability in Inner Mongolia Autonomous Region, China. Remote Sens. 2023, 15, 2999. [Google Scholar] [CrossRef]
  59. Zhang, F.; Zhang, B.; Luo, J.; Liu, H.; Deng, Q.; Wang, L.; Zuo, Z. Forest Fire Driving Factors and Fire Risk Zoning Based on an Optimal Parameter Logistic Regression Model: A Case Study of the Liangshan Yi Autonomous Prefecture, China. Fire 2023, 6, 336. [Google Scholar] [CrossRef]
  60. Ma, W.; Feng, Z.; Cheng, Z.; Chen, S.; Wang, F. Identifying Forest Fire Driving Factors and Related Impacts in China Using Random Forest Algorithm. Forests 2020, 11, 507. [Google Scholar] [CrossRef]
  61. Butler, B.; Quarles, S.; Standohar-Alfano, C.; Morrison, M.; Jimenez, D.; Sopko, P.; Wold, C.; Bradshaw, L.; Atwood, L.; Landon, J.; et al. Exploring fire response to high wind speeds: Fire rate of spread, energy release and flame residence time from fires burned in pine needle beds under winds up to 27 m s−1. Int. J. Wildland Fire 2020, 29, 81–92. [Google Scholar] [CrossRef]
  62. Guerschman, J.P.; Hill, M.J.; Renzullo, L.J.; Barrett, D.J.; Marks, A.S.; Botha, E.J. Estimating fractional cover of photosynthetic vegetation, non-photosynthetic vegetation and bare soil in the Australian tropical savanna region upscaling the EO-1 Hyperion and MODIS sensors. Remote Sens. Environ. 2009, 113, 928–945. [Google Scholar] [CrossRef]
  63. Newnham, G.J.; Verbesselt, J.; Grant, I.F.; Anderson, S.A.J. Relative Greenness Index for assessing curing of grassland fuel. Remote Sens. Environ. 2011, 115, 1456–1463. [Google Scholar] [CrossRef]
  64. Akıncı, H.A.; Akıncı, H. Machine learning based forest fire susceptibility assessment of Manavgat district (Antalya), Turkey. Earth Sci. Inform. 2023, 16, 397–414. [Google Scholar] [CrossRef]
  65. Margolis, E.Q.; Swetnam, T.W. Historical fire–climate relationships of upper elevation fire regimes in the south-western United States. Int. J. Wildland Fire 2013, 22, 588–598. [Google Scholar] [CrossRef]
  66. Spittlehouse, D.; Dymond, C. Interaction of elevation and climate change on fire weather risk. Can. J. For. Res. 2022, 52, 237–249. [Google Scholar] [CrossRef]
  67. Adab, H.; Kanniah, K.D.; Solaimani, K. Modeling forest fire risk in the northeast of Iran using remote sensing and GIS techniques. Nat. Hazards 2013, 65, 1723–1743. [Google Scholar] [CrossRef]
  68. Maingi, J.; Henry, M. Factors influencing wildfire occurrence and distribution in eastern Kentucky, USA. Int. J. Wildland Fire 2007, 16, 23–33. [Google Scholar] [CrossRef]
  69. Abid, F. A Survey of Machine Learning Algorithms Based Forest Fires Prediction and Detection Systems. Fire Technol. 2021, 57, 559–590. [Google Scholar] [CrossRef]
  70. Davis, M.; Shekaramiz, M. Desert/Forest Fire Detection Using Machine/Deep Learning Techniques. Fire 2023, 6, 418. [Google Scholar] [CrossRef]
  71. Milanović, S.; Marković, N.; Pamučar, D.; Gigović, L.; Kostić, P.; Milanović, S.D. Forest Fire Probability Mapping in Eastern Serbia: Logistic Regression versus Random Forest Method. Forests 2021, 12, 5. [Google Scholar] [CrossRef]
Figure 1. Location of the study area.
Forests 15 01523 g001
Figure 2. Fire-conditioning factors. (A) PV/NPV, (B) NDVI, (C) land use, (D) plant species, (E) soil type, (F) temperature.
Forests 15 01523 g002
Figure 3. Fire-conditioning factors. (A) Rainfall, (B) humidity, (C) wind speed, (D) elevation, (E) slope, (F) aspect.
Forests 15 01523 g003
Figure 4. Fire-conditioning factors. (A) Distance to road; (B) distance to residential.
Forests 15 01523 g004
Figure 5. Flowchart of the methodology adopted.
Forests 15 01523 g005
Figure 6. Forest-fire risk assessment with different methods. (A) AHP, (B) CWM, (C) RF.
Forests 15 01523 g006
Figure 7. The proportion of forest-fire risk distribution was calculated with different methods. (A) AHP, (B) CWM, (C) RF.
Forests 15 01523 g007
Figure 8. The importance of conditioning factors.
Forests 15 01523 g008
Figure 9. The impact of rainfall on forest fires.
Forests 15 01523 g009
Figure 10. The impact of NPV/PV on forest fires.
Forests 15 01523 g010
Figure 11. The impact of NDVI on forest fires. YFF means the year of forest-fire occurrence; −4, −3, −2, and −1, respectively, represent the four years, three years, two years, and one year before the fire occurred; 1, 2, 3, and 4, respectively, represent the year, two years, three years, and four years after the fire occurred.
Forests 15 01523 g011
Figure 12. Changes in vegetation cover before and after the forest fire in Anning River Valley. (A) Before the forest fire occurred. (B) Within one year after a forest fire occurred. (C) One year after the forest fire occurred.
Forests 15 01523 g012
Table 1. Information on the forest-fire data used in this study.
NameSourceIdentifier
Landsat 7 ETM+
Landsat 8 OLI
United States Geological Survey (USGS)https://earthengine.google.com/ (accessed on 8 April 2024)
NDVI, humidityLANDSAT/LE07/C01/T1_SR
LANDSAT/LC08/C01/T1_SR
https://earthengine.google.com/ (accessed on 12 April 2024)
Plant speciesChina Plant Theme Databasehttp://www.plant.csdb.cn/ (accessed on 29 April 2024)
ElevationUSGS/SRTMGL1_003https://earthengine.google.com/ (accessed on 5 April 2024)
Rainfall, wind speedOpenLandMap/CLM/CLM_PRECIPITATION_SM2RAIN_M/v01https://earthengine.google.com/ (accessed on 5 April 2024)
TemperatureLANDSAT/LC08/C01/T1_SRhttps://earthengine.google.com/
Soli typeChina Soil Science Databasehttp://vdb3.soil.csdb.cn/ (accessed on 8 April 2024)
Land useEarth Big Data Science Engineeringhttps://data.casearth.cn/ (accessed on 9 April 2024)
Distance to road, distance to residential National Earth System Science Data Sharing Platformhttp://www.geodata.cn/Portal/index.jsp (accessed on 8 April 2024)
Historical Fire Point DataOfficial local government statistics
Table 2. Scale used for the AHP comparisons.
ScoreMeaning
1Equally important
3Moderately important
5Strongly important
7Very strongly important
9Extremely important
2, 4, 6, 8Intermediate values between the preference
Table 3. Forest-fire risk assessment accuracy validation statistics.
AHP HighMediumLowVery low
Common forest fire507983
Larger forest fire152140
Severe forest fire2200
Percentage (%)36.4155.436.521.63
CWM HighMediumLowVery low
Common forest fire498083
Larger forest fire152140
Severe forest fire2200
Percentage (%)35.8755.986.521.63
RF HighMediumLowVery low
Common forest fire3310043
Larger forest fire102361
Severe forest fire1300
Percentage (%)23.9168.485.432.17
Table 4. Statistical analysis of the relationship between fire and total combustible (PV) and inflammable (NPV) coverage in the research area.
Year201020112012201320142015201620172018201920202021
Type
Mean PV (%)84.787.48282.481.383.785.388.188.187.484.581.5
Mean NPV (%)14.111.617.111.616.513.410.48.98.49.19.710.4
Historical fire frequency171411328139773784
Table 5. NDVI changes before and after the year of the fire.
Year−4−3−2−1YFF1234
NDVI
Maximum0.9230.98410.97310.9820.9790.9791
Mean0.7410.7630.770.7810.7730.7930.7970.8120.816
Minimum0.3880.4740.4620.5130.490.5480.5440.5650.655
YFF means the year of forest-fire occurrence; −4, −3, −2, and −1, respectively, represent the four years, three years, two years, and one year before the fire occurred; 1, 2, 3, and 4, respectively, represent the year, two years, three years, and four years after the fire occurred.
Disclaimer/Publisher’s Note: The statements, opinions and data contained in all publications are solely those of the individual author(s) and contributor(s) and not of MDPI and/or the editor(s). MDPI and/or the editor(s) disclaim responsibility for any injury to people or property resulting from any ideas, methods, instructions or products referred to in the content.

