Abstract
Greenways are an important component of urban green infrastructure. User experiences and visual preferences are highly related to human well-being. The influencing factors of user experience and the relationship between environmental attributes with visual preference were explored by using the analytic hierarchy process method and questionnaire experiments. In this study, the analytic hierarchy process was conducted to construct the users’ experience evaluation system, and three methods were used to reveal the influencing factors of the users’ experience in the Mulan River greenway, China. The connection between visual perception and environmental attributes was also identified. The results show that the site leveling, plant landscape aesthetics, and air quality are the main factors affecting user experience. The most significant factor influencing visual preference is the green view index. The green view index can promote visual preference within 60%. Various environmental features contribute to visual preference, providing quantitative support for enhancing landscape quality. This research reveals the factors of visual preference that contribute to forming scientific recommendations for the management and quality improvement of the Mulan River greenway.
1. Introduction
Greenways are an important component of urban green infrastructure and corridors that link urban green ecological networks, providing urban residents with ecological benefits and access to natural landscapes [1]. The contributions of greenways to the quality of living in urban areas include recreation, fitness activities, disaster prevention, and sheltering [2]. User experience and visual preference provides ideas for greenway renewal and renovation [3,4]. The evaluation of user experience and visual preference from residents can be used as an important reference for greenway planning and quality improvement [5]. Various factors affecting the users’ experience include the aesthetics, cleanliness, nature, safety [6], thermal comfort [7], plant landscape, landscape furniture, facilities [8], the green view index [9], accessibility, and green visibility [10]. Visual content serves as the foundation for evaluating visual preference and experience [11]. The comprehensive assessment method can reasonably evaluate the quality of greenways [12]. The explanatory power of the various factors that contribute to the users’ experience and visual preferences is not yet known from a systemic perspective. There is a lack of relevant research on indicators, weights, and assessment models of user experience. Therefore, it is particularly important to construct a framework for the assessment of user experience. The study of user experience and visual preferences can shed light on the management, planning, and design of greenways.
Established studies suggest that factors can predict the quality of the park through modeling [13]. There are more major approaches to reveal the influencing factors of user experience, e.g., discrete choice modeling [14], importance-performance analysis [1], geographical detectors [15], and the random forest model [16,17]. A discrete choice model was applied to select panoramic photographs to reveal landscape preferences [14]. In addition, the use of machine learning methods can prioritize the identification of built environment attributes that affect resident satisfaction [18]. There are relatively few comparative studies between different models and methods, and further explanation is needed as to whether there are differences in the impact of the results.
People form aesthetic preferences based on the stimuli in their surroundings, shaping their experience [19]. Current studies suggest that user experience is highly related to visual preference [16,17]. Visual preference represents a psychological assessment that illuminates the relationship between humans and perceived environmental features [20]. Visual preferences help improve a user’s experience of visiting places. Environmental attributes of greenways significantly influence visual preferences [9,21]. Established studies have identified a correlation between visual preference and environmental attributes [16,17]. Environmental features or attributes can predict the thresholds of landscape preference [22]. Some researchers argue that landscape characteristics, such as the presence of water and the amount of vegetation, significantly influence user preferences [9]. This research proved that visual preference is highly related to environmental attributes. Nonetheless, the thresholds of factors that affect visual preferences still need to be explored. Therefore, a framework for evaluating the user preference for greenways was constructed by conducting a user preference survey of the Mulan River greenway. The framework of the users’ experience can be used to evaluate the quality of greenways and explain the impact of different factors on the users’ experience. Mulan River is representative in China to be systematically governed by the whole watershed, and the Mulan River greenway has gradually become typified as an ecological governance model with high landscape values.
This study aims to address the following questions: (1) What are the main factors affecting the users’ experience of the greenway? (2) Which environmental features wield significant influence on visual preference? (3) What are the thresholds of factors that affect visual preferences? By addressing these questions, this study proposes a framework for the assessment of the user experience of the Mulan River greenway and we reveal the relationship between environmental attributes and visual preference. This research reveals the factors of visual preference that contribute to forming scientific recommendations for the management and quality improvement of the Mulan River greenway.
2. Literature Review and Theoretical Considerations
User experience is a comprehensive perception, which is influenced by subjective feelings and objective physical supplies. In the context of urban greenways, various factors affecting user experience and visual preference include environmental perception, recreational facilities, and management and maintenance. Environmental perception essentially contains the perceptual aspects of the environment for human beings. Recreational facilities are mainly focused on the existence of the physical facilities provided by the venue for the users. Management and maintenance are concerned with the impact that the management and maintenance of the space has on a user’s experience.
2.1. Environmental Perception
The users’ experience is closely related to their physical and mental perceptions. Various factors affecting user experience include environmental factors, psychological factors, and environmental characteristics. The environmental factors (air quality, acoustic environment, site leveling, and the green view index) [10] and thermal comfort [7] were highly related to the users’ experience. Planted environments positively influence satisfaction and are an important component of human well-being [4]. Psychological factors, such as a sense of security, can cause stress during recreation and affect the experience, e.g., too dense vegetation or overgrown weeds can cause fear or anxiety [23]. A sense of safety is a psychological perception of users during greenway recreation [6]. Environmental attributes influence visual preference [24]. The combination of landscape elements will drive people to form visual preferences [25].
2.2. Recreational Facilities
The need for recreational facilities is inevitable in the use of greenways. Hardscape amenities influence landscape preferences through user experience [8]. Factors that have a greater impact on recreational satisfaction include infrastructure and safety facilities [26]. Facilities include seating facilities, toilets, rubbish bins, sports and fitness equipment, and signage systems to provide a more comfortable environment for users [27].
2.3. Management and Maintenance
Landscape preference is closely related to the degree of landscape maintenance and management [4]. Greenway management mainly involves cleanness and plant maintenance, safety and security, security management, and facility maintenance [6]. The level of plant maintenance affects the aesthetics of the plant landscape [28], which indirectly reflects the level of management. Security protection and public security management aim to ensure the personal safety of users, i.e., whether security guards are patrolling, is closely related to the level of security [26].
3. Materials and Methods
3.1. Study Area
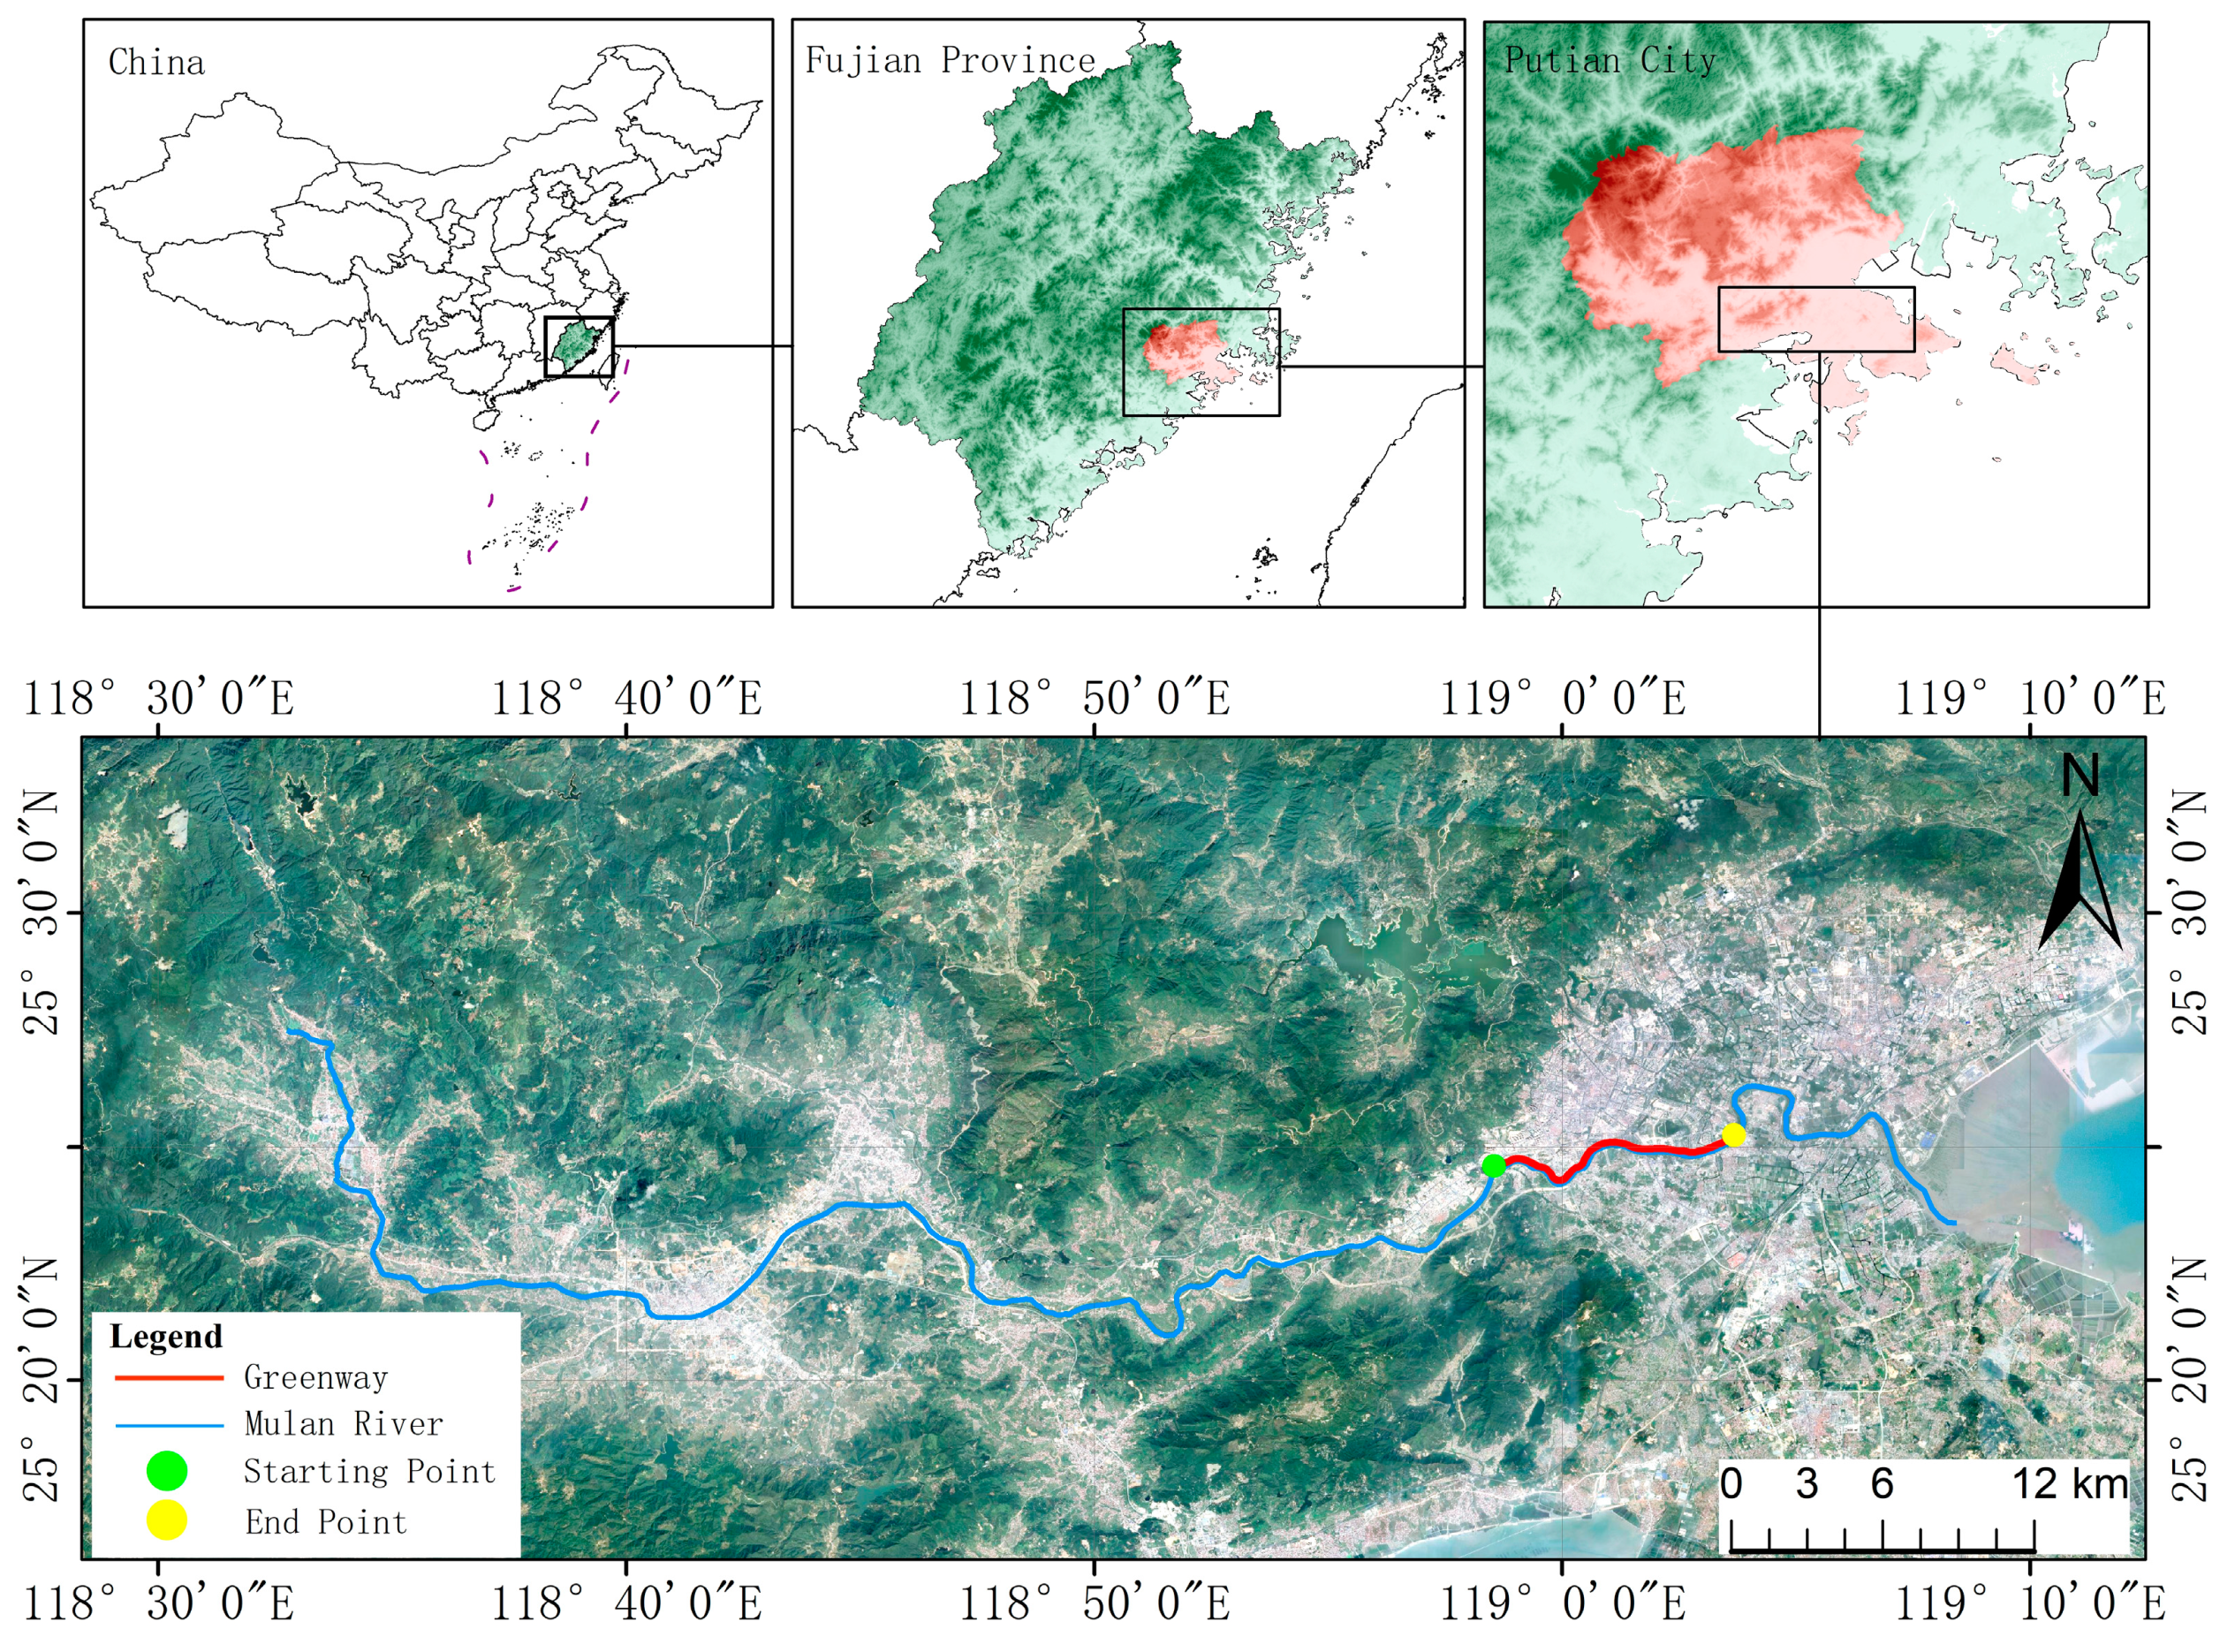
Putian is situated in Fujian, China, at coordinates ranging from 118°27′ to 119°39′ E, and 24°59′ to 25°46′ N. Putian has a subtropical oceanic monsoon climate with an average annual temperature ranging from 18 to 21 °C, an average annual sunshine duration of 1995.9 h, and an annual precipitation level between 1000 and 1800 mm. The Mulan River is recognized as the ancestral waterway of the Putian populace, rich in historical and cultural significance. It is one of the primary water systems in Fujian, with the primary Mulan River channel stretching over 168 km and covering a watershed area exceeding 2000 square kilometers [29]. The Mulan River greenway is established along the Mulan River, with a total length of approximately 10 km (Figure 1). The Mulan River greenway serves as an urban green corridor, providing urban residents with places for recreation, leisure, and physical activity.
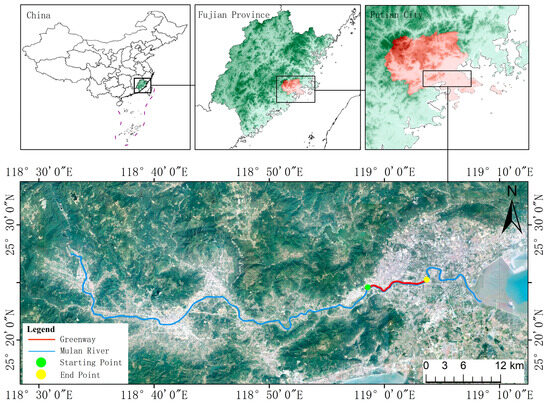
Figure 1.
The location of the study area.
3.2. Method
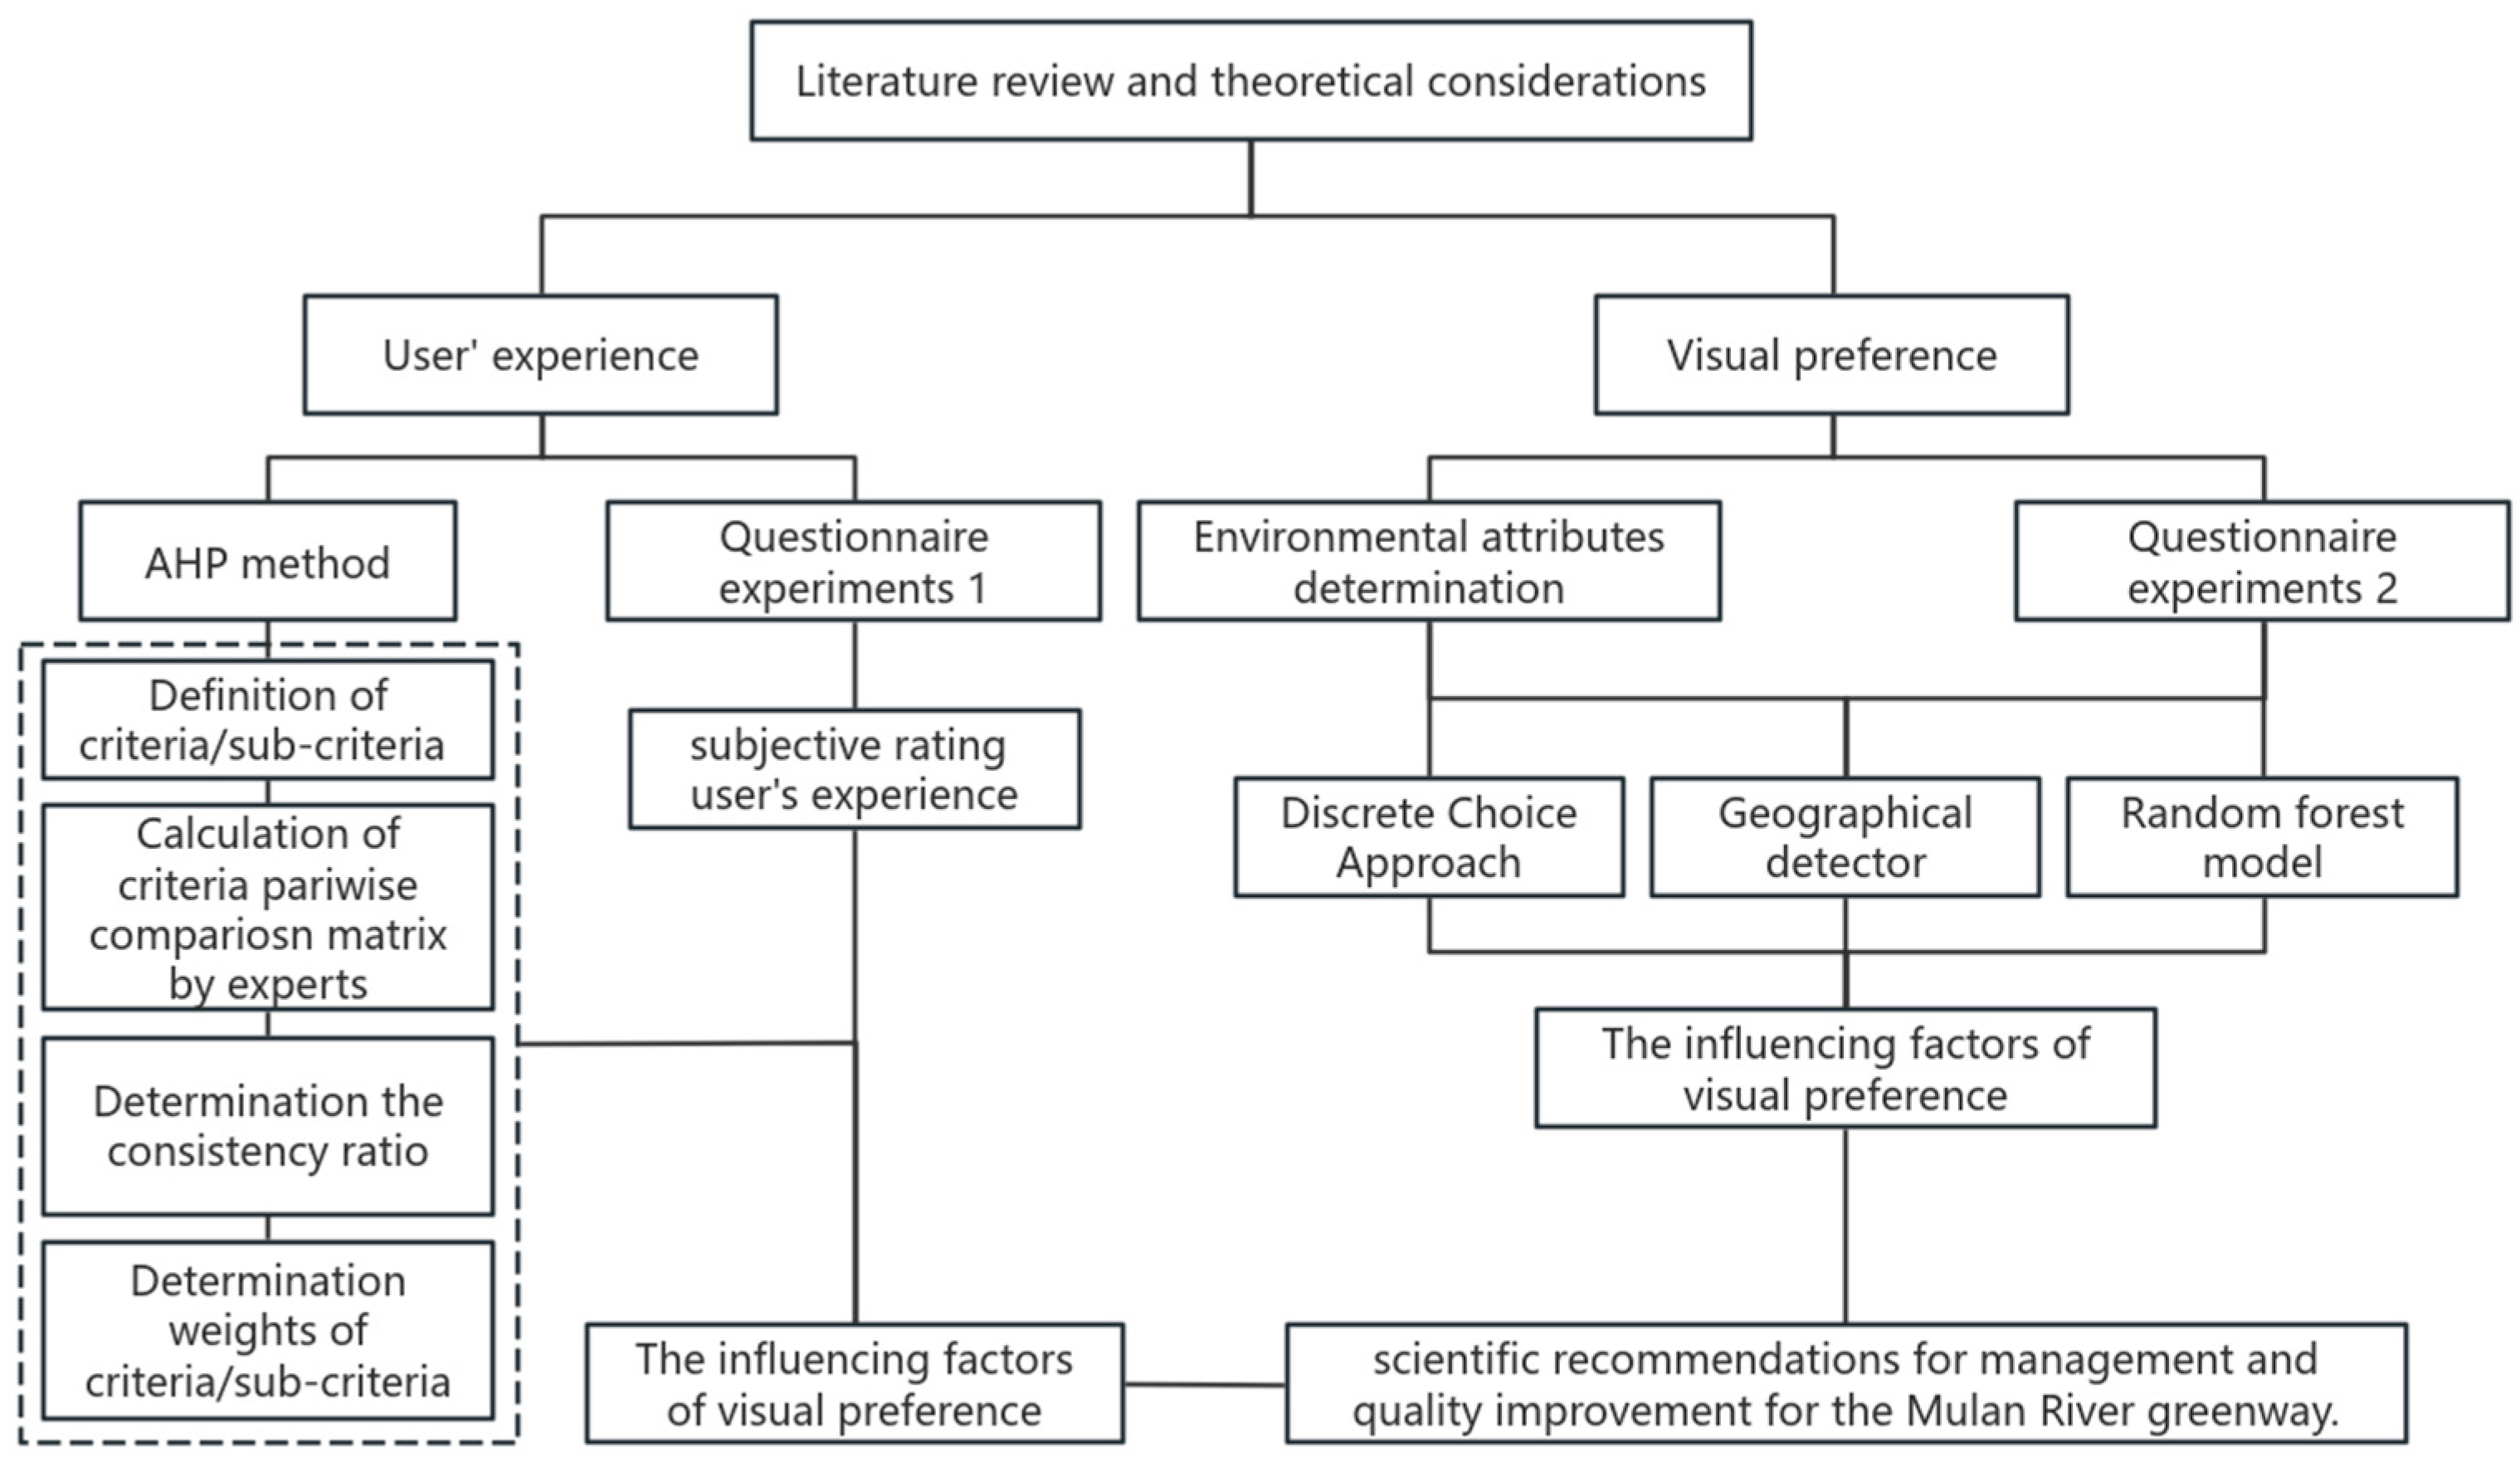
We employed the analytic hierarchy process method (AHP), questionnaire experiments, and an environmental attributes determination to reveal the influencing factors of users’ experience and visual preference. The research framework is depicted in Figure 2.
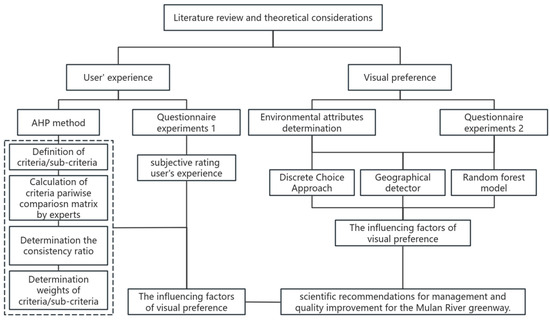
Figure 2.
Research framework.
3.2.1. Constructing the Evaluation Criteria
Ten experts from urban planning and landscape architecture majors were invited to screen the indicators of users’ experience, and the assessment of user experience was constructed using the AHP method. The details were described by Türker, et al. [30]. First, the criteria and sub-criteria were determined through the literature review (see Table 1). Then, we defined the criteria and sub-criteria, which are important for the assessment of greenway user experience. Third, we created a pairwise comparison matrix for calculating the weights of criteria and sub-criteria. Fourth, we determined the consistency ratio. Finally, the final weight was calculated.

Table 1.
The framework of evaluation of users’ experience of the Mulan River greenway.
The assessment of user experience was set up to analyze three aspects: landscape environment perception, recreational facilities, and management and maintenance. The environmental perception in the criterion layer includes plant landscape aesthetics (C1), air quality (C2), acoustical environment (C3), site leveling (C4), physical comfort (C5), environmental characteristics (C6), and sense of security (C7); recreational facilities in the criterion layer includes exercise and fitness equipment (C8), marking system (C9), number of public toilets (C10), number of rubbish bins (C11), seating facilities (C12), and landscape furniture (C13); management and maintenance in the criterion layer includes security protection (C14), site sanitation (C15), public security management (C16), maintenance of facilities and plants (C17), and overall satisfaction (Y).
3.2.2. Questionnaire Experiments
Experiment 1: The subjective rating of the users’ experience.
Experiment 1 was conducted from May to June 2022 from 8:00 to 18:00 on the Mulan River greenway. A total of 283 volunteers were invited to participate in questionnaires on site, with a male-to-female ratio of 145 (51.2%) to 138 (48.8%). Among the 283 people, there were 11 people under the age of 18, accounting for 3.9%; 214 people aged 18–60, accounting for 75.6%; and 58 people over 60, accounting for 20.5% of the total. This questionnaire involved 18 questions from C1~C17 and included the overall satisfaction. The users’ experience was rated with a 5-point Likert scale [34], where scores ranging from 1 to 5 represented “very dissatisfied”, “dissatisfied”, “neutral”, “satisfied”, and “very satisfied,” respectively.
Experiment 2: Environmental attributes and visual preference.
An online questionnaire survey was conducted through the Questionnaire Star platform (https://www.wjx.cn/, accessed on 1 May 2022, Questionnaire S1) from May to June 2022. A total of 240 volunteers were invited to evaluate the subjective ratings of the images from the 96 sample plots. The participants had an average age of 26.7 ± 4.0 years, with a male-to-female ratio of 121:119. Before the experiment, participants were informed about the potential for visual fatigue and distraction when evaluating numerous images. Therefore, the 240 participants were divided into three groups of 80 individuals each, with the 96 sample point images randomly distributed among these groups in sets of 32. At the beginning, the information (age, gender, diploma, and occupation) about participants was required to fill in a questionnaire. Then, the participants in each group rated their visual preferences for the 32 images on a 5-point Likert scale [34], where scores ranging from 1 to 5 represented “very dislike”, “dislike”, “neutral”, “like”, and “very like”, respectively.
3.2.3. Environmental Attributes Determination
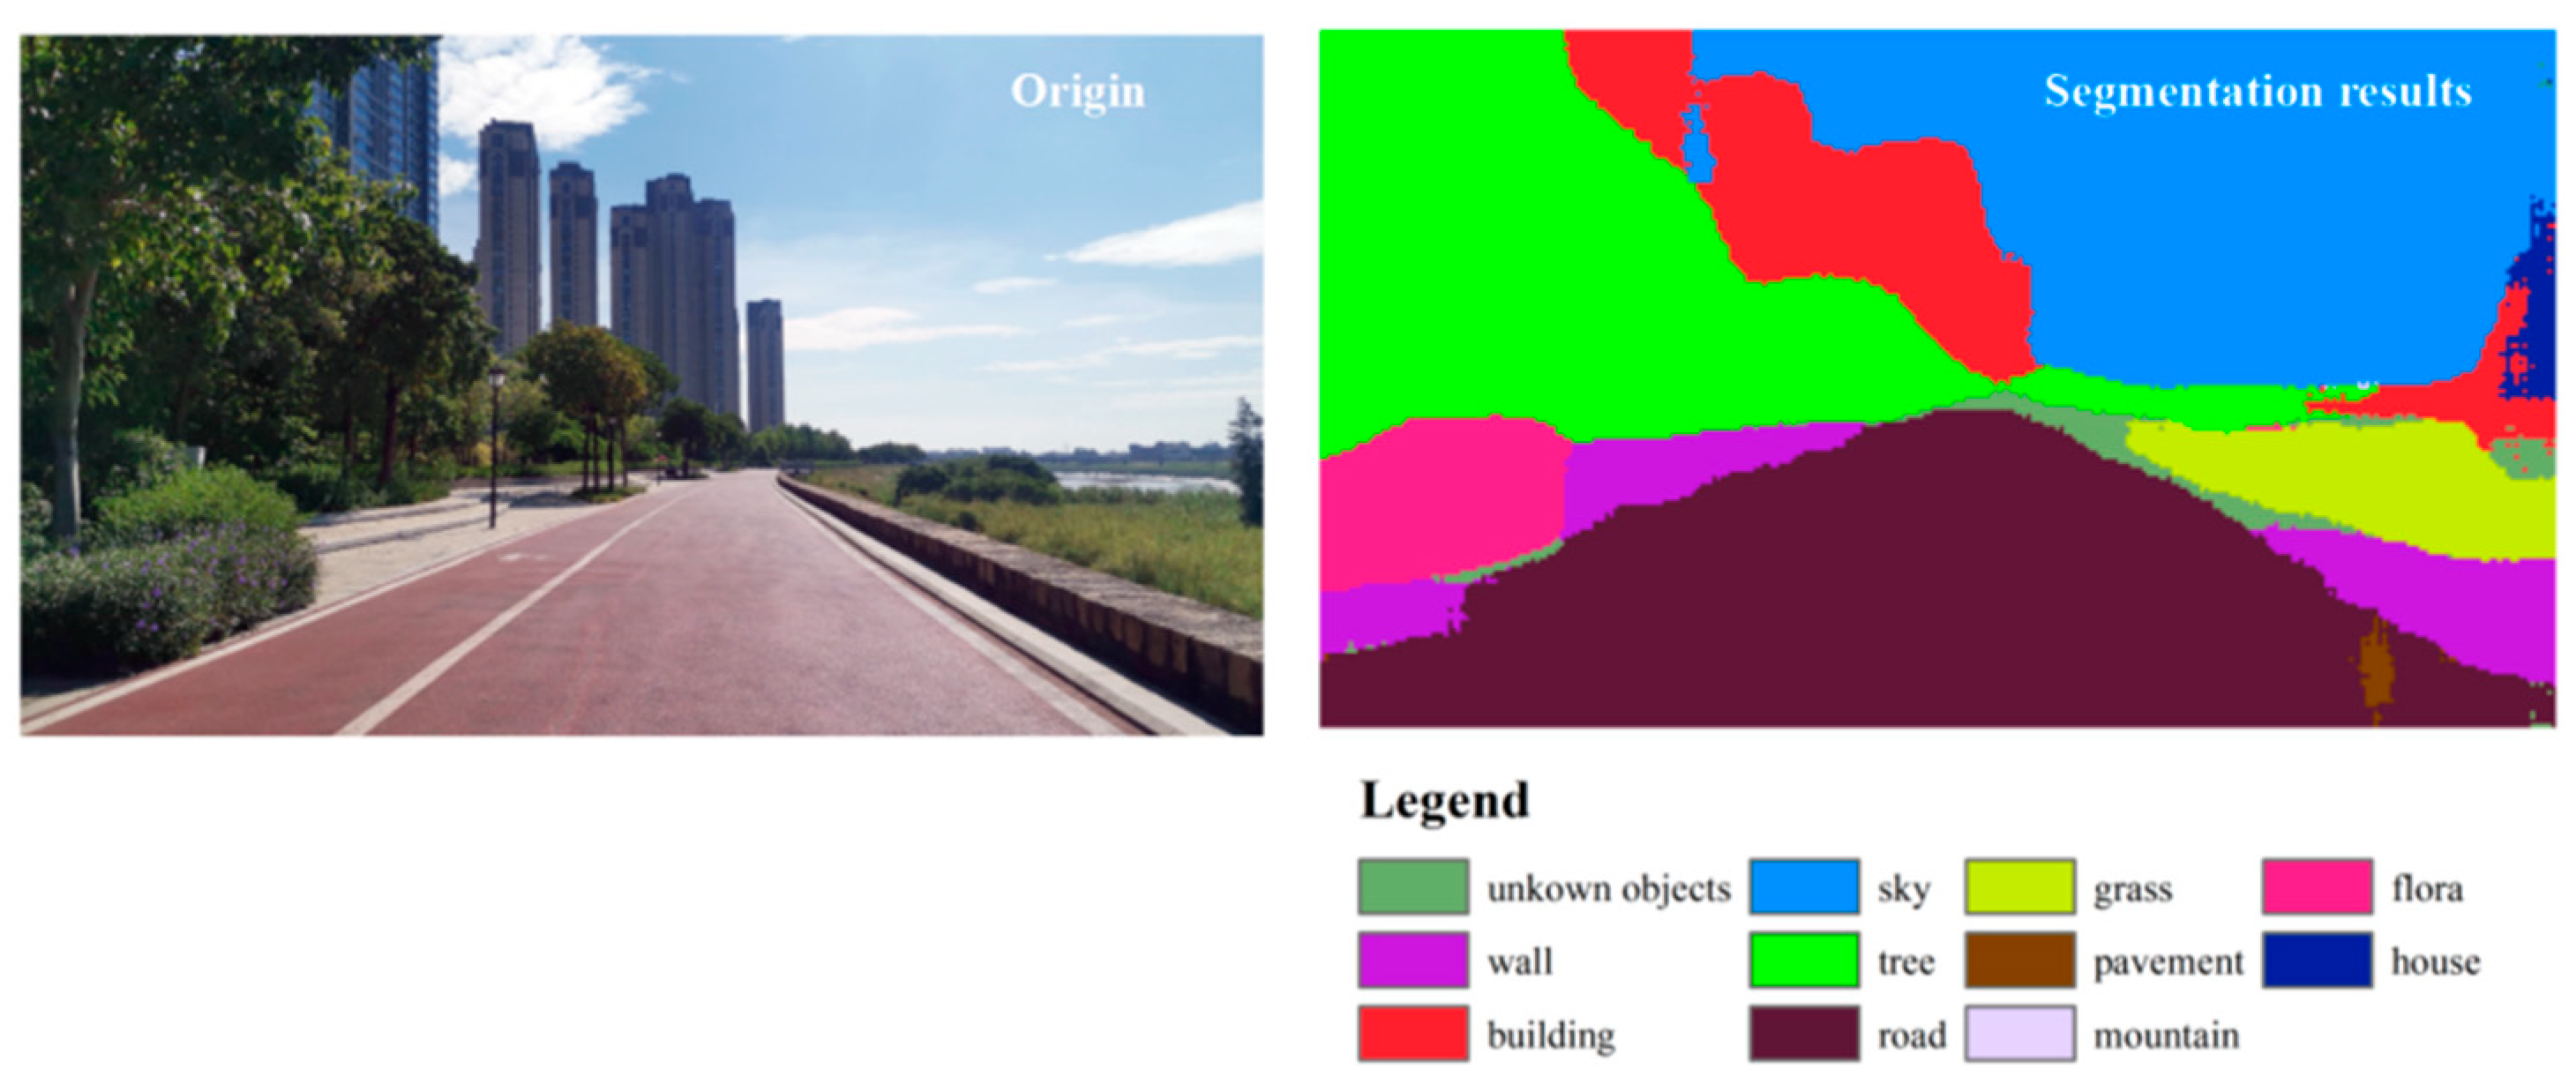
The environmental attributes determination was conducted in April 2022. The photos were taken in the morning on a sunny day. The data were collected at 100 m intervals, yielding a total of 96 sample plots in the Mulan River greenway from the beginning to the end (see Supplementary Figure S1). The pictures in each sample plot were taken at a horizontal level about 1.7 m above the ground by camera [7]. Semantic segmentation software utilizing a deep learning full convolutional network (FCN) trained on the ADE_20K dataset was employed to identify landscape elements [35]. With the help of semantic segmentation software, we were able to identify 150 environmental elements in pictures of sample plots (Figure 3). The percentage of environmental attributes in pictures was calculated using semantic segmentation software. The green view index (GVI) quantifies the percentage of pixels occupied by plant life (trees, shrubs, grasses, and flowers), while the blue view index (BVI) measures the proportion of pixels featuring bodies of water, such as rivers, lakes, oceans, and artificial water features, relative to the total pixel count in the image. Additionally, road (pavement), sky view factor (SVF), and building proportions were computed based on pixel ratios in each sample plot image. ColorImpact software v. 4.0.3 was utilized to extract colors occupying more than 5% of the image area. The number of colors and color areas were recorded using ColorImpact software. Color richness and color diversity were calculated according to Equations (1)–(3). The image was then imported into AutoCAD v. 2017 software to determine skyline dimensions with the assistance of Fractalyse 2.4 software.
where CN: color richness, CD: color diversity, S: number of colors, N: total color area, n: area of a single color, and i ranges from 1 to s.
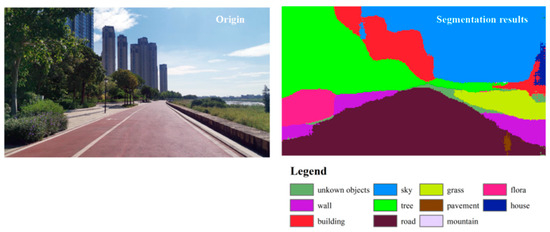
Figure 3.
Segmentation results of sample pictures.
3.3. Data Analysis
The geographical detector, random forest model, and discrete choice approach were conducted to determine the influencing factors of the users’ experience. The random forest model uses both the “randomForest” package and the “GD” package in the R language. The discrete choice approach was completed in SPSS 24.0. The “mgcv” package was utilized to visualize the fitted relationships between dependent and independent variables, and the “segmented” package was employed to identify estimated breakpoints in the relationships. Getis-Ord Gi* analysis was conducted in ArcGIS 10.2.
The generalized linear mixed model (GLMM) was implemented using the “GLMM.HP” package in R 4.3.2 to elucidate the explanatory power and contributions of independent variables to the dependent variable [36]. The R2m variable represents the proportion of variance explained by the fixed effects, while R2c captures the variance explained by both fixed and random effects.
3.3.1. Questionnaire Reliability and Validity Analysis
A reliability and validity analysis of questionnaire experiments 1 and 2 were used to indicate the quality of questionnaire data. If the Cronbach alpha coefficient value was greater than 0.6, i.e., the data reliability is good and there is consistency between the data internally, it reflects that the data meet the requirements of the reliability test [37]. If the validity analysis, KMO (Kaiser–Meyer–Olkin), value was greater than 0.6 and Barlett’s spherical test passed the significance test, i.e., the questionnaire data has some validity and accuracy, then the data meet the requirements of the validity test. Questionnaire reliability and validity analysis were completed in SPSS 24.0.
3.3.2. Discrete Choice Approach
The chi-square test was conducted on the single-factor indicators and overall satisfaction, and the indicators that passed the significance test were included in the logistic regression model. The backward screening LR method was used to screen the indicators, and the variables that had a significant impact on overall satisfaction were gradually screened out. The five levels of overall satisfaction were classified as dichotomous variables, “very satisfied”, “satisfied”, and “neutral” were categorized as “satisfied”; and “dissatisfied” and “very dissatisfied” were categorized as “dissatisfied”.
3.3.3. Geographical Detector
Geodetector is a tool for detecting and utilizing spatial differentiation. This model includes four detectors: differentiation and factor detection, interaction detection, risk area detection, and ecological exploration [38]. The influencing factors of user experience can be revealed using geographic detectors [15]. The geographical detector model selects the explanatory power of landscape environment perception, recreation facilities, and greenway management on overall satisfaction. It is expressed by the q-value. The q-value domain is [0, 1], the greater the q-value, the stronger the explanatory power of the factor to the dependent variable (Y), and the more obvious the spatial specificity of the dependent variable (Y) [39]. In this study, overall satisfaction was recognized as the dependent variable. C1~C17 were recognized as the independent variables.
3.3.4. Random Forest Model
The random forest model is a classification tree-based machine learning algorithm dealing with nonlinear relationships, classification, and regression. Random forest is suitable for screening complex and changeable factors; it has accurate predictive ability, strong interpretability, and can effectively avoid variable collinearity and overfitting problems [16].
4. Results
4.1. Evaluation System of Assessment of Users’ Experience
The weight of environmental perception in the criterion layer was the highest (0.625, see Table 2). The final weight of physical comfort in the assessment of the users’ experience was the highest (0.197).
Table 2.
The assessment of users’ experience of the Mulan River greenway.
Overall satisfaction was rated as satisfactory by a total of 159 people (56.18%) and dissatisfactory by 124 people (43.82%, see Table 3). Seating facilities (C12) had the lowest rating of 2.63 ± 1.16 and air quality (C2) had the highest rating of 3.73 ± 0.98. There was no significant correlation between gender and overall satisfaction (χ2 = 0.369, r = −0.036, p = 0.544 > 0.05) and age did not have a significant correlation with overall satisfaction (χ2= 2.077, r = −0.086, p = 0.354 > 0.05). It suggested that there was no significant effect of different genders and ages on user experience ratings.
Table 3.
The user experience rating score.
4.2. Comparison of Three Methods to Reveal the Factors Influencing User Experience
The accuracy is relatively high, up to 71.0%. The −2 log-likelihood was 321.117, 0.21 for Cox and Snell R2, and 0.282 for Nagelkerke R2. Logistic regression analysis showed that site leveling, air quality, and plant landscape aesthetics had a very significant impact on the users’ experience (p = 0.000 < 0.01, Table 4), and all three factors had a positive impact on the users’ experience.
Table 4.
The logistic regression analysis of the factors influencing users’ experience.
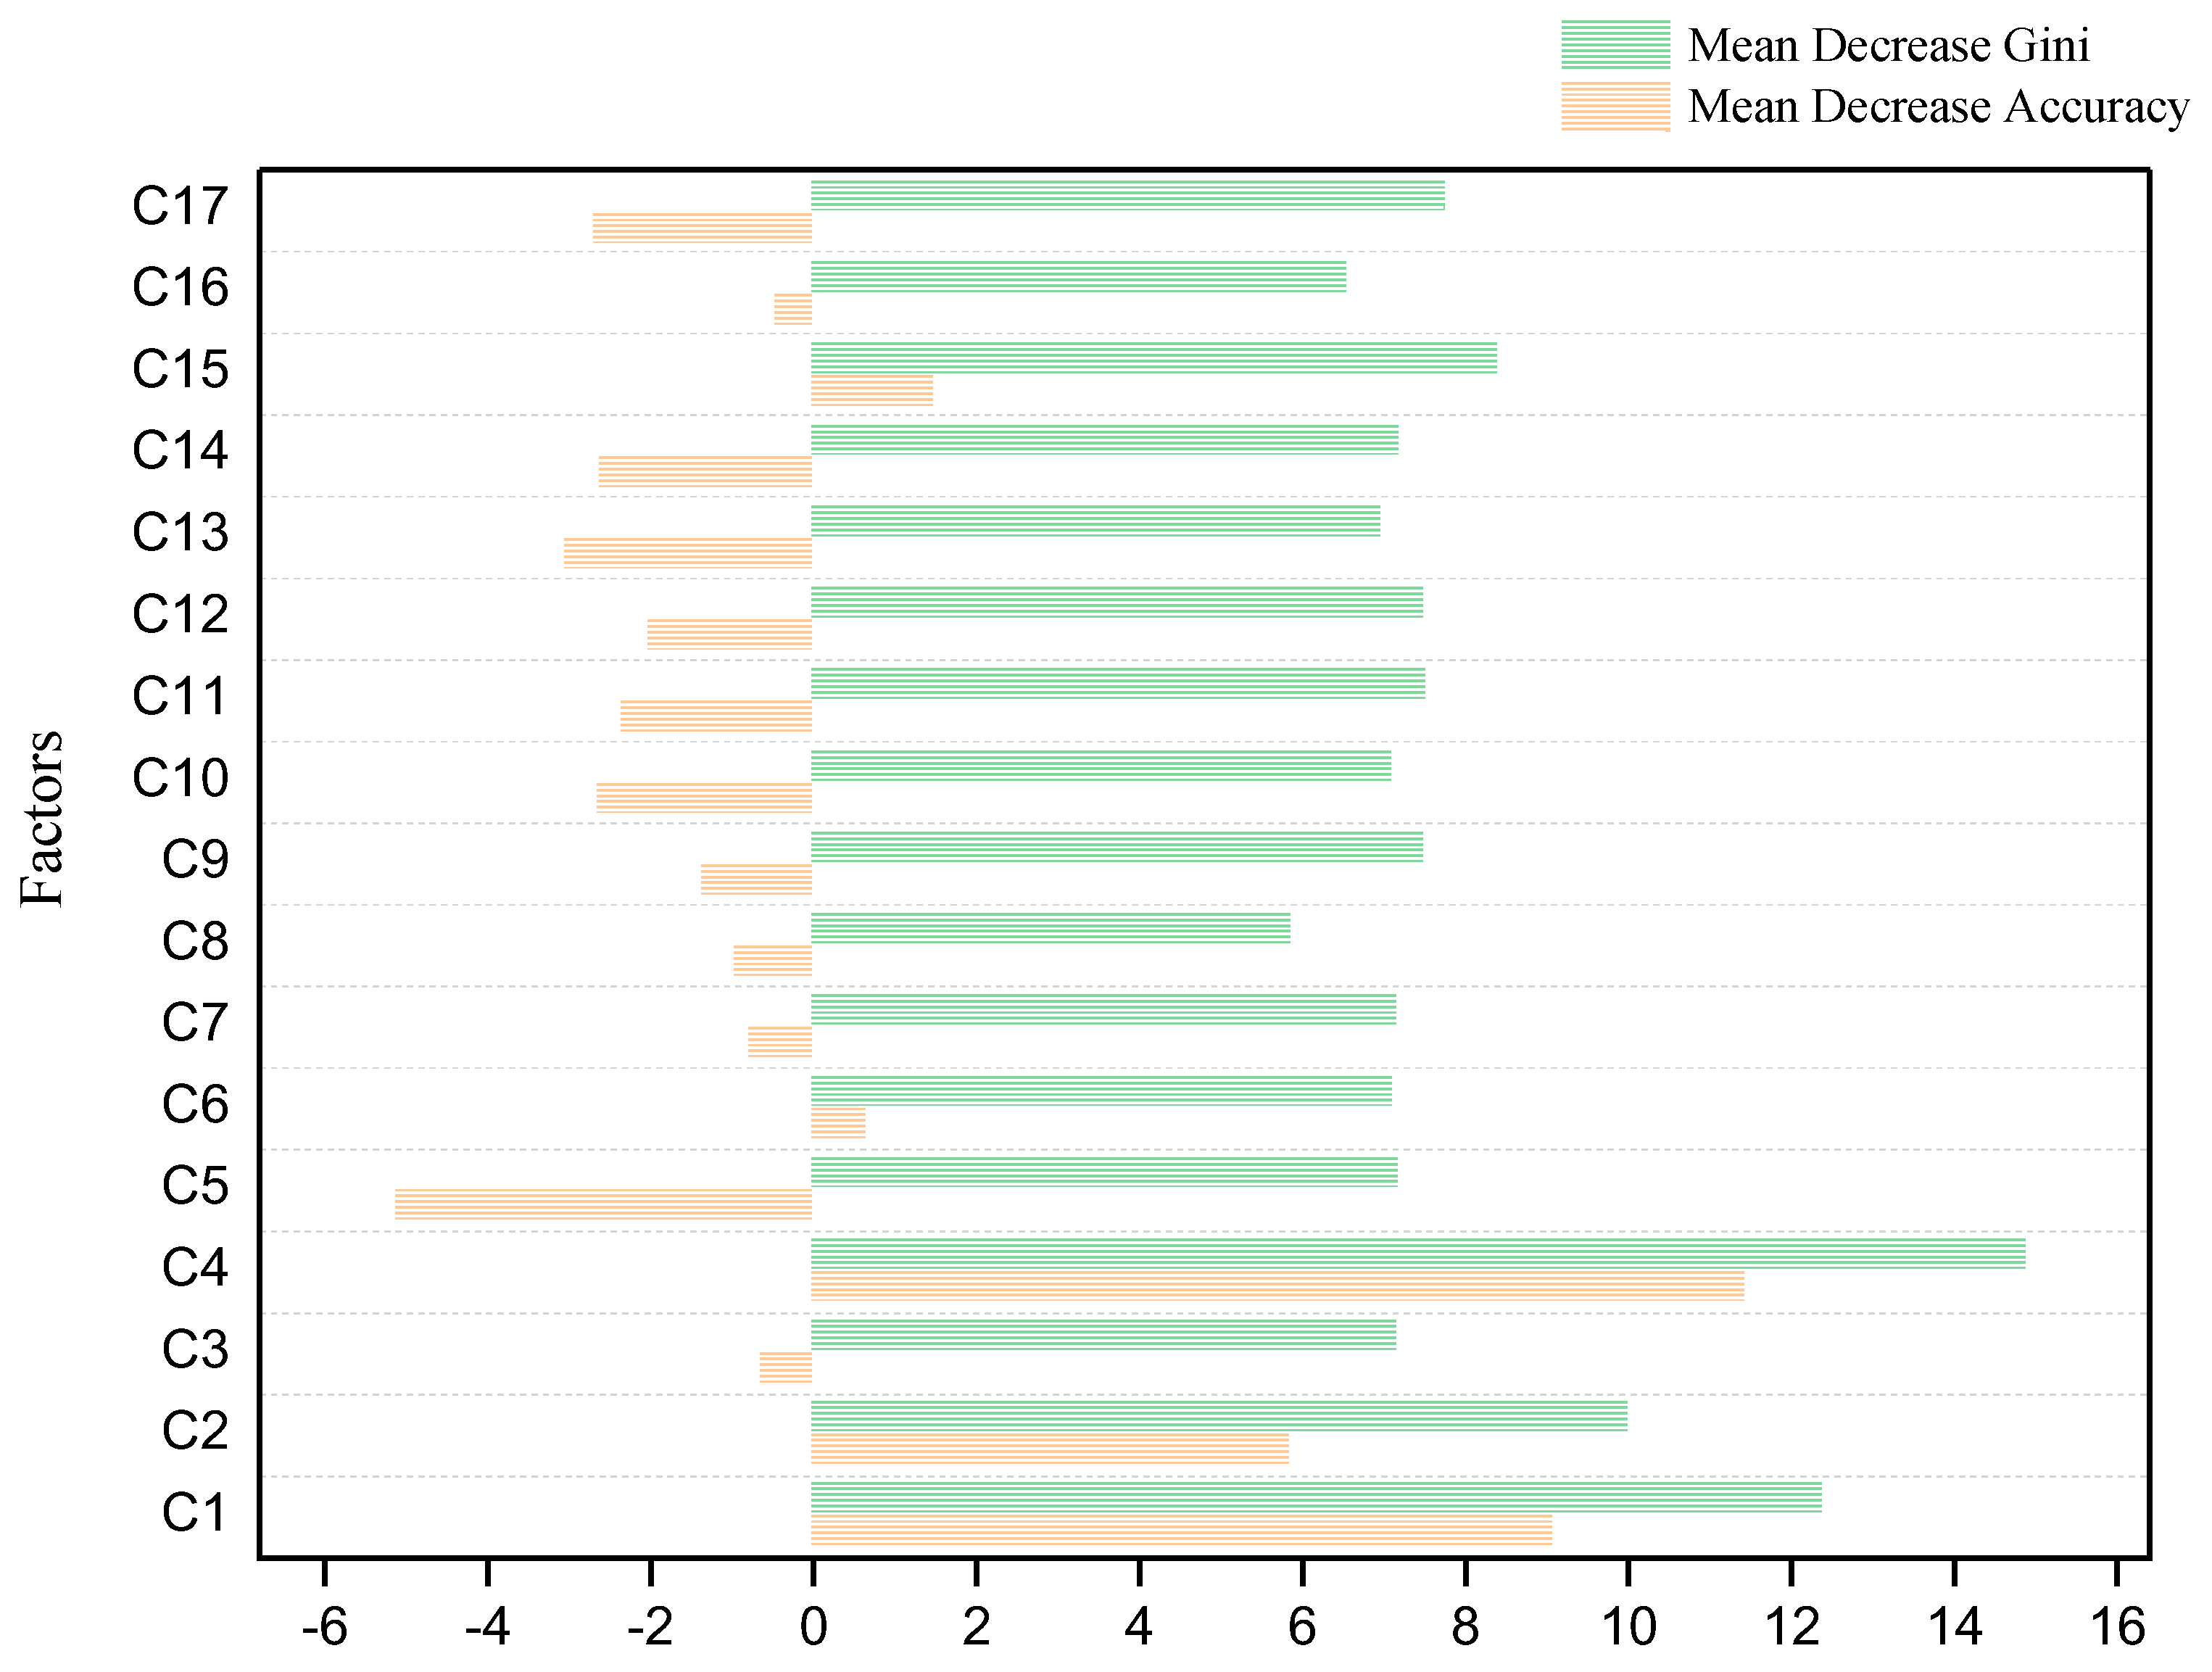
The highest accuracy of the random forest classification model was 62.54%. The main factors influencing users’ experience according to mean decrease accuracy and mean decrease Gini are site leveling (C4), plant landscape aesthetics (C1), air quality (C2), etc., (Figure 4). The site leveling, plant landscape aesthetics, and air quality have the greatest impact on the evaluation of green space users’ experience.
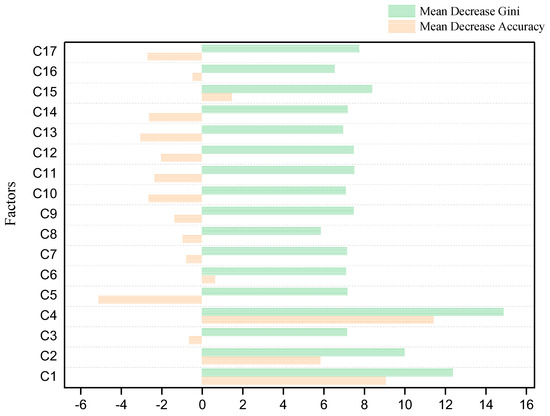
Figure 4.
Importance of influencing factors of users’ experience. C1: plant landscape aesthetics, C2: air quality, C3: acoustical environment, C4: site leveling, C5: physical comfort, C6: environmental characteristics, C7: sense of security, C8: exercise and fitness equipment, C9: marking system, C10: number of public toilets, C11: number of rubbish bins, C12: seating facilities, C13: landscape furniture, C14: security protection, C15: site sanitation, C16: public security management, C17: maintenance of facilities and plants.
The factor detector in the geographical detector quantifies the degree of influence of each factor on the users’ experience satisfaction evaluation and is judged by calculating the q-value of each factor. The main factors influencing the user satisfaction evaluation were site leveling (C4), plant landscape aesthetics (C1), and air quality (C2) (q = 0.104, 0.100, 0.065, p < 0.001, Table 5). The mutual detector shows that the factors are nonlinearly weakened, that is, there is no interaction between the factors.
Table 5.
The factor detector analysis between user experience and driving factors.
4.3. Various Environmental Attributes
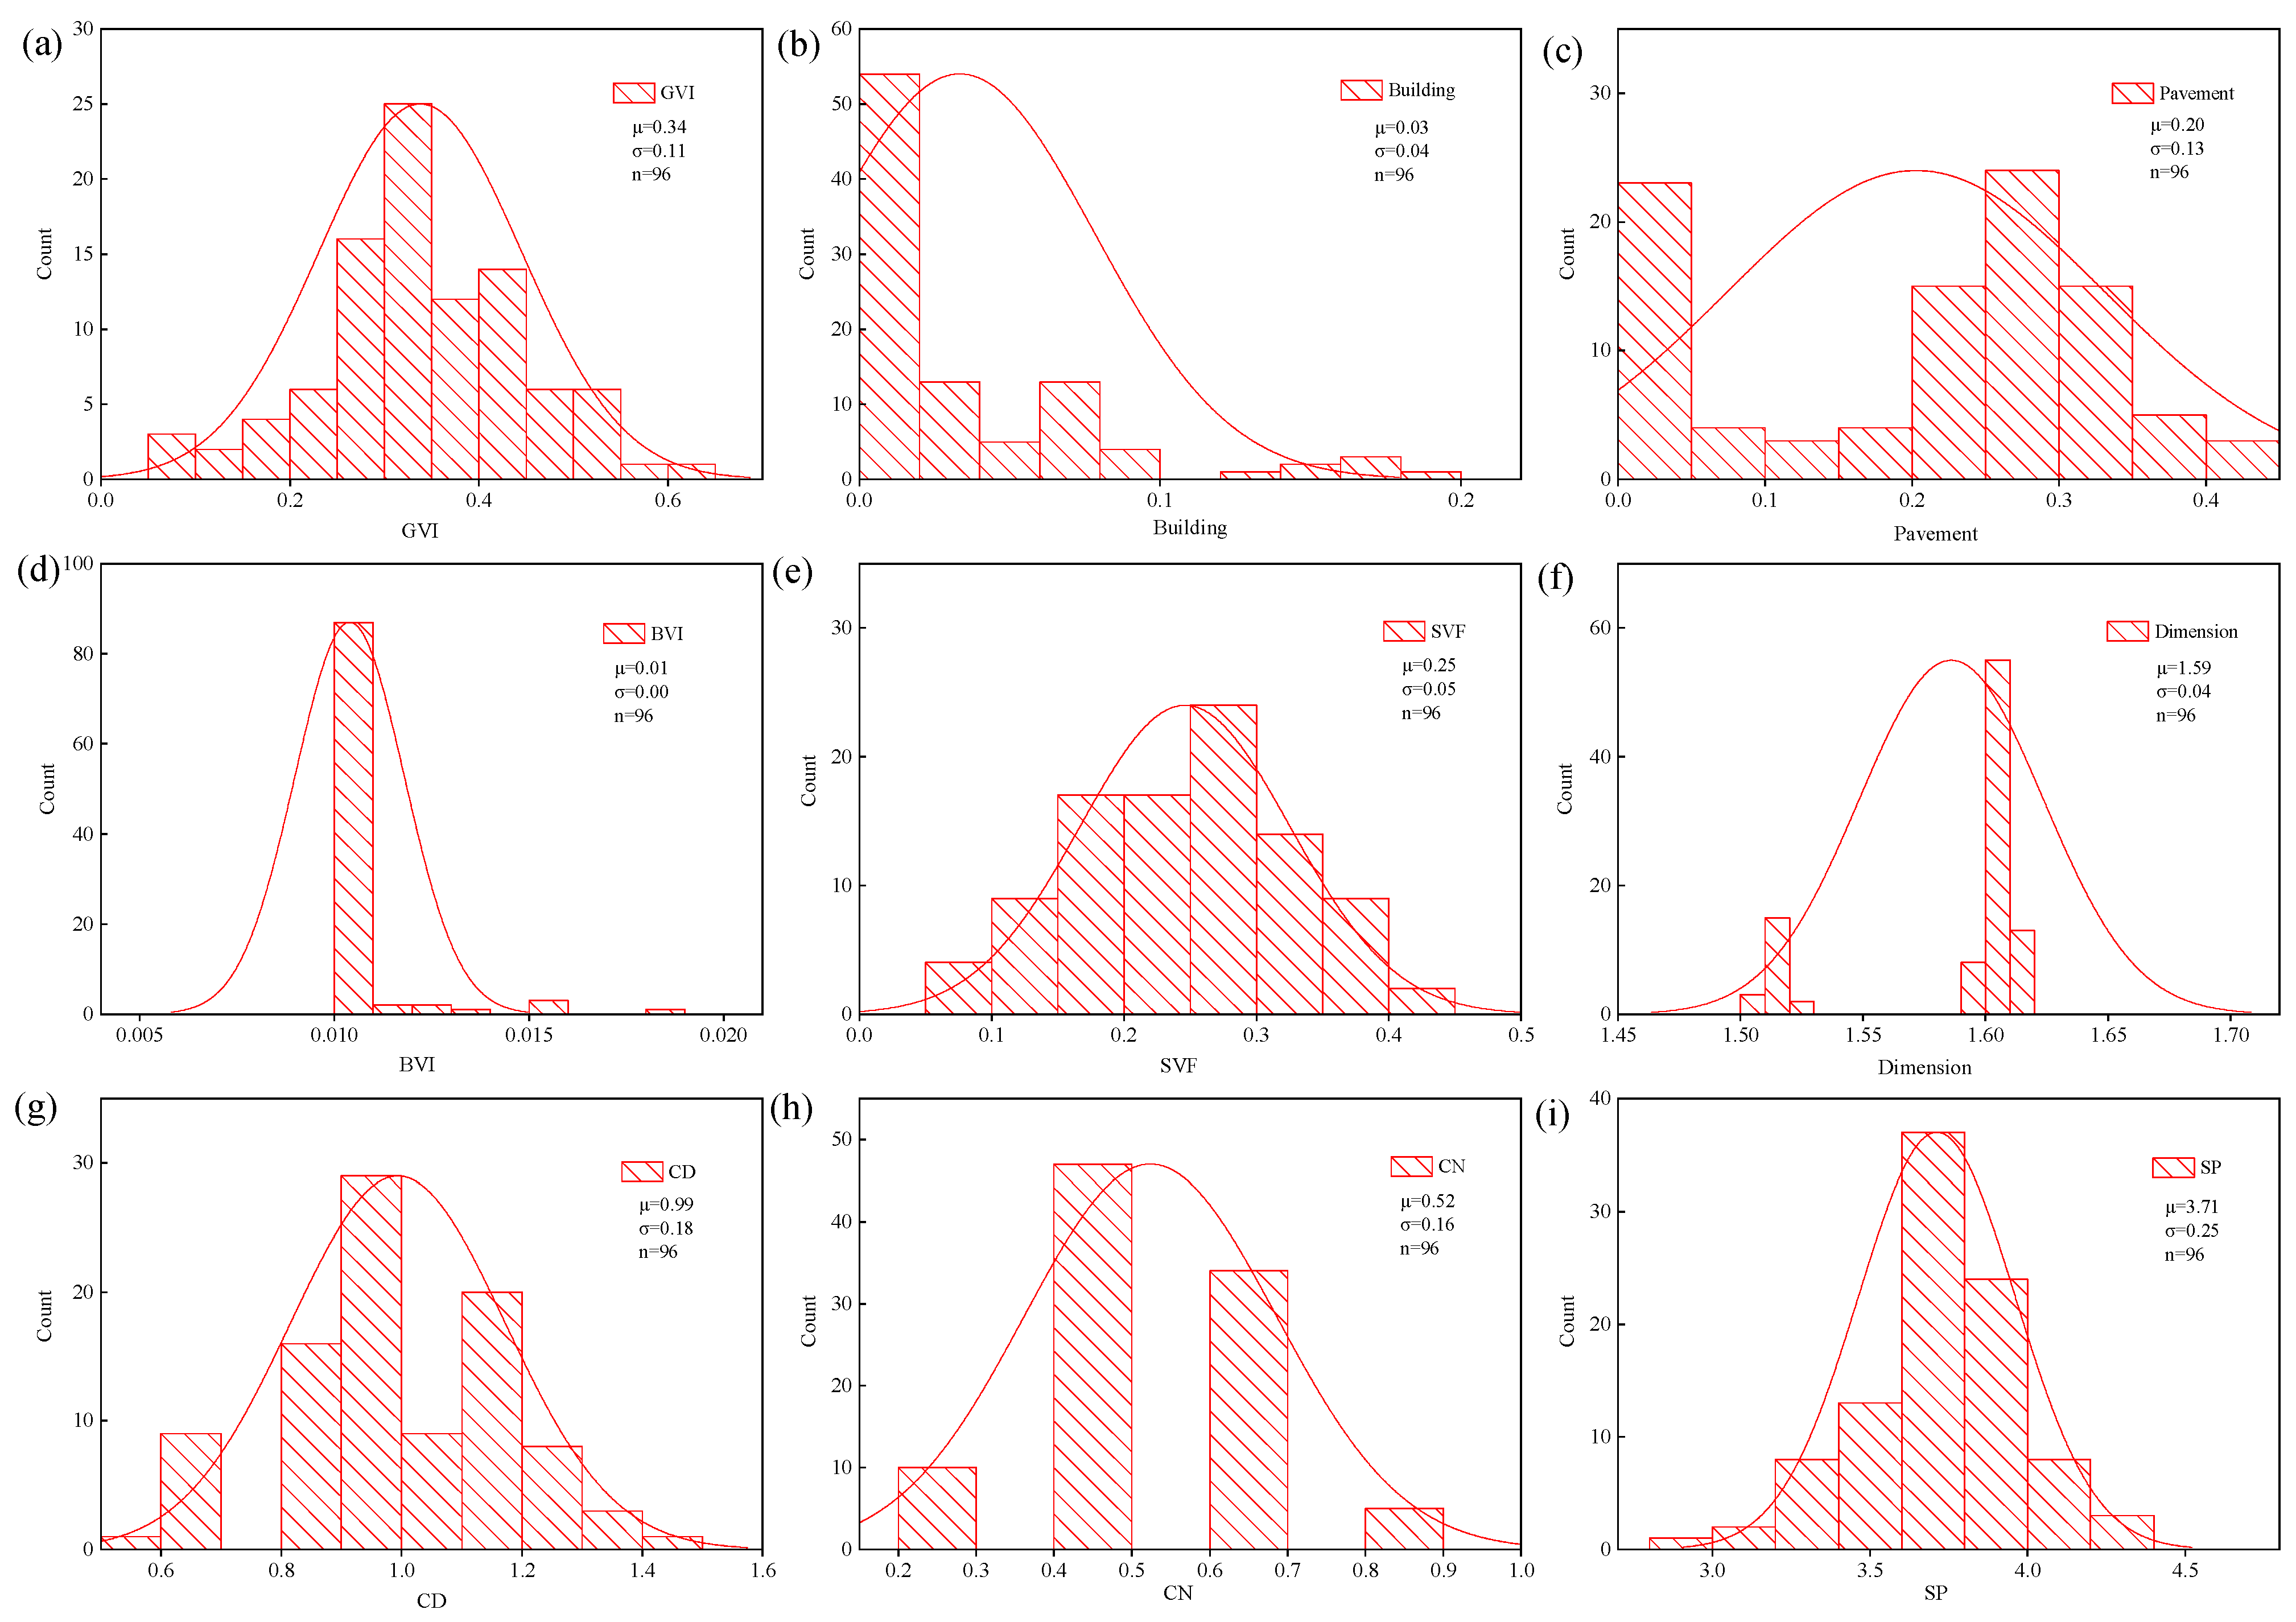
Environmental characteristics exhibit variations (see Figure 5). The GVI ranges from 0.07 to 0.60, while the building values range from 0 to 0.19. Pavement and BVI values are relatively low. The color diversity and color richness display spatial variability.
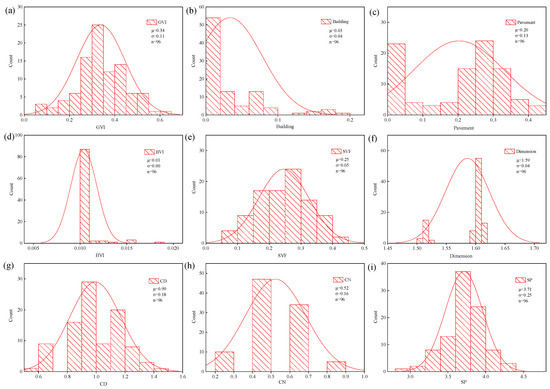
Figure 5.
The variety of environmental attributes. (a) GVI: green view index; (b) building; (c) pavement; (d) BVI: blue view index; (e) SVF: sky view factor; (f) dimension: the fractal dimension of skylines; (g) CD: color diversity; (h) CN: color richness; (i) SP: visual preference.
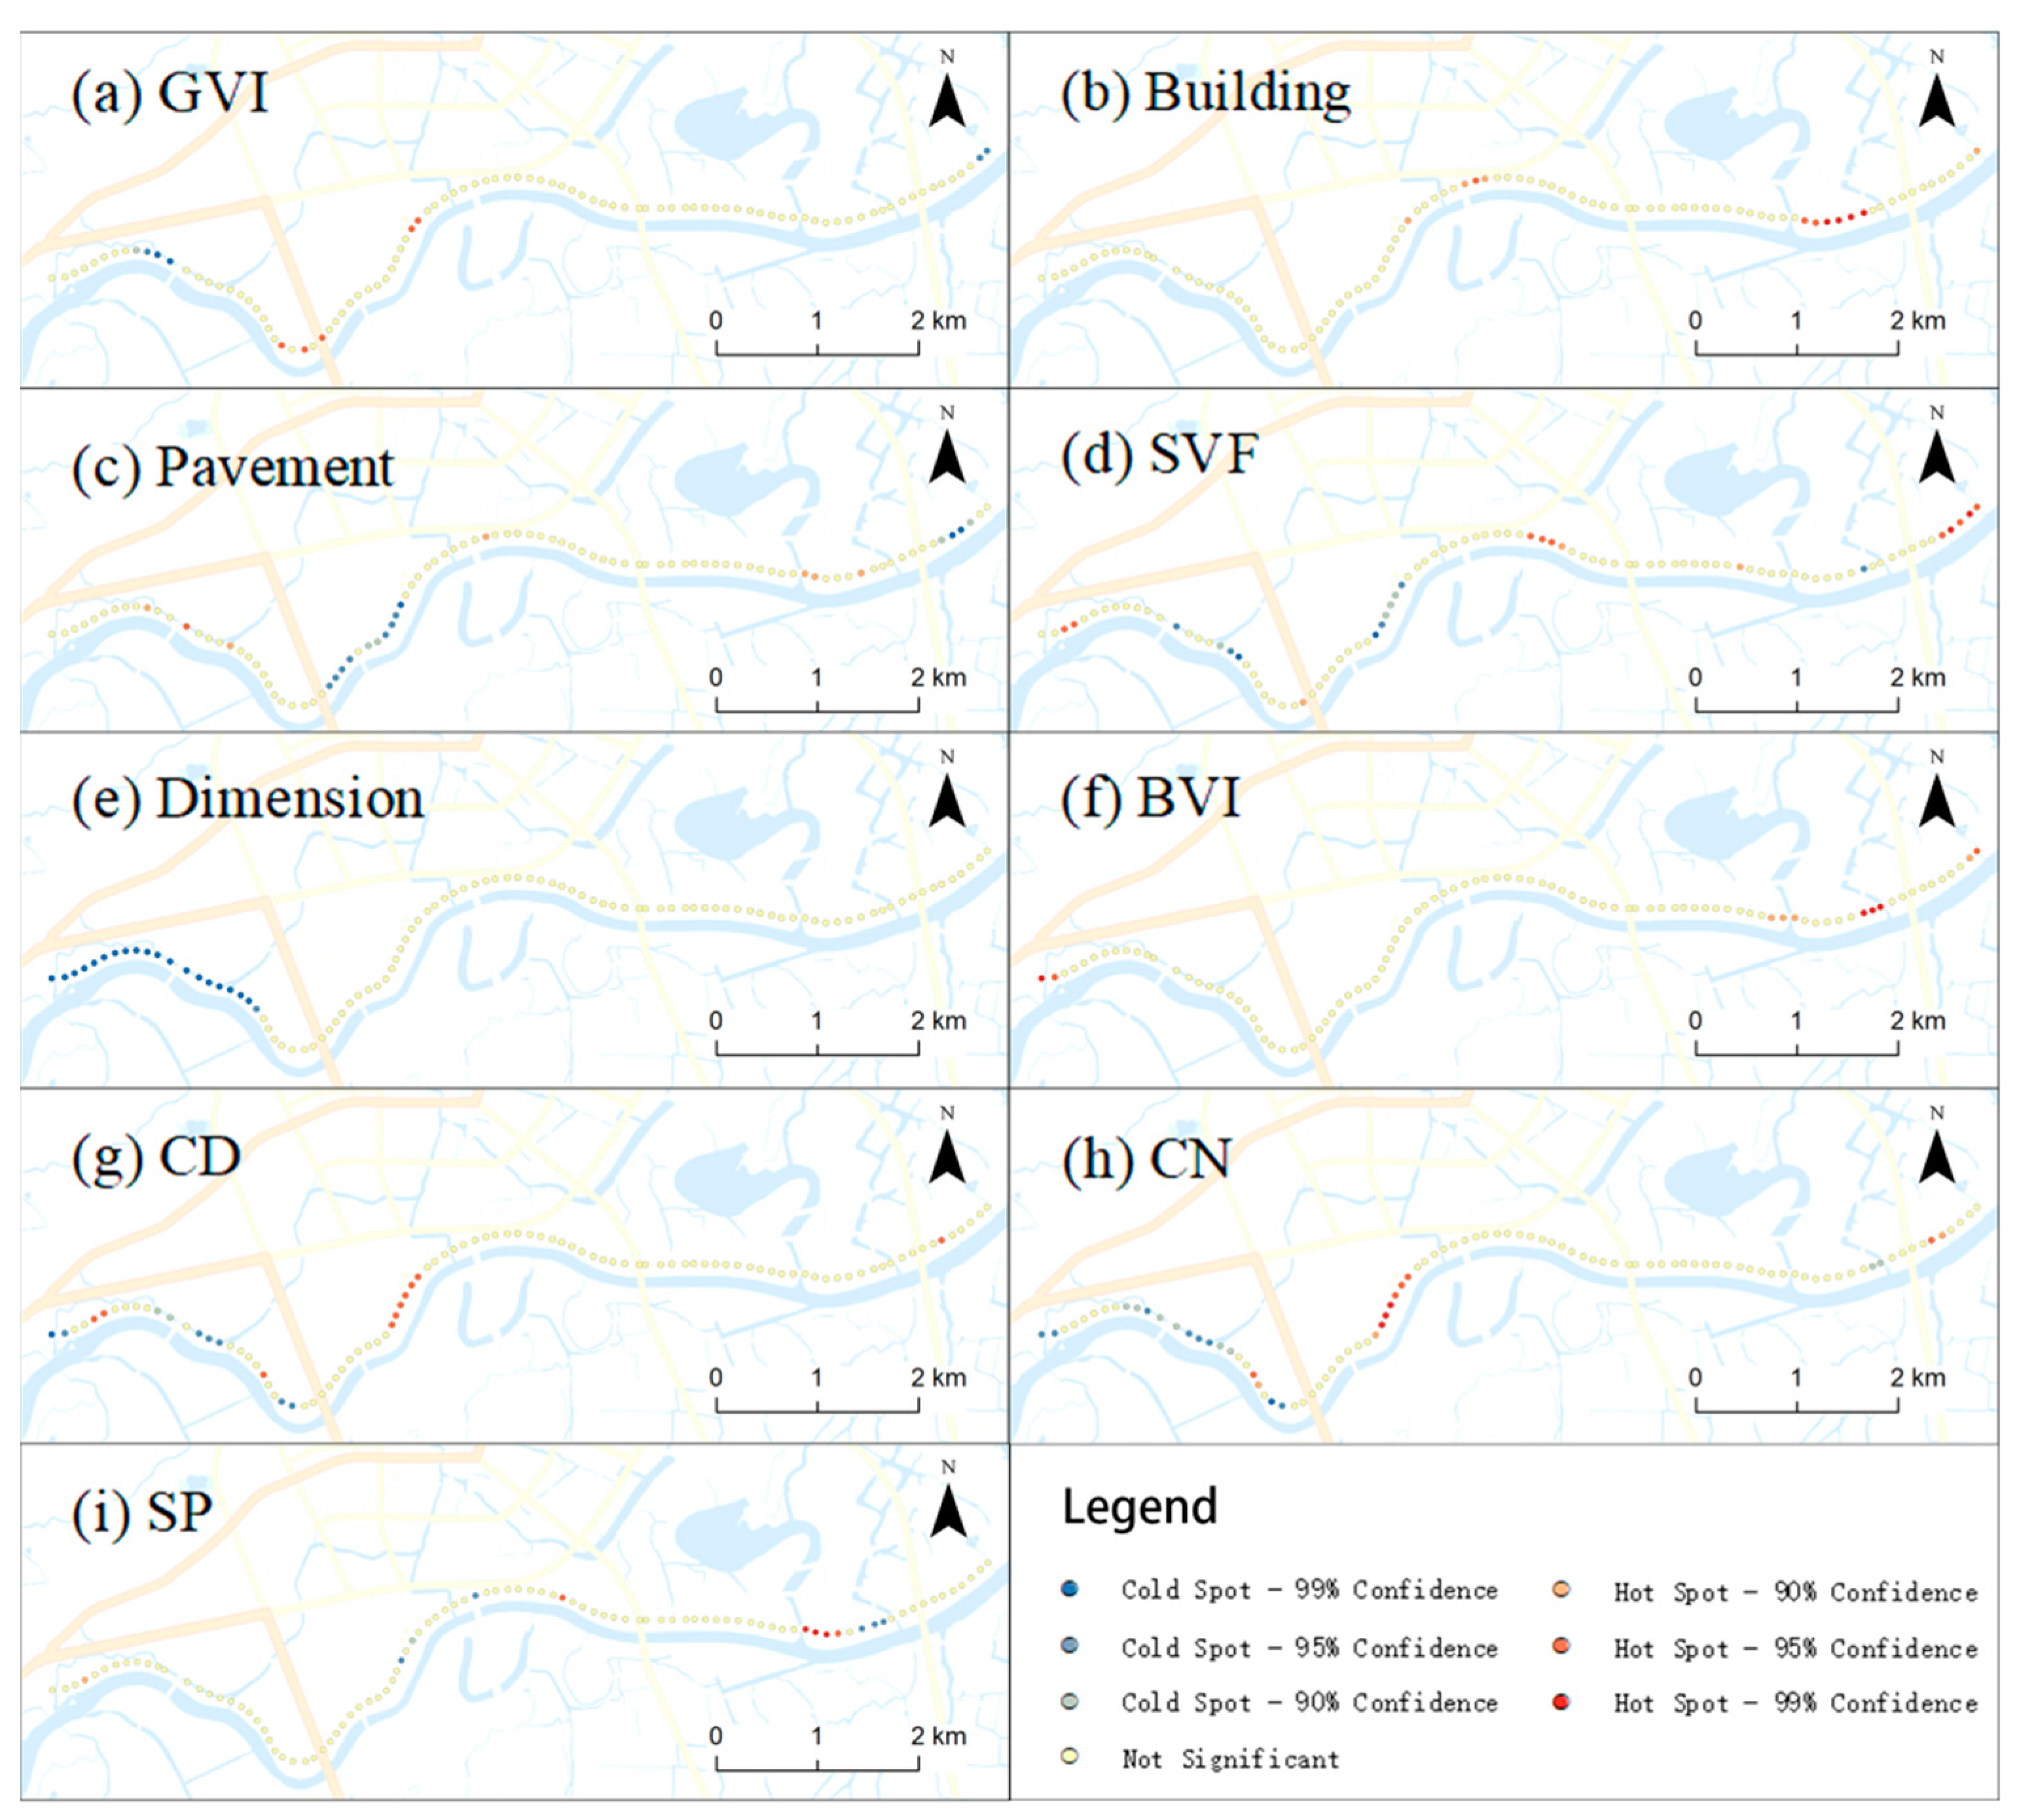
Global Moran’s I revealed that building (Z = 2.36, p = 0.018 < 0.05, Figure 6), pavement (Z = 2.95, p = 0.003 < 0.05), SVF (Z = 3.29, p = 0.001 < 0.05), dimension (Z = 9.25, p = 0.000 < 0.05), color diversity (Z = 4.93, p = 0.000 < 0.05), and color richness (Z = 4.29, p = 0.000 < 0.05) categories are clustered in space. A Getis-Ord Gi* analysis indicates that dimension’s cold spot area is concentrated in the front section of the greenway, while color diversity and color richness’s hot spot area is primarily located in the middle section of the greenway.
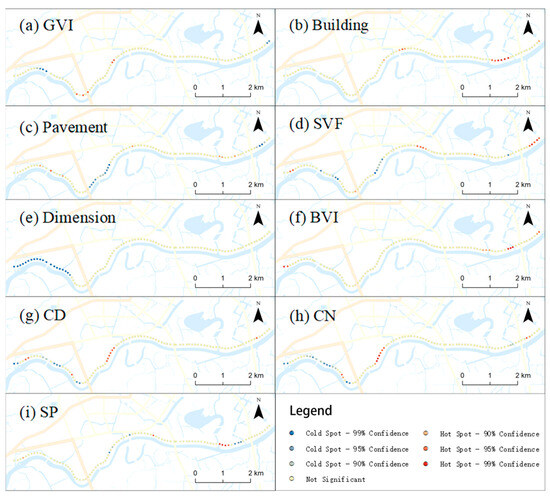
Figure 6.
The hotspot of environmental attributes. (a) GVI: green view index; (b) building; (c) pavement; (d) SVF: sky view factor; (e) dimension: the fractal dimension of skylines; (f) BVI: blue view index; (g) CD: color diversity; (h) CN: color richness; (i) SP: visual preference.
4.4. Factors Affecting Visual Preference
Environmental features exhibit explanatory power concerning visual preference (R2m = 0.13, R2c = 0.13, AIC = 9.959, see Table 6). This suggests that the GVI significantly influences visual preference (p < 0.01), with an explanatory rate of 68.26%.
Table 6.
Hierarchical variance partitioning based on generalized linear mixed models in driving the effect of environmental attributes on visual preference.
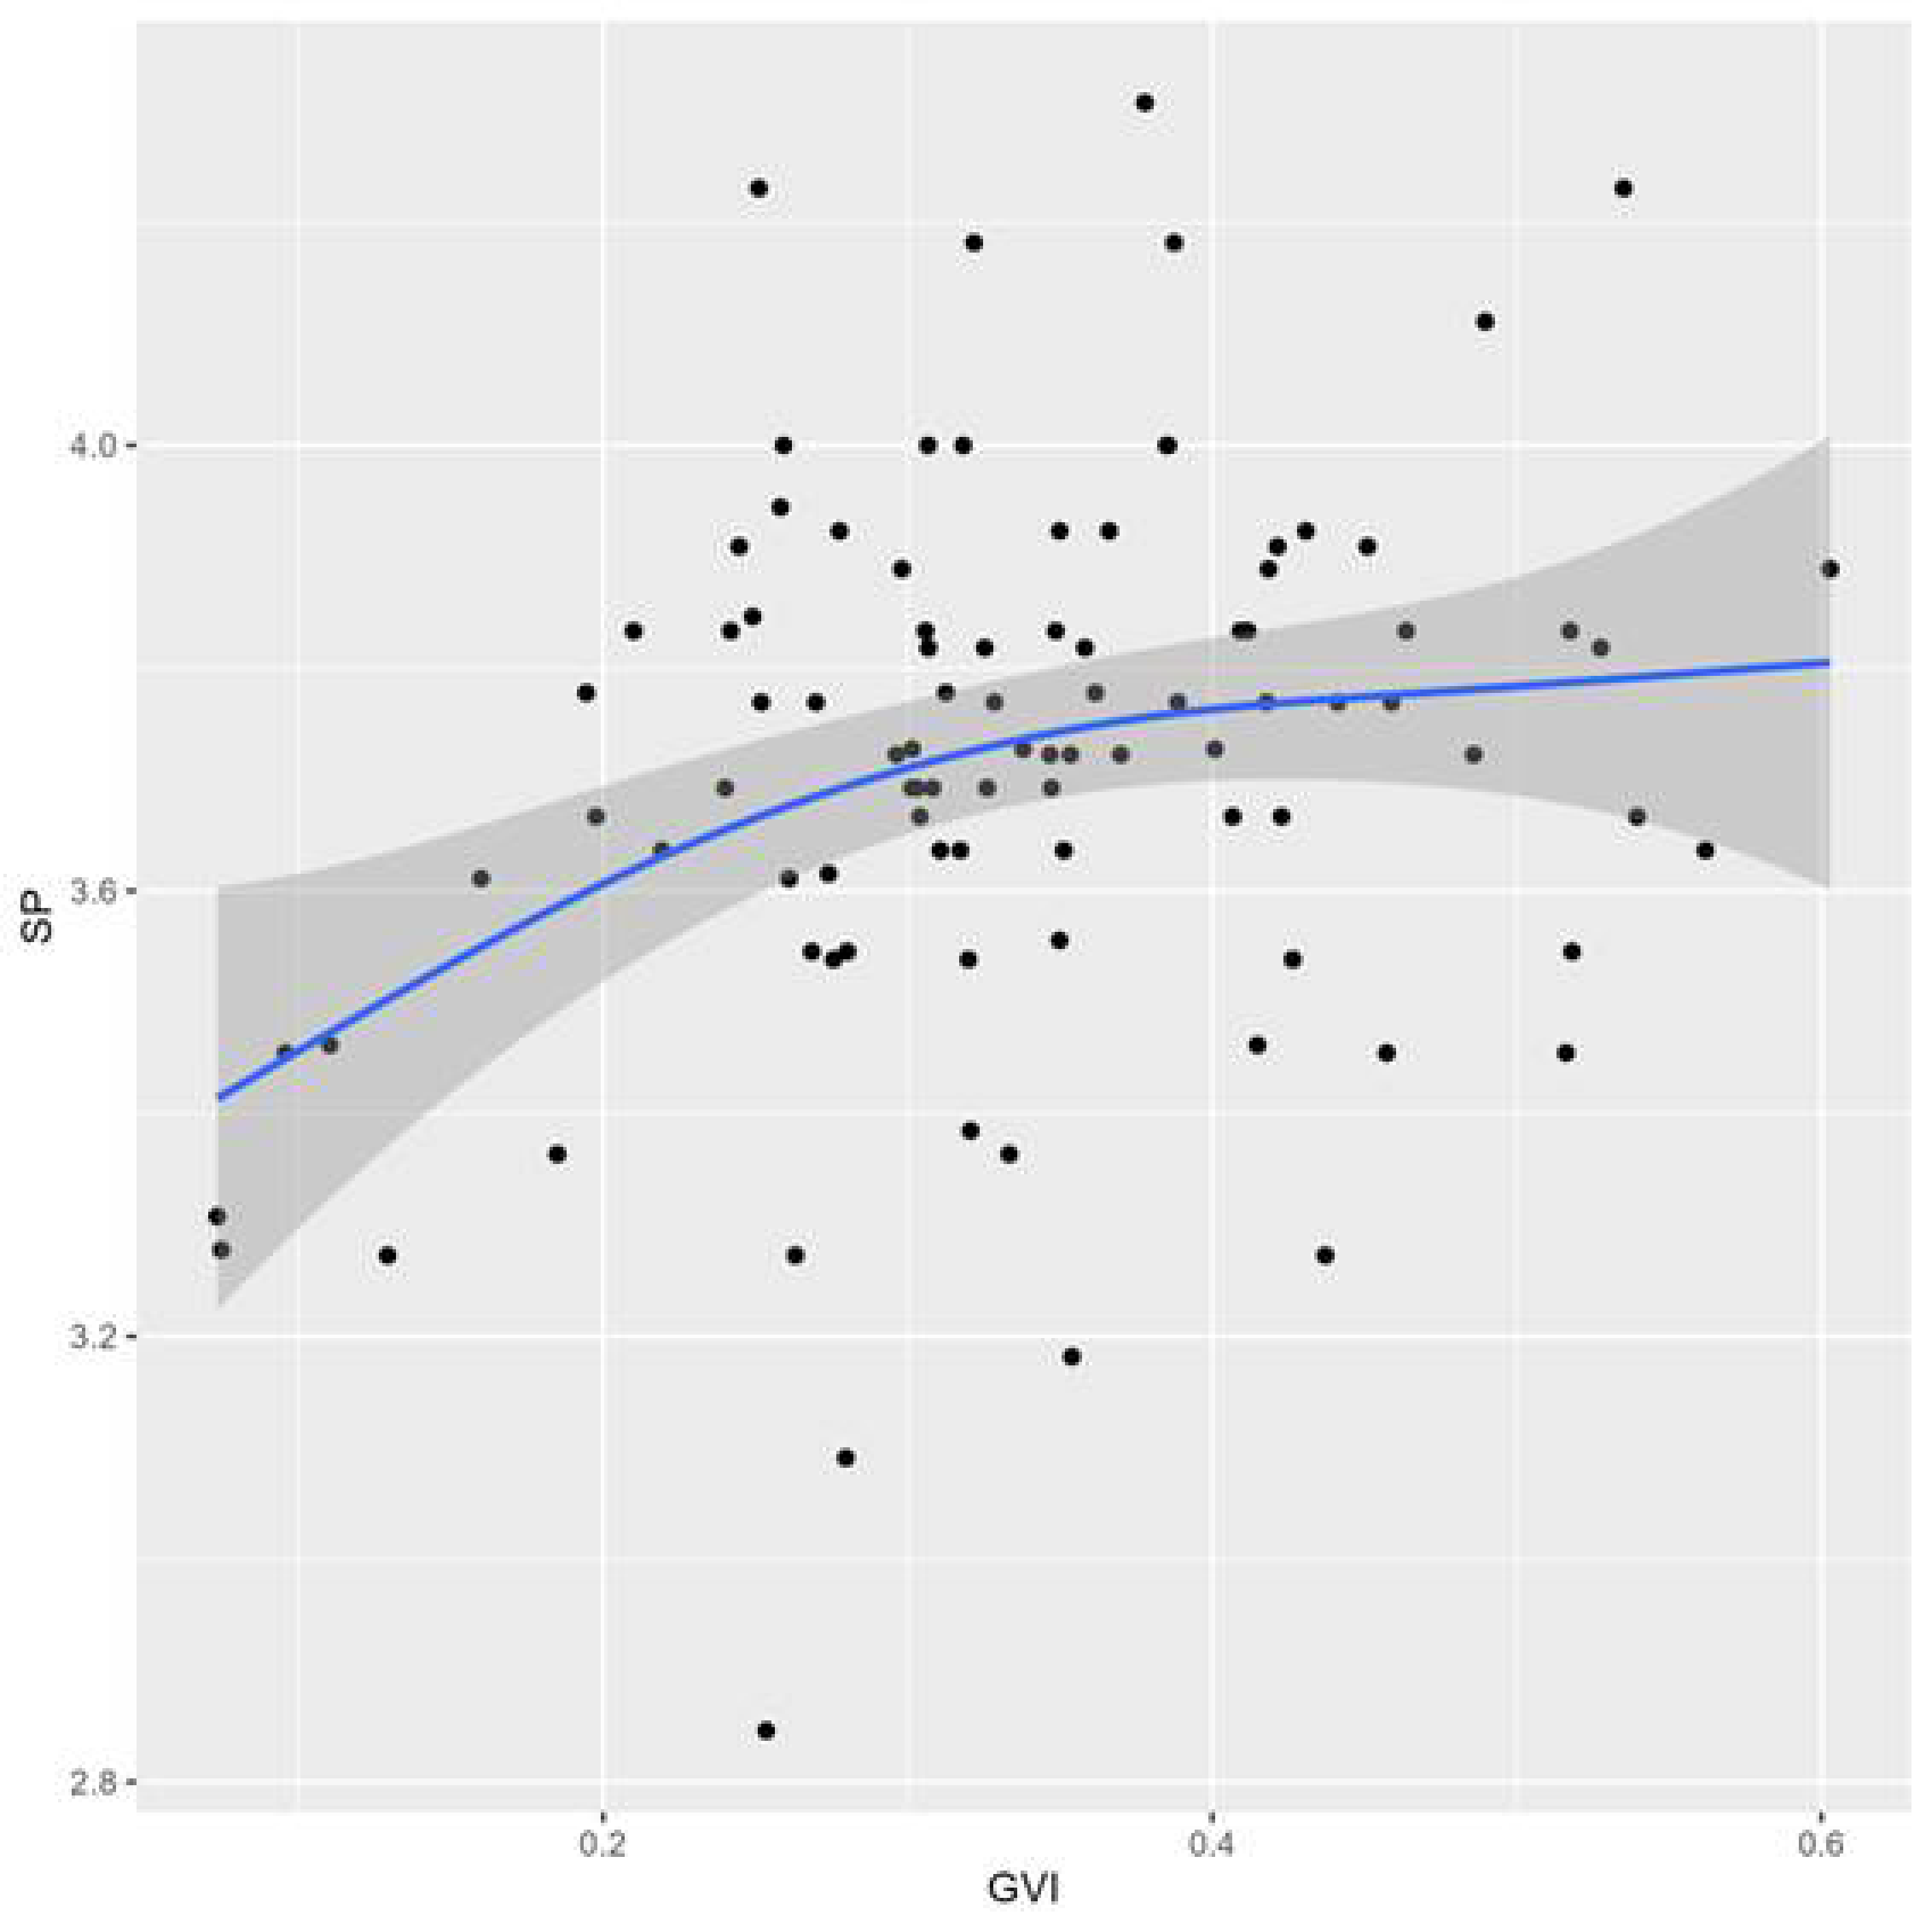
A significant relationship between the GVI and visual preference is established, demonstrating an increasing trend with a rising GVI (F-statistic: 8.612, RMSE = 0.232, R2adj = 0.121, p = 0.004 < 0.01, Figure 7). In the fitted curves, the estimated breakpoint for visual preference is identified at 3.818 ± 0.274 (residual standard error: 0.104, R2adj = 0.061, p = 0.018 < 0.05), while the estimated breakpoint for the GVI is at 0.152 ± 0.006 (residual standard error: 0.012, R2adj = 0.987, p = 0.025 < 0.05).
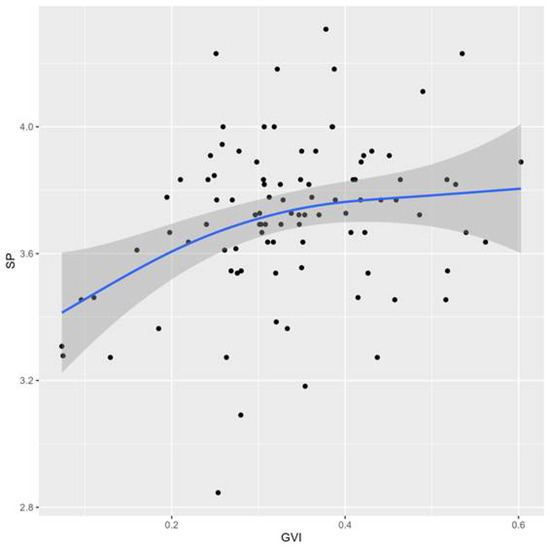
Figure 7.
Scatter plot and Loess line of visual preference and the green view index. GVI: green view index; SP: visual preference; shaded areas over the dashed regression lines represent a 95% confidence interval for the fitted values of each model. The black dots represented sample point. Blue lines and gray shading represent fitted regressions and their bootstrapped 95% confidence intervals.
5. Discussion
5.1. Evaluation of Users’ Experience
The assessments of user experience can be used as an important reference for greenway planning and greenway quality improvement [5], which are also highlighted in the Mulan River research on visual preferences. The framework of evaluation of the users’ experience can provide suggestions for site improvements. The three lowest ratings were seating facilities (C12), sports and fitness equipment (C8), and site leveling (C4). Road damage and cracks on the greenway due to site leveling greatly affected the recreational experience of users in terms of walking and cycling activities on the greenway. Users have specific environmental preferences for natural plant landscapes, fitness, recreational facilities, etc. [8]. The lack of exercise and fitness equipment and seating facilities does not satisfy the users’ needs for fitness, which leads to a lower level of user satisfaction. The three items with the highest ratings were air quality (C2), number of public toilets (C10), and aesthetics of plant landscape (C1), with ratings of 3.73 ± 0.98, 3.59 ± 1.13, and 3.58 ± 1.02, respectively. The number of public toilets was able to satisfy the needs of users. The greenway plant configuration has good color matching and high ornamental value. As the greenway is built along the river, there is no air pollution source (chemical factory, etc.) nearby and the terrain is flat, which can form obvious air convection, promoting the air quality of the Mulan River greenway. The water body plays a certain role in regulating the city’s microclimate, and at the same time, the green corridor helps improve the city’s ventilation corridors, which can help alleviate the city’s heat island effect. User evaluation can reflect the quality of the greenway and provide a reference for greenway management and improvement.
5.2. Influencing Factors of Users’ Experience
There are significant differences in the behavior of different ages and genders in recreation [10]. Gender and age have a significant effect on visitors’ landscape perception [40]. In this study, the insignificant effect of different genders and ages on the overall satisfaction rating may be related to the fact that the greenway has an all-age-friendly design, which encompasses a friendly attitude toward different genders and age groups. The factors influencing the users’ experience of the greenway can help to understand the key points of inquiry that constrain satisfaction scores [6]. In this study, discrete choice modeling, random forest, and geographical detector methods were used to explore the influences of user experience, and the results showed that site leveling, plant landscape aesthetics, and air quality were the main factors in user experience ratings (Table 4 and Table 5, Figure 4). This study is not completely consistent with the results of other studies [21,41]. Due to the different sites, the proportion of buildings in this study is relatively low, resulting in the buildings not having a significant impact on the user experience. All three methods used nonlinear relationships to explore the relationship between overall satisfaction and the indicators of assessment of user experience. The results consistently showed that site leveling, plant landscape aesthetics, and air quality became the main factors of satisfaction evaluation, indicating that the results of this study have a certain degree of stability. There is little difference in the ordering of the influencing factors, which may be caused by the different algorithms.
5.3. Variation in Environmental Attributes
Understanding the spatial distribution of and variation in environmental features is essential for comprehending the dynamics of a given area [42]. The Global Moran’s I index highlights the presence of cold spot areas and hot spot areas in the distribution of environmental features, including building, pavement, SVF, dimension, color diversity, and color richness features (Figure 6). As an old Chinese saying goes, “The scenery changes step by step”, which suggests that environmental features exhibit dynamic variations across the landscape. In this study, SVF, color richness, and color diversity display alternating cold spots and hot spots, indicating a non-uniform spatial distribution of landscape features. The GVI ranges from 0.07 to 0.60, while the BVI ranges from 0 to 0.01. However, the GVI and BVI exhibit no spatial aggregation, which may be attributed to a homogenized landscape. It is important to note that blue and green spaces have positive effects on the physical and mental well-being of individuals [43]. The BVI is low because the greenway is too far away from the waterfront (riverside). The water-friendliness is too weak, neglecting the contribution of blue space to the physical and mental health of the residents, and improving the BVI has become the direction of the greenway’s quality enhancement.
5.4. Influencing Factors of Visual Preference
Exposure to green environments has been linked to visual preference [44]. Humans have evolved an adaptive mechanism over generations wherein the external environment provides visual stimuli that influence human visual behaviors [45]. In our study, we find that the GVI has a significant and highly explanatory effect on visual preference (Table 6), accounting for 68.26% of the variation. Nonetheless, some studies argue that factors beyond blue and green spaces can also influence landscape preferences [46]. The percentage of blue space in this study is too low, resulting in a low impact of blue space on visual preference. Previous research has consistently shown a preference for natural environments and higher green coverage [8]. The results of the present study are consistent with the findings of previous studies [41]. In a greenway characterized by a mix of natural and artificial elements, people are particularly sensitive to the visual attractiveness of green features, driving their landscape preference. Previous studies have reported that a GVI exceeding 41% produces moderate landscape preference [44]. In this study, the GVI can promote visual preference within 60% (Figure 7). High GVI may block sunlight and obstruct views, potentially leading to decreased visual preference [44]. Excessive greening may affect its role in visual preference, resulting in economic waste. Subjective perceptions can vary across different study sites due to cognitive biases among residents of various regions resulting from differences in climate, local economics, and other factors, leading to varying thresholds for visual preference concerning green exposure
6. Conclusions
The user experience of the Mulan River greenway is an important topic in the green development and livelihood construction of the comprehensive management of the Mulan River. Visual preference serves as the bridge between human subjective experiences and objective environmental features. Understanding the factors influencing visual preference is crucial for predicting it and offering valuable guidance for landscape management and design. In this study, we constructed an assessment of the greenway user experience. The site leveling, plant landscape aesthetics, and air quality are the main factors significantly affecting the user experience by three models (p < 0.01). The most significant factor influencing visual preference is the green visibility index. The GVI can promote visual preference within 60%. Seating facilities and sports and fitness equipment need to be added, site leveling is not level enough; further pavement repairs are needed to keep the pavement level. Some limitations in this article do not address the differences in how participants rated their experiences in expert and non-expert personas. The greenway’s green visibility is only up to 0.6, and it is not known if there is a decline or negative impact beyond that. This research would help to improve the user experience and visual preference to a certain extent. This current study lays the groundwork for understanding the mechanisms through which environmental features shape visual preference, offering scientific recommendations for the management and quality improvement for the Mulan River greenway.
Supplementary Materials
The following supporting information can be downloaded at: https://www.mdpi.com/article/10.3390/f15091529/s1, Figure S1: the photo of sample plot; Questionnaire S1: Survey on the visual preference of Mulan River greenway in Putian City.
Author Contributions
Conceptualization, J.Z.; methodology, Y.C.; software, Y.C.; investigation, L.G.; writing—original draft preparation, J.Z.; writing—review and editing, J.Z.; visualization, Y.C.; project administration, J.Z.; funding acquisition, J.Z. and Y.C. All authors have read and agreed to the published version of the manuscript.
Funding
This research was funded by the Putian University Mulan River Comprehensive Management Research Institute Project, grant number ML2022-13; the Startup Fund for Advanced Talents of Putian University, grant number 2021074; the Fujian University Engineering Research Center for Disaster Prevention and Mitigation of Southeast Coastal Engineering Structures, grant number JDGC03; the Fund of Fujian Key Laboratory of Island Monitoring and Ecological Development (Island Research Center, MNR), grant number 2022ZD09; and the Fujian Social Science Foundation Project, grant number FJ2022C072.
Data Availability Statement
Data are contained within the article.
Conflicts of Interest
The authors declare no conflicts of interest.
References
- Keith, S.J.; Boley, B.B. Importance-performance analysis of local resident greenway users: Findings from Three Atlanta BeltLine Neighborhoods. Urban For. Urban Green. 2019, 44, 126426. [Google Scholar] [CrossRef]
- He, H.; Li, J.M.; Lin, X.W.; Yu, Y.W. Greenway Cyclists’ Visual Perception and Landscape Imagery Assessment. Front. Psychol. 2021, 12, 541469. [Google Scholar] [CrossRef] [PubMed]
- Chon, K.S. Understanding recreational traveler’s motivation, attitude and satisfaction. Tour. Rev. 1989, 44, 3–7. [Google Scholar] [CrossRef]
- Andrade, R.; Hondula, D.M.; Larson, K.L.; Lerman, S.B. Landscaping preferences influence neighborhood satisfaction and yard management decisions. Urban For. Urban Green. 2021, 59, 126983. [Google Scholar] [CrossRef]
- Kent, R.L.; Elliott, C.L. Scenic routes linking and protecting natural and cultural landscape features: A greenway skeleton. Landsc. Urban. Plan. 1995, 33, 341–355. [Google Scholar] [CrossRef]
- Gobster, P.H.; Westphal, L.M. The human dimensions of urban greenways: Planning for recreation and related experiences. Landsc. Urban. Plan. 2004, 68, 147–165. [Google Scholar] [CrossRef]
- Zheng, J.; Tarin, M.W.K.; Chen, G.; Zhang, Q.; Deng, C. The characteristics of plant clusters influence on the cooling effect: A case study in a subtropical Island Park, China. Glob. Ecol. Conserv. 2022, 34, e2055. [Google Scholar] [CrossRef]
- Dai, C.; Maruthaveeran, S.; Shahidan, M.F.; Chu, Y. Landscape Preference Evaluation of Old Residential Neighbourhoods: A Case Study in Shi Jiazhuang, Hebei Province, China. Forests 2023, 14, 375. [Google Scholar] [CrossRef]
- Huang, D.; Jiang, B.; Yuan, L. Analyzing the effects of nature exposure on perceived satisfaction with running routes: An activity path-based measure approach. Urban For. Urban Green. 2022, 68, 127480. [Google Scholar] [CrossRef]
- Yang, M.; Wu, R.; Bao, Z.; Yan, H.; Nan, X.; Luo, Y.; Dai, T. Effects of Urban Park Environmental Factors on Landscape Preference Based on Spatiotemporal Distribution Characteristics of Visitors. Forests 2023, 14, 1559. [Google Scholar] [CrossRef]
- Isik, A.I.; Vessel, E.A. From Visual Perception to Aesthetic Appeal: Brain Responses to Aesthetically Appealing Natural Landscape Movies. Front. Hum. Neurosci. 2021, 15, 676032. [Google Scholar] [CrossRef] [PubMed]
- Zheng, J.M.; Chen, X.Y.; Chen, L.G.; He, T.Y.; Rong, J.D.; Lin, Y.; Zheng, Y.S. Comprehensive evaluation of soil quality at different stand densities of Dendrocalamus minor var. amoenus plantations. Appl. Ecol. Environ. Res. 2020, 18, 5985–5996. [Google Scholar] [CrossRef]
- Srdjevic, B.; Lakicevic, M.; Srdjevic, Z. Fuzzy AHP Assessment of Urban Parks Quality and Importance in Novi Sad City, Serbia. Forests 2023, 14, 1227. [Google Scholar] [CrossRef]
- Foltête, J.; Ingensand, J.; Blanc, N. Coupling crowd-sourced imagery and visibility modelling to identify landscape preferences at the panorama level. Landsc. Urban Plan. 2020, 197, 103756. [Google Scholar] [CrossRef]
- Fan, Z.X.; Duan, J.; Lu, Y.; Zou, W.T.; Lan, W.L. A geographical detector study on factors influencing urban park use in Nanjing, China. Urban For. Urban Green. 2021, 59, 126996. [Google Scholar] [CrossRef]
- Zheng, J.; Huang, Y.; Chen, Y.; Guan, L.; Liu, Q. Subjective preference and visual attention to the attributes of ornamental plants in urban green space: An eye-tracking study. Forests 2022, 13, 1871. [Google Scholar] [CrossRef]
- Zheng, J.; Tarin, M.W.K.; Jiang, D.; Li, M.; Ye, J.; Chen, L.; He, T.; Zheng, Y. Which ornamental features of bamboo plants will attract the people most? Urban For. Urban Green. 2021, 61, 127101. [Google Scholar] [CrossRef]
- Ji, X.; Shang, F.; Liu, C.; Kang, Q.; Wang, R.; Dou, C. Prioritizing Environmental Attributes to Enhance Residents’ Satisfaction in Post-Industrial Neighborhoods: An Application of Machine Learning-Augmented Asymmetric Impact-Performance Analysis. Sustainability 2024, 16, 4224. [Google Scholar] [CrossRef]
- Gulcin, D.; Yalcinkaya, N.M. Correlating fluency theory-based visual aesthetic liking of landscape with landscape types and features. Geo-Spat. Inf. Sci. 2024, 27, 237–256. [Google Scholar] [CrossRef]
- Zhang, G.; Yang, J.; Wu, G.; Hu, X. Exploring the interactive influence on landscape preference from multiple visual attributes: Openness, richness, order, and depth. Urban For. Urban Green. 2021, 65, 127363. [Google Scholar] [CrossRef]
- Lee, J.; Lee, H.S.; Jeong, D.; Shafer, C.S.; Chon, J. The Relationship between User Perception and Preference of Greenway Trail Characteristics in Urban Areas. Sustainability 2019, 11, 4438. [Google Scholar] [CrossRef]
- Hofmann, M.; Gerstenberg, T.; Gillner, S. Predicting tree preferences from visible tree characteristics. Eur. J. For. Res. 2017, 136, 421–432. [Google Scholar] [CrossRef]
- Sonti, N.F.; Campbell, L.K.; Svendsen, E.S.; Johnson, M.L.; Novem Auyeung, D.S. Fear and fascination: Use and perceptions of New York City’s forests, wetlands, and landscaped park areas. Urban For. Urban Green. 2020, 49, 1–10. [Google Scholar] [CrossRef]
- Youssoufi, S.; Houot, H.; Vuidel, G.; Pujol, S.; Mauny, F.; Foltête, J. Combining visual and noise characteristics of a neighborhood environment to model residential satisfaction: An application using GIS-based metrics. Landsc. Urban Plan. 2020, 204, 103932. [Google Scholar] [CrossRef]
- Cai, K.Y.; Huang, W.W.; Lin, G.S. Bridging landscape preference and landscape design: A study on the preference and optimal combination of landscape elements based on conjoint analysis. Urban For. Urban Green. 2022, 73, 127615. [Google Scholar] [CrossRef]
- Evensen, K.H.; Hemsett, G.; Nordh, H. Developing a place-sensitive tool for park-safety management experiences from green-space managers and female park users in Oslo. Urban For. Urban Green. 2021, 60, 127057. [Google Scholar] [CrossRef]
- Yang, L.; Chang, H.; Li, J.; Xu, X.; Qiu, Z.; Jiang, X. A Comprehensive Evaluation of the Friendliness of Urban Facilities for the Elderly in Taipei City and New Taipei City. Sustainability 2023, 15, 13821. [Google Scholar] [CrossRef]
- Barnes, M. Planting and maintaining therapeutic gardens. In Therapeutic Landscapes: An Evidence-Based Approach to Designing Healing Gardens and Restorative Outdoor Spaces; Marcus, C.C., Sachs, N.A., Eds.; John Willey & Sons: Hoboken, NJ, USA, 2014; pp. 261–287. [Google Scholar]
- Mulan River Comprehensive Treatment Research Institute of Putian University. An Introduction to Comprehensive Management of Mulan River; People Daily Press: Beijing, China, 2023. [Google Scholar]
- Türker, H.B.; Kalkan, M.; Ortaç, G. Reimagining resilience: The transformative role of urban green areas in Türkiye’s disaster preparedness. Int. J. Disaster Risk Reduct. 2024, 106, 104397. [Google Scholar] [CrossRef]
- Zhu, C.; Ji, P.; Li, S. Effects of urban green belts on the air temperature, humidity and air quality. J. Environ. Eng. Landsc. 2017, 25, 39–55. [Google Scholar] [CrossRef]
- Jansson, M.; Fors, H.; Lindgren, T.; Wiström, B. Perceived personal safety in relation to urban woodland vegetation—A review. Urban For. Urban Green. 2013, 12, 127–133. [Google Scholar] [CrossRef]
- Wang, H.; Ye, J.; Tarin, M.W.K.; Liu, Y.; Zheng, Y. Tourists’ Safety Perception Clues in the Urban Forest Environment: Visual Quality, Facility Completeness, Accessibility—A Case Study of Urban Forests in Fuzhou, China. Int. J. Environ. Res. Public Health 2022, 19, 1293. [Google Scholar] [CrossRef] [PubMed]
- Joshi, A.; Kale, S.; Chandel, S.; Pal, D.K. Likert Scale: Explored and Explained. Br. J. Appl. Sci. Technol. 2015, 4, 396–403. [Google Scholar] [CrossRef]
- Yao, Y.; Liang, Z.; Yuan, Z.; Liu, P.; Bie, Y.; Zhang, J.; Wang, R.; Wang, J.; Guan, Q. A human-machine adversarial scoring framework for urban perception assessment using street-view images. Int. J. Geogr. Inf. Sci. 2019, 33, 2363–2384. [Google Scholar] [CrossRef]
- Lai, J.S.; Zou, Y.; Zhang, S.; Zhang, X.G.; Mao, L.F. glmm.hp: An R package for computing individual effect of predictors in generalized linear mixed models. J. Plant Ecol. 2022, 15, 1302–1307. [Google Scholar] [CrossRef]
- Hair, J.F.; Black, W.C.; Babin, B.J.; Anderson, R.E. Multivariate Data Analysis, 7th ed.; Pearson Prentice Hall: Old Bridge, NJ, USA, 2010. [Google Scholar]
- Wang, J.F.; Li, X.H.; Christakos, G.; Liao, Y.L.; Zhang, T.; Gu, X.; Zheng, X.Y. Geographical detectors-based health risk assessment and its application in the neural tube defects study of the Heshun region, China. Int. J. Geogr. Inf. Sci. 2010, 1, 107–127. [Google Scholar] [CrossRef]
- Wang, J.; Zhang, T.; Fu, B. A measure of spatial stratified heterogeneity. Ecol. Indic. 2016, 67, 250–256. [Google Scholar] [CrossRef]
- Liu, Q.; Luo, S.; Shen, Y.; Zhu, Z.; Yao, X.; Li, Q.; Tarin, M.W.K.; Zheng, J.; Zhuo, Z. Relationships between students’ demographic characteristics, perceived naturalness and patterns of use associated with campus green space, and self-rated restoration and health. Urban For. Urban Green. 2022, 68, 127474. [Google Scholar] [CrossRef]
- Li, X.; Wang, X.R.; Jiang, X.; Han, J.Y.; Wang, Z.Y.; Wu, D.Z.; Lin, Q.; Li, L.; Zhang, S.Y.; Dong, Y. Prediction of riverside greenway landscape aesthetic quality of urban canalized rivers using environmental modeling. J. Clean. Prod. 2022, 367, 133066. [Google Scholar] [CrossRef]
- Yang, W.; Fan, B.; Tan, J.; Lin, J.; Shao, T. The Spatial Perception and Spatial Feature of Rural Cultural Landscape in the Context of Rural Tourism. Sustainability 2022, 14, 4370. [Google Scholar] [CrossRef]
- Pouso, S.; Borja, A.; Fleming, L.E.; Gomez-Baggethun, E.; White, M.P.; Uyarra, M.C. Contact with blue-green spaces during the COVID-19 pandemic lockdown beneficial for mental health. Sci. Total Environ. 2021, 756, 143984. [Google Scholar] [CrossRef]
- Jiang, B.; Larsen, L.; Deal, B.; Sullivan, W.C. A dose–response curve describing the relationship between tree cover density and landscape preference. Landsc. Urban Plan. 2015, 139, 16–25. [Google Scholar] [CrossRef]
- Goller, J.; Mitrovic, A.; Leder, H. Effects of liking on visual attention in faces and paintings. Acta Psychol. 2019, 197, 115–123. [Google Scholar] [CrossRef] [PubMed]
- Li, H.; Browning, M.; Rigolon, A.; Larson, L.R.; Taff, D.; Labib, S.M.; Benfield, J.; Yuan, S.; McAnirlin, O.; Hatami, N.; et al. Beyond “bluespace” and “greenspace”: A narrative review of possible health benefits from exposure to other natural landscapes. Sci. Total Environ. 2023, 856, 159292. [Google Scholar] [CrossRef] [PubMed]
Disclaimer/Publisher’s Note: The statements, opinions and data contained in all publications are solely those of the individual author(s) and contributor(s) and not of MDPI and/or the editor(s). MDPI and/or the editor(s) disclaim responsibility for any injury to people or property resulting from any ideas, methods, instructions or products referred to in the content. |
© 2024 by the authors. Licensee MDPI, Basel, Switzerland. This article is an open access article distributed under the terms and conditions of the Creative Commons Attribution (CC BY) license (https://creativecommons.org/licenses/by/4.0/).