Article

The Future Possible Distribution of Kasnak Oak (Quercus vulcanica Boiss. & Heldr. ex Kotschy) in Anatolia under Climate Change Scenarios

1
Faculty of Forestry, Department of Landscape Architecture, Çankırı Karatekin University, Çankırı 18200, Türkiye
2
TEMSUS Research Group, Catholic University of Ávila, 05005 Ávila, Spain
3
Faculty of Agriculture, Department of Landscape Architecture, Aydın Adnan Menderes University, Aydın 09100, Türkiye
4
Department of Forest Engineering, Faculty of Forestry, Çankırı Karatekin University, Çankırı 18200, Türkiye
5
Department of Environment and Agroforestry, Faculty of Sciences and Arts, Catholic University of Ávila, 05005 Ávila, Spain
6
Department of Silviculture, Faculty of Forestry, Kastamonu University, Kastamonu 37150, Türkiye
7
Department of Earth and Life Sciences, Faculty of Sciences II, Lebanese University, Fanar 90656, Lebanon
8
Department of Wildlife, Institute of Natural and Applied Sciences, Çankırı Karatekin University, Çankırı 18200, Türkiye
9
Aegean Agricultural Research Institute, Republic of Türkiye Ministry of Agriculture and Forestry, Izmir 35040, Türkiye
10
Section of Zoology, Department of Biology, Faculty of Science, Ege University, Izmir 35040, Türkiye
11
Natural History Application and Research Centre, Ege University, Izmir 35040, Türkiye
*
Author to whom correspondence should be addressed.
Forests 2024, 15(9), 1551; https://doi.org/10.3390/f15091551
Submission received: 30 July 2024 / Revised: 21 August 2024 / Accepted: 30 August 2024 / Published: 3 September 2024
(This article belongs to the Special Issue Biodiversity in Forests: Management, Monitoring for Conservation)

Abstract

:
The deterioration of natural habitats for oak species has steadily occurred as a consequence of both climate change and human pressure. Therefore, detailed and reliable information about the geographic distribution of oak species under changing climate conditions is needed for diverse ecological and conservation practices. This study examined the habitat suitability of endemic Kasnak oak, Quercus vulcanica Boiss. & Heldr. ex Kotschy, an endemic that ranges across the Central Anatolia Region and surrounding mountains in Türkiye. The occurrence data were gathered through fieldwork, and new records were identified. Next, we applied ecological niche modeling to assess the past, present-day, and future potential geographic range of the species in Anatolia. Projections for the Last Glacial Maximum indicate that most of the suitable areas for Kasnak oak were in southern Anatolia. However, present-day estimates suggest projections estimate suitable habitats in northern Anatolia and around the Anatolian Diagonal. According to future projections, the distribution of the species seems to decrease by 2100, with habitat suitability reduction ranging from 3.27% to 7.88%. Projections suggest a decrease in habitat suitability for the species, particularly in the western and southern Türkiye in the future. Moreover, the projections indicated that suitable habitats for the northern range of the species would likely persist until 2100, although they would diminish towards the northeast. The results can be effectively applied to enhance biodiversity conservation planning and management, leading to the development of innovative strategies.

1. Introduction

The responses of species to global climate change are widely recognized as one of the primary ecological determinants shaping the fundamental attributes of plant communities and their distribution ranges [1,2]. Understanding the direction and magnitude of species responses is essential for conservation strategies and sustainability efforts [3,4]. Climate change induces alterations in the spatial distribution of species, impacting their bioclimatic requirements under typical conditions [5,6,7]. These alterations are primarily associated with increasing temperatures and decreasing precipitation during their developmental period [8]. A mere 1 °C shift in temperature may provoke the displacement of ecological zones on Earth by approximately 160 km, while a projected 4 °C temperature rise over the upcoming century might initiate the need for a 500 km northward migration (or 500 m higher in altitude) for species in the northern hemisphere [9].
Many research findings on the effects of climate change on different species indicate that rising global temperatures will cause species to move towards higher latitudes and altitudes [10,11]. Furthermore, it is expected that the geographic ranges of species will undergo expansions, shifts, or reductions [12]. While certain studies indicate that some species may enhance their resilience to environmental pressures in the future [13,14] other research anticipates significant habitat losses that could negatively impact biodiversity [15,16]. Furthermore, rapid climatic changes have been documented to stress remaining species, possibly leading to extinctions [14,17]. Temperature and precipitation play essential roles in shaping the species composition within forest biomes and the future of terrestrial ecosystems, impacting the survival, distribution, and various attributes of plant species [18,19]. Based on Emberger’s method [20], maximum and minimum temperatures (Tmax and Tmin) are also critical, and it is also important to take into account precipitation patterns and seasonal distribution [21,22].
Given the profound impact of climate-related variables on species composition and ecosystem dynamics, ecological niche modeling (ENM) becomes invaluable for predicting species distribution across varying climatic conditions over time or phenomenon occurrences as a result of climatic anomalies [9,23]. The use of ENM enables the forecasting of species distribution by analyzing occurrence data and environmental variables under various climate conditions of the past, present, and future. Numerous studies have projected future climate-induced alterations in the habitats of ecologically significant plant species [24,25,26,27], while there have been several studies dedicated to oak species around the world over the last two decades. For instance, Vessella et al. [28] highlighted that despite the significant climate fluctuations since the Last Glacial Maximum, the potential distribution area of cork oak (Quercus suber L.) underwent limited range changes, underscoring its close link with the western Mediterranean Basin. Suicmez and Avci [29] focused on the potential geographic distributions of Quercus ilex L. (holm oak) and found that the southern regions of the Mediterranean Basin, particularly its coastal areas, acted as enduring refuges for Q. ilex. Yilmaz et al. [30] validated the distribution of holm oak on its eastern edge, showcasing its high linkage to the Mediterranean biome and its relative coastal distribution. Nonetheless, a few studies investigated the distribution of species beyond the edges of the Mediterranean Biome, especially if those species are relatively distant from the Mediterranean Sea [22]. Quercus vulcanica Boiss. & Heldr. ex Kotschy, endemic to Türkiye and mainly found in inner Anatolia, is particularly interesting due to its position on the interface among the Mediterranean, the Euro–Siberian, and the Irano–Turanian floristic regions. Furthermore, Q. vulcanica is part of an ancient group of closely related white oaks that are geographically isolated on the mountain ranges of Anatolia and regions farther south. This geographical isolation makes these narrowly distributed species particularly vulnerable to climate change [31].
Using ENM, another study examined the glacial refugia hypothesis using the widespread tree species pedunculate oak (Quercus robur L.) [32]. The findings of this study suggest that the glacial refugia hypothesis, primarily based on the expansion-contraction model, is applicable to Q. robur. Moreover, it identified potential refugia beyond the Mediterranean, particularly in northern, western, and southern France. This study further supports the idea that European biogeography is more complex than previously assumed. Ramírez-Preciado et al. [33] modeled the ecological niche of six oaks in the Baja California Peninsula (Q. agrifolia Née, Q. cedrosensis C.H.Müll., Q. chrysolepis Liebm., Q. devia Goldman, Q. palmeri Engelm., and Q. peninsularis Trel.). Their findings suggest that climate warming is expected to alter the distribution of suitable habitats for these oak species, with significant variations observed among the different species. Predictions indicate a decline in suitable habitat for five of the six species. Saran et al. [34] confirm the significance of this aspect in the current distribution of brown oak (Quercus semecarpifolia) habitats in the Kumaun Himalaya, in conjunction with the acknowledged impact of altitude. In the projected climate change scenario, the future habitats of oak have been monitored under a temperature rise of +1 °C and +2 °C, alongside a 20 mm increase in precipitation. The findings indicate that with an anticipated temperature increase of +1 °C and +2 °C, the current habitat of brown oak distribution could decrease by 40% and 76%, respectively. When we understand that the predicted impacts of climate variability can lead to an expected decrease in potential habitats by 84% to 99% in the case of banj oak (Quercus leucotrichophora A. Camus) [35], then the investigation of the predicted distribution of those refugia or relict species with restricted distribution is significant. This is particularly important for species found in inner Anatolia, where a noticeable shift in the temperature pattern towards milder and warmer conditions is expected [36]. Recent research on climate classification shows an anticipated escalation in arid expanses within the Central Anatolian territory in forthcoming years [37,38]. Projections indicate an expansion of semi-arid steppe regions within the depression zones of the lower altitudes of Central Anatolia during the period 2041–2060, followed by a subsequent contraction between 2061 and 2080 [37]. The rapid pace of global climate change may pose challenges to the adaptation of tree species. Therefore, predicting future distribution areas of tree species is essential for guiding forest management, planning, and monitoring, and for describing habitat and ecosystem dynamics. We visited and verified the occurrence of the species in Central Anatolia between 2022 and 2023 and found some inconsistent records in its known distribution. Our aim was to observe the impact of the verified data on the future predictions of the species. Here, we focused on the future distribution of the endemic Kasnak oak (Quercus vulcanica Boiss. & Heldr. ex Kotschy), which is distributed in the Central Anatolia Region and surrounding mountainous areas, in response to the impacts of climate change. We also predicted the distribution of the species in the paleoclimatic projections (Last Glacial Maximum, ca. 21 ka) and evaluated its compatibility with its present-day distribution. In this study, we applied ecological niche modeling (ENM) approaches using three different future greenhouse gas emission scenarios (Shared Socioeconomic Pathways) projected by five General Circulation Models (GCMs) to predict conditions up to the year 2100 and seven LGM datasets to predict its paleoclimatic distribution. Our aim was to forecast the expected changes in the distribution of Q. vulcanica throughout Anatolia, Türkiye, up to the year 2100.

2. Methods

2.1. Study Area and Occurrence Data

Quercus vulcanica, one of the 17 oak species that form natural forests in Türkiye, is the only endemic oak species there [39]. It is distributed between 1200–2200 m in Western and Central Anatolia in Ankara, Kütahya, Konya, Afyon, Isparta, Eskişehir, Kayseri, and Afyonkarahisar [40,41,42,43,44]. We hypothesize that the area chosen for this study represents the species’ past, present, and future distributional range, with no identified alternative area conducive to the species’ expansion [45]. For this reason, the study area was determined to encompass the entire Anatolia, forming a polygon within the coordinates of 35.6–42.2° N and 24.9–44.8° E (Figure 1). The species is currently restricted to mostly central Anatolia. However, we used the entire Türkiye as the study area to better understand its past and future distribution patterns across the country.
A literature review [39] was conducted to determine the distribution of the species [40,41,43,44,46,47,48,49,50,51,52,53,54,55,56,57,58]. Then, the geographical distribution of Q. vulcanica in Central Anatolia was assessed from March 2022 to April 2023. We gathered the occurrence data through fieldwork and identified new records absent from the existing literature (Figure 1). Furthermore, we investigated how the species contributes to the formation of forest structures. In this way, we aimed to analyze the modeling results more accurately. Within the study area, a representative sample plot was established for every 100 hectares to study the structure of relict forests. Additionally, transect sampling was conducted within the forest. For areas outside the designated study area, we established a sample plot for every 100 m of elevation, starting from the lowest elevation where Q. vulcanica is found. Out of approximately 1200 sample plots, the species was present in 116 plots. Each occurrence record represents the presence of the species within a specific quadrat of 400 m2, not individual trees. This approach accounts for the 40 occurrence locations shown in Figure 1, as several occurrences were recorded within each location. The spatial information of the species was collected with a Garmin GPS with an accuracy of 5 m, using a quadrat sampling method (20 m). In this study, we included new records of the species in three distinct areas (ten occurrence records), potentially influencing the modeling outcomes. These locations are Dinek Mountain (Kırıkkale), Eldivan Mountain (Çankırı), and Aydos Mountain (Ankara). The species was identified by Dr. Gamze Tuttu, an academic member of the chair of Botanic, the Department of Forest Engineering, Çankırı Karatekin University, and the Faculty of Forestry. The specimens are preserved with G.3119-G.3120-G.3121 numbers in the Botany Laboratory of the Faculty of Forestry. The presence of Kasnak oak on Küre Mountain [54] and Ilgaz Mountain [40] was not confirmed in our fieldwork. Although many studies [40,41,54,59] referred to the location of the Amanos Mountains, we could not confirm it in the first literature. Therefore, we excluded these three records.
We georeferenced all obtained records and mapped them using ArcGIS (v10.7, ESRI, Redlands, CA, USA). To minimize potential sampling bias and ensure a consistent sampling effort [60,61,62,63], we randomly selected a single point for each grid cell within a 1 km radius buffer surrounding each occurrence record, employing spThin v0.2.0 [64] within the R environment. This means that for each occurrence, a buffer area was created, and then a single point within that buffer was randomly selected to represent that occurrence in the model. The aim of this process was to reduce spatial autocorrelation and sampling bias rather than to subdivide the buffer area into multiple cells or to artificially multiply the number of records. Consequently, the total number of records was reduced from 116 to 68.

2.2. Environmental Data

Table 1 presents detailed climate ranges that were prepared using WorldClim vers. 2.1 (https://www.worldclim.org/data/index.html [accessed on 23 September 2023], Fick and Hijmans [65]), CHELSA-BIOCLIM+ (https://chelsa-climate.org/bioclim/ [accessed on 24 September 2023] [66,67,68]), and EarthEnv (https://www.earthenv.org/, [accessed on 24 September 2023] [69]) To model the present-day distribution, we initially employed 19 recent historical bioclimatic data layers and four topographic variables as predictive features. The bioclimatic variables were sourced from the CHELSA-BIOCLIM+ database [66,67,68] with a spatial resolution of 30 arc-s (approximately 1 km). These data were generated by averaging monthly temperature and precipitation values from 1981 to 2010, including annual trends, seasonality, and extreme or limiting environmental factors such as extreme temperature and precipitation, seasonality, and long-term climatic trends [67]. CHELSA operates on monthly means, utilizing a quasi-mechanistic statistical downscaling approach based on the ERA-interim global circulation model with a GPCC bias correction [66]. In addition, we incorporated four topographic variables (slope, roughness, terrain roughness index, and topographic position index) at a spatial resolution of 30 arc-s (~1 km). These variables were obtained from the digital elevation model products of the global 250 m GMTED2010 and near-global 90 m SRTM4.1dem datasets, available at https://www.earthenv.org/ (accessed on 29 September 2023) [69].
We evaluated the multicollinearity among all bioclimatic variables (Appendix A, Table A1 and Table A2) by calculating the variance inflation factor (VIF), employing the usdm package [70]. To address the potential multicollinearity, a VIF threshold of 10 and a correlation threshold of 0.75 were applied, as suggested by Guisan et al. [71]. Q. vulcanica inhabits areas with wet, mild winters and hot, dry summers. Adequate winter rainfall is crucial for its survival through dry periods, with the species preferring moderate to warm temperatures typical of its native habitat [55]. Employing a stepwise procedure, we narrowed the selection to eight variables, concentrating on those closely aligned with the ecological requirements of the species. Four variables (BIO8, BIO9, BIO18, and BIO19) in which certain spatial artifacts have been found in previous studies [72,73] were excluded from the modeling. The chosen variables included annual mean temperature (BIO1), isothermality (BIO3), temperature seasonality (BIO4), precipitation amount of the wettest month (BIO13), precipitation amount of the driest month (BIO14), precipitation seasonality (BIO15), slope (slope), and topographic position index (tpi).
To project paleoclimate conditions, we acquired Last Glacial Maximum (21 ka, LGM) datasets from the CHELSA paleoclimate database [67] (https://chelsa-climate.org/last-glacial-maximum-climate/). We utilized seven datasets (CCSM4, CNRM-CM5, FGOALS-g2, IPSL-CM5A-LR, MIROC-ESM, MRI-CGCM3, MPI-ESM-P), which are derived from an implementation of the CHELSA algorithm on PMIP3 data [67].
For the future habitat suitability predictions of the Kasnak oak, we employed five distinct global circulation models: GFDLESM 4.1 [74], UKESM1.0-LL [75], MPI-ESM1-2-HR [76], IPSLCM6A-LR [77], and MRI-ESM2.0 [78]. These models were applied across three shared socioeconomic pathways (SSPs): optimistic (SSP126), middle-of-the-road (SSP370), and pessimistic (SSP585), representing the uncertainty in climate model projections [79]. The bioclimatic variables were obtained from the 6th Climate Model Intercomparison Project (https://chelsa-climate.org/cmip6/), encompassing three consecutive 30-year periods: 2011–2040, 2041–2070, and 2071–2100.

2.3. Ecological Niche Modeling

We utilized the Maxent algorithm (ver. 3.4.1) [80,81,82] to model habitat suitability and assess the environmental suitability, recent historical, paleoclimatic, and future potential geographical distribution of the Kasnak oak across its entire range. The jackknife (leave-one-out) method was implemented to handle the challenge posed by relatively small datasets [83] with 10.000 background points. For optimizing model complexity, balancing goodness-of-fit and predictive ability, and computing maximum entropy models, we employed the R package ENMeval v2.0.0 [84,85]. Our modeling involved building 120 individual models, varying regularization multiplier values from 0.5 to 10 (in increments of 0.5), and employing six different feature class combinations (L, LQ, H, LQH, LQHP, LQHPT), where L = linear, Q = quadratic, H = hinge, P = product, and T = threshold. The evaluation of model accuracy was based on four metrics in ENMeval [84,85]: (1) the area under the curve (AUC) of the receiver operating characteristic plot for test localities (AUCTEST; [86,87]; (2) the difference between training and testing AUC (AUCDIFF; [88]; (3) OR10 (10% training omission rate) for test localities [87,89]; and (4) the Akaike Information Criterion (AICc) corrected for small sample sizes [88,90]. Additionally, we followed a sequential method leveraging cross-validation results, selecting models with the lowest average test omission rate and, in cases of ties, the models with the highest average validation AUC [91,92].
To assess the models, we adhered to the null model concept [93]. Similar to the empirical model, as recommended by Bohl et al. [94], we evaluated it using the same withheld occurrence data. Null ENMs were executed with 100 iterations, employing the methodology proposed by Bohl et al. [94] and extended by Kass et al. [84]. The performance of the empirical model was visualized against the null model mean using ENMeval [84]. For further analysis, we applied the 10-percentile training presence logistic threshold approach, as suggested by [95]. This transformation converted the complementary log-log regression (cloglog) output into a continuous map representing the presence-absence distribution. Subsequently, we used the raster package in R [96] to calculate potential habitat size. The cloglog output, signifying habitat suitability, ranged from 0 (unsuitable) to 1 (suitable). The outcomes were imported and visualized using rasterVis [97] in conjunction with ArcGIS v10.7.

3. Results

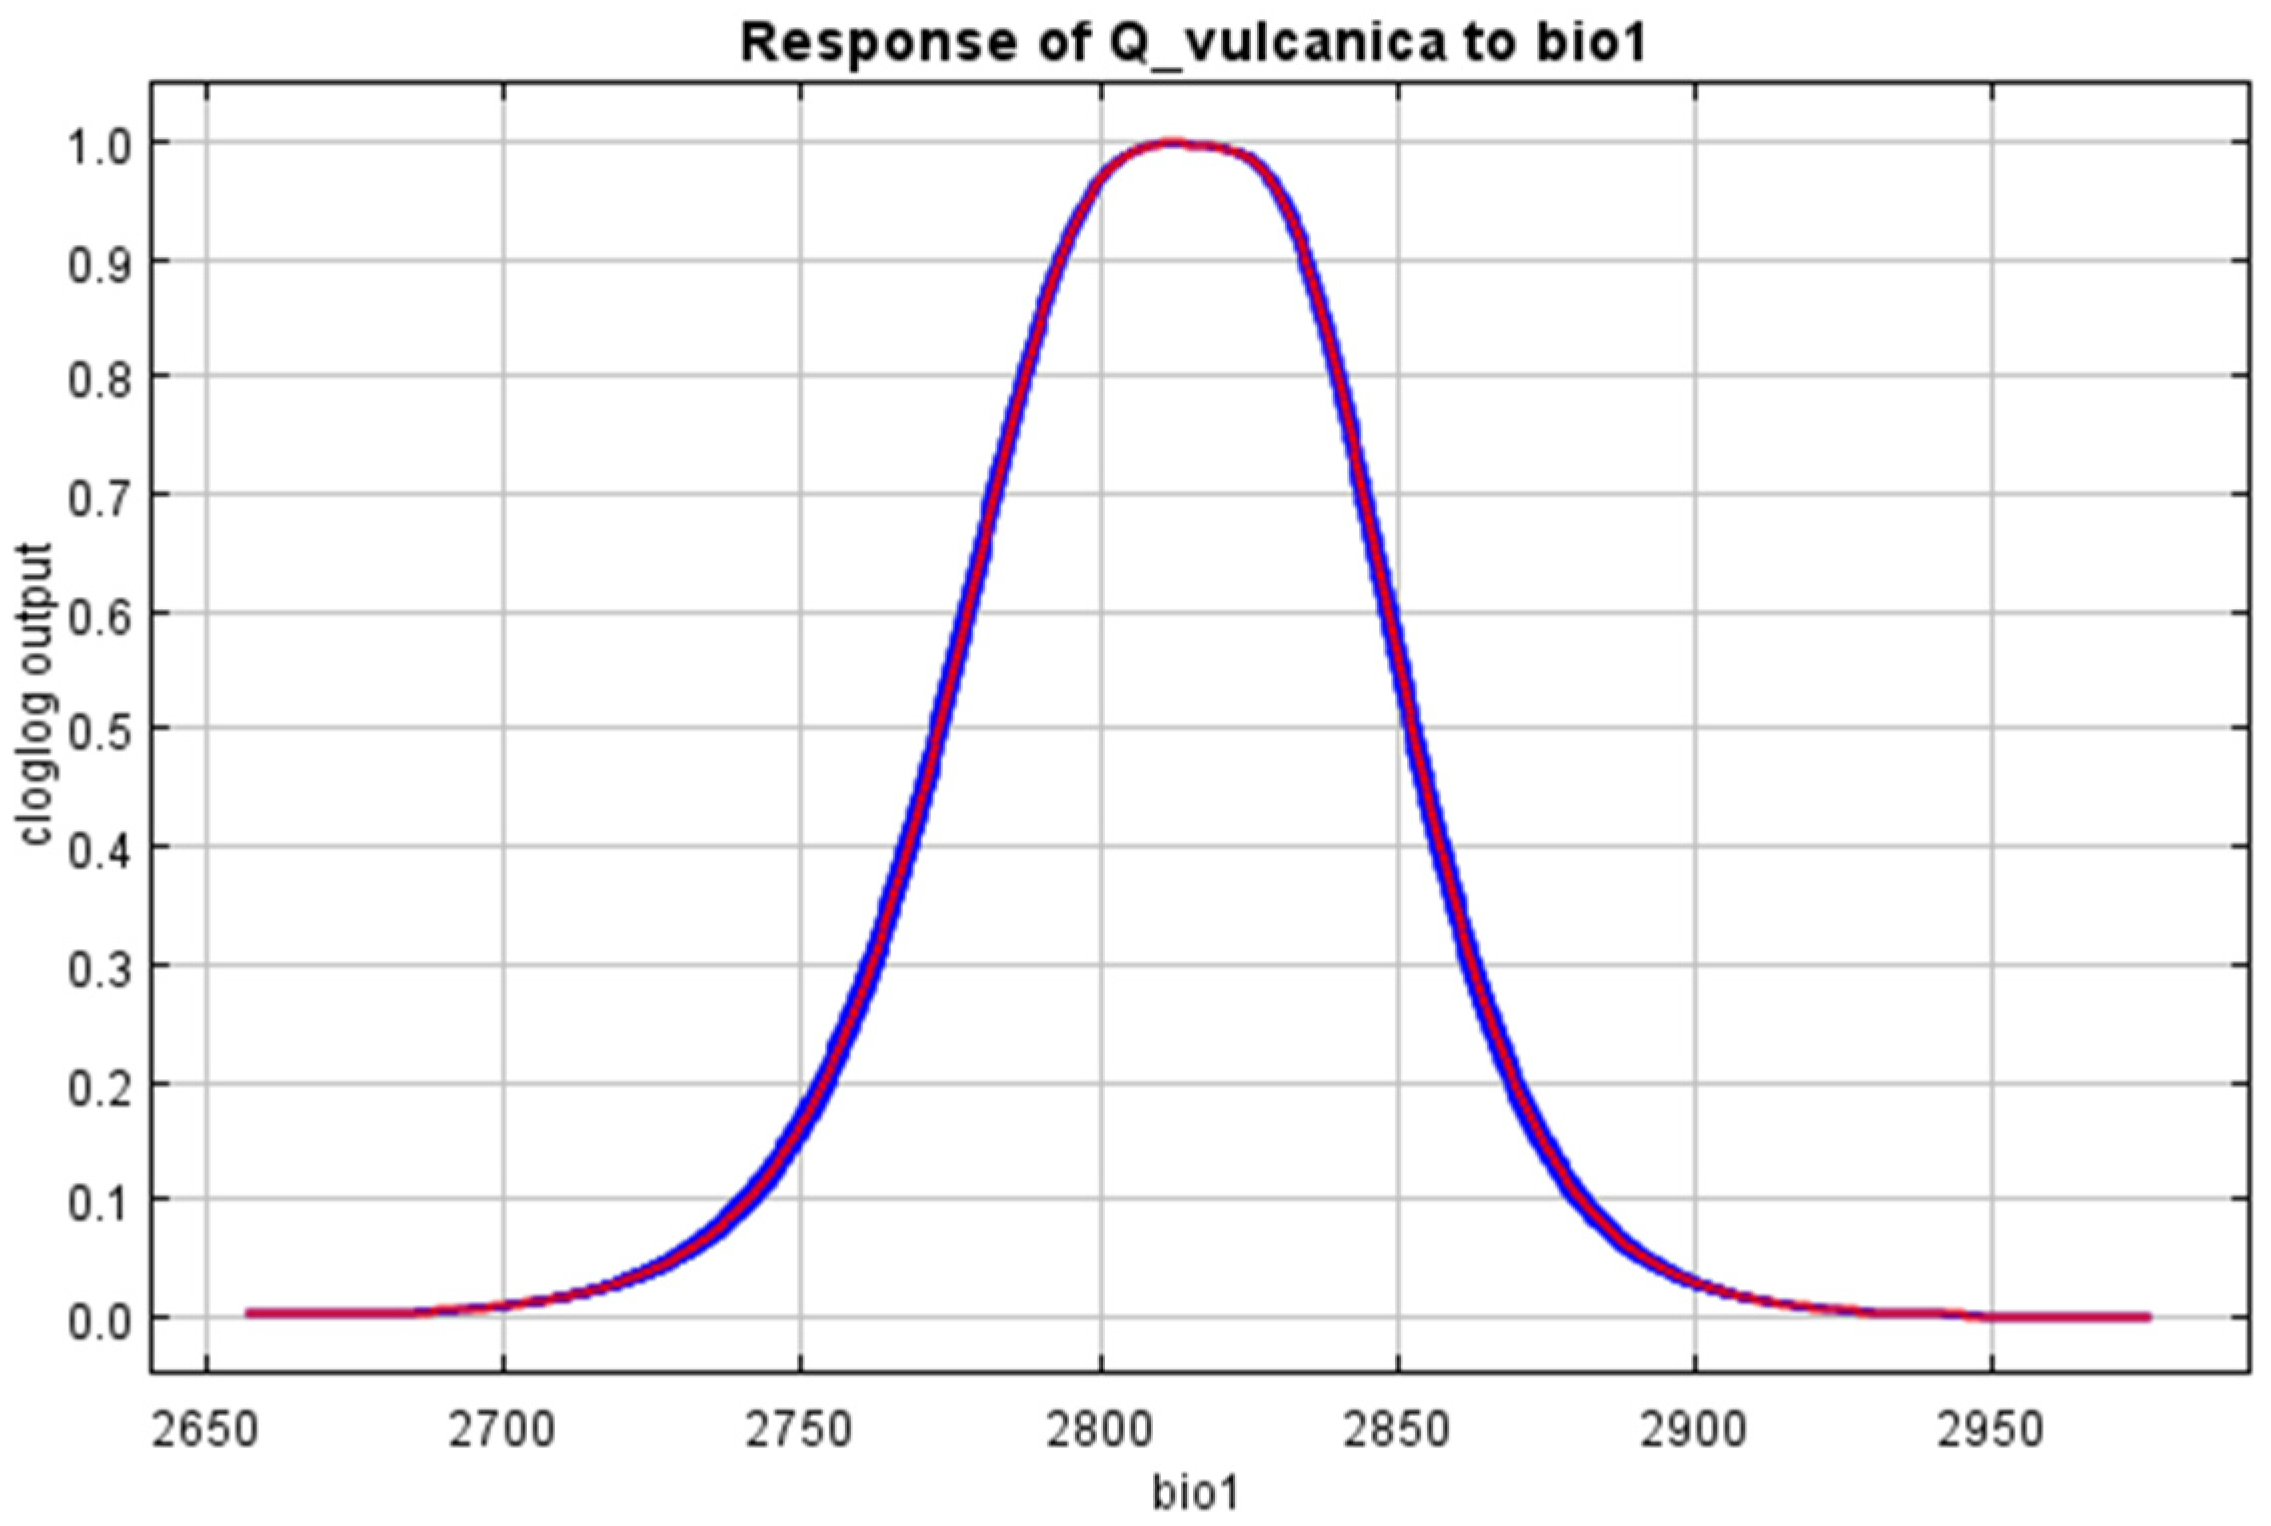
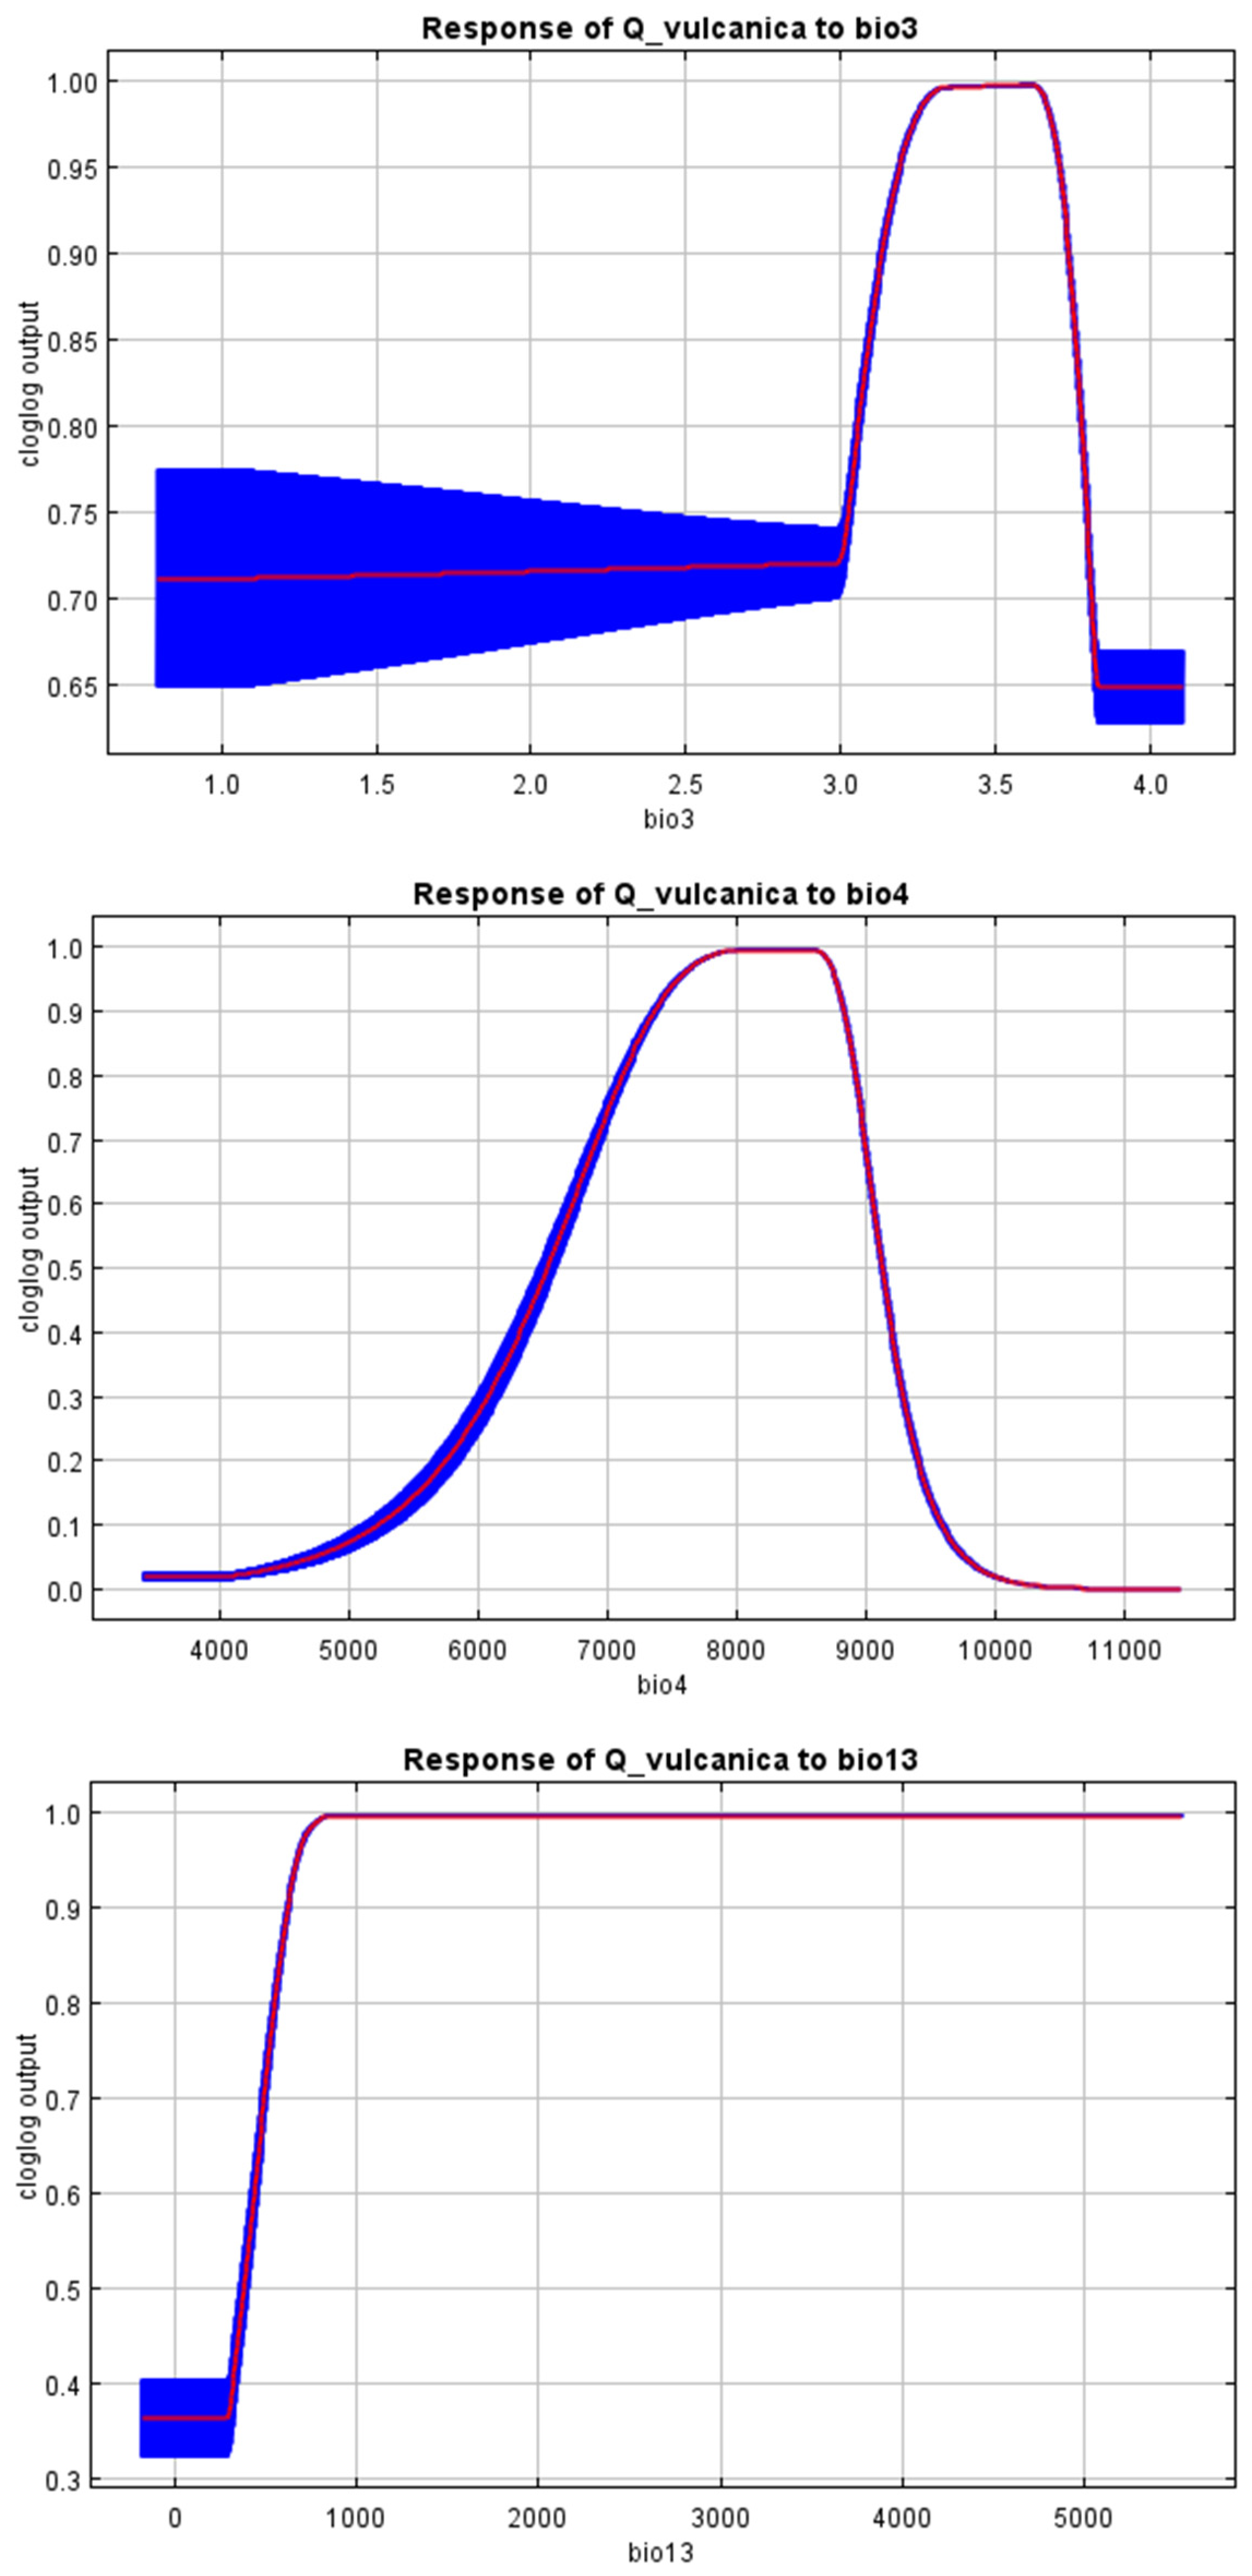
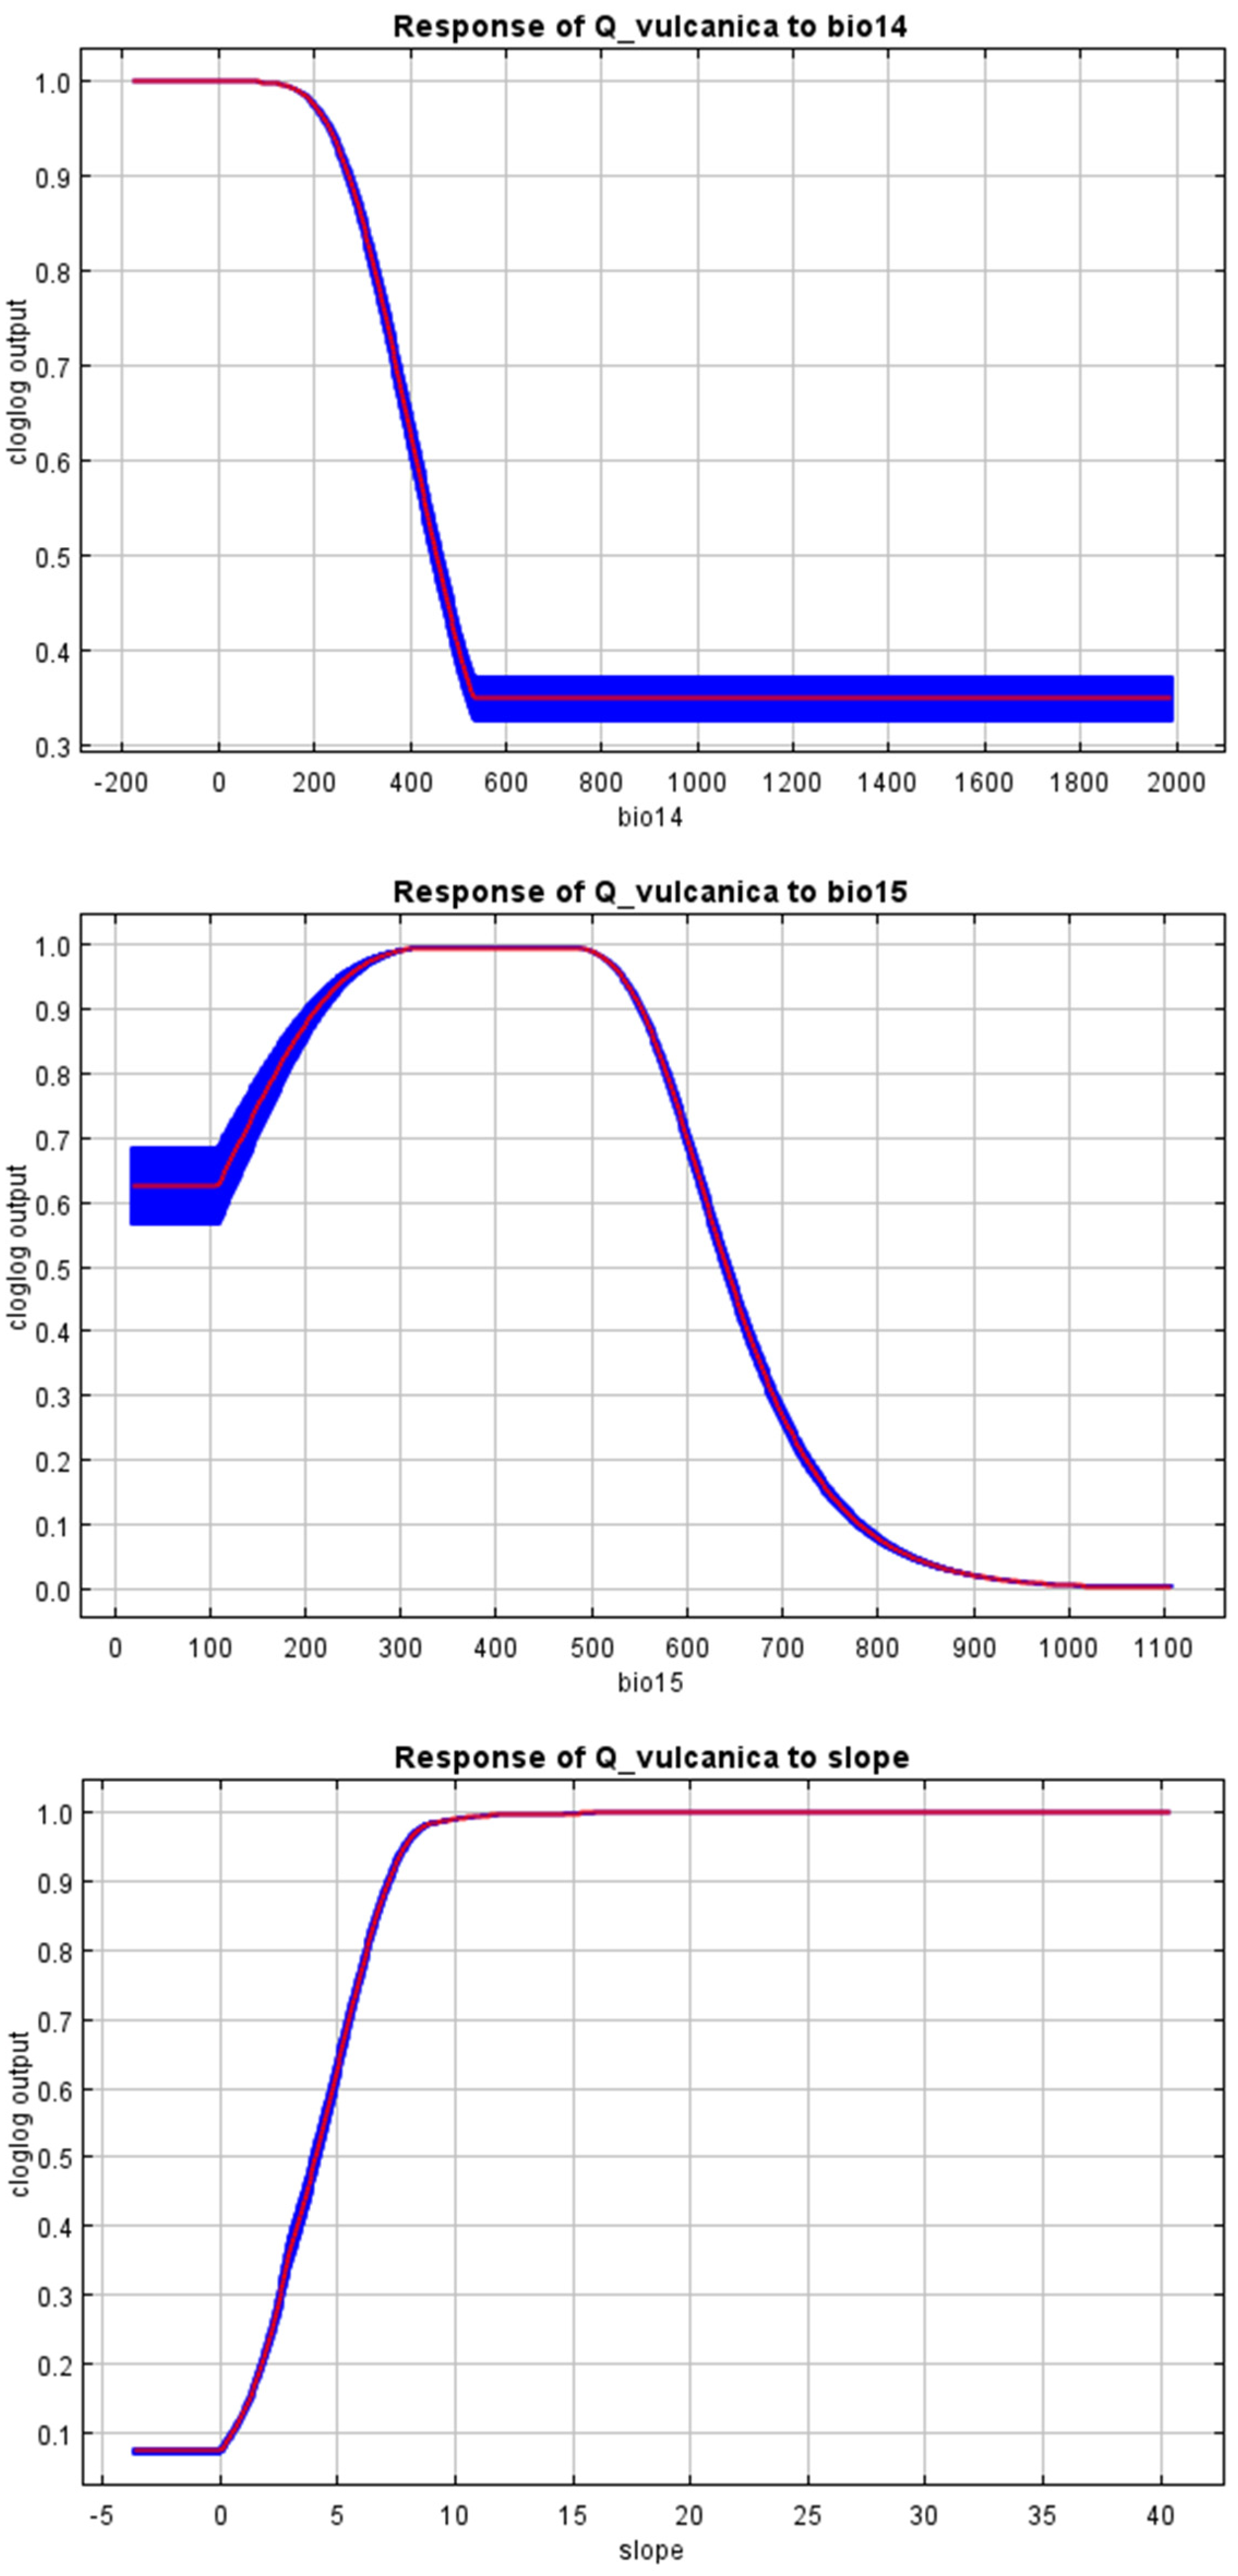
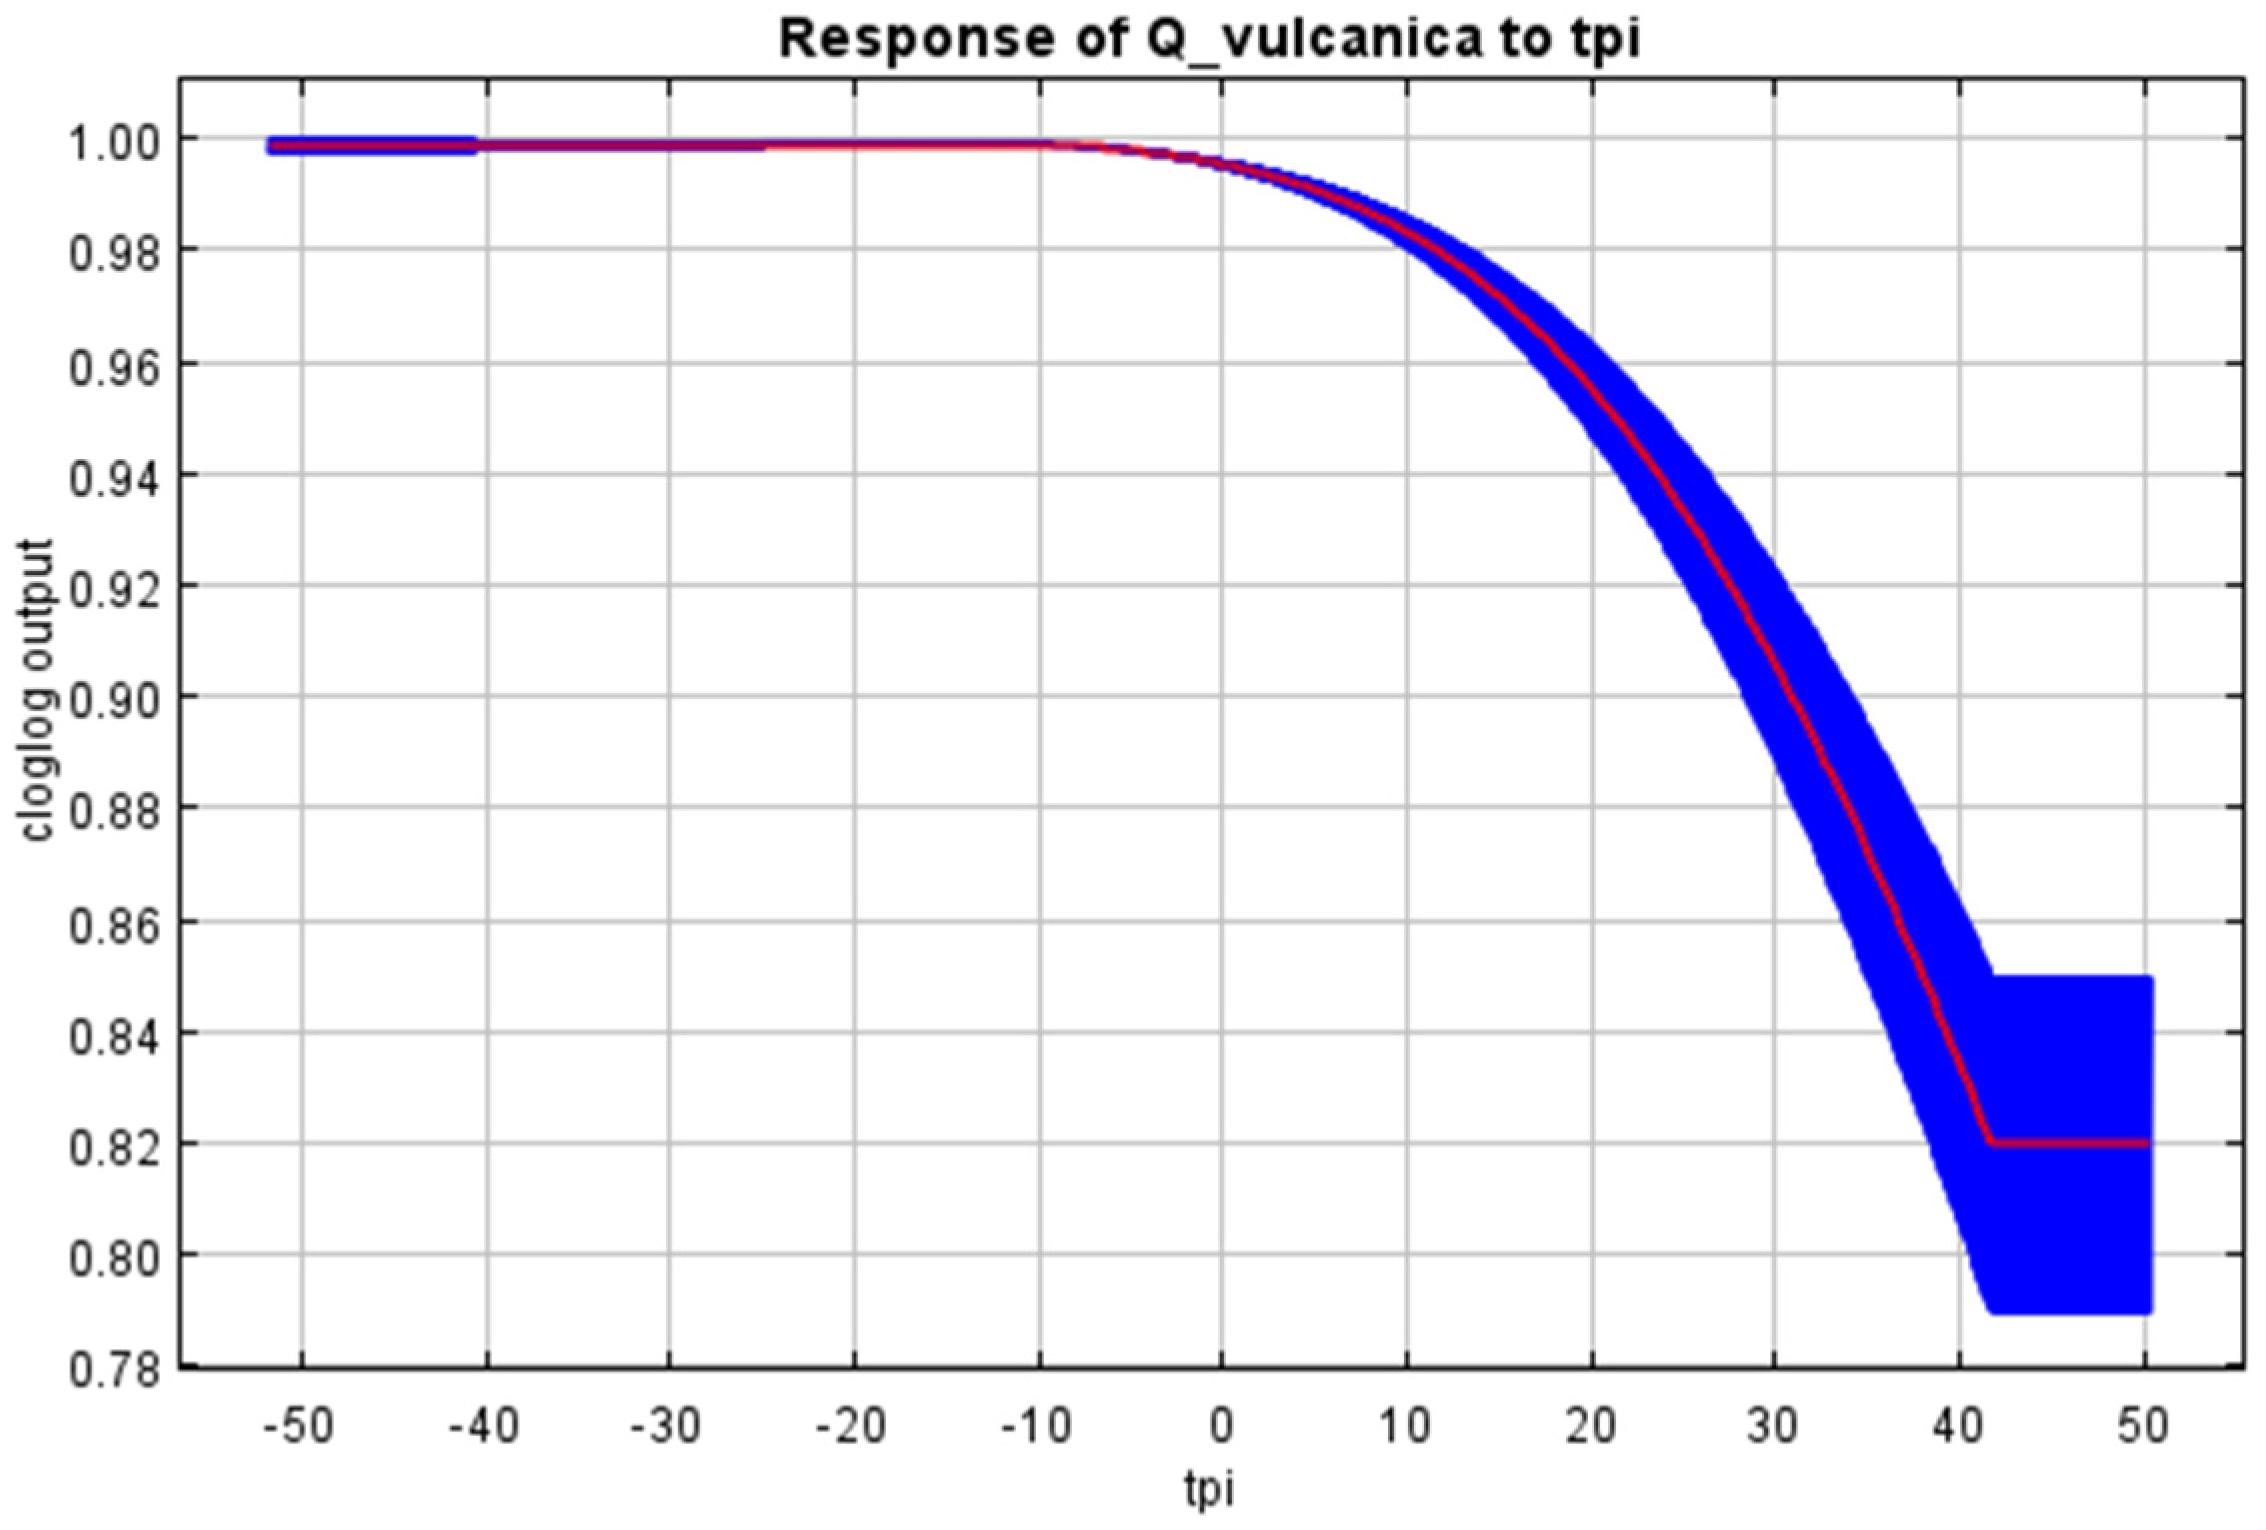
The best model for the Kasnak oak was selected based on its statistical performance and its low level of complexity using four evaluation metrics and null models (Appendix A, Table A3). The 10-percentile training presence logistic threshold was 0.268. Furthermore, the best model involved the hinge feature with a regularization parameter of 1 and a high average area under the curve for the training data (AUC = 0.975). Response curves are presented in Appendix A, Figure A1. The selected environmental variables were annual mean temperature (bio1, 37.5%), slope (slope, 19.4%), temperature seasonality (bio4, 17.8%), precipitation seasonality (bio15, 14.5%), precipitation amount of the driest month (bio14, 4.6%), precipitation amount of the wettest month (bio13, 3.5%), isothermality (bio3, 2.2%), and topographic position index (tpi, 0.4%). The relative contribution of the environmental variables to the model was highest for the annual mean temperature, slope, temperature seasonality, and precipitation seasonality.
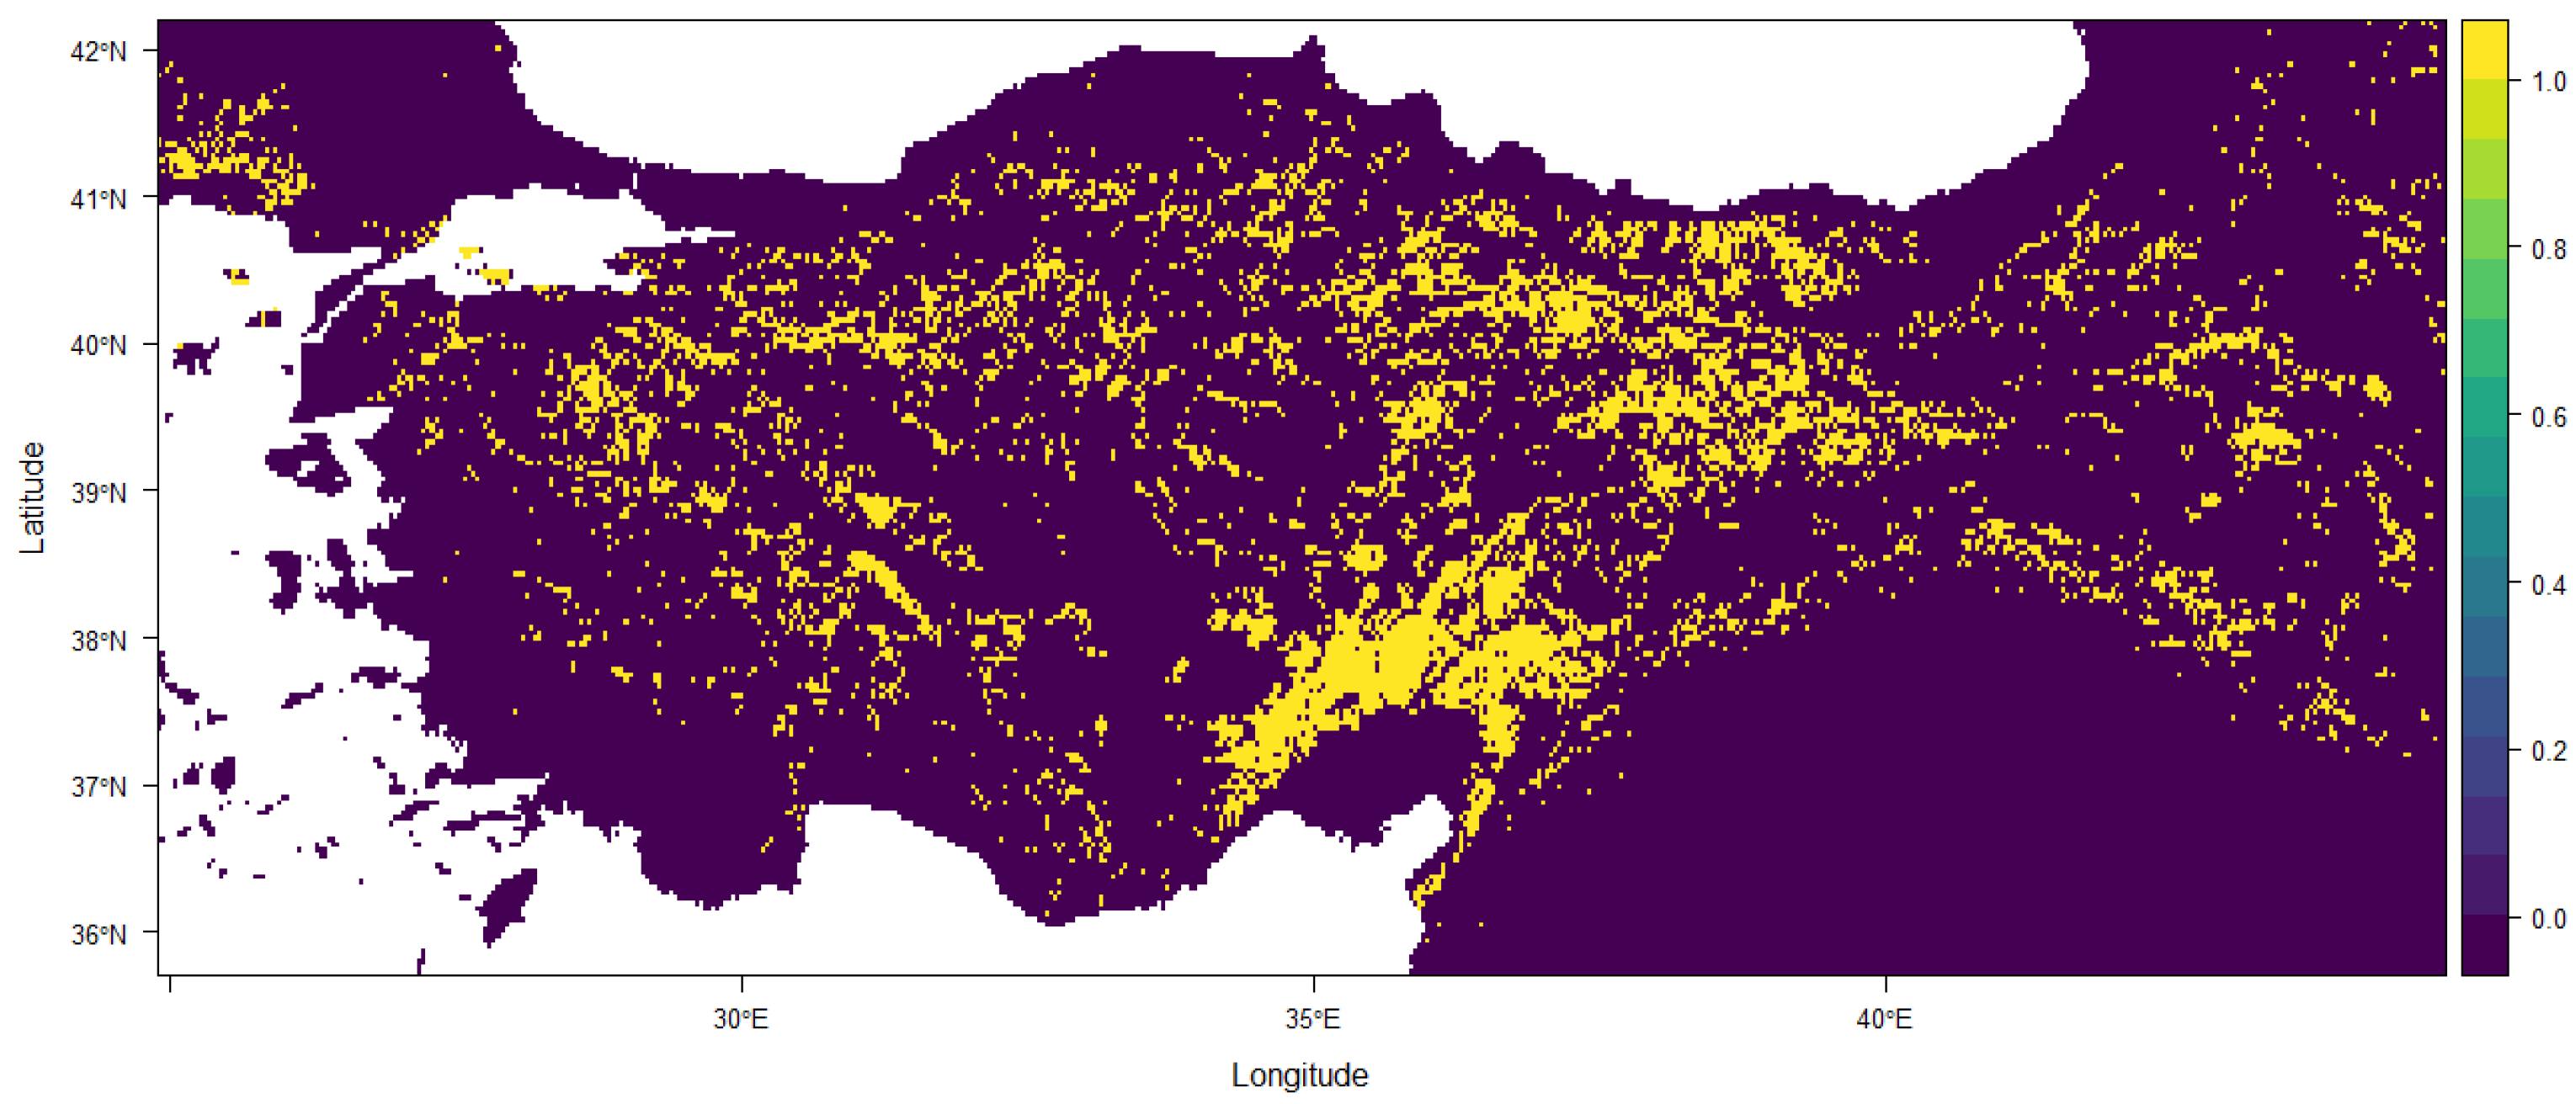
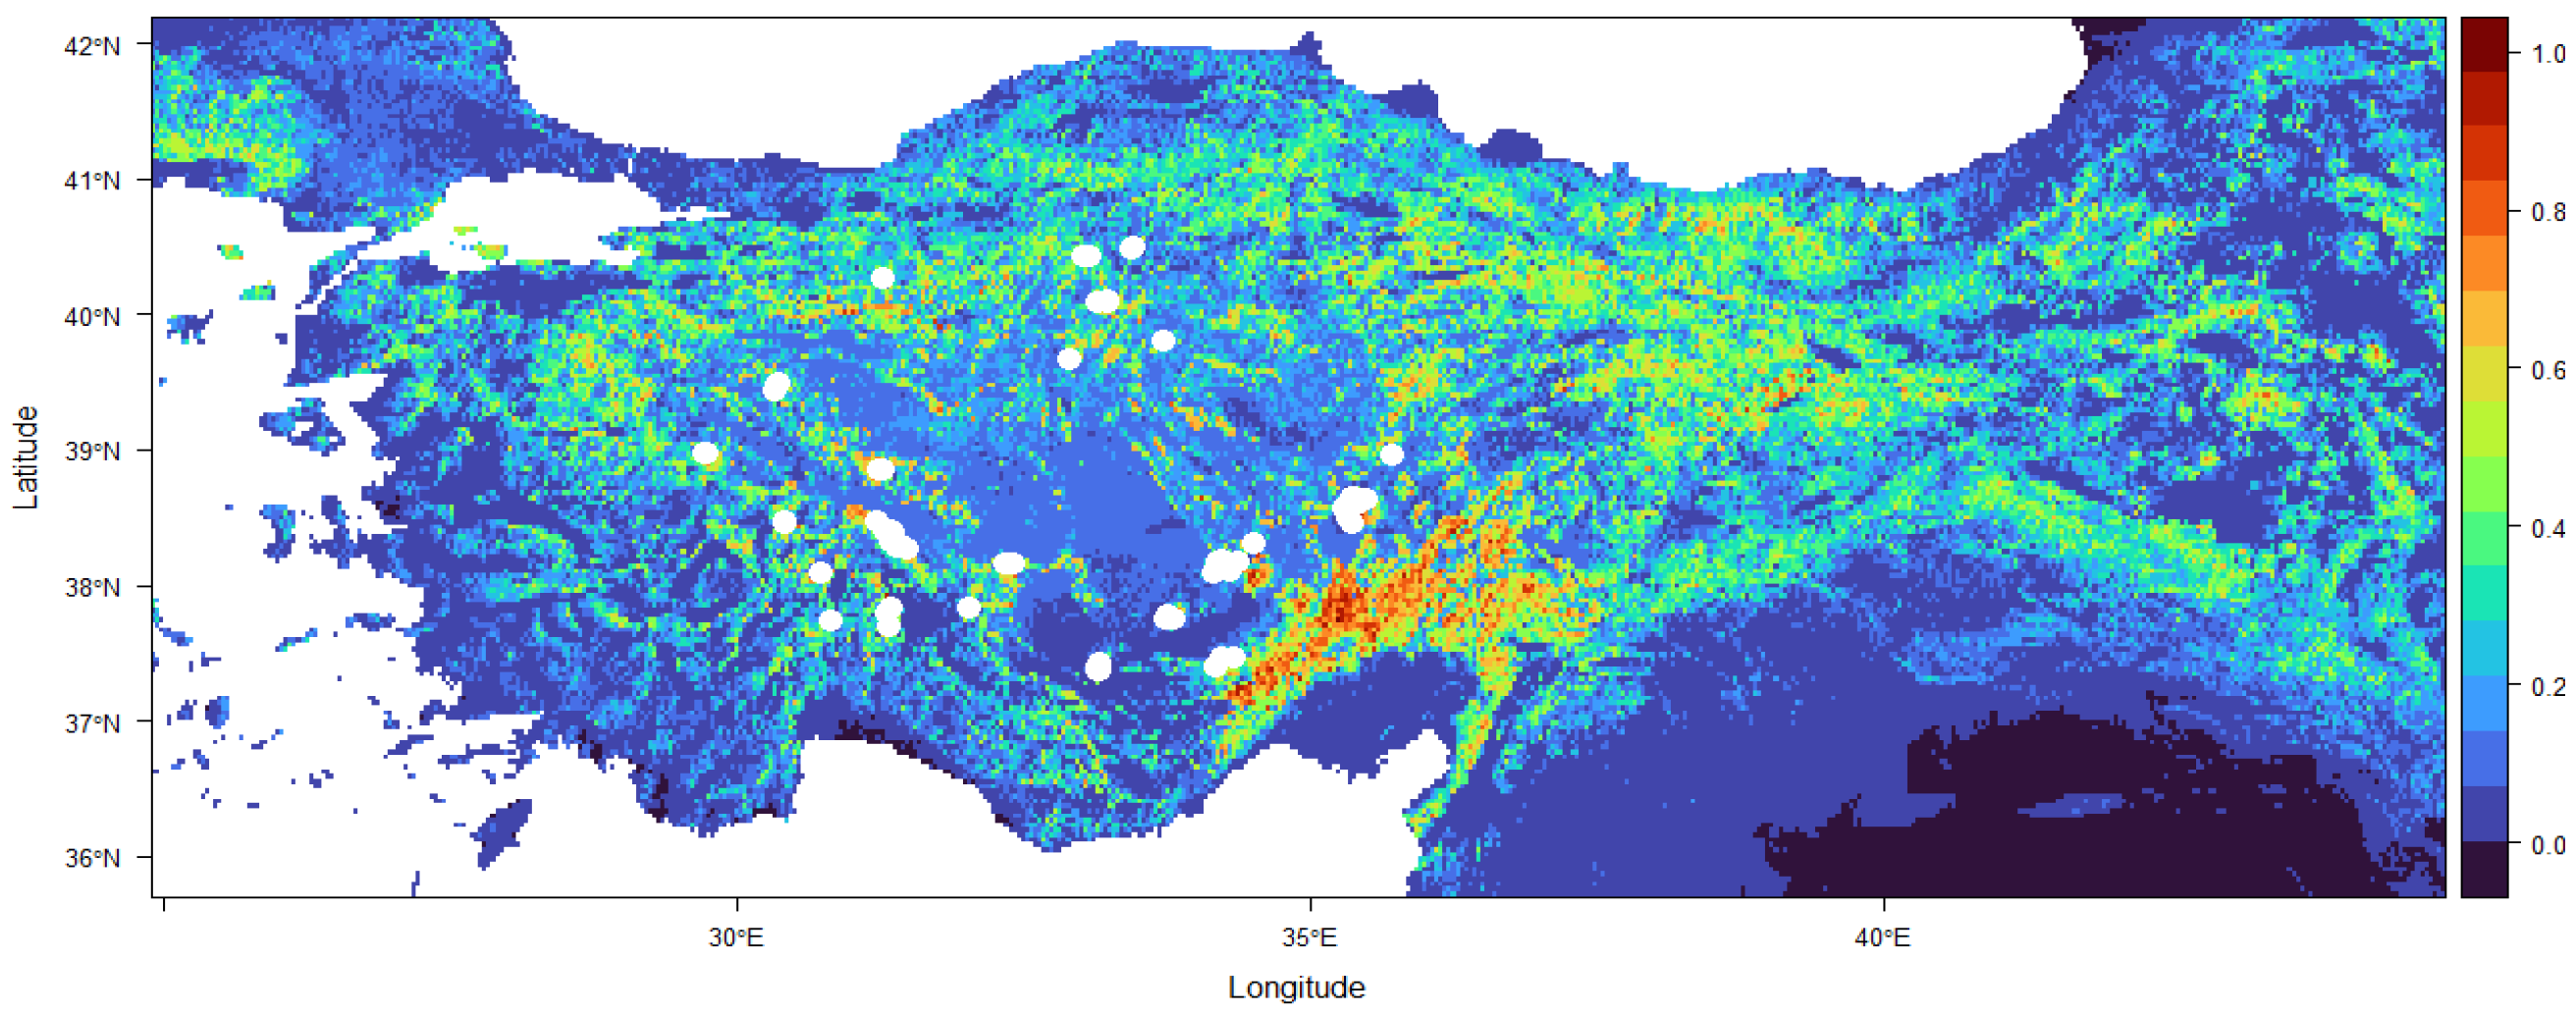
According to the present-day distribution map, the Kasnak oak is widely distributed in the central inland regions of Türkiye. Outside of these areas, the distribution becomes limited and fragmented, indicating a less continuous presence of the species (Figure 2 and Figure A2). The LGM (~21 k BP) projections of Kasnak oak were estimated to have a different pattern to the present-day distribution (Figure 3 and Figure A3). The significant difference is that most of the suitable areas are now in southern Anatolia, whereas in the past, they were more to the north. The common feature between both is the higher suitability in the east versus the west. The species was observed to have habitat suitability (3.29%) in palaeoclimatic conditions wider than its potential distribution. However, in contrast to today’s projection, patchier habitat suitability is observed. In particular, higher suitability compared to the present is observed in eastern Mediterranean Türkiye compared to the present.
According to the average climate habitat suitability maps for the Kasnak oak projected to the present day, the species is predominantly found in the Upper Kızılırmak Section of the Central Anatolia Region. It has a significant distribution within Central Anatolia. Moreover, it maintains a notable presence in the Northern and Eastern Aegean regions and the Eastern and Northern Mediterranean regions. It is widely distributed in the Mediterranean Region, particularly in Central Taurus. Additionally, it can be found along the southern Black Sea region. The species also has a local distribution in the Marmara Region, south of Bilecik, and north of the Eastern Anatolia Region.
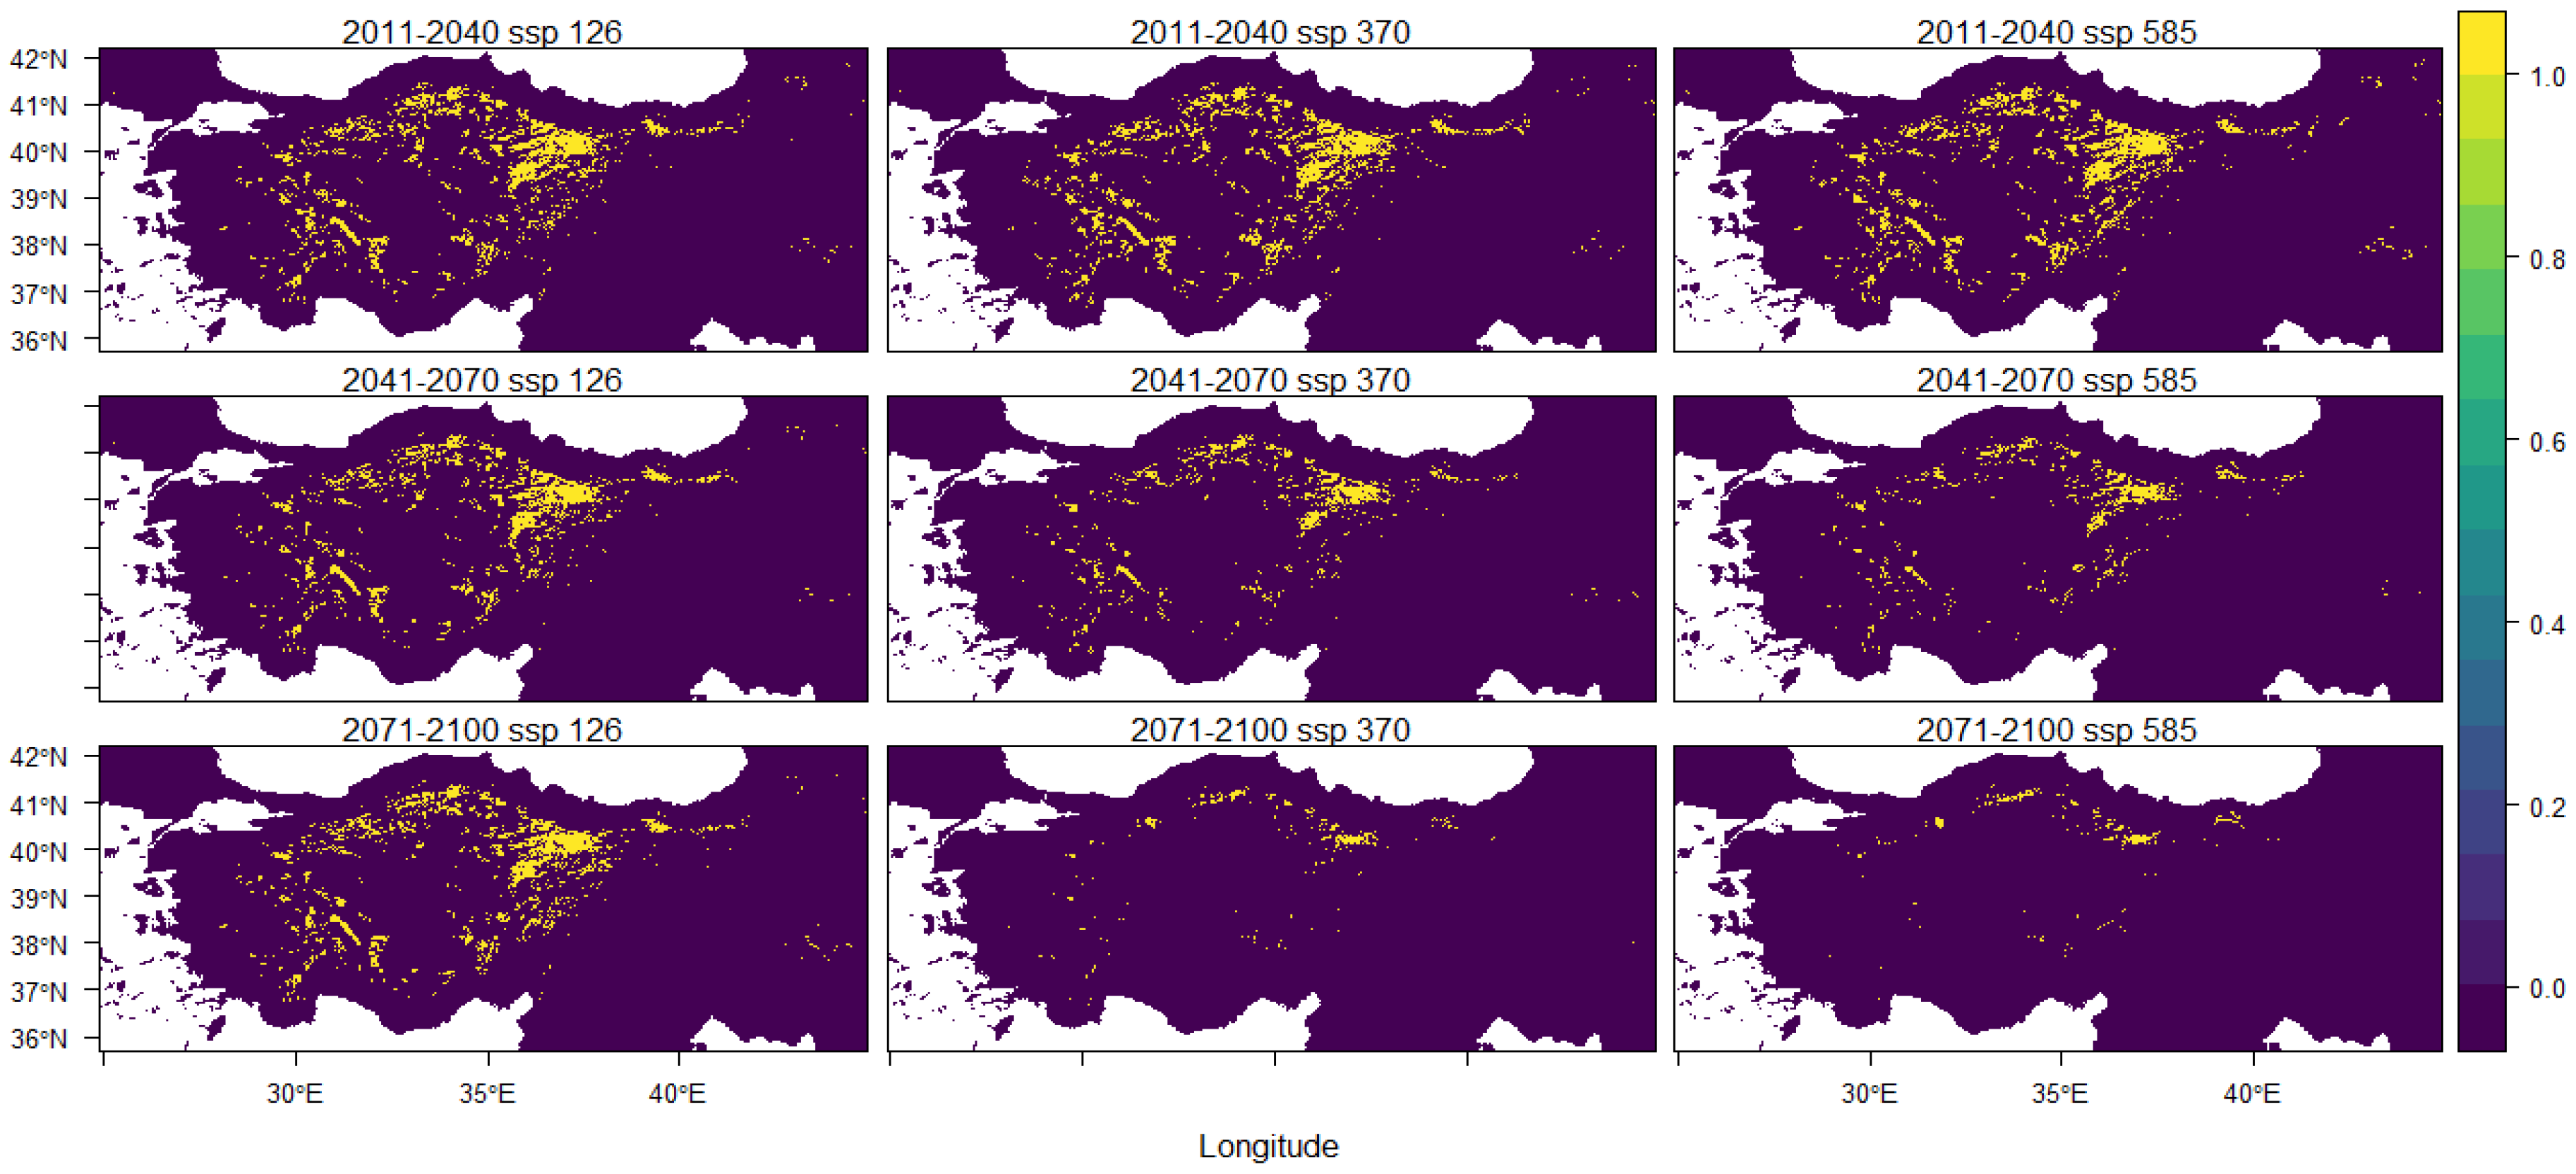
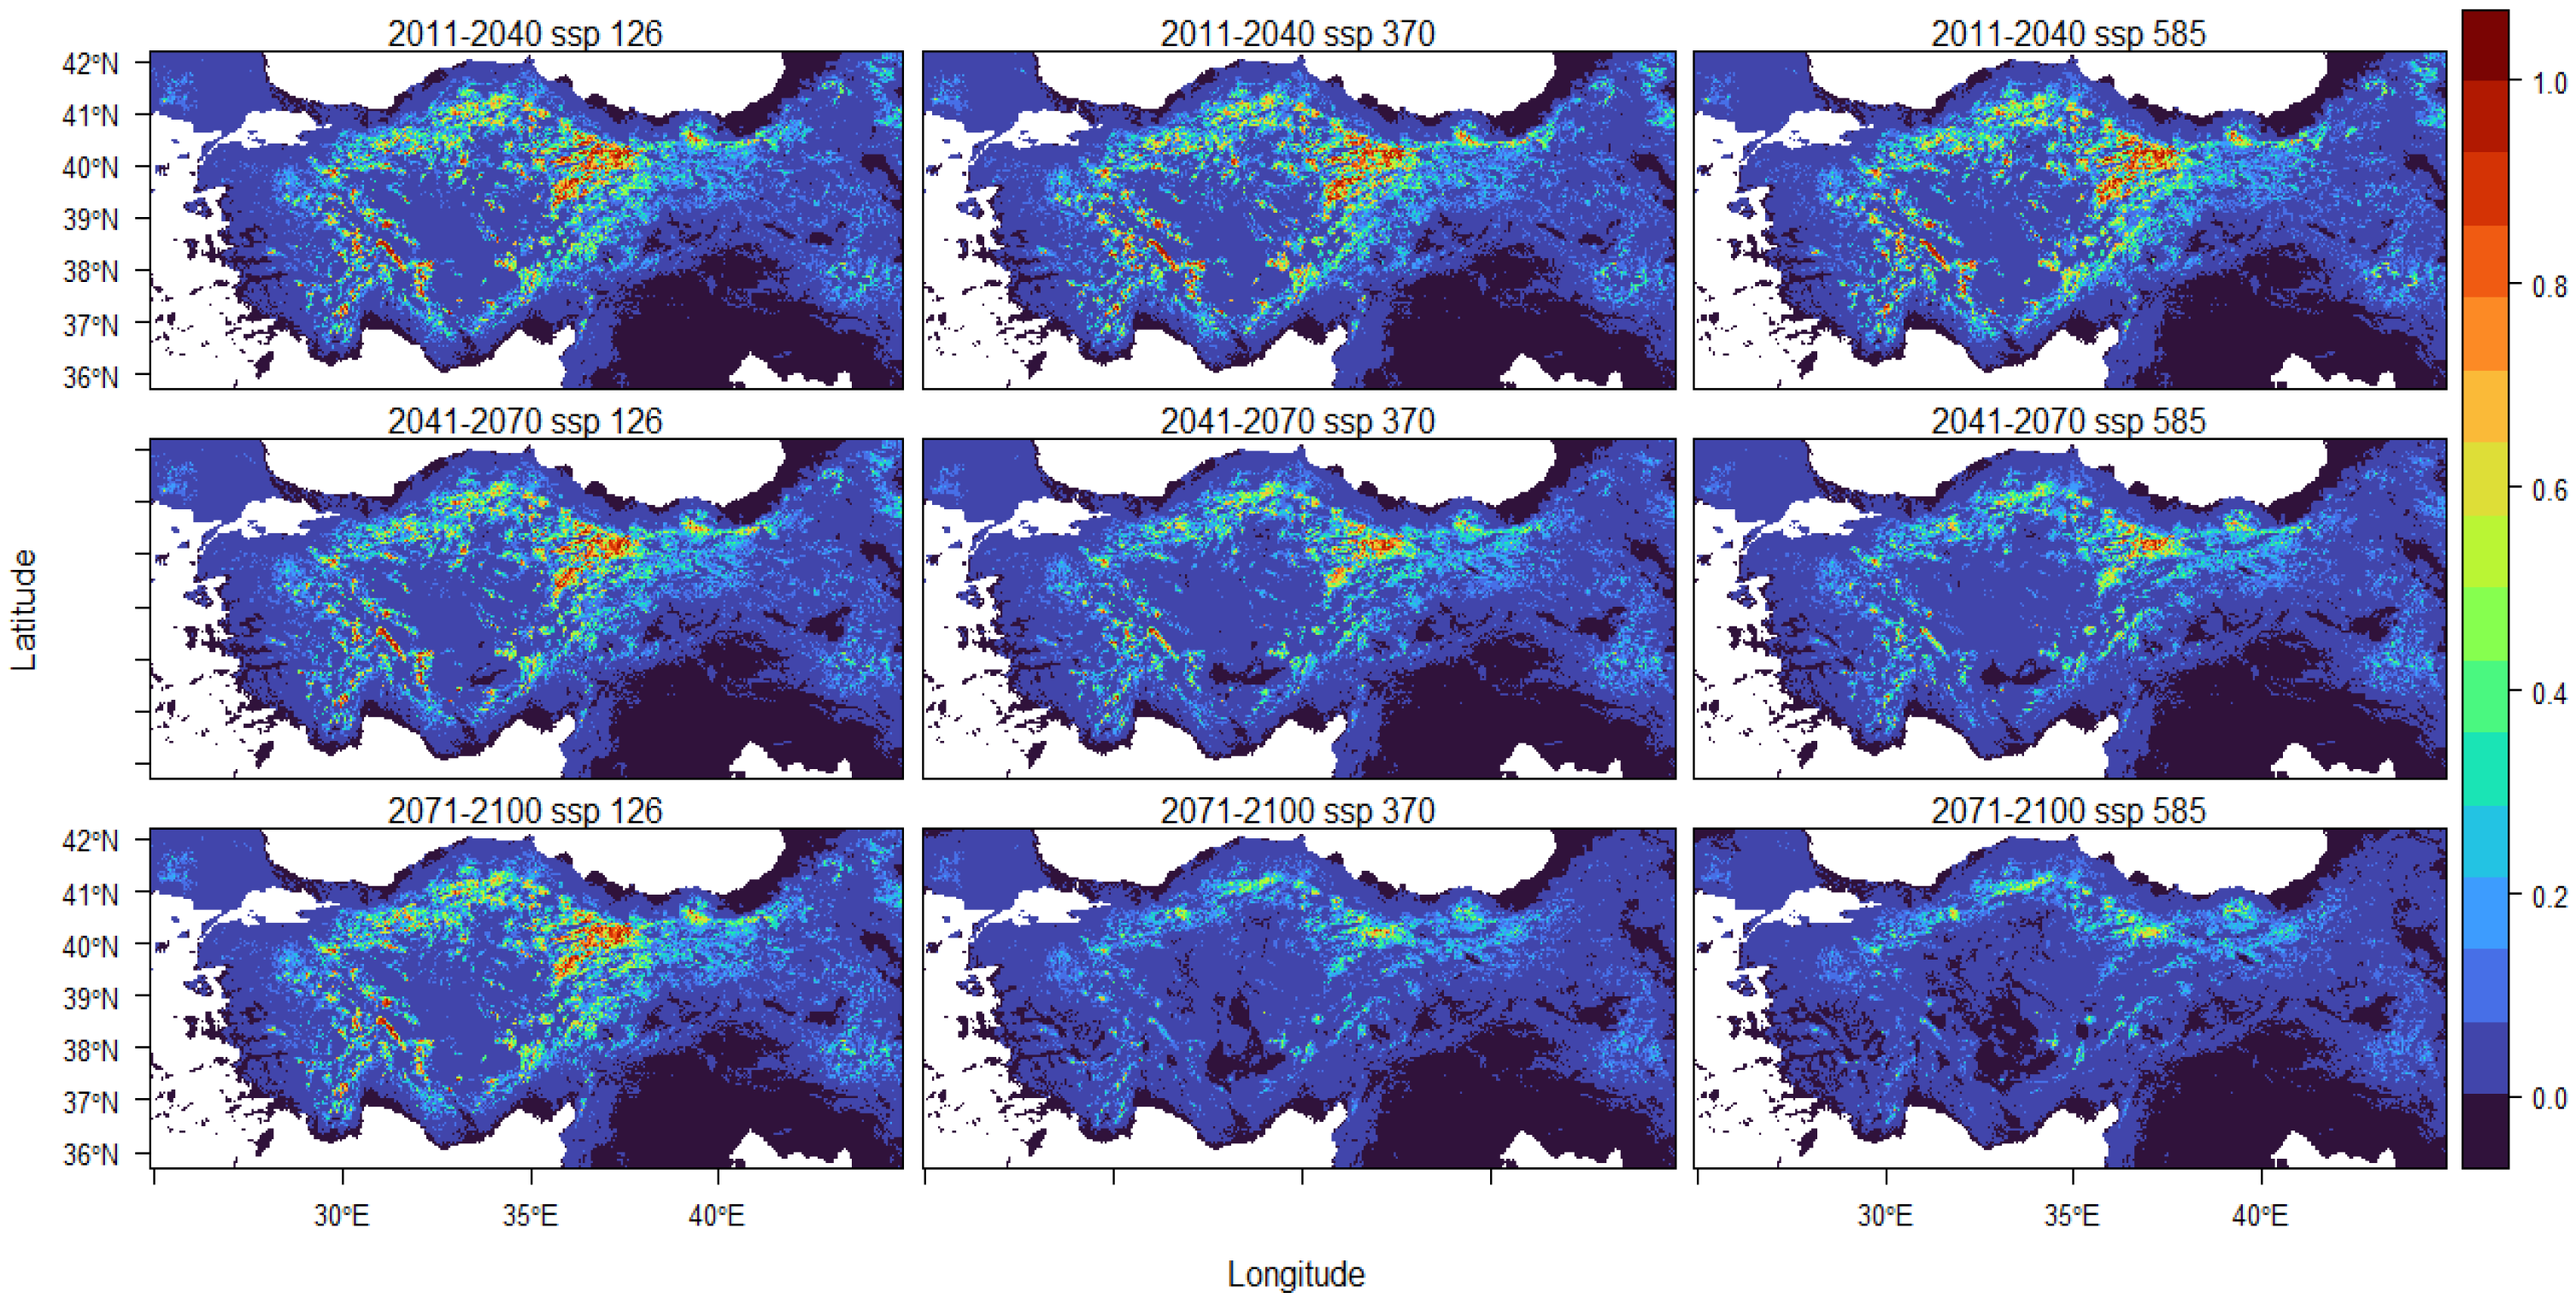
In the future projections (Figure 4 and Figure A3), the distribution of the species is predicted to decrease by 2100, and habitat suitability is predicted to shrink between 3.27% and 7.88% (Table 2). It is expected that suitable habitats for the species, particularly in western Türkiye and the Mediterranean region of Türkiye, will decrease in the near future. Suitable habitats for the northern range of the species are predicted to be present by 2100 but will decrease towards the northeast.
The predicted distribution of the species shows both positive and negative fluctuations throughout different periods, depending on various scenarios. While the optimistic scenario reveals no noteworthy change in the 2011–2070 period, fluctuations in the distribution of the species are observed between 2071 and 2100. Notably, there is a partial increase in the predicted distribution of the species in the northeastern part of the Mediterranean region, encompassing the Aladağlar, and in the southwestern region of the Eastern Anatolia Region. Conversely, there is a partial decrease in the Central Anatolia region, particularly in the eastern vicinity of Ankara. Furthermore, the species is expected to expand its range southward within the Upper Kelkit-Çoruh trough of the Eastern Black Sea Region.
Unlike the optimistic scenario, the differences in the distribution of the species are more noticeable and slightly more marginal in the middle-of-the-road scenario. In the period 2011–2040, the distribution of the species is predicted to be most concentrated around the Upper Kızılırmak Region in the east of the Central Anatolia Region, in the Western and the Central Black Sea region. The species has a fragmented distribution except for the eastern part of Central Anatolia. The suitable areas for the species will significantly decrease in all areas of its distribution in the 2041–2070 period. The distribution of the species is expected to be narrowed to the east of the Central Anatolia Region, where it covers a wide area. Another remarkable finding is the future climate challenges the species may face across the Taurus Mountains. The species has a very limited distribution in Central Anatolia. The distribution of the species in the west of the Eastern Black Sea has also become notably fragmented. Suitable areas for the species are predicted to decrease marginally across its distribution range, except for a local area in the Western Black Sea in the 2071–2100 period. During this period, it is anticipated to have a limited distribution in the east of the Central Anatolia Region. Furthermore, its distribution in the Black Sea is expected to become very fragmented. As a result, the species may become critical or be under threat in many regions of Türkiye.
Under the pessimistic scenario, the distribution of the species is very similar to the middle-of-the-road scenario in all periods. It is expected that by 2100, the suitability of the species’ habitat will decline, resulting in a smaller distribution area. In 2100, the species will have a local and very fragmented distribution only in the south of the Black Sea region and at the northern border of the Central Anatolia Region. Its distribution in the other regions of Türkiye is predicted to be limited and scattered (Figure A4).

4. Discussion

The model results indicate that annual mean temperature (BIO1) is the most important bioclimatic factor influencing the distribution of Quercus vulcanica, with a contribution of 37.5%. Likewise, the slope in the volcanic mountains of southern and southeastern Central Anatolia is important, where Q. vulcanica forms the tree line. Wang et al. [98] revealed that tree line is an essential indicator for isothermal line height in the Rocky Mountains, and studies conducted in North America [99,100], Alpine and New Zealand [101], and temperate regions [102,103,104] supported this finding. Laaribya et al. [105] stated that precipitation during the wettest quarter of the year, seasonality in precipitation, altitude, and seasonal variations in temperature were identified as the key factors determining the distribution of cork oak in the Maamora forest in Morocco. Sarıkaya et al. [59] modeled the current and future status of the species according to literature data. This study has three different aspects from our study. We considered topography when determining the current distribution of the species. Secondly, we obtained a significant part of the data we used in our study as a result of our fieldwork. In addition to the data we obtained, we examined all areas previously included in the literature [40,44]. All of our record data have a maximum of 5 m accuracy. Although we incorporated three distinct records not documented in the existing literature and identified four different areas in line with [43], we did not come across the species in the Ilgaz and Küre Mountains. These two locations represent the northernmost distributions mentioned in the literature [40,54]. For instance, Tuttu [102] conducted an extensive three-year doctoral thesis in the region specified by Avcı [40]. During this study, [106] identified the presence of Q. macranthera Fisch. & Mey. ex Hohen., a species similar but not identical to the one mentioned by Avcı [40]. Consequently, we could not access the primary source in the Amanos Mountains, which is indicated as the southernmost distribution of the species in this study, and numerous other sources. This led to the necessity of excluding these extreme distributions.
The optimal conditions for the growth of Q. vulcanica in terms of height and diameter are observed in Isparta (Lakes Region) and the Sultan Mountains [56,57]. Several of these areas, particularly those hosting Kasnak oak, hold various protection statuses, including genetic protection. In the Sultan Mountains region, Quercus cerris var. cerris and Quercus trojana Webb dominate, while Eğirdir exhibits a mixture of Cedrus libani A. Rich, Quercus trojana, Acer hyrcanum Fisch. & C.A.Mey., and Juniperus excelsa M.Bieb., along with Pinus nigra subsp. pallasiana (Lamb.) in Yenişarbademli. In the Volcano Mountains, Q. cerris var. cerris forms both mixed and pure stands alongside Q. trojana. Moving northward, it intermingles with P. nigra. subsp. pallasiana, Pinus sylvestris L., and Quercus cerris L. either individually or in group stands. In Dandinderesi to the west, Q. cerris associates with Cedrus libani A. Rich. and J. excelsa stands, creating a mixed forest stand.
The most notable association in the distribution of Q. vulcanica is with Q. cerris. These two species are interbred in the entire distribution area except Idris Mountain. Generally, Q. cerris is situated at a lower elevation than Q. vulcanica. In the northern and western regions where conifers are distributed in the study area, Scots pine, Anatolian black pine, and cedar are present along with Q. vulcanica and Q. cerris. When associated with larch and Scots pine, it is found either individually or in groups of 3–5 with low coverage at the upper forest border. Changes in drought severity and recent climate warming may modify the competitive hierarchy between Q. vulcanica and one of the more drought-tolerant oak species, mainly Q. cerris. Quercus cerris has a very wide distribution, from France to the Balkans, Türkiye, and the Levant Region. It adapts well to a broad range of climates, from the hot, humid conditions along the Mediterranean coast to the hot–cold and arid climate of Central Anatolia. Additionally, it exhibits high growth recovery after experiencing extreme drought [107]. In northern Hungary [108,109], in the Carpathians [110], and in southern Italy [107], Quercus cerris has already established a competitive advantage over Fagus sylvatica L., Q. petraea (Matt.) Liebl., and Tilia sp. The dispersal of Q. vulcanica is confronted with three primary risks. The first of these constitutes the upper limit of Q. vulcanica forest. While there may be areas where it can potentially narrow and ascend, such as Erciyes or Hasan Mountains, the species might face constraints in the mountains with an altitude of 2000 m, such as Karacadağ and Karadağ. Furthermore, due to this risk, the species faces the potential of complete disappearance in the western and northwestern regions of Central Anatolia, where its distribution is limited. However, two crucial areas may offer a fortunate chance for the species to be preserved in the future. The species was assigned the Latin name vulcanica due to its identification in the Central Anatolian Volcanic Mountains, such as Karadağ, Karacadağ, Hasan Mountain, Melendiz Mountain, and Erciyes Mountain, where its pure stands are most prevalent. Despite Hasan Mountain (3268 m) and Erciyes Mountain (3917 m) having cone-shaped peaks, their extensive unforested areas and elevations reaching 4000 m may provide a significant advantage. Although the Kasnak oak in the Volcano Mountains has an average height of 5 m and a multiple trunk structure (log shoot) due to prior destruction, they can form small stands with a trunk diameter of up to 80 cm and a height of 20 m in a protected area on Hasan Mountain. In the short term, it is essential to prioritize the complete elimination of long-standing clear-cutting activities here. Furthermore, it is imperative to designate this population as a gene conservation forest, and forest management plans must be urgently revised in this critical area.
The second challenge arises from the species forming isolated stands in and around Central Anatolia due to the changing elevation. The distance between the southern Central Anatolian basins, constituting most of its distribution, ranges from 50 to 100 km, while the distance between the northern and southern distributions is 300 km in the east and 100 km in the west. The findings of this study indicate that the Anatolian Diagonal, originating from the Taurus Mountains and dividing Anatolia into low and high plateaus before extending towards the Black Sea, plays a crucial role in shaping the distribution of the species. Gür [111] suggests the Anatolian Diagonal served as a significant environmental barrier, influencing both fauna and flora during the last glacial period. Notably, the eastern part of the diagonal, with an average altitude of up to 2000 m, is colder, more seasonal, and experiences more rainfall than Central Anatolia [37], aligning with an inclination of the species to spread in future projections. This can be viewed as an advantage for the species. However, the forest structure in the northeastern region of Türkiye, where the species is concentrated in future distribution, may pose a biological barrier. This area is predominantly covered by Anatolian black pine and Scots pine forests above 1200 m altitude. These two species are widely distributed and dominant globally [112,113]. Akdağmadeni, a pivotal area, is hosting one of the largest block Scots pine forests in Türkiye, especially along the Anatolian Diagonal. In locations where the species competes with Scots pine, such as Türkmen Mountain, it is found at the upper border of the forest, either solitary or in groups, at the edges of stands. The species will need to overcome potential competition challenges in the Scots pine forests of Akmağdeni. According to [114], this region remains the most suitable habitat for Scot pine trees in the future. We acknowledge that one of the limitations of our study is the reliance primarily on model-based approaches for reconstructing the Pleistocene behavior of the species. While these approaches provide significant information, they are indeed complemented by other forms of data, such as pollen records and genetic studies. In this context, incorporating pollen data could enhance the robustness and accuracy of our findings. Pollen data offer critical information about past vegetation and climate conditions that are crucial for understanding species distributions during the LGM. Additionally, genetic studies can provide insights into historical biogeography and population dynamics, which are essential for validating and refining our distribution models. For this reason, further research can integrate empirical data with model projections that enable a more detailed and accurate understanding of the species’ historical and potential future distributions.
Q. vulcanica, like other high-altitude endemics [115], is likely to be the most vulnerable oak species to a rapidly changing climate. This vulnerability arises from its limited distribution area, specific environmental requirements, topographic structure, and competitive nature, rendering the species highly sensitive. Our results show that the spatial distribution of Kasnak oak was located further south (i.e., Taurus and Anti-Taurus, and Amanos mountains) in comparison to the actual distribution. Consequently, strong protective measures have become a priority. Historical estimations of the species during the Last Glacial Maximum indicate its current spatial distribution in the southern part of central Anatolia, showing considerable compatibility. This region is the focal point where the species achieves its maximum height and diameter (Lakes Region). However, with ongoing global warming, the species faces a predicament of having “nowhere to go” in the future, as migration to northern latitudes and higher altitudes becomes inevitable. Yet, this may lead to significant losses when physical barriers restrict range adaptations. The situation becomes more complex when considering the natural competition with other species and potential conflicts with those inhabiting different ecological zones, creating a multifaceted challenge.
The model results indicate the movement of the species towards northern latitudes and higher altitudes. In optimistic future climate scenarios, there is a projected expansion into potentially suitable areas, while pessimistic scenarios suggest a significant contraction by 2100. In particular, a shift towards the northeast of Central Anatolia and Eastern Anatolia is expected, with the northeast of Central Anatolia being particularly critical in both short- and long-term scenarios. On the other hand, the species may persist by relocating to higher altitudes, even though its presence diminishes in the southern regions. The potential challenges for Q. vulcanica in its future distribution can be categorized into three main issues: I) extinction or reduction on lower elevations, II) an increase in the distance between isolated stands, and III) competition.
Although this paper does not primarily focus on the effect of various factors on Q. vulcanica, it recognizes that a decline in species may occur due to many biotic and abiotic factors. It is known that pathogens and diseases associated with oak decline in Mediterranean regions of Türkiye pose a major threat to this species [116,117]. These pathogens have also been worsened by drought stress, which results in the mortality of the species [118]. Moreover, environmental transformations such as temperature and rainfall changes greatly influence Q. vulcanica dynamics, thereby causing shifts in its distribution [55].
Human activities have further constricted the range of Q. vulcanica through interference with natural habitats that come about because of settlements, roads, or land use changes. The proximity between human settlements/infrastructure alters dispersal patterns for this species by limiting its ability to disperse well and thrive under normal conditions within its natural distribution [119]. Furthermore, wood pasturing carried out intensively has been detected to cause detrimental shifts in vegetation distribution [120].
Understanding the historical range and genetic diversity of Q. vulcanica is essential to comprehending its resilience. The historical background of oak forests, which encompasses the influence of fire regimes and the genetic patterns of oak species, provides important insights into their long-term survival and ecological interactions. Nonetheless, the future distribution of Q. vulcanica may depend on various environmental factors, e.g., CO2 levels, temperature, and precipitation [55]. These variables, which are shaped by continuous climate change, will show us how well the species adapts and endures in shifting environments. Furthermore, because the records for this species are stored at the herbariums of several Turkish institutions, obtaining them requires a lengthy process and a number of steps. Making these records widely accessible through platforms like GBIF will both save time and allow for more effective control and verification of the information.
Certain areas have been identified by overlapping the species’ current and potential future habitats. These areas have particular significance and should be prioritized for the conservation of the species. It is essential to conduct comprehensive studies in these areas to predict the distribution patterns of other species and to carry out adaptation trials for the species, particularly in selected populations. This proactive step is crucial for protecting the species in the face of future challenges. In the long term, silvicultural interventions, seed stands, seed transfer, and genotype studies that are well adapted to climate change should be carried out, and trial areas should be established. Regarding silvicultural and forest management, measures such as changing regeneration interventions to protect Q. vulcanica, changes in operation method and duration, and optimizing tree density should be implemented gradually. Shorter-term monitoring plans should be recommended for these areas against insect outbreaks or fungi triggered by climate change. Finally, the seed yield, seed viability, and natural regeneration processes of individuals and populations should be monitored, particularly in high-risk areas.

5. Conclusions

Using an ENM approach, this study predicted the potential and future distribution of Q. vulcanica in Anatolia. The present-day projections showed a distribution pattern consistent with the current distribution of the species. Future projections highlight the vulnerability of Q. vulcanica to climate change, indicating a potential decrease in distribution and habitat suitability by 2100. This underscores the urgency for conservation measures, especially in key areas such as the Central Anatolian Volcano Mountains, where the species displays its widest distribution. The identified challenges, including potential extinction risks, increased distances between isolated stands, and competition, necessitate strategic planning to preserve Q. vulcanica. Our findings provide valuable insights for conservation strategies of the species, addressing the anticipated changes in habitat suitability due to shifting climate conditions.

Author Contributions

A.U.Ö.: investigation, data curation, validation, supervision, project administration, and funding acquisition; D.G.: writing—review and editing, supervision, validation, and visualization; G.T.: investigation and data curation; J.V.: writing—review and editing and conceptualization; S.A.: writing—review and editing; J.S.: writing—review and editing and validation; U.T.: investigation and data curation; A.V.: investigation and resources; K.Ç.: software, formal analysis, conceptualization, and writing—review and editing. All authors have read and agreed to the published version of the manuscript.

Funding

This study was supported by the Scientific and Technological Research Council of Türkiye (Tübitak) 1002-Short Term R&D Funding Program [project number 121Y572].

Data Availability Statement

The data presented in this study are available on request from the corresponding author.

Conflicts of Interest

The authors declare no conflicts of interest.

Appendix A

Table A1. The results of variance inflation factor (VIF) analysis among variables (Inf: infinity).
NoVariablesVIF
1bio11116.272
2bio101633.319
3bio112504.198
4bio13198.1605
5bio14108.6452
6bio1589.08824
7bio16216.454
8bio17179.5103
9bio1878.39033
10bio19134.9208
11bio2836.5835
12bio3546.6793
13bio41195.395
14bio5Inf
15bio6Inf
16bio7Inf
17bio89.283976
18bio91806.588
19roughness61.90041
20slope63.14076
21tpi1.862045
22tri49.22961
Table A2. After excluding the collinear variables, the linear correlation coefficient ranges between min correlation (tri~bio3): 0.004305793 and max correlation (bio3~bio15): −0.4479286. Summary of variables retained after addressing multicollinearity issues. Variables with VIF values exceeding the threshold of 10 were removed, leaving six variables with acceptable VIF values, indicating lower levels of multicollinearity.
VariablesVIF
1bio12.831023
2bio133.378127
3bio144.316299
4bio156.405666
5bio31.133834
6bio41.570677
7slope1.615159
8tpi1.009307
Table A3. The performance of the best model against the null model of the Kasnak oak. Areas under curves for “training” the model (AUCtrain), Continuous Boyce Index (CBItrain), the difference between training and testing (AUCdiff), minimum training presence (mtp); the 10% training omission rate (OR10).
StatisticAUCtrainCBItrainAUCdiffmtpOR10
emp. mean0.9750.9390.0400.0290.103
emp. sd--0.4421.3832.487
null. mean0.5970.7250.2230.0230.132
null. sd0.0320.2450.0280.1220.165
z-score11.5930.875−6.5500.050−0.179
p-value<0.0010.191<0.0010.5200.429
Figure A1. Response curves of the environmental variables used in the model. The shaded areas represent the 95% confidence intervals, indicating the range of uncertainty in the predictions of the model.
Forests 15 01551 g0a1aForests 15 01551 g0a1bForests 15 01551 g0a1cForests 15 01551 g0a1d
Figure A2. Average binary prediction for the Kasnak oak projected under present-day climate conditions. The likelihood of occurrence varies from 0 (dark blue, representing low probability) to 1 (red, indicating the highest probability). White dots represent occurrence records. The color scale indicates the probability of habitat suitability, where darker colors denote lower probabilities and brighter colors indicate higher probabilities.
Forests 15 01551 g0a2
Figure A3. Average binary prediction for the Kasnak oak projected to under the Last Glacial Maximum (~21 k BP) climate conditions.
Forests 15 01551 g0a3
Figure A4. The suitability of climate habitat for the Kasnak oak under future climate scenarios is averaged and displayed in binary prediction maps. These average forecasts are categorized across three distinct time intervals: 2011–2040, 2041–2070, and 2071–2100, and for three shared socioeconomic pathways: optimistic (SSP126), moderate (SSP370), and pessimistic (SSP585) models.
Forests 15 01551 g0a4

References

  1. Günal, N. Türkiye’de Iklimin Doğal Bitki Örtüsü Üzerindeki Etkileri. Acta Turc. 2013, 1, 1–22. [Google Scholar]
  2. Pecl, G.T.; Araújo, M.B.; Bell, J.D.; Blanchard, J.; Bonebrake, T.C.; Chen, I.-C.; Clark, T.D.; Colwell, R.K.; Danielsen, F.; Evengård, B. Biodiversity Redistribution under Climate Change: Impacts on Ecosystems and Human Well-Being. Science 2017, 355, eaai9214. [Google Scholar] [CrossRef]
  3. Anderson, J.T.; Song, B.H. Plant Adaptation to Climate Change—Where Are We? J. Syst. Evol. 2020, 58, 533–545. [Google Scholar] [CrossRef] [PubMed]
  4. Román-Palacios, C.; Wiens, J.J. Recent Responses to Climate Change Reveal the Drivers of Species Extinction and Survival. Proc. Natl. Acad. Sci. USA 2020, 117, 4211–4217. [Google Scholar] [CrossRef]
  5. Bellard, C.; Jeschke, J.M.; Leroy, B.; Mace, G.M. Insights from Modeling Studies on How Climate Change Affects Invasive Alien Species Geography. Ecol. Evol. 2018, 8, 5688–5700. [Google Scholar] [CrossRef] [PubMed]
  6. Garcia, R.A.; Cabeza, M.; Rahbek, C.; Araújo, M.B. Multiple Dimensions of Climate Change and Their Implications for Biodiversity. Science 2014, 344, 1247579. [Google Scholar] [CrossRef]
  7. Li, G.; Huang, J.; Guo, H.; Du, S. Projecting Species Loss and Turnover under Climate Change for 111 Chinese Tree Species. For. Ecol. Manag. 2020, 477, 118488. [Google Scholar] [CrossRef]
  8. IPCC. Climate Change 2014: Synthesis Report. Contribution of Working Groups I, II and III to the Fifth Assessment Report of the Intergovernmental Panel on Climate Change; IPCC: Geneva, Switzerland, 2014. [Google Scholar]
  9. Thuiller, W. Climate Change and the Ecologist. Nature 2007, 448, 550–552. [Google Scholar] [CrossRef]
  10. Beaty, F.; Gehman, A.L.M.; Brownlee, G.; Harley, C.D.G. Not Just Range Limits: Warming Rate and Thermal Sensitivity Shape Climate Change Vulnerability in a Species Range Center. Ecology 2023, 104, e4183. [Google Scholar] [CrossRef]
  11. Maharjan, S.K.; Sterck, F.J.; Raes, N.; Zhao, Y.; Poorter, L. Climate Change Induced Elevational Range Shifts of Himalayan Tree Species. Biotropica 2023, 55, 53–69. [Google Scholar] [CrossRef]
  12. Hama, A.A.; Khwarahm, N.R. Predictive Mapping of Two Endemic Oak Tree Species under Climate Change Scenarios in a Semiarid Region: Range Overlap and Implications for Conservation. Ecol. Inform. 2023, 73, 101930. [Google Scholar] [CrossRef]
  13. Oliver, T.H.; Heard, M.S.; Isaac, N.J.B.; Roy, D.B.; Procter, D.; Eigenbrod, F.; Freckleton, R.; Hector, A.; Orme, C.D.L.; Petchey, O.L.; et al. Biodiversity and Resilience of Ecosystem Functions. Trends Ecol. Evol. 2015, 30, 673–684. [Google Scholar] [CrossRef] [PubMed]
  14. Timpane-Padgham, B.L.; Beechie, T.; Klinger, T. A Systematic Review of Ecological Attributes That Confer Resilience to Climate Change in Environmental Restoration. PLoS ONE 2017, 12, e0173812. [Google Scholar] [CrossRef] [PubMed]
  15. Thompson, I.; Mackey, B.; McNulty, S.; Mosseler, A. Forest Resilience, Biodiversity, and Climate Change—A synthesis of the Biodiversity/Resilience/Stability Relationship in Forest Ecosystems. In Secretariat of the Convention on Biological Diversity, Montreal; Technical Series; Secretariat of the Convention on Biological Diversity: Montreal, QC, Canada, 2009; Volume 43, pp. 1–67. [Google Scholar]
  16. Côté, I.M.; Darling, E.S. Rethinking Ecosystem Resilience in the Face of Climate Change. PLoS Biol. 2010, 8, e1000438. [Google Scholar] [CrossRef] [PubMed]
  17. Moritz, C.; Agudo, R. The Future of Species Under Climate Change: Resilience or Decline? Science 2013, 341, 504–508. [Google Scholar] [CrossRef]
  18. Hoffmann, A.A.; Rymer, P.D.; Byrne, M.; Ruthrof, K.X.; Whinam, J.; McGeoch, M.; Bergstrom, D.M.; Guerin, G.R.; Sparrow, B.; Joseph, L.; et al. Impacts of Recent Climate Change on Terrestrial Flora and Fauna: Some Emerging Australian Examples. Austral Ecol. 2019, 44, 3–27. [Google Scholar] [CrossRef]
  19. Taleshi, H.; Jalali, S.G.; Alavi, S.J.; Hosseini, S.M.; Naimi, B.; Zimmermann, N.E. Climate Change Impacts on the Distribution and Diversity of Major Tree Species in the Temperate Forests of Northern Iran. Reg. Environ. Change 2019, 19, 2711–2728. [Google Scholar] [CrossRef]
  20. Emberger, L. A Biogeographic Classification of Climates. Rec. Trav. Bot. Lab. Bot. Geol. Zool. Univ. Montp. Bot. Ser. 1955, 7, 3–43. [Google Scholar]
  21. Al-Qaddi, N.; Vessella, F.; Stephan, J.; Al-Eisawi, D.; Schirone, B. Current and Future Suitability Areas of Kermes Oak (Quercus coccifera L.) in the Levant under Climate Change. Reg. Environ. Change 2017, 17, 143–156. [Google Scholar] [CrossRef]
  22. Stephan, J.; Bercachy, C.; Bechara, J.; Charbel, E.; López-Tirado, J. Local Ecological Niche Modelling to Provide Suitability Maps for 27 Forest Tree Species in Edge Conditions. iforest—Biogeosci. For. 2020, 13, 230. [Google Scholar] [CrossRef]
  23. Elith, J.; Leathwick, J.R. Species Distribution Models: Ecological Explanation and Prediction Across Space and Time. Annu. Rev. Ecol. Evol. Syst. 2009, 40, 677–697. [Google Scholar] [CrossRef]
  24. López-Tirado, J.; Vessella, F.; Stephan, J.; Ayan, S.; Schirone, B.; Hidalgo, P.J. Effect of Climate Change on Potential Distribution of Cedrus Libani A. Rich in the Twenty-First Century: An Ecological Niche Modeling Assessment. New For. 2021, 52, 363–376. [Google Scholar] [CrossRef]
  25. Hending, D.; Holderied, M.; McCabe, G.; Cotton, S. Effects of Future Climate Change on the Forests of Madagascar. Ecosphere 2022, 13, e4017. [Google Scholar] [CrossRef]
  26. Ayan, S.; Buğday, E.; Varol, T.; Özel, H.B.; Thurm, E.A. Effect of Climate Change on Potential Distribution of Oriental Beech (Fagus orientalis Lipsky.) in the Twenty-First Century in Turkey. Theor. Appl. Climatol. 2022, 148, 165–177. [Google Scholar] [CrossRef]
  27. Grondin, P.; Brice, M.-H.; Boulanger, Y.; Morneau, C.; Couillard, P.-L.; Richard, P.J.H.; Chalumeau, A.; Poirier, V. Ecological Classification in Forest Ecosystem Management: Links Between Current Practices and Future Climate Change in a Québec Case Study. In Boreal Forests in the Face of Climate Change: Sustainable Management; Girona, M.M., Morin, H., Gauthier, S., Bergeron, Y., Eds.; Advances in Global Change Research; Springer International Publishing: Cham, Switzerland, 2023; pp. 219–246. ISBN 978-3-031-15988-6. [Google Scholar]
  28. Vessella, F.; Simeone, M.C.; Schirone, B. Quercus suber Range Dynamics by Ecological Niche Modelling: From the Last Interglacial to Present Time. Quat. Sci. Rev. 2015, 119, 85–93. [Google Scholar] [CrossRef]
  29. Suicmez, B.; Avci, M. Distribution Patterns of Quercus ilex from the Last Interglacial Period to the Future by Ecological Niche Modeling. Ecol. Evol. 2023, 13, e10606. [Google Scholar] [CrossRef]
  30. Yilmaz, O.Y.; Akkemik, Ü.; Dogan, Ö.H.; Yilmaz, H.; Sevgi, O.; Sevgi, E. The Missing Part of the Past, Current, and Future Distribution Model of Quercus ilex L.: The Eastern Edge. Iforest—Biogeosci. For. 2024, 17, 90. [Google Scholar] [CrossRef]
  31. Douaihy, B.; Saliba, C.; Stephan, J.; Simeone, M.C.; Cardoni, S.; Farhat, P.; Bou Dagher Kharrat, M. Tracking Diversity and Evolutionary Pathways of Lebanese Oak Taxa through Plastome Analyses. Bot. Lett. 2020, 167, 315–330. [Google Scholar] [CrossRef]
  32. Ülker, E.D.; Tavşanoğlu, Ç.; Perktaş, U. Ecological Niche Modelling of Pedunculate Oak (Quercus robur) Supports the ‘Expansion–Contraction’ Model of Pleistocene Biogeography. Biol. J. Linn. Soc. 2018, 123, 338–347. [Google Scholar] [CrossRef]
  33. Ramírez-Preciado, R.P.; Gasca-Pineda, J.; Arteaga, M.C. Effects of Global Warming on the Potential Distribution Ranges of Six Quercus Species (Fagaceae). Flora 2019, 251, 32–38. [Google Scholar] [CrossRef]
  34. Saran, S.; Joshi, R.; Sharma, S.; Padalia, H.; Dadhwal, V.K. Geospatial Modeling of Brown Oak (Quercus semecarpifolia) Habitats in the Kumaun Himalaya under Climate Change Scenario. J. Indian Soc. Remote Sens. 2010, 38, 535–547. [Google Scholar] [CrossRef]
  35. Dhyani, S.; Kadaverugu, R.; Pujari, P. Predicting Impacts of Climate Variability on Banj Oak (Quercus leucotrichophora A. Camus) Forests: Understanding Future Implications for Central Himalayas. Reg. Environ. Change 2020, 20, 113. [Google Scholar] [CrossRef]
  36. Türkeş, M. Küresel ve Bölgesel Iklim Değişikliklerinin Anadolu Coğrafyasına Etkileri. Bilim ve Ütopya 2018, 292, 37–44. [Google Scholar]
  37. Yılmaz, E. Yüksek Çözünürlüklü ERA-Interim ve HadGEM2-CC Model Verilerine Göre Türkiye’nin Güncel ve Gelecekteki Holdridge Ekolojik Bölgeleri. Coğrafi Bilim. Derg. 2021, 19, 29–60. [Google Scholar] [CrossRef]
  38. Yılmaz, E.; Çiçek, İ. Detailed Köppen-Geiger Climate Regions of Turkey Türkiye’nin Detaylandırılmış Köppen-Geiger Iklim Bölgeleri. J. Hum. Sci. 2018, 15, 225–242. [Google Scholar] [CrossRef]
  39. Yılmaz, H. Türkiye’nin Bütün Ağaçları ve Çalıları-Fagaceae; Türkiye İş Bankası Kültür Yayınları: Beyoğlu, Turkey, 2020. [Google Scholar]
  40. Avcı, M. Endemik Bir Meşe Türü, Kasnak Meşesi (Quercus vulcanica (Boiss. Heldr. Ex) Kotschy)’nin Türkiye’deki Yeni Bir Yayılış Alanı. Türk Coğrafya Derg. 1996, 31, 283–289. [Google Scholar]
  41. Birol, S.Ö.; Özel, N.; Gugger, P.; Özkan, K. Endemik kasnak meşesinin (Quercus vulcanica [Boiss. and Heldr. ex] Kotschy) yeni bir yayılış alanı. Turk. J. For. 2020, 21, 6–14. [Google Scholar] [CrossRef]
  42. Kasaplıgil, B.; Yılmaz, N. Türkiye’nin Geçmişteki ve Bugünkü Meşe Türleri; Orman Bakanlığı Orman Genel Müdürlüğü: Yenimahalle, Turkey, 1992; ISBN 975-407-012-1. [Google Scholar]
  43. Çevre, K. İç Anadolu’nun Kalıntı Ormanları; Kırsal Çevre ve Ormancılık Sorunları Araştırma Derneği, Arkadaş Basım Sanayi Ltd.: Ankara, Turkey, 2019. [Google Scholar]
  44. Yaltırık, F. Türkiye Meşeleri: Teşhis Kılavuzu; Yenilik Basımevi: Beyoğlu/Istanbul, Turkey, 1984. [Google Scholar]
  45. Soberón, J.; Peterson, A.T. Interpretation of Models of Fundamental Ecological Niches and Species’ Distributional Areas. Biodiversity Informatics 2005, 2, 1–10. [Google Scholar] [CrossRef]
  46. Davis, P.H. Flora of Turkey and the East Aegean Islands; Edinburgh University Press: Edinburgh, UK, 1970; Volume 3. [Google Scholar]
  47. Kayacık Orman ve Park Ağaçlarının Özel Sistematiği; Cilt II; İÜ Orman Fakültesi: İstanbul, Turkey, 1981.
  48. Hedge, I.C.; Yaltirik, F. The Oaks of Turkey. International Oaks 1994, 3–22. [Google Scholar]
  49. Çetik, A.R. Türkiye Vejetasyonu: İç Anadolu’nun Vejetasyonu ve Ekolojisi. I; Selçuk Üniversitesi: Edinburgh, UK, 1985. [Google Scholar]
  50. Akman, Y. Turkiye Orman Vejetasyonu: Kuzey Anadolu Orman Vejetasyonu; Kariyer Matbaacılık Ankara: Ankara, Turkey, 1995. [Google Scholar]
  51. Avcı, M. İç Anadolu Bölgesi Ormanlarının Son Sığınakları: Karacadağ ve Karadağ Volkanlarının Bitki Örtüsü; Çantay Kitabevi: İstanbul, Turkey, 2004. [Google Scholar]
  52. Mayer, H.; Aksoy, H. Türkiye Ormanları, Orman Bakanlığı Batı Karadeniz Ormancılık; Araştırma Müdürlüğü Yayını: Bolu, Turkey, 1998. [Google Scholar]
  53. Çinar-Yilmaz, H. Türkiyenin Endemik Meşe (Quercus L.) Taksonlarının Morfolojik Özellikleri; Istanbul University: Istanbul, Turkey, 1998. [Google Scholar]
  54. Aydınözü, D. Kasnak Meşesi (Quercus vulcanica (Boiss. and Heldr. Ex) Kotschy)’nin Türkiye’deki Ikinci Yeni Bir Yayılış Alanı. Marmara Coğrafya Derg. 2004, 9, 89–96. [Google Scholar]
  55. Kargıoğlu, M.; Şenkul, Ç.; Serteser, A.; Konuk, M. Bioclimatic Requirements of Quercus vulcanica Boiss and Heldr. ex Kotschy An Endemic Species in Turkey. Pol. J. Ecol. 2009, 57, 197–200. [Google Scholar]
  56. Genç, M.; Güner, Ş.T.; Çömez, A.; Deligöz, A.; Yıldız, D. Kasnak Meşesinin Quercus vulcanica Boiss. and Heldr. Ex Kotschy) Ekolojisi ve Meşcere Kuruluş Özellikleri; T.C. Orman Ve Su Işleri Bakanlığı, Orman Genel Müdürlüğü, Orman Toprak Ve Ekoloji Araştırmaları Enstitüsü Müdürlüğü: Ankara City, Turkey, 2011; ISBN 978-605-393-111-9. [Google Scholar]
  57. Karataş, R.; Arslan, M.; Güner, Ş.; Çömez, A.; Özkan, K. Göller Bölgesindeki Doğal Yayılış Alanlarında Kasnak Meşesinin (Quercus vulcanica Boiss. and Heldr. Ex Kotschy) Boy Gelişimi Ile Yetişme Ortamı Özellikleri Arasındaki Ilişkiler; T.C. Orman ve Su İşleri Bakanlığı, Orman Genel Müdürlüğü, Orman Toprak ve Ekoloji Araştırmaları Enstitüsü Müdürlüğü Yayın: Ankara City, Turkey, 2013. [Google Scholar]
  58. Kurt, L.; Akman, Y.; Quézel, P.; Ekim, T.; Demiryürek, E. Etude synécologique des forêts de Quercus vulcanica des environs d’Isparta-Egirdir (Turquie). Ecol. Mediterr. 1996, 22, 53–57. [Google Scholar] [CrossRef]
  59. Sarıkaya, A.G.; Örücü, Ö.K.; Şen, İ.; Sarıkaya, O. Modelling the Potential Distribution of the Endemic Oak Quercus vulcanica Boiss. & Heldr. ex Kotschy in Turkey from the Last Interglacial to the Future: From near Threatened to Endangered. Dendrobiology 2022, 88, 70–80. [Google Scholar]
  60. Boria, R.A.; Olson, L.E.; Goodman, S.M.; Anderson, R.P. Spatial Filtering to Reduce Sampling Bias Can Improve the Performance of Ecological Niche Models. Ecol. Model. 2014, 275, 73–77. [Google Scholar] [CrossRef]
  61. Fourcade, Y.; Engler, J.O.; Rödder, D.; Secondi, J. Mapping Species Distributions with MAXENT Using a Geographically Biased Sample of Presence Data: A Performance Assessment of Methods for Correcting Sampling Bias. PLoS ONE 2014, 9, e97122. [Google Scholar] [CrossRef] [PubMed]
  62. Merow, C.; Smith, M.J.; Silander Jr, J.A. A Practical Guide to MaxEnt for Modeling Species’ Distributions: What It Does, and Why Inputs and Settings Matter. Ecography 2013, 36, 1058–1069. [Google Scholar] [CrossRef]
  63. Sillero, N.; Arenas-Castro, S.; Enriquez-Urzelai, U.; Vale, C.G.; Sousa-Guedes, D.; Martínez-Freiría, F.; Real, R.; Barbosa, A.M. Want to Model a Species Niche? A Step-by-Step Guideline on Correlative Ecological Niche Modelling. Ecol. Model. 2021, 456, 109671. [Google Scholar] [CrossRef]
  64. Aiello-Lammens, M.E.; Boria, R.A.; Radosavljevic, A.; Vilela, B.; Anderson, R.P. spThin: An R Package for Spatial Thinning of Species Occurrence Records for Use in Ecological Niche Models. Ecography 2015, 38, 541–545. [Google Scholar] [CrossRef]
  65. Fick, S.E.; Hijmans, R.J. WorldClim 2: New 1-km Spatial Resolution Climate Surfaces for Global Land Areas. Int. J. Climatol. 2017, 37, 4302–4315. [Google Scholar] [CrossRef]
  66. Karger, D.N.; Conrad, O.; Böhner, J.; Kawohl, T.; Kreft, H.; Soria-Auza, R.W.; Zimmermann, N.E.; Linder, H.P.; Kessler, M. Climatologies at High Resolution for the Earth’s Land Surface Areas. Sci. Data 2017, 4, 170122. [Google Scholar] [CrossRef]
  67. Karger, D.N.; Kessler, M.; Lehnert, M.; Jetz, W. Limited Protection and Ongoing Loss of Tropical Cloud Forest Biodiversity and Ecosystems Worldwide. Nat. Ecol. Evol. 2021, 5, 854–862. [Google Scholar] [CrossRef] [PubMed]
  68. Brun, P.; Zimmermann, N.E.; Hari, C.; Pellissier, L.; Karger, D.N. Global Climate-Related Predictors at Kilometer Resolution for the Past and Future. Earth Syst. Sci. Data 2022, 14, 5573–5603. [Google Scholar] [CrossRef]
  69. Amatulli, G.; Domisch, S.; Tuanmu, M.-N.; Parmentier, B.; Ranipeta, A.; Malczyk, J.; Jetz, W. A Suite of Global, Cross-Scale Topographic Variables for Environmental and Biodiversity Modeling. Sci. Data 2018, 5, 1–15. [Google Scholar] [CrossRef] [PubMed]
  70. Naimi, B.; Araújo, M.B. Sdm: A Reproducible and Extensible R Platform for Species Distribution Modelling. Ecography 2016, 39, 368–375. [Google Scholar] [CrossRef]
  71. Guisan, A.; Thuiller, W.; Zimmermann, N.E. Habitat Suitability and Distribution Models: With Applications in R; Cambridge University Press: Cambridge, UK, 2017. [Google Scholar]
  72. Campbell, L.P.; Luther, C.; Moo-Llanes, D.; Ramsey, J.M.; Danis-Lozano, R.; Peterson, A.T. Climate Change Influences on Global Distributions of Dengue and Chikungunya Virus Vectors. Philos. Trans. R. Soc. B Biol. Sci. 2015, 370, 20140135. [Google Scholar] [CrossRef]
  73. Escobar, L.E.; Lira-Noriega, A.; Medina-Vogel, G.; Peterson, A.T. Potential for Spread of the White-Nose Fungus (Pseudogymnoascus Destructans) in the Americas: Use of Maxent and NicheA to Assure Strict Model Transference. Geospat. Health 2014, 9, 221–229. [Google Scholar] [CrossRef]
  74. Dunne, J.P.; Horowitz, L.W.; Adcroft, A.J.; Ginoux, P.; Held, I.M.; John, J.G.; Krasting, J.P.; Malyshev, S.; Naik, V.; Paulot, F. The GFDL Earth System Model Version 4.1 (GFDL-ESM 4.1): Overall Coupled Model Description and Simulation Characteristics. J. Adv. Model. Earth Syst. 2020, 12, e2019MS002015. [Google Scholar] [CrossRef]
  75. Tang, Y.; Rumbold, S.; Ellis, R.; Kelley, D.; Mulcahy, J.; Sellar, A.; Walton, J.; Jones, C. MOHC UKESM1. 0-LL Model Output Prepared for CMIP6 CMIP; World Data Center for Climate (WDCC): Hamburg, Germany, 2019. [Google Scholar]
  76. Müller, W.A.; Jungclaus, J.H.; Mauritsen, T.; Baehr, J.; Bittner, M.; Budich, R.; Bunzel, F.; Esch, M.; Ghosh, R.; Haak, H. A Higher-resolution Version of the Max Planck Institute Earth System Model (MPI-ESM1. 2-HR). J. Adv. Model. Earth Syst. 2018, 10, 1383–1413. [Google Scholar] [CrossRef]
  77. Boucher, O.; Servonnat, J.; Albright, A.L.; Aumont, O.; Balkanski, Y.; Bastrikov, V.; Bekki, S.; Bonnet, R.; Bony, S.; Bopp, L.; et al. Presentation and Evaluation of the IPSL-CM6A-LR Climate Model. J. Adv. Model. Earth Syst. 2020, 12, e2019MS002010. [Google Scholar] [CrossRef]
  78. Yukimoto, S.; Kawai, H.; Koshiro, T.; Oshima, N.; Yoshida, K.; Urakawa, S.; Tsujino, H.; Deushi, M.; Tanaka, T.; Hosaka, M. The Meteorological Research Institute Earth System Model Version 2.0, MRI-ESM2. 0: Description and Basic Evaluation of the Physical Component. J. Meteorol. Soc. Japan. Ser. II 2019, 97, 931–965. [Google Scholar] [CrossRef]
  79. Sanderson, B.M.; Knutti, R.; Caldwell, P. A Representative Democracy to Reduce Interdependency in a Multimodel Ensemble. J. Clim. 2015, 28, 5171–5194. [Google Scholar] [CrossRef]
  80. Phillips, S.J.; Anderson, R.P.; Schapire, R.E. Maximum Entropy Modeling of Species Geographic Distributions. Ecol. Model. 2006, 190, 231–259. [Google Scholar] [CrossRef]
  81. Phillips, S.J.; Anderson, R.P.; Dudík, M.; Schapire, R.E.; Blair, M.E. Opening the Black Box: An Open-source Release of Maxent. Ecography 2017, 40, 887–893. [Google Scholar] [CrossRef]
  82. Phillips, S.J.; Dudík, M. Modeling of Species Distributions with Maxent: New Extensions and a Comprehensive Evaluation. Ecography 2008, 31, 161–175. [Google Scholar] [CrossRef]
  83. Hastie, T.; Tibshirani, R.; Friedman, J.H.; Friedman, J.H. The Elements of Statistical Learning: Data Mining, Inference, and Prediction; Springer: Berlin/Heidelberg, Germany, 2009; Volume 2. [Google Scholar]
  84. Kass, J.M.; Muscarella, R.; Galante, P.J.; Bohl, C.L.; Pinilla-Buitrago, G.E.; Boria, R.A.; Soley-Guardia, M.; Anderson, R.P. ENMeval 2.0: Redesigned for Customizable and Reproducible Modeling of Species’ Niches and Distributions. Methods Ecol. Evol. 2021, 12, 1602–1608. [Google Scholar] [CrossRef]
  85. Muscarella, R.; Galante, P.J.; Soley-Guardia, M.; Boria, R.A.; Kass, J.M.; Uriarte, M.; Anderson, R.P. ENM Eval: An R Package for Conducting Spatially Independent Evaluations and Estimating Optimal Model Complexity for Maxent Ecological Niche Models. Methods Ecol. Evol. 2014, 5, 1198–1205. [Google Scholar] [CrossRef]
  86. Hanley, J.A.; McNeil, B.J. The Meaning and Use of the Area under a Receiver Operating Characteristic (ROC) Curve. Radiology 1982, 143, 29–36. [Google Scholar] [CrossRef] [PubMed]
  87. Peterson, A.T.; Soberón, J.; Pearson, R.G.; Anderson, R.P.; Martínez-Meyer, E.; Nakamura, M.A.; Araújo, M.B. Ecological Niches and Geographic Distributions (MPB-49); Princeton University Press: Princeton, NJ, USA, 2011. [Google Scholar]
  88. Warren, D.L.; Seifert, S.N. Ecological Niche Modeling in Maxent: The Importance of Model Complexity and the Performance of Model Selection Criteria. Ecol. Appl. 2011, 21, 335–342. [Google Scholar] [CrossRef] [PubMed]
  89. Fielding, A.H.; Bell, J.F. A Review of Methods for the Assessment of Prediction Errors in Conservation Presence/Absence Models. Environ. Conserv. 1997, 24, 38–49. [Google Scholar] [CrossRef]
  90. Burnham, K.P.; Anderson, D.R. Multimodel Inference: Understanding AIC and BIC in Model Selection. Sociol. Methods Res. 2004, 33, 261–304. [Google Scholar] [CrossRef]
  91. Kass, J.M.; Anderson, R.P.; Espinosa-Lucas, A.; Juárez-Jaimes, V.; Martínez-Salas, E.; Botello, F.; Tavera, G.; Flores-Martínez, J.J.; Sánchez-Cordero, V. Biotic Predictors with Phenological Information Improve Range Estimates for Migrating Monarch Butterflies in Mexico. Ecography 2020, 43, 341–352. [Google Scholar] [CrossRef]
  92. Radosavljevic, A.; Anderson, R.P. Making Better Maxent Models of Species Distributions: Complexity, Overfitting and Evaluation. J. Biogeogr. 2014, 41, 629–643. [Google Scholar] [CrossRef]
  93. Raes, N.; ter Steege, H. A Null-Model for Significance Testing of Presence-Only Species Distribution Models. Ecography 2007, 30, 727–736. [Google Scholar] [CrossRef]
  94. Bohl, C.L.; Kass, J.M.; Anderson, R.P. A New Null Model Approach to Quantify Performance and Significance for Ecological Niche Models of Species Distributions. J. Biogeogr. 2019, 46, 1101–1111. [Google Scholar] [CrossRef]
  95. Liu, C.; Berry, P.M.; Dawson, T.P.; Pearson, R.G. Selecting Thresholds of Occurrence in the Prediction of Species Distributions. Ecography 2005, 28, 385–393. [Google Scholar] [CrossRef]
  96. Hijmans, R.J.; Van Etten, J.; Cheng, J.; Mattiuzzi, M.; Sumner, M.; Greenberg, J.A.; Lamigueiro, O.P.; Bevan, A.; Racine, E.B.; Shortridge, A. Package ‘Raster’; R Package: Vienna, Austria, 2015; Volume 734, p. 473. [Google Scholar]
  97. Lamigueiro, O.P.; Hijmans, R. rasterVis: Visualization Methods for Raster Data. Available online: https://oscarperpinan.r-universe.dev/rasterVis (accessed on 2 October 2023).
  98. Wang, J.; Zhang, B.; He, W.; Yao, Y.; Zhang, W.; Zhao, C. A Quantitative Study on the Mass Elevation Effect of the Rocky Mountains and Its Significance for Treeline Distribution. Phys. Geogr. 2017, 38, 231–247. [Google Scholar] [CrossRef]
  99. Daubenmire, R. Alpine Timberlines in the Americas and Their Interpretation. Butl. Univ. Bot. Stud. 1954, 11, 119–136. [Google Scholar]
  100. Tranquillini, W. Climatic Resistance and Damage of Trees at Timberline. In Physiological Ecology of the Alpine Timberline: Tree Existence at High Altitudes with Special Reference to the European Alps; Tranquillini, W., Ed.; Ecological Studies; Springer: Berlin/Heidelberg, Germany, 1979; pp. 91–111. ISBN 978-3-642-67107-4. [Google Scholar]
  101. Rita, A.; Saracino, A.; Cieraad, E.; Saulino, L.; Zotti, M.; Idbella, M.; De Stefano, C.; Mogavero, V.; Allevato, E.; Bonanomi, G. Topoclimate Effect on Treeline Elevation Depends on the Regional Framework: A Contrast between Southern Alps (New Zealand) and Apennines (Italy) Forests. Ecol. Evol. 2023, 13, e9733. [Google Scholar] [CrossRef] [PubMed]
  102. Körner, C. A Re-Assessment of High Elevation Treeline Positions and Their Explanation. Oecologia 1998, 115, 445–459. [Google Scholar] [CrossRef]
  103. Li, P.H. Plant Cold Hardiness and Freezing Stress: Mechanisms and Crop Implications; Elsevier: Amsterdam, The Netherlands, 2012; ISBN 978-0-323-14307-3. [Google Scholar]
  104. Mani, M.S. Ecology and Biogeography of High Altitude Insects; Springer Science & Business Media: Berlin/Heidelberg, Germany, 2013; ISBN 978-94-017-1339-9. [Google Scholar]
  105. Laaribya, S.; Alaoui, A.; Ayan, S.; Benabou, A.; Labbaci, A.; Ouhaddou, H.; Bijou, M. Prediction by Maximum Entropy of Potential Habitat of the Cork Oak (Quercus suber L.) in Maamora Forest, Morocco. Forestist 2021, 71, 63–69. [Google Scholar] [CrossRef]
  106. Tuttu, G. Tosya (Kastamonu) Ilçesinin Florası ve Etnobotaniği; Çankırı Karatekin Üniversitesi, Orman Fakültesi, Orman Botaniği Bölümü, Fen Bilimleri Enstitüsü, Orman Mühendisliği Ana Bilim Dalı, Doktora Tezi: Çankırı City, Turkey, 2017; Volume 375. [Google Scholar]
  107. Mazza, G.; Monteverdi, M.C.; Altieri, S.; Battipaglia, G. Climate-Driven Growth Dynamics and Trend Reversal of Fagus Sylvatica L. and Quercus cerris L. in a Low-Elevation Beech Forest in Central Italy. Sci. Total Environ. 2024, 908, 168250. [Google Scholar] [CrossRef] [PubMed]
  108. Mészáros, I.; Adorján, B.; Nyitrai, B.; Kanalas, P.; Oláh, V.; Levanič, T. Long-Term Radial Growth and Climate-Growth Relationships of Quercus petraea (Matt.) Liebl. and Quercus cerris L. in a Xeric Low Elevation Site from Hungary. Dendrochronologia 2022, 76, 126014. [Google Scholar] [CrossRef]
  109. Móricz, N.; Rasztovits, E.; Gálos, B.; Berki, I.; Eredics, A.; Loibl, W. Modelling the Potential Distribution of Three Climate Zonal Tree Species for Present and Future Climate in Hungary. Acta Silv. Lignaria Hung. 2013, 9, 85–96. [Google Scholar] [CrossRef]
  110. Kasper, J.; Leuschner, C.; Walentowski, H.; Petritan, A.M.; Weigel, R. Winners and Losers of Climate Warming: Declining Growth in Fagus and Tilia vs. Stable Growth in Three Quercus Species in the Natural Beech–Oak Forest Ecotone (Western Romania). For. Ecol. Manag. 2022, 506, 119892. [Google Scholar] [CrossRef]
  111. Gür, H. The Anatolian Diagonal Revisited: Testing the Ecological Basis of a Biogeographic Boundary. Zool. Middle East 2016, 62, 189–199. [Google Scholar] [CrossRef]
  112. Farjon, A.; Filer, D. An Atlas of the World’s Conifers: An Analysis of Their Distribution, Biogeography, Diversity and Conservation Status; BRILL: Leiden, The Netherlands, 2013; ISBN 978-90-04-21181-0. [Google Scholar]
  113. Gardner, M. IUCN Red List of Threatened Species: Pinus Sylvestris. Available online: https://www.iucnredlist.org/en (accessed on 23 February 2024).
  114. Bulut, S.; Aytaş, İ. Modeling Potential Distribution and Above-Ground Biomass of Scots Pine (Pinus sylvestris L.) Forests in the Inner Anatolian Region, Türkiye. Environ. Monit. Assess. 2023, 195, 1471. [Google Scholar] [CrossRef]
  115. Yan, Y.; Tang, Z. Protecting Endemic Seed Plants on the Tibetan Plateau under Future Climate Change: Migration Matters. J. Plant Ecol. 2019, 12, 962–971. [Google Scholar] [CrossRef]
  116. Balcì, Y.; Halmschlager, E. Phytophthora Species in Oak Ecosystems in Turkey and Their Association with Declining Oak Trees. Plant Pathol. 2003, 52, 694–702. [Google Scholar] [CrossRef]
  117. Desprez-Loustau, M.L.; Massot, M.; Toïgo, M.; Fort, T.; Aday Kaya, A.G.; Boberg, J.; Braun, U.; Capdevielle, X.; Cech, T.; Chandelier, A.; et al. From Leaf to Continent: The Multi-Scale Distribution of an Invasive Cryptic Pathogen Complex on Oak. Fungal Ecol. 2018, 36, 39–50. [Google Scholar] [CrossRef]
  118. Colangelo, M.; Camarero, J.J.; Borghetti, M.; Gentilesca, T.; Oliva, J.; Redondo, M.-A.; Ripullone, F. Drought and Phytophthora Are Associated with the Decline of Oak Species in Southern Italy. Front. Plant Sci. 2018, 9, 1595. [Google Scholar] [CrossRef]
  119. Altın, T.B. Melendiz ve Keçiboyduran Dağları’nda Yanlış Arazi Kullanımının Vejetasyon Dağılışı Üzerindeki Etkileri. Turk. Geog. Rev. 2014, 51, 13–32. [Google Scholar] [CrossRef]
  120. Eken, G.; Isfendiyaroğlu, S.; Yeniyurt, C.; Erkol, I.L.; Karataş, A.; Ataol, M. Identifying Key Biodiversity Areas in Turkey: A Multi-Taxon Approach. Int. J. Biodivers. Sci. Ecosyst. Serv. Manag. 2016, 12, 181–190. [Google Scholar] [CrossRef]
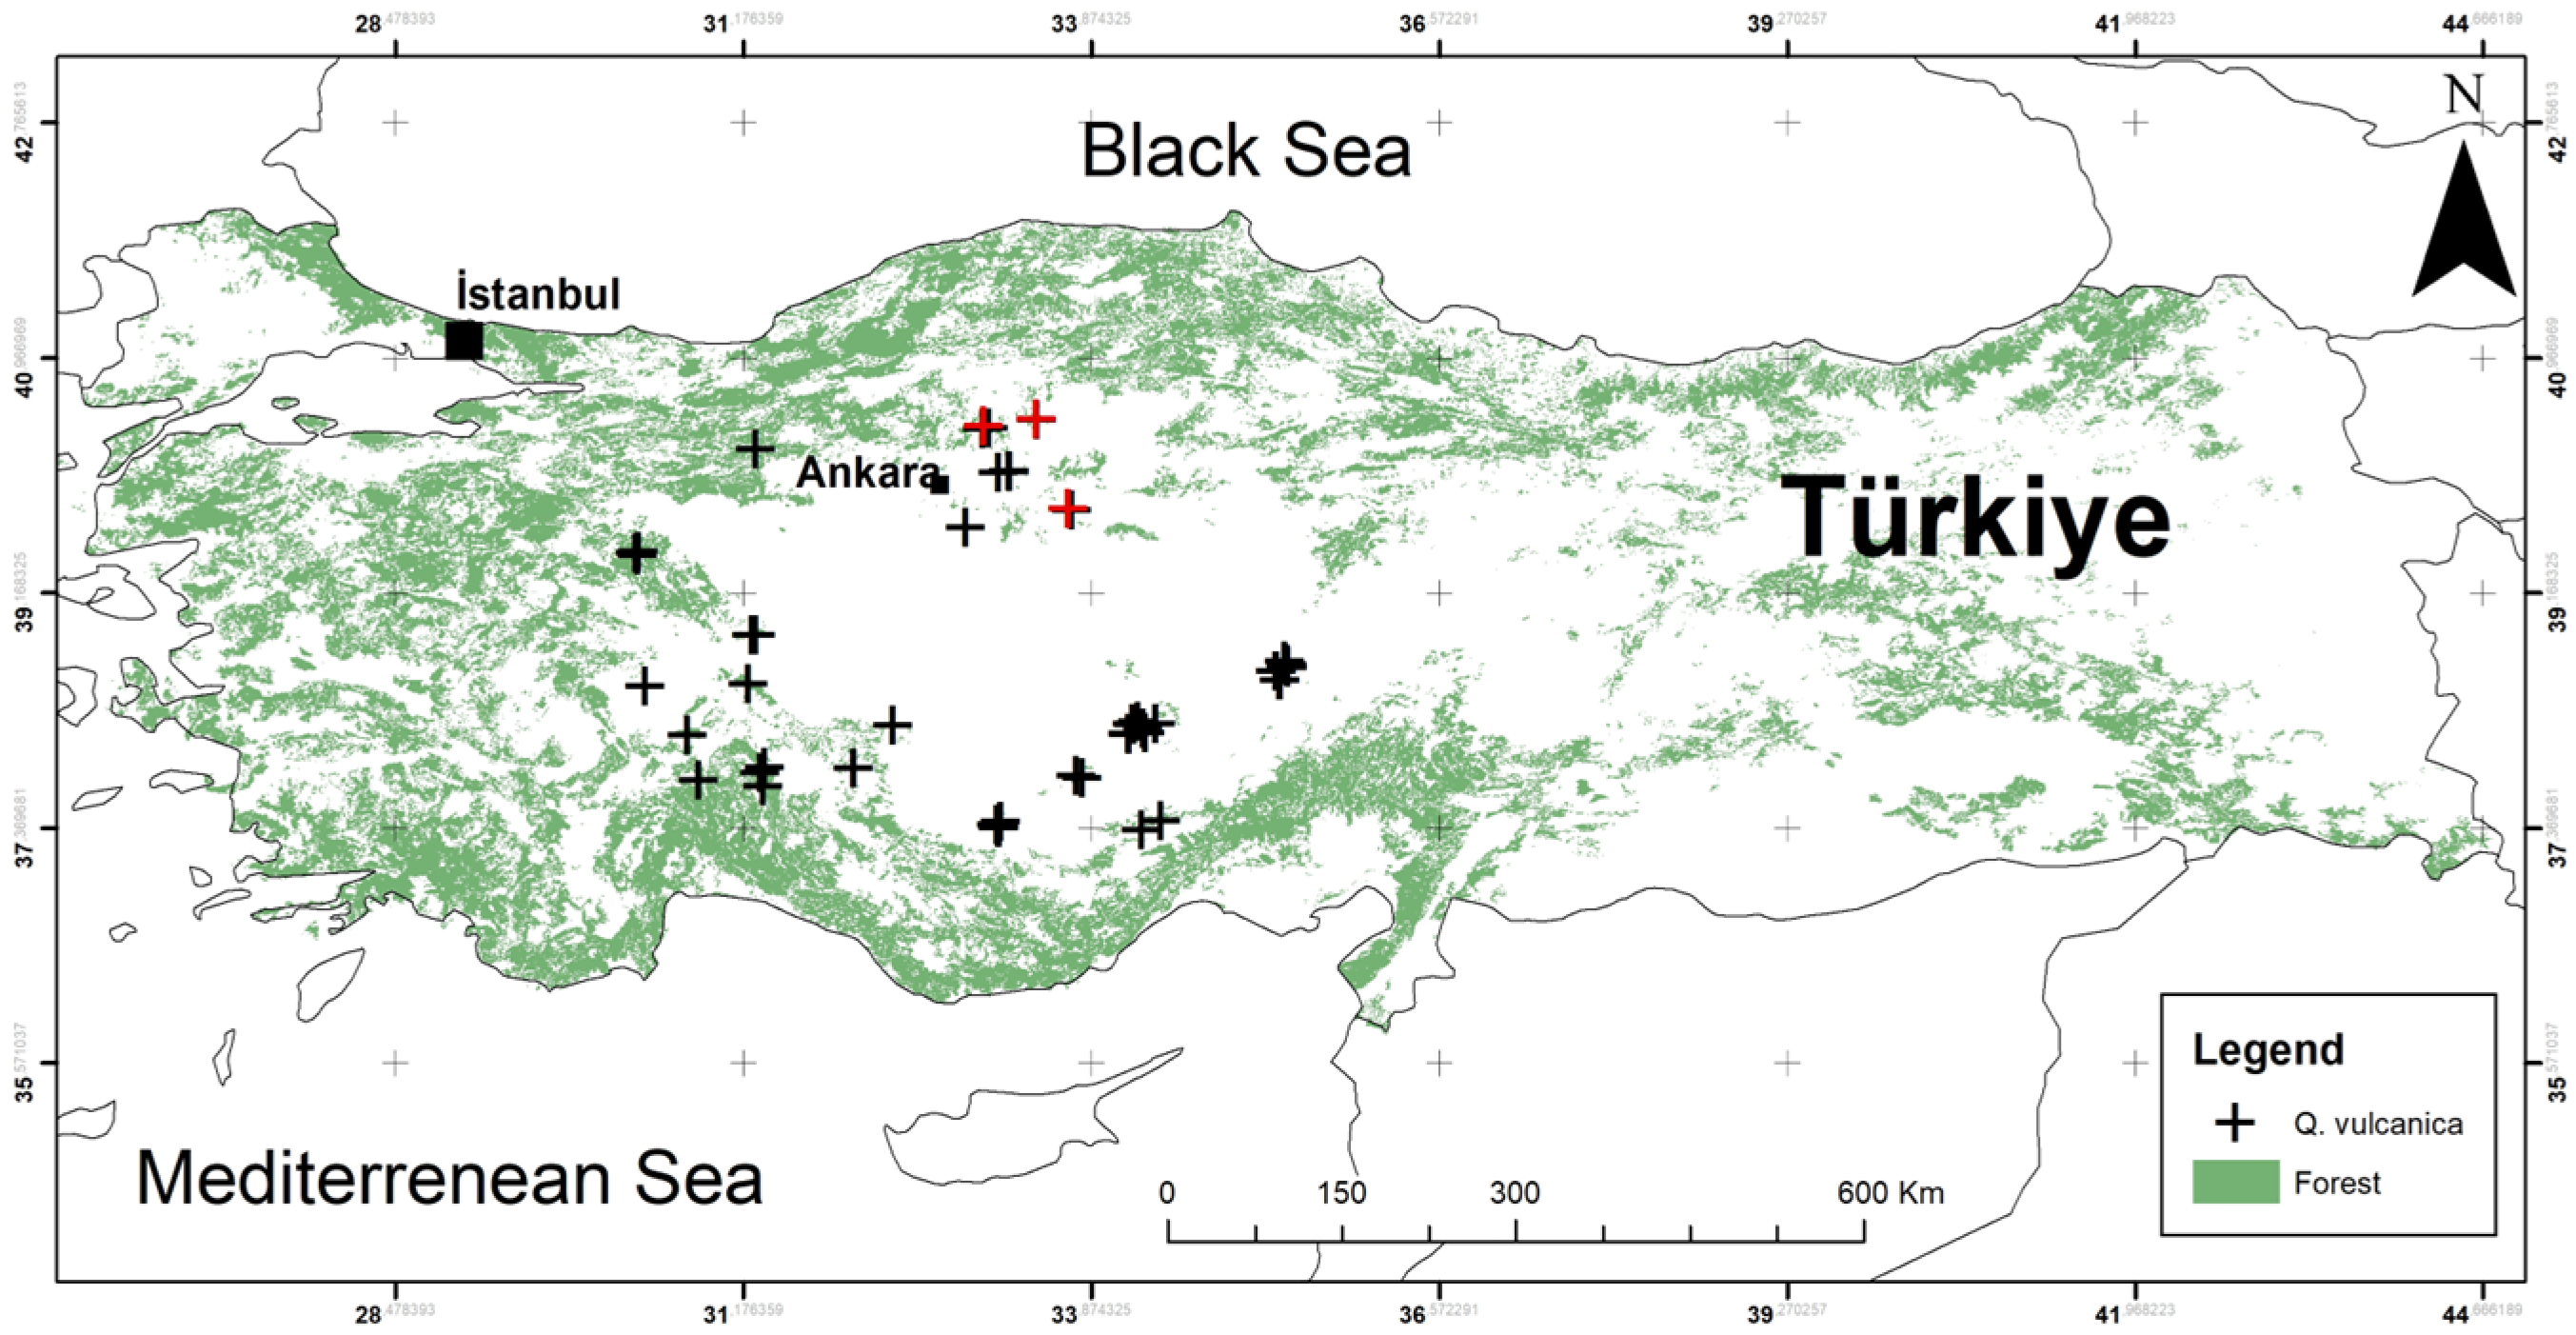
Figure 1. Geographic location of the study area and the distribution of occurrence data (red: new location) based on a recent field survey.
Forests 15 01551 g001
Figure 2. Average climate habitat suitability for the Kasnak oak projected to under the present-day climate conditions. The likelihood of occurrence varies from 0 (dark blue, representing low probability) to 1 (red, indicating the highest probability). White dots show occurrence records.
Forests 15 01551 g002
Figure 3. Projected average climate habitat suitability for the Kasnak oak during the Last Glacial Maximum (~21 k BP) climate conditions (for the explanation of other designations, please see Figure 2).
Forests 15 01551 g003
Figure 4. Average estimates of climate habitat suitability for Kasnak oak are shown under different future climate scenarios. The projections are presented for three time periods—2011–2040, 2041–2070, and 2071–2100—and three shared socioeconomic pathways: optimistic (SSP126), intermediate (SSP370), and pessimistic (SSP585). For the explanation of other designations, please see Figure 2).
Forests 15 01551 g004
Table 1. The summary statistics for bioclimatic variables related to the Kasnak oak (SE: standard error, SD: standard deviation).
MinMaxMedianMeanSESD
BIO1 = Annual Mean Temperature5.411.88.48.60.091.11
BIO2 = Mean Diurnal Range8.412.511.311.20.070.92
BIO3 = Isothermality0.30.40.30.30.000.02
BIO4 = Temperature Seasonality725.0866.6805.7805.32.9838.01
BIO5 = Max Temperature of Warmest Month23.128.425.725.60.101.24
BIO6 = Min Temperature of Coldest Month−12.7−4.2−7.5−7.60.111.47
BIO7 = Temperature Annual Range30.436.433.333.20.121.54
BIO8 = Mean Temperature of Wettest Quarter−2.512.32.13.60.313.94
BIO9 = Mean Temperature of Driest Quarter15.821.818.518.60.101.27
BIO10 = Mean Temperature of Warmest Quarter16.222.118.818.80.101.26
BIO11 = Mean Temperature of Coldest Quarter−6.01.6−1.7−1.80.101.21
BIO12 = Annual Precipitation439.81036.2635.8650.210.55134.73
BIO13 = Precipitation of Wettest Month57.1182.585.692.22.2128.24
BIO14 = Precipitation of Driest Month4.630.812.713.70.465.87
BIO15 = Precipitation Seasonality29.961.045.443.70.516.56
BIO16 = Precipitation of Wettest Quarter154.2462.3221.6239.35.3968.79
BIO17 = Precipitation of Driest Quarter24.6104.855.757.11.3417.12
BIO18 = Precipitation of Warmest Quarter45.9140.885.282.71.4118.05
BIO19 = Precipitation of Coldest Quarter135.8462.3190.4212.55.7373.21
Table 2. The gain (+)/loss (−) of the Kasnak oak in the future projections.
2011–2040 ssp 1262011–2040 ssp 3702011–2040 ssp 585
−3.36%−3.27%−3.41%
2041–2070 ssp 1262041–2070 ssp 3702041–2070 ssp 585
−4.29%−5.95%−6.50%
2071–2100 ssp 1262071–2100 ssp 3702071–2100 ssp 585
−4.01%−7.73%−7.88%
Disclaimer/Publisher’s Note: The statements, opinions and data contained in all publications are solely those of the individual author(s) and contributor(s) and not of MDPI and/or the editor(s). MDPI and/or the editor(s) disclaim responsibility for any injury to people or property resulting from any ideas, methods, instructions or products referred to in the content.