
The Future Possible Distribution of Kasnak Oak (Quercus vulcanica Boiss. & Heldr. ex Kotschy) in Anatolia under Climate Change Scenarios

 ,
,  ,
,  , , ,
, , , 
Abstract
:1. Introduction
2. Methods
2.1. Study Area and Occurrence Data
2.2. Environmental Data
2.3. Ecological Niche Modeling
3. Results
4. Discussion
5. Conclusions
Author Contributions
Funding
Data Availability Statement
Conflicts of Interest
Appendix A

| No | Variables | VIF |
|---|---|---|
| 1 | bio1 | 1116.272 |
| 2 | bio10 | 1633.319 |
| 3 | bio11 | 2504.198 |
| 4 | bio13 | 198.1605 |
| 5 | bio14 | 108.6452 |
| 6 | bio15 | 89.08824 |
| 7 | bio16 | 216.454 |
| 8 | bio17 | 179.5103 |
| 9 | bio18 | 78.39033 |
| 10 | bio19 | 134.9208 |
| 11 | bio2 | 836.5835 |
| 12 | bio3 | 546.6793 |
| 13 | bio4 | 1195.395 |
| 14 | bio5 | Inf |
| 15 | bio6 | Inf |
| 16 | bio7 | Inf |
| 17 | bio8 | 9.283976 |
| 18 | bio9 | 1806.588 |
| 19 | roughness | 61.90041 |
| 20 | slope | 63.14076 |
| 21 | tpi | 1.862045 |
| 22 | tri | 49.22961 |
| Variables | VIF | |
|---|---|---|
| 1 | bio1 | 2.831023 |
| 2 | bio13 | 3.378127 |
| 3 | bio14 | 4.316299 |
| 4 | bio15 | 6.405666 |
| 5 | bio3 | 1.133834 |
| 6 | bio4 | 1.570677 |
| 7 | slope | 1.615159 |
| 8 | tpi | 1.009307 |
| Statistic | AUCtrain | CBItrain | AUCdiff | mtp | OR10 |
|---|---|---|---|---|---|
| emp. mean | 0.975 | 0.939 | 0.040 | 0.029 | 0.103 |
| emp. sd | - | - | 0.442 | 1.383 | 2.487 |
| null. mean | 0.597 | 0.725 | 0.223 | 0.023 | 0.132 |
| null. sd | 0.032 | 0.245 | 0.028 | 0.122 | 0.165 |
| z-score | 11.593 | 0.875 | −6.550 | 0.050 | −0.179 |
| p-value | <0.001 | 0.191 | <0.001 | 0.520 | 0.429 |

References
- Günal, N. Türkiye’de Iklimin Doğal Bitki Örtüsü Üzerindeki Etkileri. Acta Turc. 2013, 1, 1–22. [Google Scholar]
- Pecl, G.T.; Araújo, M.B.; Bell, J.D.; Blanchard, J.; Bonebrake, T.C.; Chen, I.-C.; Clark, T.D.; Colwell, R.K.; Danielsen, F.; Evengård, B. Biodiversity Redistribution under Climate Change: Impacts on Ecosystems and Human Well-Being. Science 2017, 355, eaai9214. [Google Scholar] [CrossRef]
- Anderson, J.T.; Song, B.H. Plant Adaptation to Climate Change—Where Are We? J. Syst. Evol. 2020, 58, 533–545. [Google Scholar] [CrossRef] [PubMed]
- Román-Palacios, C.; Wiens, J.J. Recent Responses to Climate Change Reveal the Drivers of Species Extinction and Survival. Proc. Natl. Acad. Sci. USA 2020, 117, 4211–4217. [Google Scholar] [CrossRef]
- Bellard, C.; Jeschke, J.M.; Leroy, B.; Mace, G.M. Insights from Modeling Studies on How Climate Change Affects Invasive Alien Species Geography. Ecol. Evol. 2018, 8, 5688–5700. [Google Scholar] [CrossRef] [PubMed]
- Garcia, R.A.; Cabeza, M.; Rahbek, C.; Araújo, M.B. Multiple Dimensions of Climate Change and Their Implications for Biodiversity. Science 2014, 344, 1247579. [Google Scholar] [CrossRef]
- Li, G.; Huang, J.; Guo, H.; Du, S. Projecting Species Loss and Turnover under Climate Change for 111 Chinese Tree Species. For. Ecol. Manag. 2020, 477, 118488. [Google Scholar] [CrossRef]
- IPCC. Climate Change 2014: Synthesis Report. Contribution of Working Groups I, II and III to the Fifth Assessment Report of the Intergovernmental Panel on Climate Change; IPCC: Geneva, Switzerland, 2014. [Google Scholar]
- Thuiller, W. Climate Change and the Ecologist. Nature 2007, 448, 550–552. [Google Scholar] [CrossRef]
- Beaty, F.; Gehman, A.L.M.; Brownlee, G.; Harley, C.D.G. Not Just Range Limits: Warming Rate and Thermal Sensitivity Shape Climate Change Vulnerability in a Species Range Center. Ecology 2023, 104, e4183. [Google Scholar] [CrossRef]
- Maharjan, S.K.; Sterck, F.J.; Raes, N.; Zhao, Y.; Poorter, L. Climate Change Induced Elevational Range Shifts of Himalayan Tree Species. Biotropica 2023, 55, 53–69. [Google Scholar] [CrossRef]
- Hama, A.A.; Khwarahm, N.R. Predictive Mapping of Two Endemic Oak Tree Species under Climate Change Scenarios in a Semiarid Region: Range Overlap and Implications for Conservation. Ecol. Inform. 2023, 73, 101930. [Google Scholar] [CrossRef]
- Oliver, T.H.; Heard, M.S.; Isaac, N.J.B.; Roy, D.B.; Procter, D.; Eigenbrod, F.; Freckleton, R.; Hector, A.; Orme, C.D.L.; Petchey, O.L.; et al. Biodiversity and Resilience of Ecosystem Functions. Trends Ecol. Evol. 2015, 30, 673–684. [Google Scholar] [CrossRef] [PubMed]
- Timpane-Padgham, B.L.; Beechie, T.; Klinger, T. A Systematic Review of Ecological Attributes That Confer Resilience to Climate Change in Environmental Restoration. PLoS ONE 2017, 12, e0173812. [Google Scholar] [CrossRef] [PubMed]
- Thompson, I.; Mackey, B.; McNulty, S.; Mosseler, A. Forest Resilience, Biodiversity, and Climate Change—A synthesis of the Biodiversity/Resilience/Stability Relationship in Forest Ecosystems. In Secretariat of the Convention on Biological Diversity, Montreal; Technical Series; Secretariat of the Convention on Biological Diversity: Montreal, QC, Canada, 2009; Volume 43, pp. 1–67. [Google Scholar]
- Côté, I.M.; Darling, E.S. Rethinking Ecosystem Resilience in the Face of Climate Change. PLoS Biol. 2010, 8, e1000438. [Google Scholar] [CrossRef] [PubMed]
- Moritz, C.; Agudo, R. The Future of Species Under Climate Change: Resilience or Decline? Science 2013, 341, 504–508. [Google Scholar] [CrossRef]
- Hoffmann, A.A.; Rymer, P.D.; Byrne, M.; Ruthrof, K.X.; Whinam, J.; McGeoch, M.; Bergstrom, D.M.; Guerin, G.R.; Sparrow, B.; Joseph, L.; et al. Impacts of Recent Climate Change on Terrestrial Flora and Fauna: Some Emerging Australian Examples. Austral Ecol. 2019, 44, 3–27. [Google Scholar] [CrossRef]
- Taleshi, H.; Jalali, S.G.; Alavi, S.J.; Hosseini, S.M.; Naimi, B.; Zimmermann, N.E. Climate Change Impacts on the Distribution and Diversity of Major Tree Species in the Temperate Forests of Northern Iran. Reg. Environ. Change 2019, 19, 2711–2728. [Google Scholar] [CrossRef]
- Emberger, L. A Biogeographic Classification of Climates. Rec. Trav. Bot. Lab. Bot. Geol. Zool. Univ. Montp. Bot. Ser. 1955, 7, 3–43. [Google Scholar]
- Al-Qaddi, N.; Vessella, F.; Stephan, J.; Al-Eisawi, D.; Schirone, B. Current and Future Suitability Areas of Kermes Oak (Quercus coccifera L.) in the Levant under Climate Change. Reg. Environ. Change 2017, 17, 143–156. [Google Scholar] [CrossRef]
- Stephan, J.; Bercachy, C.; Bechara, J.; Charbel, E.; López-Tirado, J. Local Ecological Niche Modelling to Provide Suitability Maps for 27 Forest Tree Species in Edge Conditions. iforest—Biogeosci. For. 2020, 13, 230. [Google Scholar] [CrossRef]
- Elith, J.; Leathwick, J.R. Species Distribution Models: Ecological Explanation and Prediction Across Space and Time. Annu. Rev. Ecol. Evol. Syst. 2009, 40, 677–697. [Google Scholar] [CrossRef]
- López-Tirado, J.; Vessella, F.; Stephan, J.; Ayan, S.; Schirone, B.; Hidalgo, P.J. Effect of Climate Change on Potential Distribution of Cedrus Libani A. Rich in the Twenty-First Century: An Ecological Niche Modeling Assessment. New For. 2021, 52, 363–376. [Google Scholar] [CrossRef]
- Hending, D.; Holderied, M.; McCabe, G.; Cotton, S. Effects of Future Climate Change on the Forests of Madagascar. Ecosphere 2022, 13, e4017. [Google Scholar] [CrossRef]
- Ayan, S.; Buğday, E.; Varol, T.; Özel, H.B.; Thurm, E.A. Effect of Climate Change on Potential Distribution of Oriental Beech (Fagus orientalis Lipsky.) in the Twenty-First Century in Turkey. Theor. Appl. Climatol. 2022, 148, 165–177. [Google Scholar] [CrossRef]
- Grondin, P.; Brice, M.-H.; Boulanger, Y.; Morneau, C.; Couillard, P.-L.; Richard, P.J.H.; Chalumeau, A.; Poirier, V. Ecological Classification in Forest Ecosystem Management: Links Between Current Practices and Future Climate Change in a Québec Case Study. In Boreal Forests in the Face of Climate Change: Sustainable Management; Girona, M.M., Morin, H., Gauthier, S., Bergeron, Y., Eds.; Advances in Global Change Research; Springer International Publishing: Cham, Switzerland, 2023; pp. 219–246. ISBN 978-3-031-15988-6. [Google Scholar]
- Vessella, F.; Simeone, M.C.; Schirone, B. Quercus suber Range Dynamics by Ecological Niche Modelling: From the Last Interglacial to Present Time. Quat. Sci. Rev. 2015, 119, 85–93. [Google Scholar] [CrossRef]
- Suicmez, B.; Avci, M. Distribution Patterns of Quercus ilex from the Last Interglacial Period to the Future by Ecological Niche Modeling. Ecol. Evol. 2023, 13, e10606. [Google Scholar] [CrossRef]
- Yilmaz, O.Y.; Akkemik, Ü.; Dogan, Ö.H.; Yilmaz, H.; Sevgi, O.; Sevgi, E. The Missing Part of the Past, Current, and Future Distribution Model of Quercus ilex L.: The Eastern Edge. Iforest—Biogeosci. For. 2024, 17, 90. [Google Scholar] [CrossRef]
- Douaihy, B.; Saliba, C.; Stephan, J.; Simeone, M.C.; Cardoni, S.; Farhat, P.; Bou Dagher Kharrat, M. Tracking Diversity and Evolutionary Pathways of Lebanese Oak Taxa through Plastome Analyses. Bot. Lett. 2020, 167, 315–330. [Google Scholar] [CrossRef]
- Ülker, E.D.; Tavşanoğlu, Ç.; Perktaş, U. Ecological Niche Modelling of Pedunculate Oak (Quercus robur) Supports the ‘Expansion–Contraction’ Model of Pleistocene Biogeography. Biol. J. Linn. Soc. 2018, 123, 338–347. [Google Scholar] [CrossRef]
- Ramírez-Preciado, R.P.; Gasca-Pineda, J.; Arteaga, M.C. Effects of Global Warming on the Potential Distribution Ranges of Six Quercus Species (Fagaceae). Flora 2019, 251, 32–38. [Google Scholar] [CrossRef]
- Saran, S.; Joshi, R.; Sharma, S.; Padalia, H.; Dadhwal, V.K. Geospatial Modeling of Brown Oak (Quercus semecarpifolia) Habitats in the Kumaun Himalaya under Climate Change Scenario. J. Indian Soc. Remote Sens. 2010, 38, 535–547. [Google Scholar] [CrossRef]
- Dhyani, S.; Kadaverugu, R.; Pujari, P. Predicting Impacts of Climate Variability on Banj Oak (Quercus leucotrichophora A. Camus) Forests: Understanding Future Implications for Central Himalayas. Reg. Environ. Change 2020, 20, 113. [Google Scholar] [CrossRef]
- Türkeş, M. Küresel ve Bölgesel Iklim Değişikliklerinin Anadolu Coğrafyasına Etkileri. Bilim ve Ütopya 2018, 292, 37–44. [Google Scholar]
- Yılmaz, E. Yüksek Çözünürlüklü ERA-Interim ve HadGEM2-CC Model Verilerine Göre Türkiye’nin Güncel ve Gelecekteki Holdridge Ekolojik Bölgeleri. Coğrafi Bilim. Derg. 2021, 19, 29–60. [Google Scholar] [CrossRef]
- Yılmaz, E.; Çiçek, İ. Detailed Köppen-Geiger Climate Regions of Turkey Türkiye’nin Detaylandırılmış Köppen-Geiger Iklim Bölgeleri. J. Hum. Sci. 2018, 15, 225–242. [Google Scholar] [CrossRef]
- Yılmaz, H. Türkiye’nin Bütün Ağaçları ve Çalıları-Fagaceae; Türkiye İş Bankası Kültür Yayınları: Beyoğlu, Turkey, 2020. [Google Scholar]
- Avcı, M. Endemik Bir Meşe Türü, Kasnak Meşesi (Quercus vulcanica (Boiss. Heldr. Ex) Kotschy)’nin Türkiye’deki Yeni Bir Yayılış Alanı. Türk Coğrafya Derg. 1996, 31, 283–289. [Google Scholar]
- Birol, S.Ö.; Özel, N.; Gugger, P.; Özkan, K. Endemik kasnak meşesinin (Quercus vulcanica [Boiss. and Heldr. ex] Kotschy) yeni bir yayılış alanı. Turk. J. For. 2020, 21, 6–14. [Google Scholar] [CrossRef]
- Kasaplıgil, B.; Yılmaz, N. Türkiye’nin Geçmişteki ve Bugünkü Meşe Türleri; Orman Bakanlığı Orman Genel Müdürlüğü: Yenimahalle, Turkey, 1992; ISBN 975-407-012-1. [Google Scholar]
- Çevre, K. İç Anadolu’nun Kalıntı Ormanları; Kırsal Çevre ve Ormancılık Sorunları Araştırma Derneği, Arkadaş Basım Sanayi Ltd.: Ankara, Turkey, 2019. [Google Scholar]
- Yaltırık, F. Türkiye Meşeleri: Teşhis Kılavuzu; Yenilik Basımevi: Beyoğlu/Istanbul, Turkey, 1984. [Google Scholar]
- Soberón, J.; Peterson, A.T. Interpretation of Models of Fundamental Ecological Niches and Species’ Distributional Areas. Biodiversity Informatics 2005, 2, 1–10. [Google Scholar] [CrossRef]
- Davis, P.H. Flora of Turkey and the East Aegean Islands; Edinburgh University Press: Edinburgh, UK, 1970; Volume 3. [Google Scholar]
- Kayacık Orman ve Park Ağaçlarının Özel Sistematiği; Cilt II; İÜ Orman Fakültesi: İstanbul, Turkey, 1981.
- Hedge, I.C.; Yaltirik, F. The Oaks of Turkey. International Oaks 1994, 3–22. [Google Scholar]
- Çetik, A.R. Türkiye Vejetasyonu: İç Anadolu’nun Vejetasyonu ve Ekolojisi. I; Selçuk Üniversitesi: Edinburgh, UK, 1985. [Google Scholar]
- Akman, Y. Turkiye Orman Vejetasyonu: Kuzey Anadolu Orman Vejetasyonu; Kariyer Matbaacılık Ankara: Ankara, Turkey, 1995. [Google Scholar]
- Avcı, M. İç Anadolu Bölgesi Ormanlarının Son Sığınakları: Karacadağ ve Karadağ Volkanlarının Bitki Örtüsü; Çantay Kitabevi: İstanbul, Turkey, 2004. [Google Scholar]
- Mayer, H.; Aksoy, H. Türkiye Ormanları, Orman Bakanlığı Batı Karadeniz Ormancılık; Araştırma Müdürlüğü Yayını: Bolu, Turkey, 1998. [Google Scholar]
- Çinar-Yilmaz, H. Türkiyenin Endemik Meşe (Quercus L.) Taksonlarının Morfolojik Özellikleri; Istanbul University: Istanbul, Turkey, 1998. [Google Scholar]
- Aydınözü, D. Kasnak Meşesi (Quercus vulcanica (Boiss. and Heldr. Ex) Kotschy)’nin Türkiye’deki Ikinci Yeni Bir Yayılış Alanı. Marmara Coğrafya Derg. 2004, 9, 89–96. [Google Scholar]
- Kargıoğlu, M.; Şenkul, Ç.; Serteser, A.; Konuk, M. Bioclimatic Requirements of Quercus vulcanica Boiss and Heldr. ex Kotschy An Endemic Species in Turkey. Pol. J. Ecol. 2009, 57, 197–200. [Google Scholar]
- Genç, M.; Güner, Ş.T.; Çömez, A.; Deligöz, A.; Yıldız, D. Kasnak Meşesinin Quercus vulcanica Boiss. and Heldr. Ex Kotschy) Ekolojisi ve Meşcere Kuruluş Özellikleri; T.C. Orman Ve Su Işleri Bakanlığı, Orman Genel Müdürlüğü, Orman Toprak Ve Ekoloji Araştırmaları Enstitüsü Müdürlüğü: Ankara City, Turkey, 2011; ISBN 978-605-393-111-9. [Google Scholar]
- Karataş, R.; Arslan, M.; Güner, Ş.; Çömez, A.; Özkan, K. Göller Bölgesindeki Doğal Yayılış Alanlarında Kasnak Meşesinin (Quercus vulcanica Boiss. and Heldr. Ex Kotschy) Boy Gelişimi Ile Yetişme Ortamı Özellikleri Arasındaki Ilişkiler; T.C. Orman ve Su İşleri Bakanlığı, Orman Genel Müdürlüğü, Orman Toprak ve Ekoloji Araştırmaları Enstitüsü Müdürlüğü Yayın: Ankara City, Turkey, 2013. [Google Scholar]
- Kurt, L.; Akman, Y.; Quézel, P.; Ekim, T.; Demiryürek, E. Etude synécologique des forêts de Quercus vulcanica des environs d’Isparta-Egirdir (Turquie). Ecol. Mediterr. 1996, 22, 53–57. [Google Scholar] [CrossRef]
- Sarıkaya, A.G.; Örücü, Ö.K.; Şen, İ.; Sarıkaya, O. Modelling the Potential Distribution of the Endemic Oak Quercus vulcanica Boiss. & Heldr. ex Kotschy in Turkey from the Last Interglacial to the Future: From near Threatened to Endangered. Dendrobiology 2022, 88, 70–80. [Google Scholar]
- Boria, R.A.; Olson, L.E.; Goodman, S.M.; Anderson, R.P. Spatial Filtering to Reduce Sampling Bias Can Improve the Performance of Ecological Niche Models. Ecol. Model. 2014, 275, 73–77. [Google Scholar] [CrossRef]
- Fourcade, Y.; Engler, J.O.; Rödder, D.; Secondi, J. Mapping Species Distributions with MAXENT Using a Geographically Biased Sample of Presence Data: A Performance Assessment of Methods for Correcting Sampling Bias. PLoS ONE 2014, 9, e97122. [Google Scholar] [CrossRef] [PubMed]
- Merow, C.; Smith, M.J.; Silander Jr, J.A. A Practical Guide to MaxEnt for Modeling Species’ Distributions: What It Does, and Why Inputs and Settings Matter. Ecography 2013, 36, 1058–1069. [Google Scholar] [CrossRef]
- Sillero, N.; Arenas-Castro, S.; Enriquez-Urzelai, U.; Vale, C.G.; Sousa-Guedes, D.; Martínez-Freiría, F.; Real, R.; Barbosa, A.M. Want to Model a Species Niche? A Step-by-Step Guideline on Correlative Ecological Niche Modelling. Ecol. Model. 2021, 456, 109671. [Google Scholar] [CrossRef]
- Aiello-Lammens, M.E.; Boria, R.A.; Radosavljevic, A.; Vilela, B.; Anderson, R.P. spThin: An R Package for Spatial Thinning of Species Occurrence Records for Use in Ecological Niche Models. Ecography 2015, 38, 541–545. [Google Scholar] [CrossRef]
- Fick, S.E.; Hijmans, R.J. WorldClim 2: New 1-km Spatial Resolution Climate Surfaces for Global Land Areas. Int. J. Climatol. 2017, 37, 4302–4315. [Google Scholar] [CrossRef]
- Karger, D.N.; Conrad, O.; Böhner, J.; Kawohl, T.; Kreft, H.; Soria-Auza, R.W.; Zimmermann, N.E.; Linder, H.P.; Kessler, M. Climatologies at High Resolution for the Earth’s Land Surface Areas. Sci. Data 2017, 4, 170122. [Google Scholar] [CrossRef]
- Karger, D.N.; Kessler, M.; Lehnert, M.; Jetz, W. Limited Protection and Ongoing Loss of Tropical Cloud Forest Biodiversity and Ecosystems Worldwide. Nat. Ecol. Evol. 2021, 5, 854–862. [Google Scholar] [CrossRef] [PubMed]
- Brun, P.; Zimmermann, N.E.; Hari, C.; Pellissier, L.; Karger, D.N. Global Climate-Related Predictors at Kilometer Resolution for the Past and Future. Earth Syst. Sci. Data 2022, 14, 5573–5603. [Google Scholar] [CrossRef]
- Amatulli, G.; Domisch, S.; Tuanmu, M.-N.; Parmentier, B.; Ranipeta, A.; Malczyk, J.; Jetz, W. A Suite of Global, Cross-Scale Topographic Variables for Environmental and Biodiversity Modeling. Sci. Data 2018, 5, 1–15. [Google Scholar] [CrossRef] [PubMed]
- Naimi, B.; Araújo, M.B. Sdm: A Reproducible and Extensible R Platform for Species Distribution Modelling. Ecography 2016, 39, 368–375. [Google Scholar] [CrossRef]
- Guisan, A.; Thuiller, W.; Zimmermann, N.E. Habitat Suitability and Distribution Models: With Applications in R; Cambridge University Press: Cambridge, UK, 2017. [Google Scholar]
- Campbell, L.P.; Luther, C.; Moo-Llanes, D.; Ramsey, J.M.; Danis-Lozano, R.; Peterson, A.T. Climate Change Influences on Global Distributions of Dengue and Chikungunya Virus Vectors. Philos. Trans. R. Soc. B Biol. Sci. 2015, 370, 20140135. [Google Scholar] [CrossRef]
- Escobar, L.E.; Lira-Noriega, A.; Medina-Vogel, G.; Peterson, A.T. Potential for Spread of the White-Nose Fungus (Pseudogymnoascus Destructans) in the Americas: Use of Maxent and NicheA to Assure Strict Model Transference. Geospat. Health 2014, 9, 221–229. [Google Scholar] [CrossRef]
- Dunne, J.P.; Horowitz, L.W.; Adcroft, A.J.; Ginoux, P.; Held, I.M.; John, J.G.; Krasting, J.P.; Malyshev, S.; Naik, V.; Paulot, F. The GFDL Earth System Model Version 4.1 (GFDL-ESM 4.1): Overall Coupled Model Description and Simulation Characteristics. J. Adv. Model. Earth Syst. 2020, 12, e2019MS002015. [Google Scholar] [CrossRef]
- Tang, Y.; Rumbold, S.; Ellis, R.; Kelley, D.; Mulcahy, J.; Sellar, A.; Walton, J.; Jones, C. MOHC UKESM1. 0-LL Model Output Prepared for CMIP6 CMIP; World Data Center for Climate (WDCC): Hamburg, Germany, 2019. [Google Scholar]
- Müller, W.A.; Jungclaus, J.H.; Mauritsen, T.; Baehr, J.; Bittner, M.; Budich, R.; Bunzel, F.; Esch, M.; Ghosh, R.; Haak, H. A Higher-resolution Version of the Max Planck Institute Earth System Model (MPI-ESM1. 2-HR). J. Adv. Model. Earth Syst. 2018, 10, 1383–1413. [Google Scholar] [CrossRef]
- Boucher, O.; Servonnat, J.; Albright, A.L.; Aumont, O.; Balkanski, Y.; Bastrikov, V.; Bekki, S.; Bonnet, R.; Bony, S.; Bopp, L.; et al. Presentation and Evaluation of the IPSL-CM6A-LR Climate Model. J. Adv. Model. Earth Syst. 2020, 12, e2019MS002010. [Google Scholar] [CrossRef]
- Yukimoto, S.; Kawai, H.; Koshiro, T.; Oshima, N.; Yoshida, K.; Urakawa, S.; Tsujino, H.; Deushi, M.; Tanaka, T.; Hosaka, M. The Meteorological Research Institute Earth System Model Version 2.0, MRI-ESM2. 0: Description and Basic Evaluation of the Physical Component. J. Meteorol. Soc. Japan. Ser. II 2019, 97, 931–965. [Google Scholar] [CrossRef]
- Sanderson, B.M.; Knutti, R.; Caldwell, P. A Representative Democracy to Reduce Interdependency in a Multimodel Ensemble. J. Clim. 2015, 28, 5171–5194. [Google Scholar] [CrossRef]
- Phillips, S.J.; Anderson, R.P.; Schapire, R.E. Maximum Entropy Modeling of Species Geographic Distributions. Ecol. Model. 2006, 190, 231–259. [Google Scholar] [CrossRef]
- Phillips, S.J.; Anderson, R.P.; Dudík, M.; Schapire, R.E.; Blair, M.E. Opening the Black Box: An Open-source Release of Maxent. Ecography 2017, 40, 887–893. [Google Scholar] [CrossRef]
- Phillips, S.J.; Dudík, M. Modeling of Species Distributions with Maxent: New Extensions and a Comprehensive Evaluation. Ecography 2008, 31, 161–175. [Google Scholar] [CrossRef]
- Hastie, T.; Tibshirani, R.; Friedman, J.H.; Friedman, J.H. The Elements of Statistical Learning: Data Mining, Inference, and Prediction; Springer: Berlin/Heidelberg, Germany, 2009; Volume 2. [Google Scholar]
- Kass, J.M.; Muscarella, R.; Galante, P.J.; Bohl, C.L.; Pinilla-Buitrago, G.E.; Boria, R.A.; Soley-Guardia, M.; Anderson, R.P. ENMeval 2.0: Redesigned for Customizable and Reproducible Modeling of Species’ Niches and Distributions. Methods Ecol. Evol. 2021, 12, 1602–1608. [Google Scholar] [CrossRef]
- Muscarella, R.; Galante, P.J.; Soley-Guardia, M.; Boria, R.A.; Kass, J.M.; Uriarte, M.; Anderson, R.P. ENM Eval: An R Package for Conducting Spatially Independent Evaluations and Estimating Optimal Model Complexity for Maxent Ecological Niche Models. Methods Ecol. Evol. 2014, 5, 1198–1205. [Google Scholar] [CrossRef]
- Hanley, J.A.; McNeil, B.J. The Meaning and Use of the Area under a Receiver Operating Characteristic (ROC) Curve. Radiology 1982, 143, 29–36. [Google Scholar] [CrossRef] [PubMed]
- Peterson, A.T.; Soberón, J.; Pearson, R.G.; Anderson, R.P.; Martínez-Meyer, E.; Nakamura, M.A.; Araújo, M.B. Ecological Niches and Geographic Distributions (MPB-49); Princeton University Press: Princeton, NJ, USA, 2011. [Google Scholar]
- Warren, D.L.; Seifert, S.N. Ecological Niche Modeling in Maxent: The Importance of Model Complexity and the Performance of Model Selection Criteria. Ecol. Appl. 2011, 21, 335–342. [Google Scholar] [CrossRef] [PubMed]
- Fielding, A.H.; Bell, J.F. A Review of Methods for the Assessment of Prediction Errors in Conservation Presence/Absence Models. Environ. Conserv. 1997, 24, 38–49. [Google Scholar] [CrossRef]
- Burnham, K.P.; Anderson, D.R. Multimodel Inference: Understanding AIC and BIC in Model Selection. Sociol. Methods Res. 2004, 33, 261–304. [Google Scholar] [CrossRef]
- Kass, J.M.; Anderson, R.P.; Espinosa-Lucas, A.; Juárez-Jaimes, V.; Martínez-Salas, E.; Botello, F.; Tavera, G.; Flores-Martínez, J.J.; Sánchez-Cordero, V. Biotic Predictors with Phenological Information Improve Range Estimates for Migrating Monarch Butterflies in Mexico. Ecography 2020, 43, 341–352. [Google Scholar] [CrossRef]
- Radosavljevic, A.; Anderson, R.P. Making Better Maxent Models of Species Distributions: Complexity, Overfitting and Evaluation. J. Biogeogr. 2014, 41, 629–643. [Google Scholar] [CrossRef]
- Raes, N.; ter Steege, H. A Null-Model for Significance Testing of Presence-Only Species Distribution Models. Ecography 2007, 30, 727–736. [Google Scholar] [CrossRef]
- Bohl, C.L.; Kass, J.M.; Anderson, R.P. A New Null Model Approach to Quantify Performance and Significance for Ecological Niche Models of Species Distributions. J. Biogeogr. 2019, 46, 1101–1111. [Google Scholar] [CrossRef]
- Liu, C.; Berry, P.M.; Dawson, T.P.; Pearson, R.G. Selecting Thresholds of Occurrence in the Prediction of Species Distributions. Ecography 2005, 28, 385–393. [Google Scholar] [CrossRef]
- Hijmans, R.J.; Van Etten, J.; Cheng, J.; Mattiuzzi, M.; Sumner, M.; Greenberg, J.A.; Lamigueiro, O.P.; Bevan, A.; Racine, E.B.; Shortridge, A. Package ‘Raster’; R Package: Vienna, Austria, 2015; Volume 734, p. 473. [Google Scholar]
- Lamigueiro, O.P.; Hijmans, R. rasterVis: Visualization Methods for Raster Data. Available online: https://oscarperpinan.r-universe.dev/rasterVis (accessed on 2 October 2023).
- Wang, J.; Zhang, B.; He, W.; Yao, Y.; Zhang, W.; Zhao, C. A Quantitative Study on the Mass Elevation Effect of the Rocky Mountains and Its Significance for Treeline Distribution. Phys. Geogr. 2017, 38, 231–247. [Google Scholar] [CrossRef]
- Daubenmire, R. Alpine Timberlines in the Americas and Their Interpretation. Butl. Univ. Bot. Stud. 1954, 11, 119–136. [Google Scholar]
- Tranquillini, W. Climatic Resistance and Damage of Trees at Timberline. In Physiological Ecology of the Alpine Timberline: Tree Existence at High Altitudes with Special Reference to the European Alps; Tranquillini, W., Ed.; Ecological Studies; Springer: Berlin/Heidelberg, Germany, 1979; pp. 91–111. ISBN 978-3-642-67107-4. [Google Scholar]
- Rita, A.; Saracino, A.; Cieraad, E.; Saulino, L.; Zotti, M.; Idbella, M.; De Stefano, C.; Mogavero, V.; Allevato, E.; Bonanomi, G. Topoclimate Effect on Treeline Elevation Depends on the Regional Framework: A Contrast between Southern Alps (New Zealand) and Apennines (Italy) Forests. Ecol. Evol. 2023, 13, e9733. [Google Scholar] [CrossRef] [PubMed]
- Körner, C. A Re-Assessment of High Elevation Treeline Positions and Their Explanation. Oecologia 1998, 115, 445–459. [Google Scholar] [CrossRef]
- Li, P.H. Plant Cold Hardiness and Freezing Stress: Mechanisms and Crop Implications; Elsevier: Amsterdam, The Netherlands, 2012; ISBN 978-0-323-14307-3. [Google Scholar]
- Mani, M.S. Ecology and Biogeography of High Altitude Insects; Springer Science & Business Media: Berlin/Heidelberg, Germany, 2013; ISBN 978-94-017-1339-9. [Google Scholar]
- Laaribya, S.; Alaoui, A.; Ayan, S.; Benabou, A.; Labbaci, A.; Ouhaddou, H.; Bijou, M. Prediction by Maximum Entropy of Potential Habitat of the Cork Oak (Quercus suber L.) in Maamora Forest, Morocco. Forestist 2021, 71, 63–69. [Google Scholar] [CrossRef]
- Tuttu, G. Tosya (Kastamonu) Ilçesinin Florası ve Etnobotaniği; Çankırı Karatekin Üniversitesi, Orman Fakültesi, Orman Botaniği Bölümü, Fen Bilimleri Enstitüsü, Orman Mühendisliği Ana Bilim Dalı, Doktora Tezi: Çankırı City, Turkey, 2017; Volume 375. [Google Scholar]
- Mazza, G.; Monteverdi, M.C.; Altieri, S.; Battipaglia, G. Climate-Driven Growth Dynamics and Trend Reversal of Fagus Sylvatica L. and Quercus cerris L. in a Low-Elevation Beech Forest in Central Italy. Sci. Total Environ. 2024, 908, 168250. [Google Scholar] [CrossRef] [PubMed]
- Mészáros, I.; Adorján, B.; Nyitrai, B.; Kanalas, P.; Oláh, V.; Levanič, T. Long-Term Radial Growth and Climate-Growth Relationships of Quercus petraea (Matt.) Liebl. and Quercus cerris L. in a Xeric Low Elevation Site from Hungary. Dendrochronologia 2022, 76, 126014. [Google Scholar] [CrossRef]
- Móricz, N.; Rasztovits, E.; Gálos, B.; Berki, I.; Eredics, A.; Loibl, W. Modelling the Potential Distribution of Three Climate Zonal Tree Species for Present and Future Climate in Hungary. Acta Silv. Lignaria Hung. 2013, 9, 85–96. [Google Scholar] [CrossRef]
- Kasper, J.; Leuschner, C.; Walentowski, H.; Petritan, A.M.; Weigel, R. Winners and Losers of Climate Warming: Declining Growth in Fagus and Tilia vs. Stable Growth in Three Quercus Species in the Natural Beech–Oak Forest Ecotone (Western Romania). For. Ecol. Manag. 2022, 506, 119892. [Google Scholar] [CrossRef]
- Gür, H. The Anatolian Diagonal Revisited: Testing the Ecological Basis of a Biogeographic Boundary. Zool. Middle East 2016, 62, 189–199. [Google Scholar] [CrossRef]
- Farjon, A.; Filer, D. An Atlas of the World’s Conifers: An Analysis of Their Distribution, Biogeography, Diversity and Conservation Status; BRILL: Leiden, The Netherlands, 2013; ISBN 978-90-04-21181-0. [Google Scholar]
- Gardner, M. IUCN Red List of Threatened Species: Pinus Sylvestris. Available online: https://www.iucnredlist.org/en (accessed on 23 February 2024).
- Bulut, S.; Aytaş, İ. Modeling Potential Distribution and Above-Ground Biomass of Scots Pine (Pinus sylvestris L.) Forests in the Inner Anatolian Region, Türkiye. Environ. Monit. Assess. 2023, 195, 1471. [Google Scholar] [CrossRef]
- Yan, Y.; Tang, Z. Protecting Endemic Seed Plants on the Tibetan Plateau under Future Climate Change: Migration Matters. J. Plant Ecol. 2019, 12, 962–971. [Google Scholar] [CrossRef]
- Balcì, Y.; Halmschlager, E. Phytophthora Species in Oak Ecosystems in Turkey and Their Association with Declining Oak Trees. Plant Pathol. 2003, 52, 694–702. [Google Scholar] [CrossRef]
- Desprez-Loustau, M.L.; Massot, M.; Toïgo, M.; Fort, T.; Aday Kaya, A.G.; Boberg, J.; Braun, U.; Capdevielle, X.; Cech, T.; Chandelier, A.; et al. From Leaf to Continent: The Multi-Scale Distribution of an Invasive Cryptic Pathogen Complex on Oak. Fungal Ecol. 2018, 36, 39–50. [Google Scholar] [CrossRef]
- Colangelo, M.; Camarero, J.J.; Borghetti, M.; Gentilesca, T.; Oliva, J.; Redondo, M.-A.; Ripullone, F. Drought and Phytophthora Are Associated with the Decline of Oak Species in Southern Italy. Front. Plant Sci. 2018, 9, 1595. [Google Scholar] [CrossRef]
- Altın, T.B. Melendiz ve Keçiboyduran Dağları’nda Yanlış Arazi Kullanımının Vejetasyon Dağılışı Üzerindeki Etkileri. Turk. Geog. Rev. 2014, 51, 13–32. [Google Scholar] [CrossRef]
- Eken, G.; Isfendiyaroğlu, S.; Yeniyurt, C.; Erkol, I.L.; Karataş, A.; Ataol, M. Identifying Key Biodiversity Areas in Turkey: A Multi-Taxon Approach. Int. J. Biodivers. Sci. Ecosyst. Serv. Manag. 2016, 12, 181–190. [Google Scholar] [CrossRef]

| Min | Max | Median | Mean | SE | SD | |
|---|---|---|---|---|---|---|
| BIO1 = Annual Mean Temperature | 5.4 | 11.8 | 8.4 | 8.6 | 0.09 | 1.11 |
| BIO2 = Mean Diurnal Range | 8.4 | 12.5 | 11.3 | 11.2 | 0.07 | 0.92 |
| BIO3 = Isothermality | 0.3 | 0.4 | 0.3 | 0.3 | 0.00 | 0.02 |
| BIO4 = Temperature Seasonality | 725.0 | 866.6 | 805.7 | 805.3 | 2.98 | 38.01 |
| BIO5 = Max Temperature of Warmest Month | 23.1 | 28.4 | 25.7 | 25.6 | 0.10 | 1.24 |
| BIO6 = Min Temperature of Coldest Month | −12.7 | −4.2 | −7.5 | −7.6 | 0.11 | 1.47 |
| BIO7 = Temperature Annual Range | 30.4 | 36.4 | 33.3 | 33.2 | 0.12 | 1.54 |
| BIO8 = Mean Temperature of Wettest Quarter | −2.5 | 12.3 | 2.1 | 3.6 | 0.31 | 3.94 |
| BIO9 = Mean Temperature of Driest Quarter | 15.8 | 21.8 | 18.5 | 18.6 | 0.10 | 1.27 |
| BIO10 = Mean Temperature of Warmest Quarter | 16.2 | 22.1 | 18.8 | 18.8 | 0.10 | 1.26 |
| BIO11 = Mean Temperature of Coldest Quarter | −6.0 | 1.6 | −1.7 | −1.8 | 0.10 | 1.21 |
| BIO12 = Annual Precipitation | 439.8 | 1036.2 | 635.8 | 650.2 | 10.55 | 134.73 |
| BIO13 = Precipitation of Wettest Month | 57.1 | 182.5 | 85.6 | 92.2 | 2.21 | 28.24 |
| BIO14 = Precipitation of Driest Month | 4.6 | 30.8 | 12.7 | 13.7 | 0.46 | 5.87 |
| BIO15 = Precipitation Seasonality | 29.9 | 61.0 | 45.4 | 43.7 | 0.51 | 6.56 |
| BIO16 = Precipitation of Wettest Quarter | 154.2 | 462.3 | 221.6 | 239.3 | 5.39 | 68.79 |
| BIO17 = Precipitation of Driest Quarter | 24.6 | 104.8 | 55.7 | 57.1 | 1.34 | 17.12 |
| BIO18 = Precipitation of Warmest Quarter | 45.9 | 140.8 | 85.2 | 82.7 | 1.41 | 18.05 |
| BIO19 = Precipitation of Coldest Quarter | 135.8 | 462.3 | 190.4 | 212.5 | 5.73 | 73.21 |
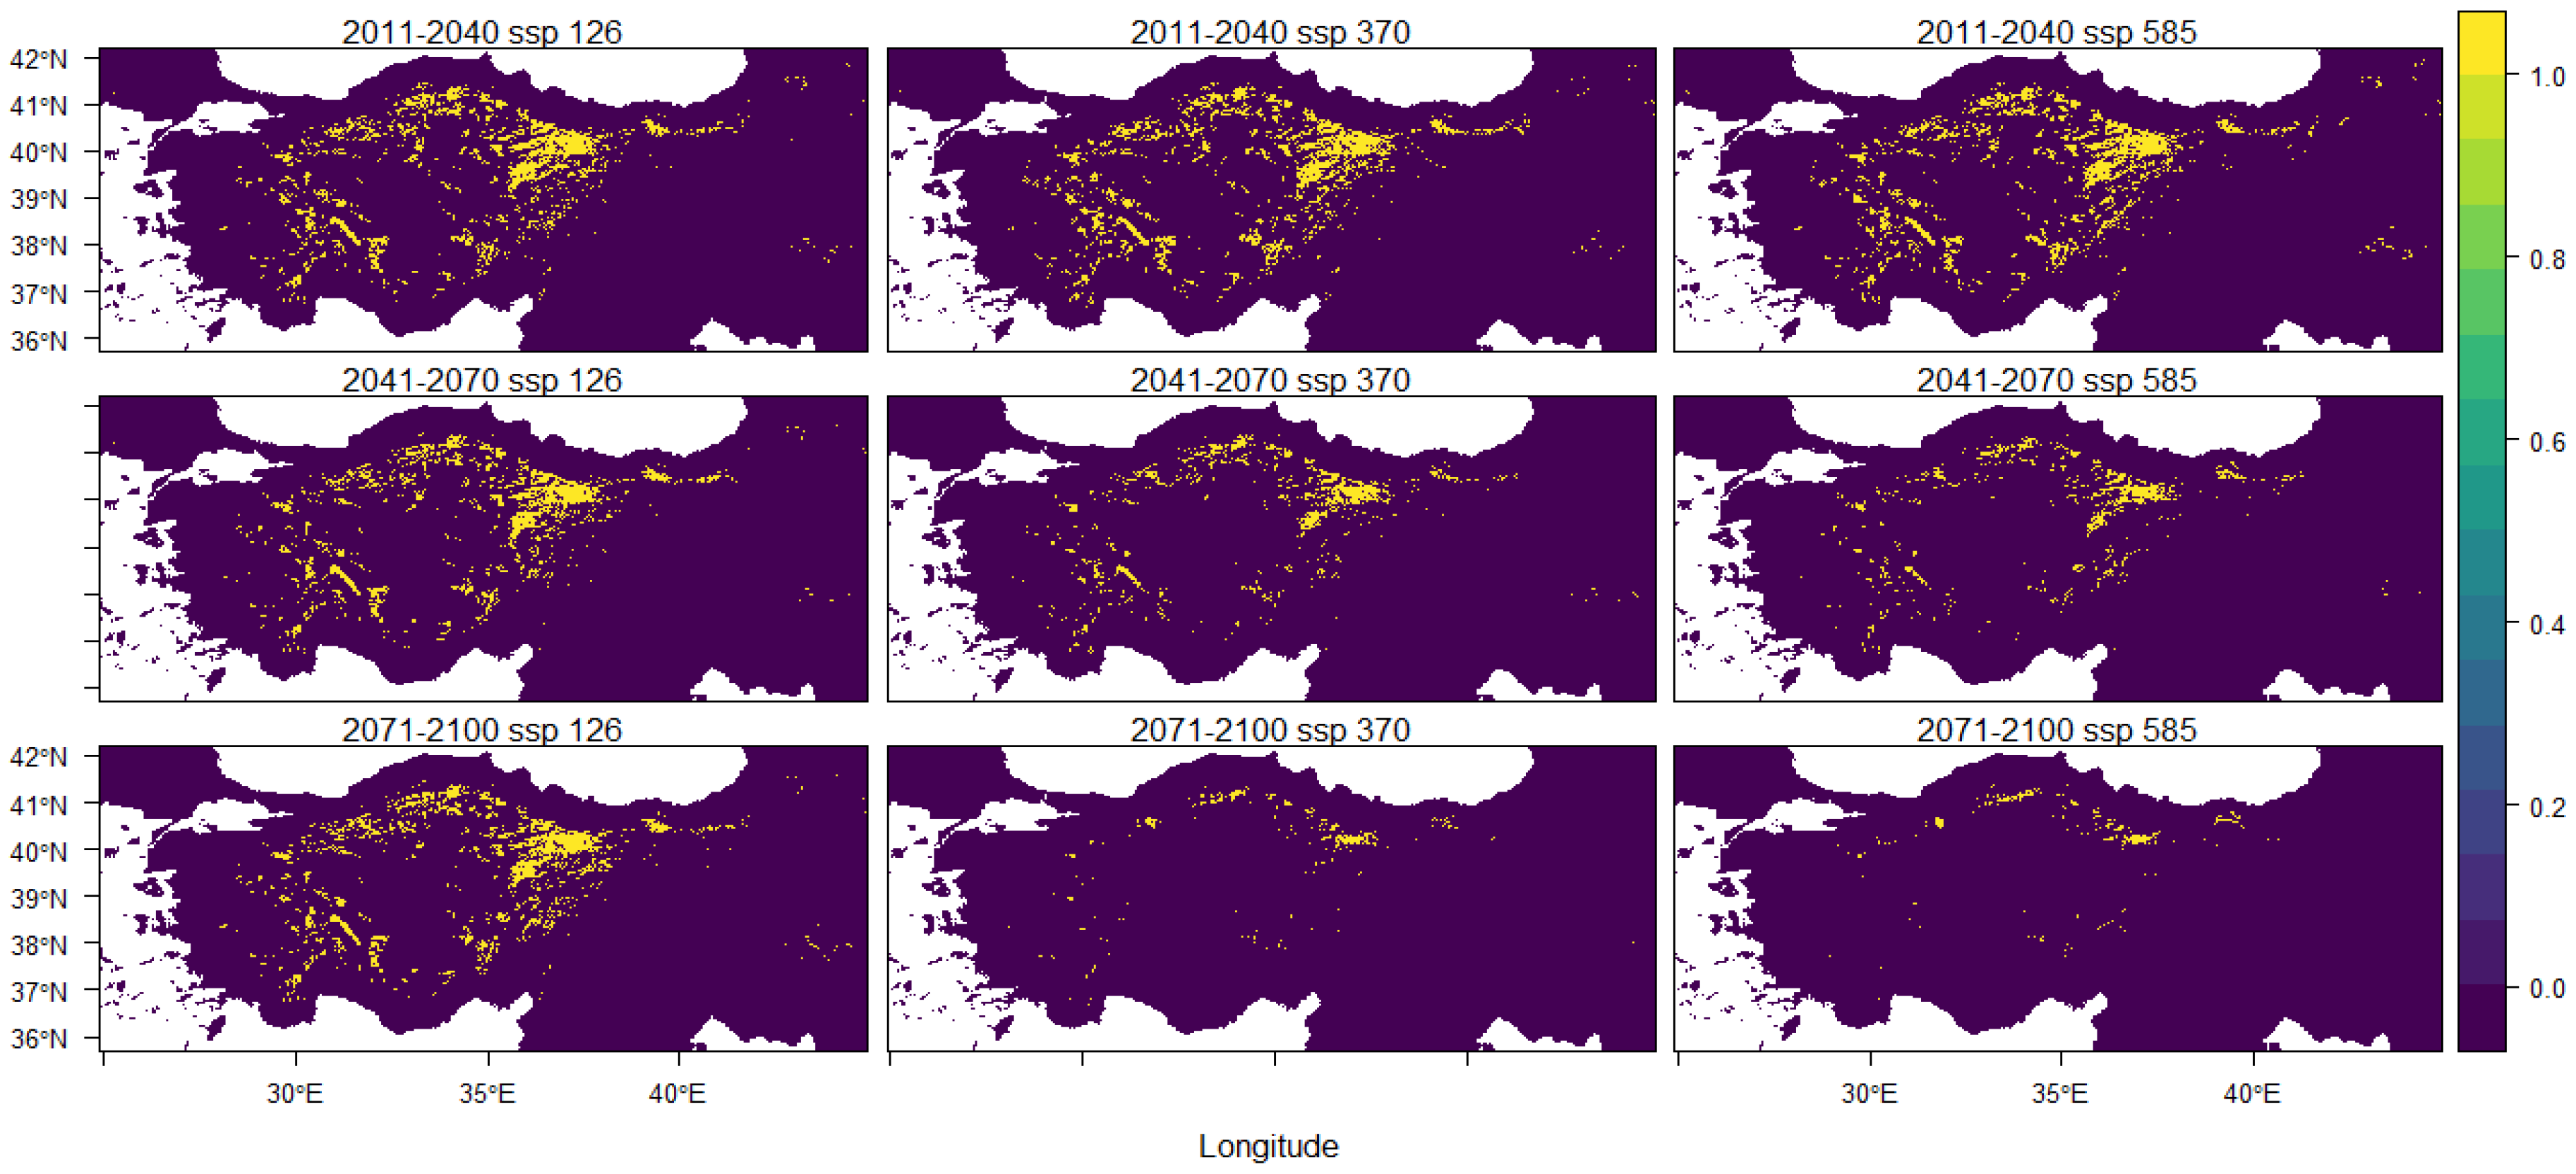
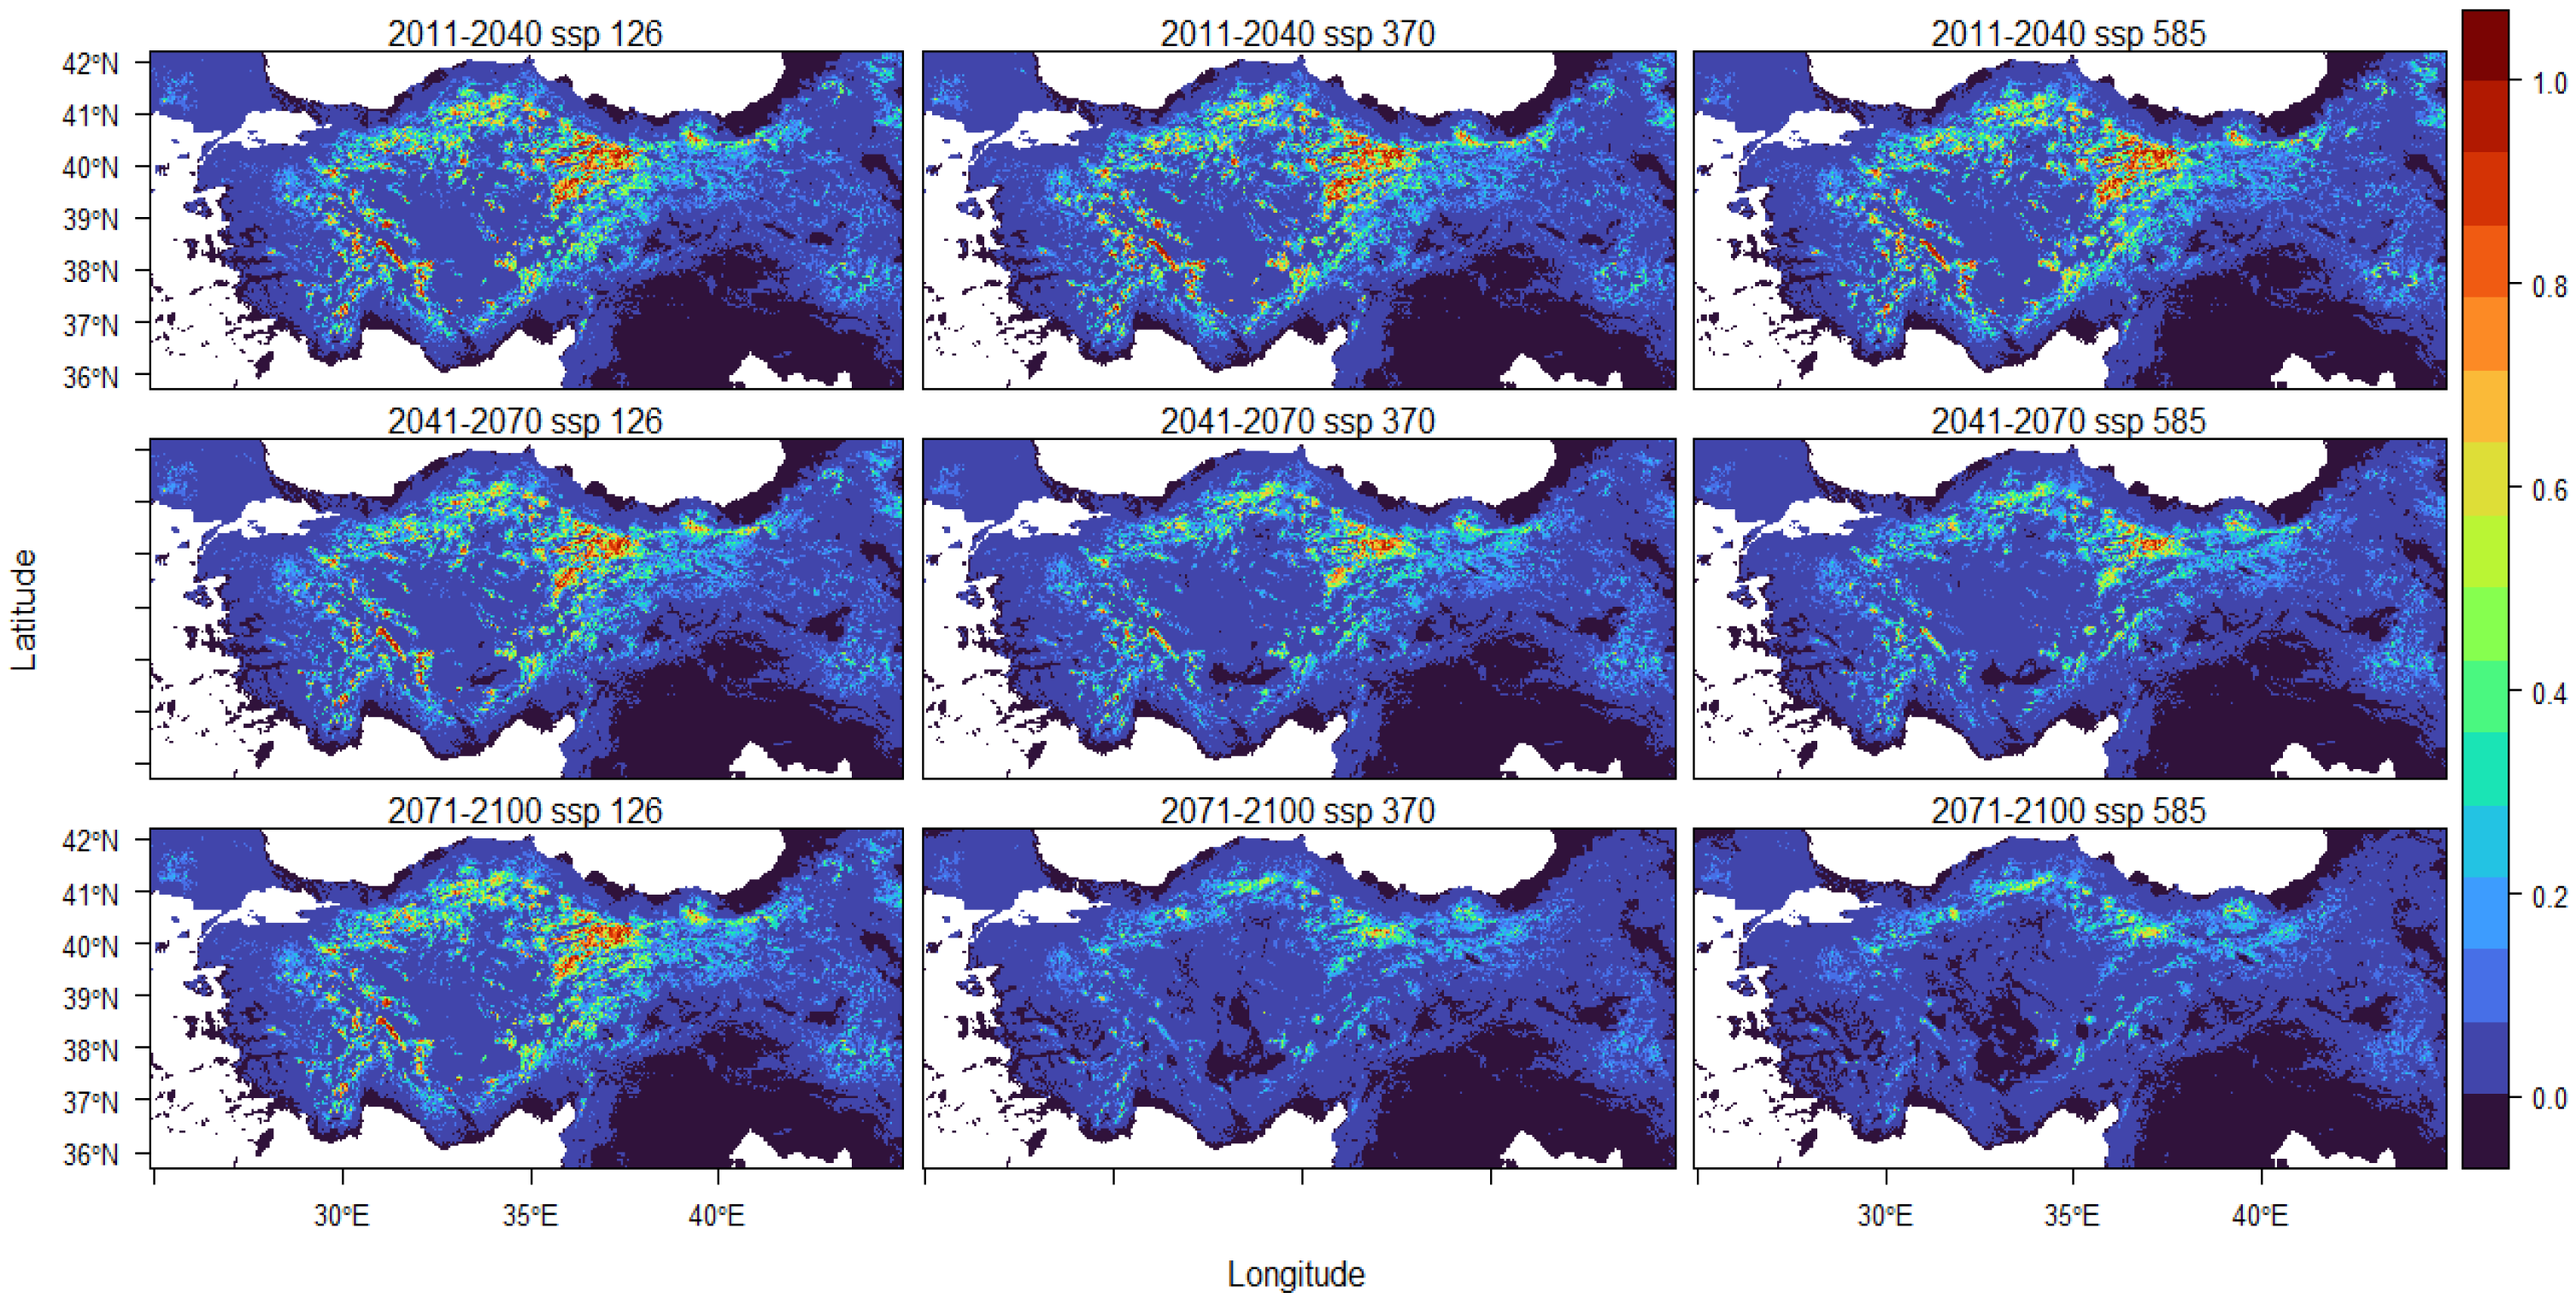
| 2011–2040 ssp 126 | 2011–2040 ssp 370 | 2011–2040 ssp 585 |
| −3.36% | −3.27% | −3.41% |
| 2041–2070 ssp 126 | 2041–2070 ssp 370 | 2041–2070 ssp 585 |
| −4.29% | −5.95% | −6.50% |
| 2071–2100 ssp 126 | 2071–2100 ssp 370 | 2071–2100 ssp 585 |
| −4.01% | −7.73% | −7.88% |
Disclaimer/Publisher’s Note: The statements, opinions and data contained in all publications are solely those of the individual author(s) and contributor(s) and not of MDPI and/or the editor(s). MDPI and/or the editor(s) disclaim responsibility for any injury to people or property resulting from any ideas, methods, instructions or products referred to in the content. |
© 2024 by the authors. Licensee MDPI, Basel, Switzerland. This article is an open access article distributed under the terms and conditions of the Creative Commons Attribution (CC BY) license (https://creativecommons.org/licenses/by/4.0/).
Share and Cite
Özcan, A.U.; Gülçin, D.; Tuttu, G.; Velázquez, J.; Ayan, S.; Stephan, J.; Tuttu, U.; Varlı, A.; Çiçek, K. The Future Possible Distribution of Kasnak Oak (Quercus vulcanica Boiss. & Heldr. ex Kotschy) in Anatolia under Climate Change Scenarios. Forests 2024, 15, 1551. https://doi.org/10.3390/f15091551
Özcan AU, Gülçin D, Tuttu G, Velázquez J, Ayan S, Stephan J, Tuttu U, Varlı A, Çiçek K. The Future Possible Distribution of Kasnak Oak (Quercus vulcanica Boiss. & Heldr. ex Kotschy) in Anatolia under Climate Change Scenarios. Forests. 2024; 15(9):1551. https://doi.org/10.3390/f15091551
Chicago/Turabian StyleÖzcan, Ali Uğur, Derya Gülçin, Gamze Tuttu, Javier Velázquez, Sezgin Ayan, Jean Stephan, Uğur Tuttu, Ahmet Varlı, and Kerim Çiçek. 2024. "The Future Possible Distribution of Kasnak Oak (Quercus vulcanica Boiss. & Heldr. ex Kotschy) in Anatolia under Climate Change Scenarios" Forests 15, no. 9: 1551. https://doi.org/10.3390/f15091551
APA StyleÖzcan, A. U., Gülçin, D., Tuttu, G., Velázquez, J., Ayan, S., Stephan, J., Tuttu, U., Varlı, A., & Çiçek, K. (2024). The Future Possible Distribution of Kasnak Oak (Quercus vulcanica Boiss. & Heldr. ex Kotschy) in Anatolia under Climate Change Scenarios. Forests, 15(9), 1551. https://doi.org/10.3390/f15091551