Abstract
The Qinba Mountain range is a typical climate-sensitive and ecologically fragile region. Monitoring of vegetation dynamics is crucial for ecological protection and achieving sustainable development goals. Various mutation-detection methods, along with slope analysis, hot-spot analysis, and residual analysis, were used to examine changes in the Normalized Difference Vegetation Index (NDVI) during the growing and non-growing seasons over 41 years and to distinguish the relative effects of the drivers. This revealed four key findings. (1) NDVI increased at 0.02 decade−1, with mutation points in 2006 for growing-season NDVI and 2007 for non-growing-season NDVI. (2) The trend in NDVI changed markedly at the mutation point. After the mutation point, NDVI was impacted more by human activity than by climate change. The hot and cold spots of the NDVI trend rate change in location and range in the growing season; in the non-growing season, it shows an obvious north–south distribution. (3) The spatial patterns in the effects of the drivers changed at this point. In the growing season, before this point, climate change and human activity collectively enhanced NDVI in ca. 81.3% of the region; after the mutation point, this value declined to 59.9% of the area, and human activity became the dominant driver in the area formerly dominated by both factors in combination. In the non-growing season, after the mutation point, the areas where both factors promoted vegetation growth decreased by 12.6% and those where climate change alone promoted it decreased by 11.1%, whereas the area affected only by human activity increased by 11.6%. (4) Before this point, human activity contributed >60% to the change in NDVI in the western Qinling region, with climate change contributing >60% in the other areas. After this point, human activity exerted a stronger influence than climate change, contributing >60% to enhancing vegetation growth and >80% reducing it. These findings provide a scientific basis for protecting the Qinba Mountain ecosystem and are essential for achieving sustainable development goals.
1. Introduction
For nearly half a century, climate change, marked by global warming and intensified human activity, has posed severe threats to terrestrial ecosystems globally [1,2]. Vegetation is the core component of terrestrial ecosystems, and its growth is often considered an indicator of ecosystem change [3,4]. Vegetation serves as a bridge between the atmosphere, soil, and hydrosphere and plays a pivotal role in nutrient cycling and energy flow [5]. Terrestrial ecosystems are important carbon sinks and sources, and vegetation dynamics are closely tied to carbon fluxes [6,7]. Quantifying these dynamics is thus central to enhancing regional vegetation monitoring and effective ecosystem management.
Vegetation dynamics are typically influenced by both climate change and human activity [2,3,5]. Temperature and precipitation are considered the primary drivers of vegetation dynamics, with variation in climatic factors significantly affecting plant growth and development [8]. However, when temperatures exceed a certain threshold, photosynthetic activity declines, respiration increases, and consumption of organic matter increases, leading to the suppression of plant growth [9,10]. In arid and semi-arid regions, water scarcity exacerbates the impact of precipitation on vegetation. Increased precipitation enhances soil moisture, stimulates root activity, and promotes plant growth [11]. However, in humid regions, excessive rainfall can lead to lower soil oxygen levels and can inhibit vegetation growth [12,13]. Different regions and vegetation types exhibit varying responses to driving factors [14,15]. Over the past four decades, climate warming has facilitated vegetation recovery in the central and southeastern Loess Plateau, while hindering recovery in the northwest [2,16]. In China, deciduous broadleaf forests, open shrublands, and grasslands have responded to changes in both temperature and precipitation, with temperature having the stronger impact. In the southwest karst regions, climatic factors explain only 8.5% of the annual change in vegetation cover, although they affect grasslands nearly four times as much as croplands [17]. In addition to temperature and precipitation, climatic parameters including humidity, wind speed, and sunshine duration also have important impacts on the distribution, structure, and dynamics of vegetation [18]. In grassland ecosystems, interactions between soil moisture and nutrient levels determine the types of plants present and their distribution [19]. Climatic parameters indirectly affect vegetation structure by altering the soil conditions [20]. Application of the Lund–Potsdam–Jena dynamic global vegetation model has revealed that Northern Hemisphere forests may increase significantly in size in future, and that arid-grassland vegetation is at risk of degradation [21].
Human activity exerts bidirectional effects on vegetation dynamics [5,22]. Excessive agriculture, overgrazing, industrialization, and urban sprawl lead to the uncontrolled expansion of built-up areas, resulting in vegetation degradation and reduced vegetation cover [23]. For instance, in the Beijing–Tianjin–Hebei megalopolis [24,25], Yangtze River Delta [26], Pearl River Delta [27], and southern South Korea [28], urban expansion has severely degraded the surrounding vegetation. However, national initiatives such as efforts to return farmland to forest, ecological projects, and natural forest-protection projects have helped to promote vegetation growth and coverage [29]. China is one of few countries that has seen a significant increase in vegetation cover since 2000 [30]. Considering the multiple factors involved, it is essential to examine the impacts of human activity on vegetation dynamics in a balanced manner.
The Normalized Difference Vegetation Index (NDVI) is linearly or nearly linearly related to vegetation leaf density, photosynthetically active radiation, productivity, and biomass accumulation, among other factors [28]. NDVI serves as an effective tool for assessing vegetation growth, biomass, photosynthetic activity, and coverage [31,32]. It is the most widely used indicator of vegetation dynamics and is considered the best indicator of vegetation conditions and surface cover [33]. Many studies across different regions and scales have employed NDVI to investigate vegetation dynamics and their responses to drivers [34,35,36,37,38,39]. The most commonly used NDVI data products are the Moderate Resolution Imaging Spectroradiometer (MODIS) NDVI dataset, the Satellite Pour l’Observation de la Terre—Végétation (SPOT-VGT) NDVI dataset, and the Advanced Very High Resolution Radiometer (AVHRR) NDVI (GIMMS NDVI 3 g) dataset [40]. These NDVI products vary owing to differences among the satellite sensors, spectral response functions, data correction methods, and composite periods. Spatial resolution and temporal sequence lengths vary [41]. The MODIS and SPOT-VGT NDVI products boast higher spatial resolutions but shorter time series, whereas AVHRR NDVI has lower spatial resolution but a longer temporal sequence, with the latest GIMMS-3g+ NDVI dataset spanning 41 years (1982–2022) [42].
Vegetation dynamics intrinsically fluctuate over time, transitioning at mutation points [1]. Analytical techniques such as mutation analysis [4,43], slope analysis [5,16,44], correlation analysis [45,46], directional analysis [22], and wavelet analysis [47] have been used to examine vegetation dynamics and their responses to driving factors. Multivariate regression models [48], redundancy analysis [49], ridge regression analysis [50], geographically weighted regression models [34,51], optimal geographic detector models, and the random forest algorithm [52] have been used to analyze relationships between vegetation indices and drivers. While methods and models utilize climatic factors and indicators of human activity as predictors, it is often challenging to obtain reliable long-term data on human activity, owing to temporal constraints or other factors [22].
The Qinba Mountains in China form a transitional zone between the warm temperate zone in the south and the subtropical zone in the north. They exhibit horizontal and vertical belt characteristics, high diversity of plant species, and complex patterns of biodiversity [53]. The ecosystems of this mountain range are impacted by global climate change [54]. These mountains are the source of the midstream section of the South-to-North Water Diversion Project; this project has led to increased human activity in the area in recent years, affecting both its vegetation growth and development [55]. Long-term dynamic monitoring of this region’s vegetation is therefore crucial for ensuring its ecological security and sustainable development. Although its vegetation dynamics have been examined using NDVI data [56,57,58,59,60], there is still a lack of continuous long-term monitoring, particularly in recent years. Further research is therefore needed to quantify the relative effects of climatic and anthropogenic factors on the vegetation dynamics of the Qinba Mountains.
To address this, we utilized the 41-year (1982–2022) GIMMS NDVI dataset, temperature, and precipitation data for this region. Mutation point analysis, slope analysis, and residual analyses were used to examine vegetation dynamics and the influence of drivers on vegetation dynamics. The primary objectives were to identify the years exhibiting abrupt changes in NDVI (i.e., the mutation points); to analyze temporal and spatial trends in NDVI; to examine spatial differences in the effects of the drivers before and after the mutation point; and to quantify the relative effects of the drivers at the pixel scale. These findings elucidate the changes in NDVI in the Qinba Mountains, providing deeper insight into the impacts of climatic factors and human activity. By quantifying the relative contributions of these drivers, this study provides scientific support for ecosystem-level conservation in the Qinba Mountains and will support projects to facilitate vegetation growth and development in this area and the realization of sustainable development goals.
2. Materials and Methods
2.1. Study Area
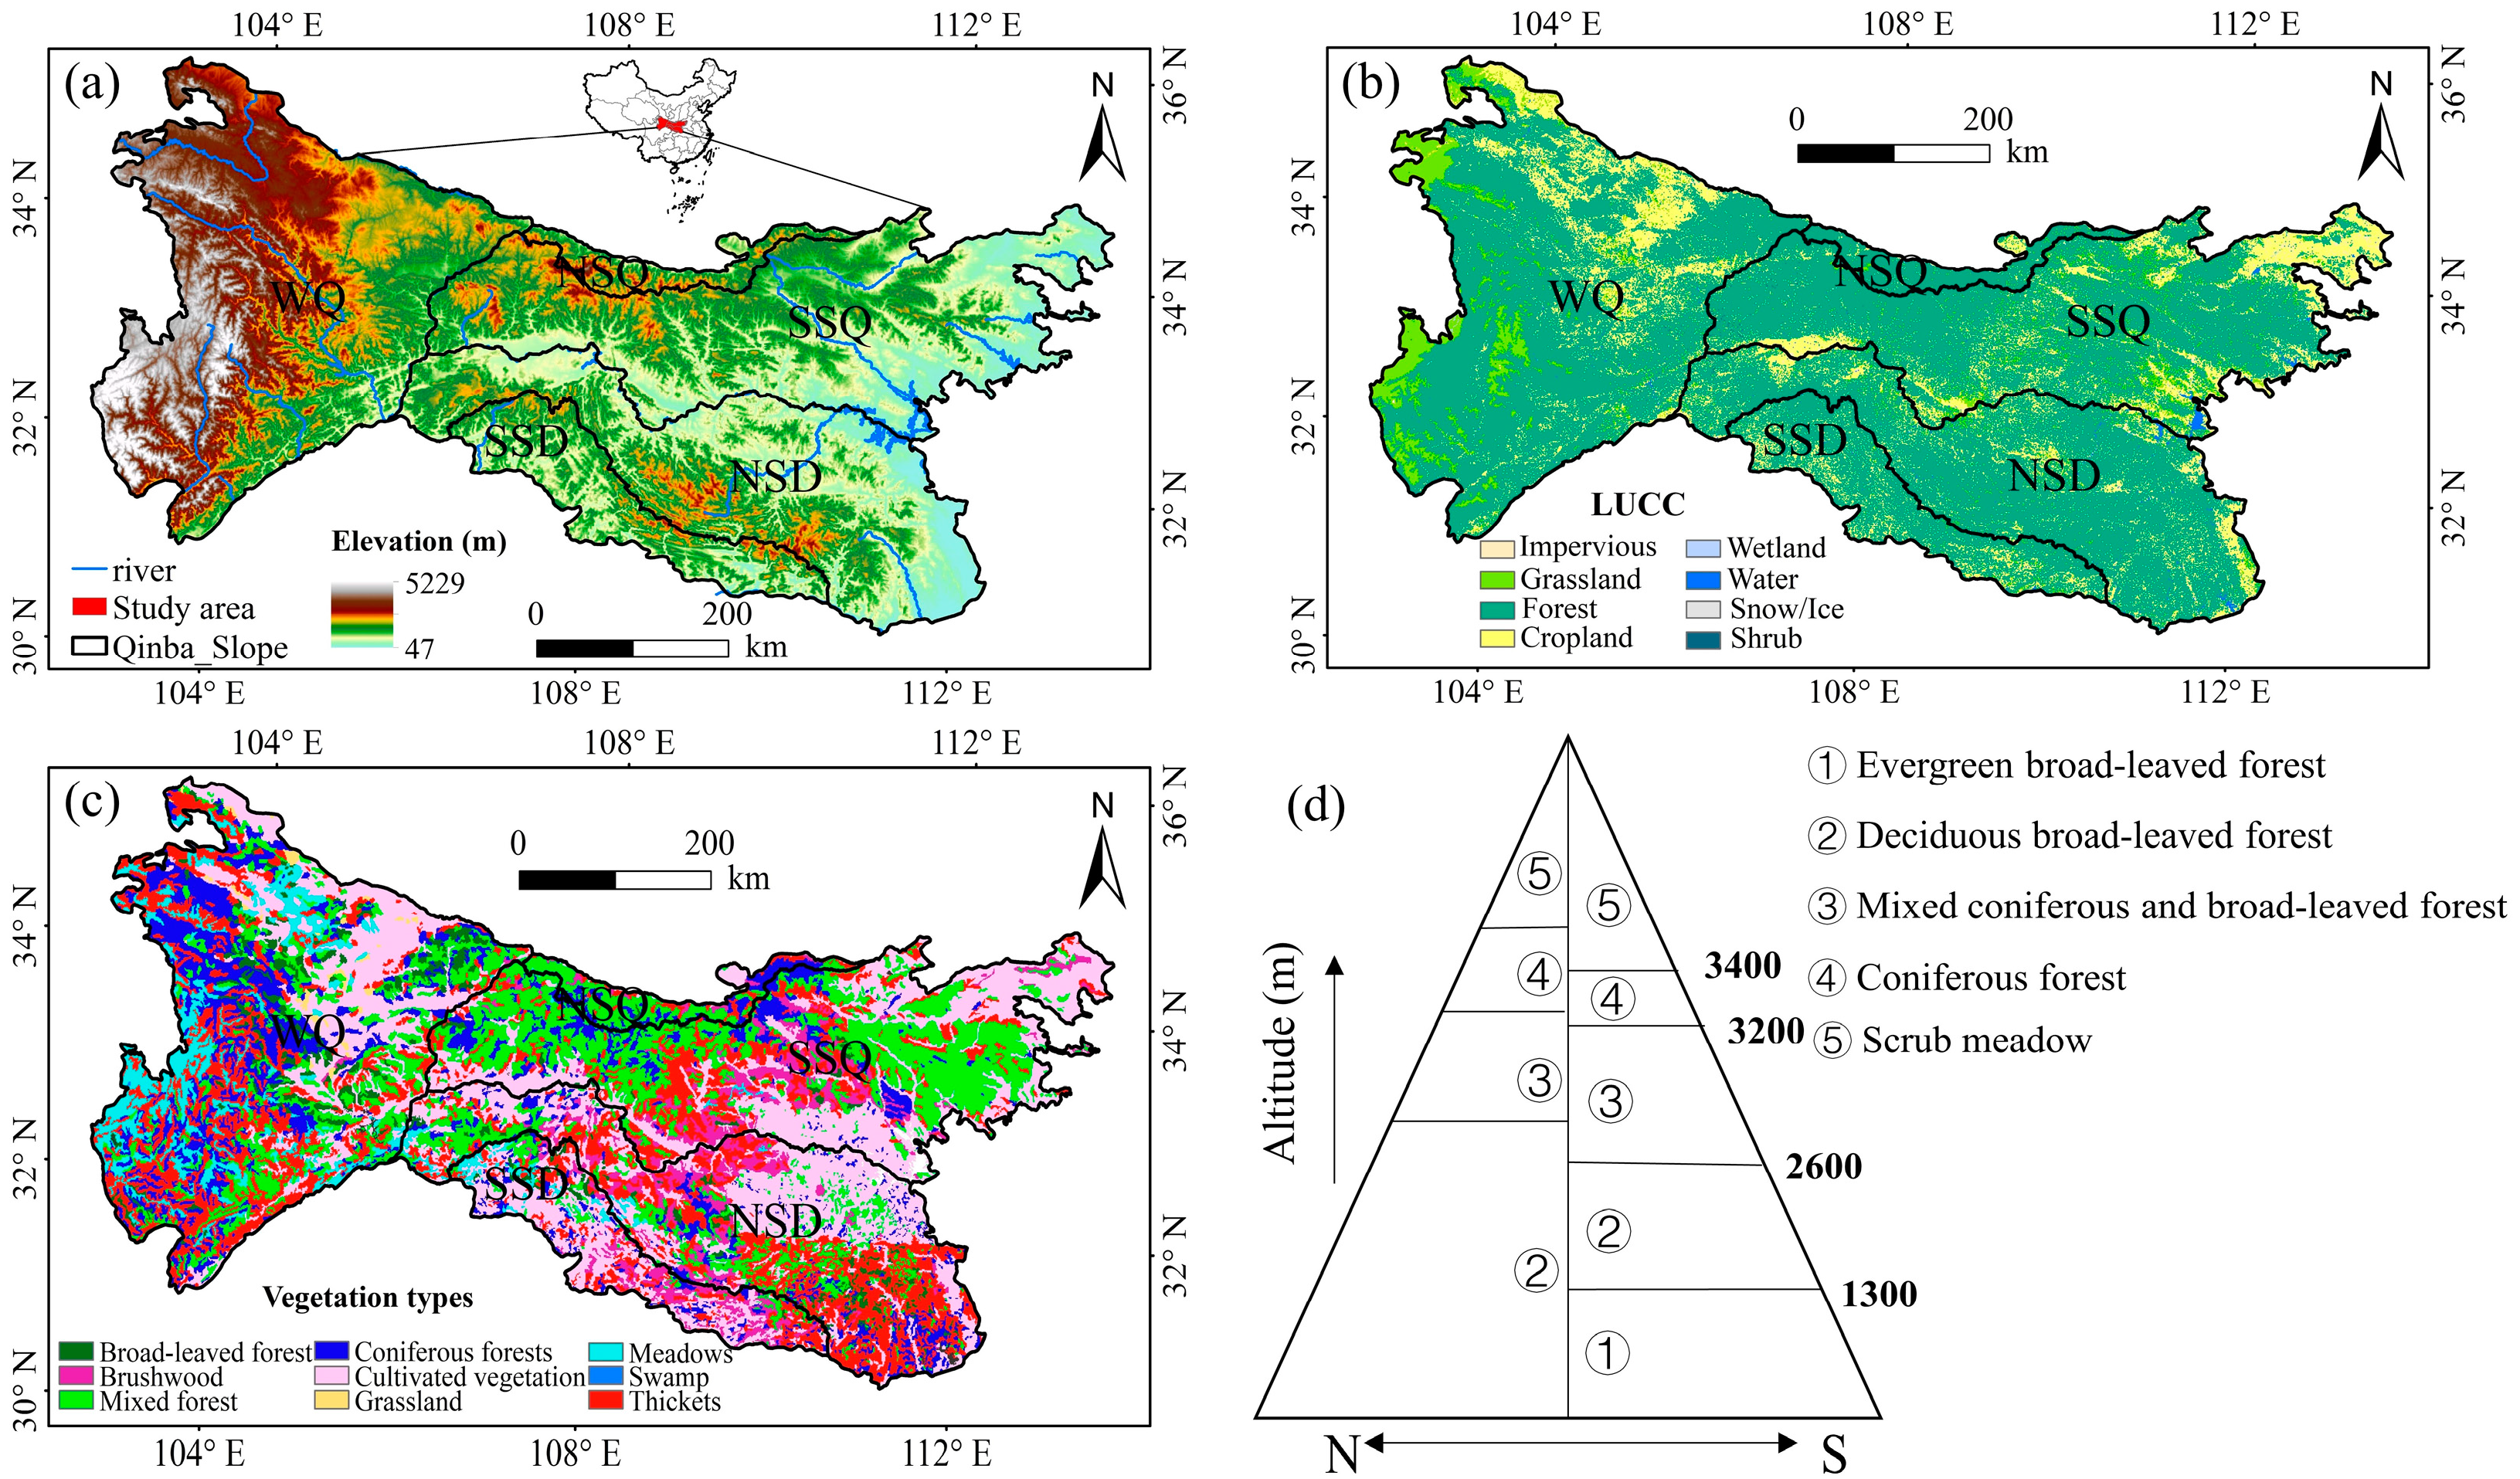
The Qinba Mountains (30–36° N, 102–114° E) cover a large part of central China, spanning multiple provinces. The range primarily includes the Qinling and Daba Mountains (Figure 1a). This region is a transitional zone between the temperate continental climate and subtropical monsoon climate, which exhibit substantial climatic differences. The area exhibits complex vegetation systems. The northern slopes of the Qinling Mountains are covered by warm temperate deciduous broad-leaved forests and the southern slopes by deciduous broad-leaved forests mixed with evergreen species. The northern slopes of the Daba Mountains exhibit similar vegetation types to the southern slopes of the Qinling Mountains, whereas the southern slopes of the Daba Mountains are covered by a typical evergreen broadleaf forest (Figure 1c) [53,56]. The climate and vegetation exhibit clear vertical zonality (Figure 1d). The average annual temperature in the growing season (April–October) is 0 to 23 °C and the average annual precipitation 400–1200 mm. The average annual temperature in the non-growing season (November–March) is −13 to 10 °C and the average annual precipitation 30–300 mm. This region is a typical climate-change-sensitive and ecologically fragile area [56]. We divided the Qinba Mountains into five zones [53,57]: the western Qinling Mountains (WQ), the northern slopes of the Qinling Mountains (NSQ), the southern slopes of the Qinling Mountains (SSQ), the southern slopes of the Daba Mountains (SSD), and northern slopes of the Daba Mountains (NSD).
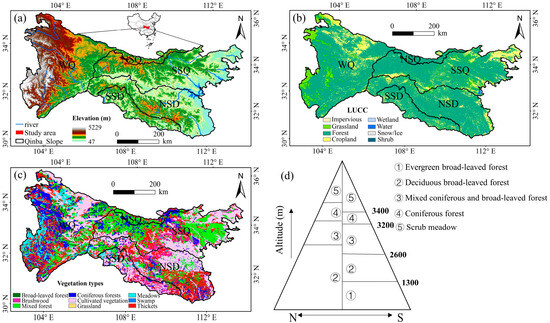
Figure 1.
Overview of the study area. (a) Geographical location, slope division, and elevational distribution of the Qinba Mountains. WQ: Western Qinling Mountains; NSQ: Northern slopes of Qinling Mountains; SSQ: Southern slopes of Qinling Mountains; SSD: Southern slopes of Daba Mountains; and NSD: Northern slopes of Daba Mountains; (b) Land cover and land use; (c) Distribution of vegetation types; (d) Schematic cross-sectional profile of the change in vegetation with altitude.
2.2. Data
2.2.1. NDVI Dataset
The NDVI data were derived from the Global Inventory Modeling and Mapping Studies-3rd Generation V1.2 (GIMMS-3G+) (spatial resolution, 0.0833°; period, 1982–2022) (https://daac.ornl.gov/VEGETATION/guides/Global_Veg_Greenness_GIMMS_3G.html (accessed on 24 April 2024)). This dataset was derived using different AVHRR sensors and includes indicators of harmful effects. GIMMS-3G+, one of the longest continuous records of global vegetation productivity, is widely used to analyze long-term vegetation dynamics [42].
2.2.2. Climate Dataset
Temperature data and precipitation data were obtained from the Loess Plateau Subcenter (National Earth System Science Data Center, National Science & Technology Infrastructure of China) (https://www.geodata.cn/main/face_science_detail?id=62683&guid=67669514169502 (accessed on 25 April 2024); https://www.geodata.cn/main/face_science_detail?id=56226&guid=113786088533256 (accessed on 25 April 2024)) (spatial resolution, 0.00833°; period, 1901–2022) [61]. Data reliability was verified using data from 496 independent meteorological observation points; this analysis revealed that the results were reliable and appropriate for studying China’s ecology, hydrology, and water resources.
The study period was 1982–2022. Processing of the NDVI, temperature, and precipitation data involved format conversion, coordinate transformation, data clipping, and extraction of observed values. This resulted in a dataset with consistent temporal and spatial resolution. Batch calculations, including of average temperature, cumulative precipitation, and average NDVI in the growing and non-growing seasons, were performed on the preprocessed datasets to generate long-time-series datasets.
2.3. Research Methods
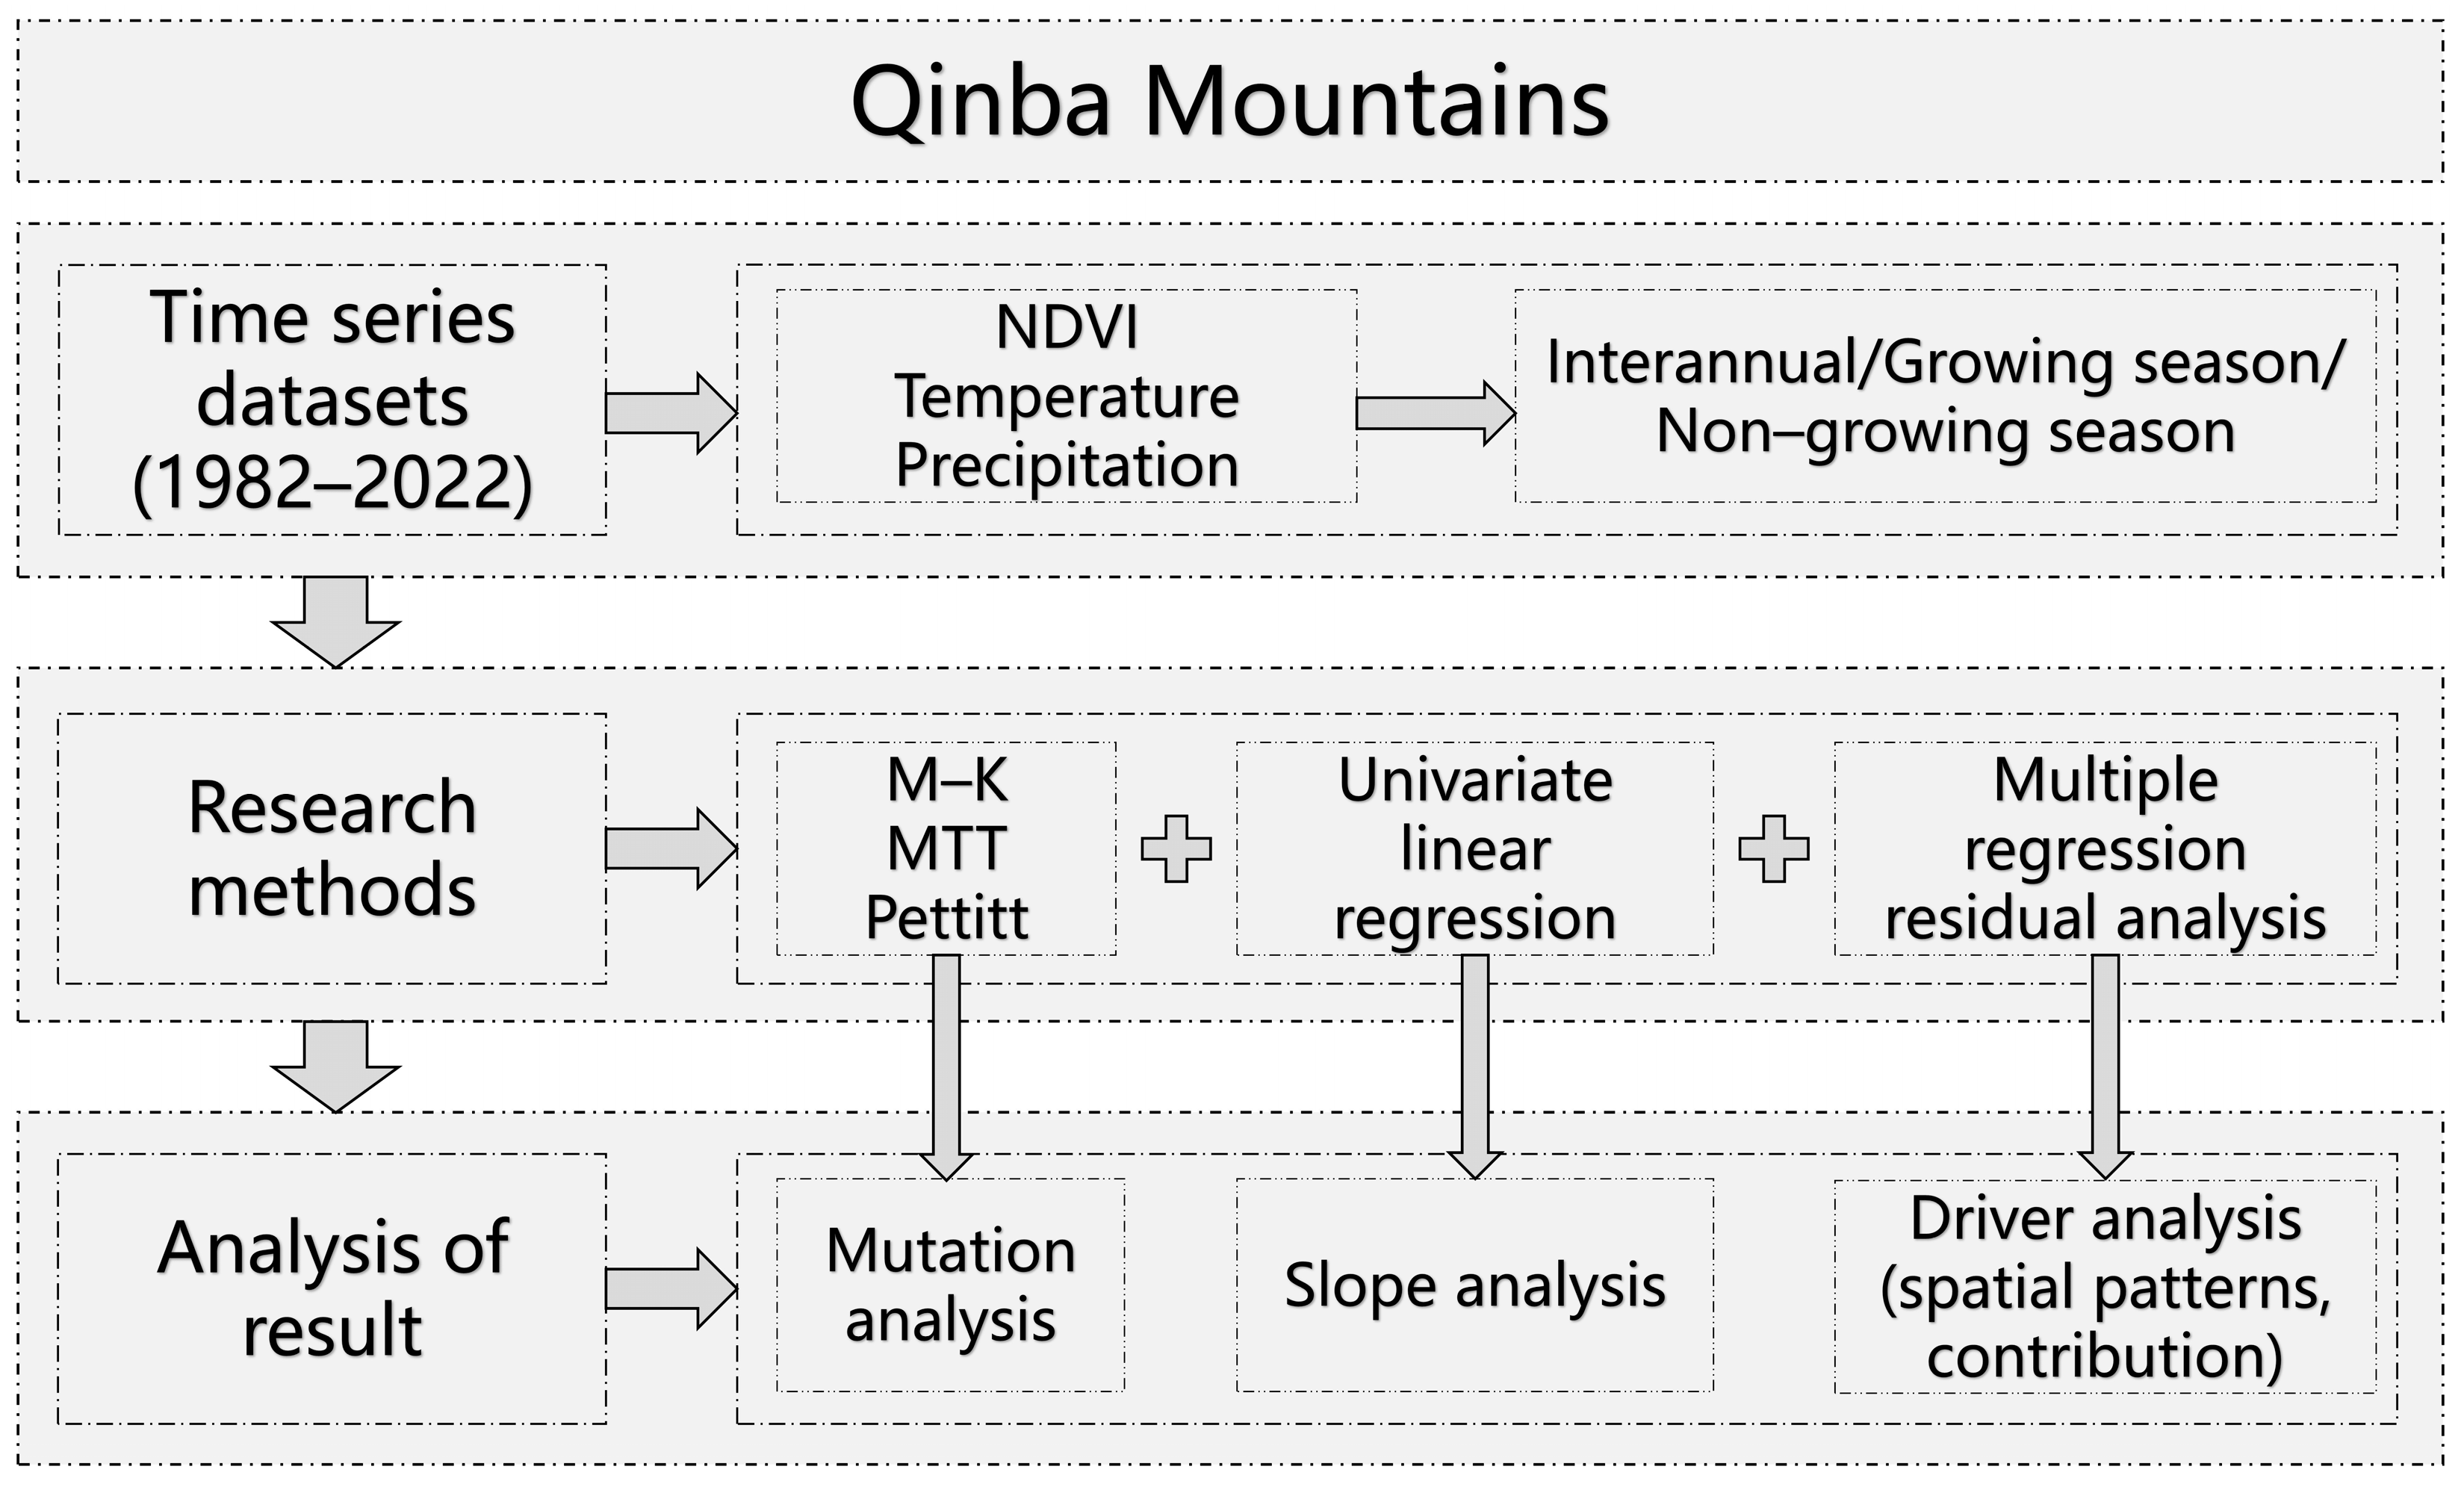
The Mann–Kendall mutation test, moving t-test (MTT), and Pettitt change-point test (Pettitt) were used to detect the mutation point (year of change in NDVI) in the growing and non-growing seasons. The time series was then divided into two parts, before the mutation point and after the mutation point. The slopes of observed (i.e., true) NDVI (NDVIobs), predicted NDVI in response to climate change (NDVIcc), and NDVI in response to human activity (NDVIha, i.e., the residual—the proportion of NDVI not explained by climate change) were examined for the entire time series and for its two parts. Residual analysis was used to determine the factors driving the changes and the relative contributions of each factor. Mutation testing, slope analysis, and residual analysis were performed using Matlab (version ‘9.13.0.2049777 (R2022b)’, MathWorks, USA). The research process is illustrated in Figure 2.
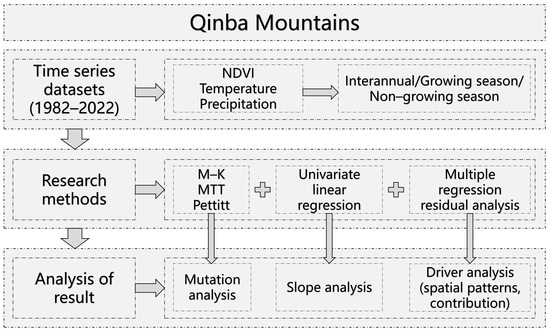
Figure 2.
Research framework.
2.3.1. Mutation Tests
Mutation testing aims to detect abrupt changes in the data (i.e., mutation points) in a time series. These mutation points may signal qualitative changes in a particular phenomenon or process [62]. Several methods exist for mutation testing. Here, the Mann–Kendall mutation test, MTT, and Pettitt test were used to detect the NDVI mutation-point year.
(1) Mann–Kendall mutation test
The Mann–Kendall mutation test is non-parametric, does not require the sample to follow a certain distribution, and is not affected by the presence of a few outliers. It detects mutation points by calculating rank changes in the data sequence. Although the calculation is simple, it is unsuitable for detecting multiple mutation points [62,63].
For a time series containing n samples, an ordered sequence is constructed:
Assuming that the time series is random and independent, the test statistic is defined as follows:
Using the reverse sequence of the time series, this process is repeated to obtain . If and intersect, their point of intersection may represent a mutation point. The values are ordered according to the time series (i.e., forward, UF), and the values in the opposite direction (i.e., backward, UB).
(2) Moving t-test
The MTT assay identifies mutations by testing whether the difference in the average values of the two groups of samples is significant. In this method, the significance of the difference between the means of two subsets of a time series is a function of the significance of the difference from the two overall means [1,62].
For a time series with n samples, we set a certain moment in time as the reference point and calculate the statistics t and s:
where and are, respectively, the sample sizes of the subsequences and before and after the benchmark point, with mean values and and variances and , respectively. Given a significance level of , if , there is considered to be no significant difference in the means of the two subsequences; otherwise, the reference point is deemed to be a mutation point.
(3) Pettitt change-point test
Pettitt’s test is a non-parametric test for detecting a single mutation point in a time series. This method, suitable for identifying mutations in long-term time-series data, determines the location of the change point by comparing the cumulative differences between the first and second parts of the time series [58,62]:
The mutation point is located at .
2.3.2. Slope Analysis
Slope analysis uses linear regression to determine the slope of the best-fit line, reflecting the change over time [5,63,64]:
where is the total number of years in the time series; is the specific year, and is the value of in the year . For , increases; for , decreases.
The significance of the trend was determined using the test:
where is the error sum of squares, is the residual sum of squares, and is the residual degrees of freedom.
2.3.3. Hot-Spot Analysis
The hot-spot analysis tool calculates the Getis–Ord
statistic for each feature in the dataset. The z-score and p-value provide information regarding the spatial locations of clusters of high- or low-value features. We used this tool to calculate the spatial clustering of hot spots (represented by high values) and cold spots (represented by low values) of slope(NDVI) and to analyze the relationships between vegetation dynamics, climate change, and human activity [65,66,67].
is calculated as follows:
where is the attribute value of feature (here, the slope(NDVI) value); is the spatial weight between features and ; is the total number of features; and the statistic is a z-score.
2.3.4. Multiple Regression Residual
Residual analysis was used to determine the extent to which climate change and human activity affected NDVI [3]. We assumed that the proportion of the change in NDVI that cannot be explained by climate change is explained by human activity [22,68]. The climatic factors included temperature and precipitation. First, a multiple regression equation was constructed using the NDVI time-series data, with temperature and precipitation as independent variables and NDVI as the dependent variable. Second, the climatic variables and regression coefficients were used to predict NDVI (NDVIcc) to represent the impact of climate change on NDVI. The residual, NDVIha (the difference between NDVIobs and NDVIcc), was then calculated to represent the impact of human activity [2]:
2.3.5. Determining the Drivers of Change in NDVI
To more precisely quantify the impacts of climate change and human activity on NDVI, we divided the slopes calculated using Equation (11) into seven categories (Table 1) [2]. Based on slope(NDVIobs), slope(NDVIcc), and slope(NDVIha), the relative contributions of each driver to the change in NDVI were determined (Table 2) [22].

Table 1.
Classification of the responses of NDVI to climate change and human activity.
Table 2.
Effects of each driver on NDVI and the relative contribution of each driver.
3. Results
3.1. Temporal Trends in NDVI and Mutation Points
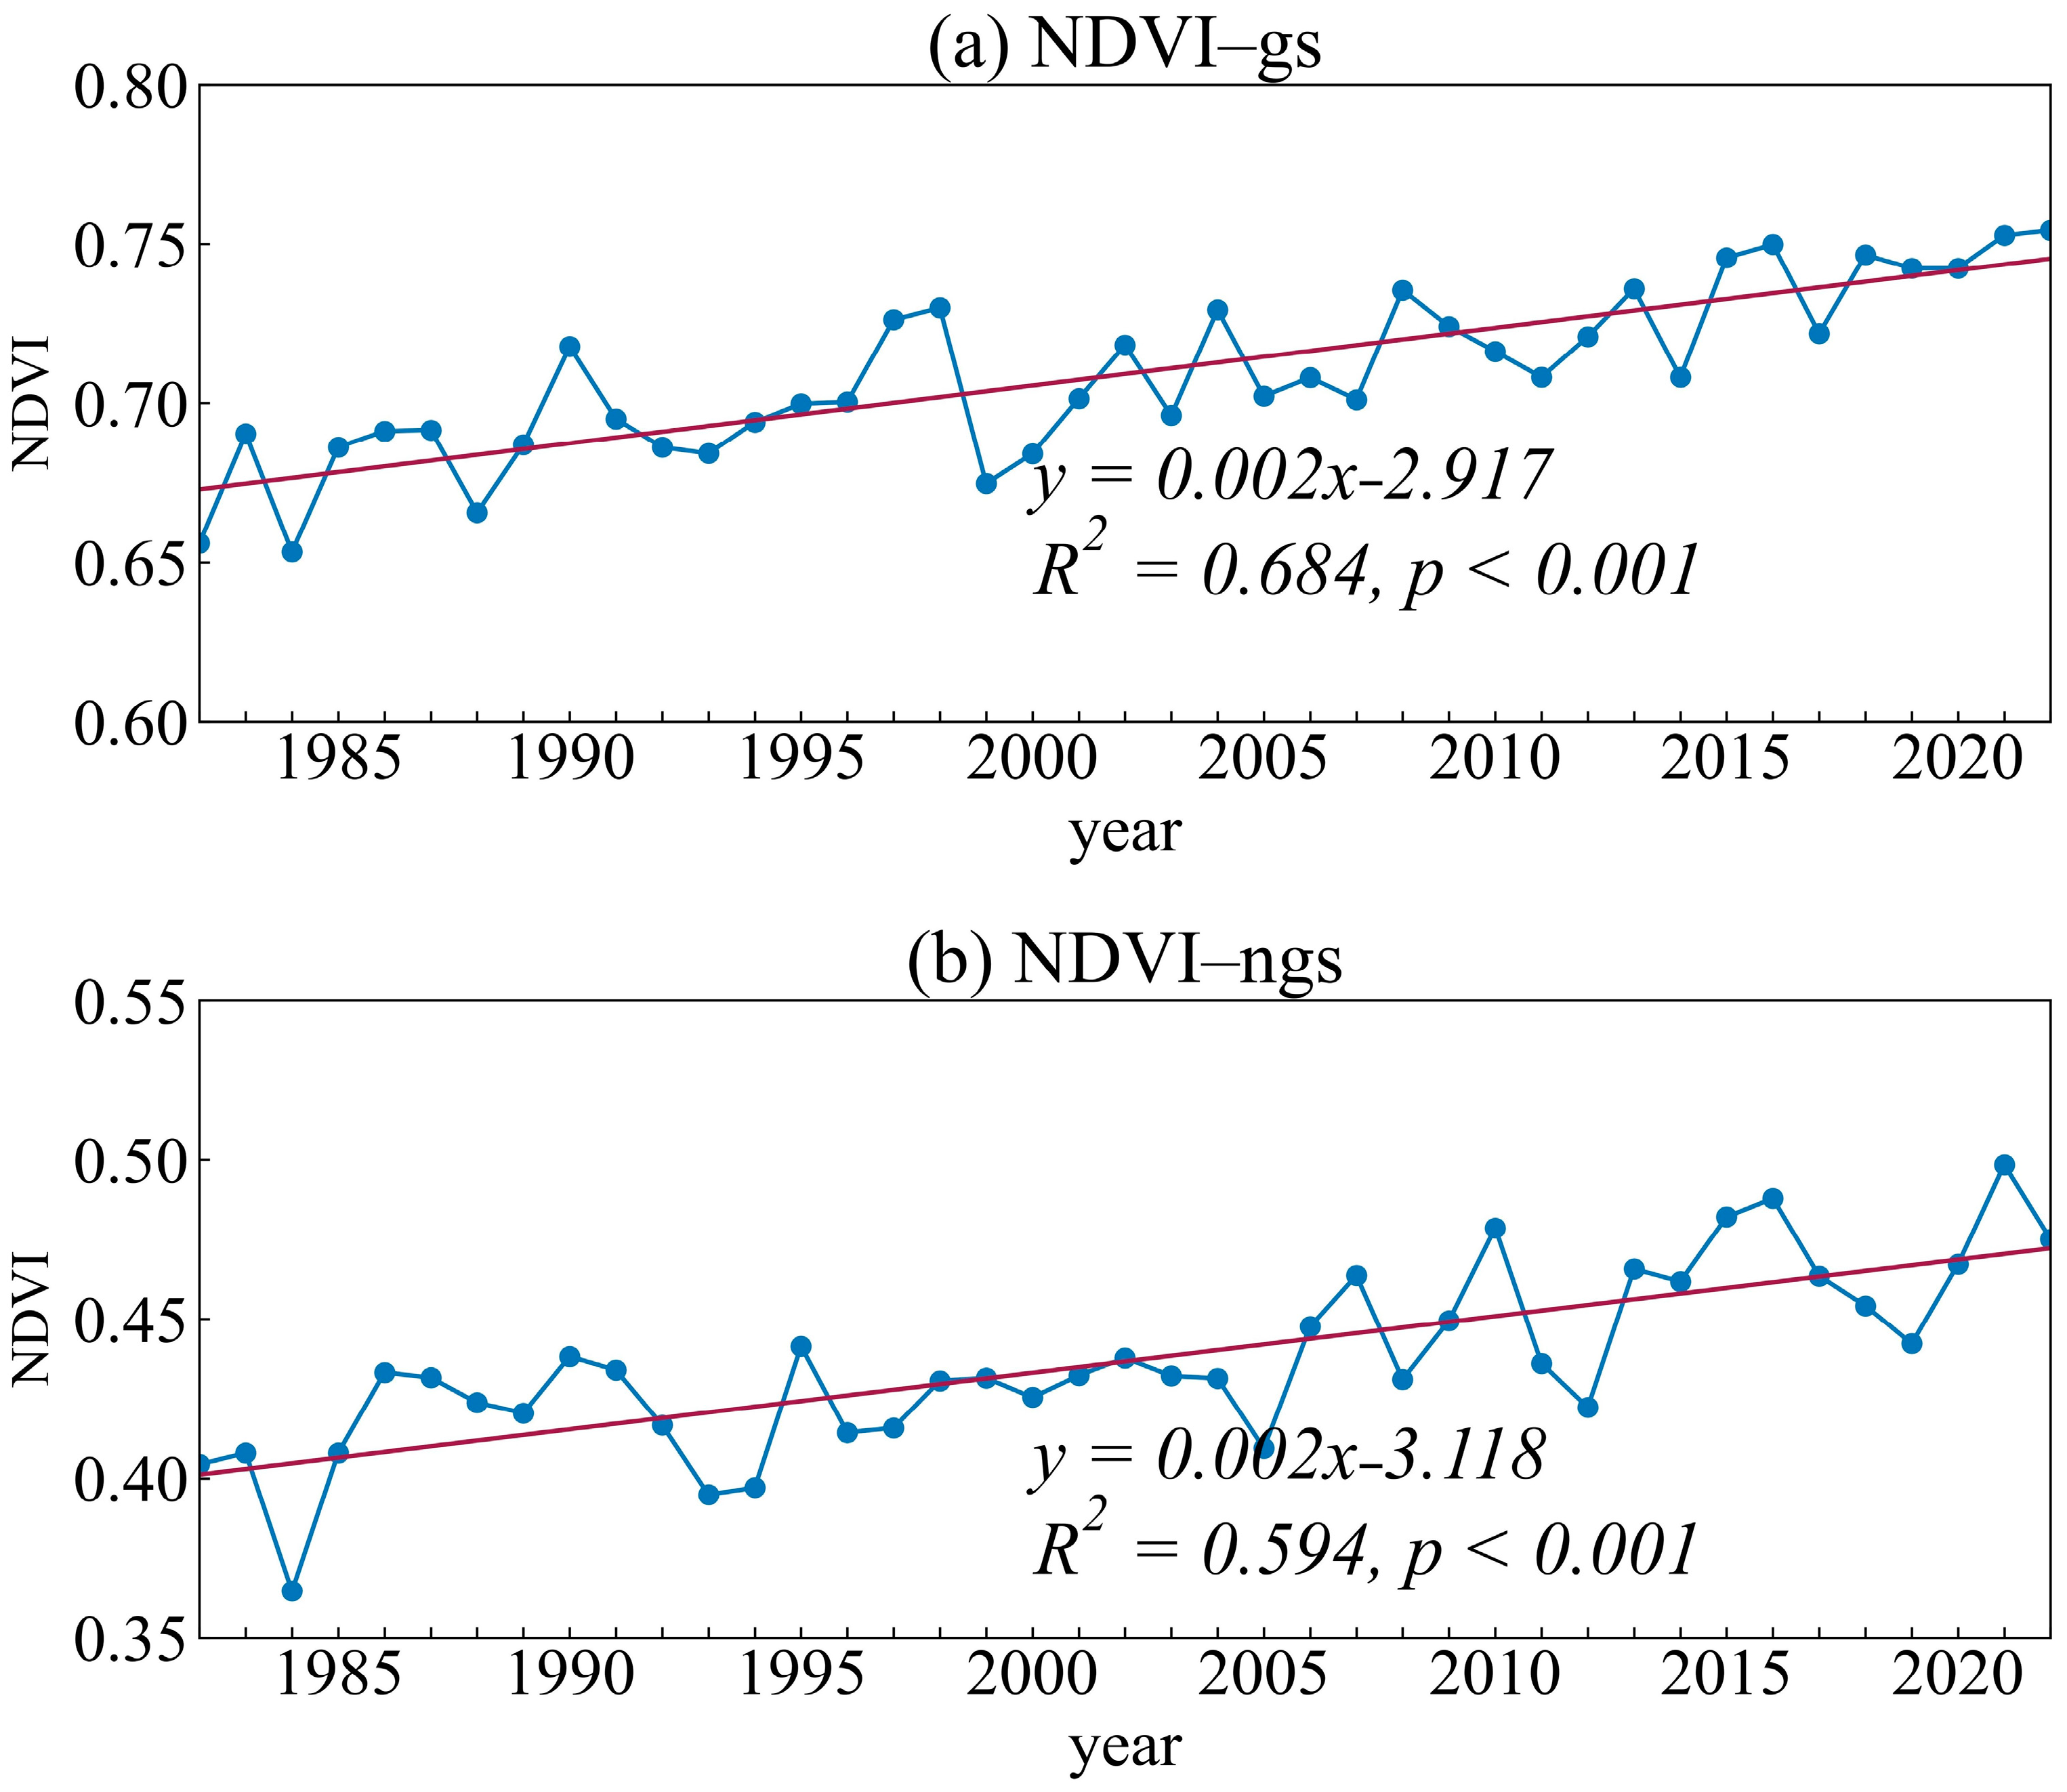
The temporal trends in NDVI in the Qinba Mountains over 41 years were examined (Figure 3). NDVI increased markedly in both the growing and non-growing seasons, at similar rates (ca. 2 × 10⁻³ a−1; p < 0.001), although it exhibited more change during the non-growing season (R2 = 0.594) than during the growing season (R2 = 0.684). Growing season NDVI fluctuated greatly before 2000, increasing relatively slowly (Figure 3a), whereas non-growing season NDVI fluctuated greatly throughout the study period (Figure 3b). During the growing season, the annual average NDVI was 0.653–0.754, being lowest in 1984 and highest in 2022 (overall average, 0.709). The average non-growing season NDVI was 0.365–0.498, being lowest in 1984 and the highest in 2021 (overall average, 0.437). These findings clearly indicate the vegetation restoration activity in the region from 1982 to 2022.
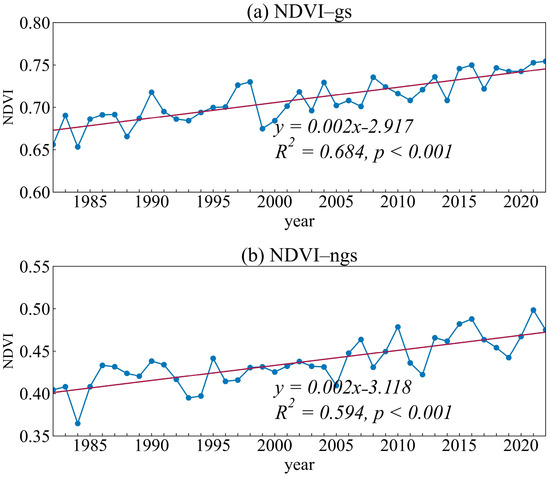
Figure 3.
NDVI in the Qinba Mountains from 1982 to 2022. (a) NDVI-gs: growing season (gs) NDVI; (b) NDVI-ngs, non-growing season (ngs) NDVI.
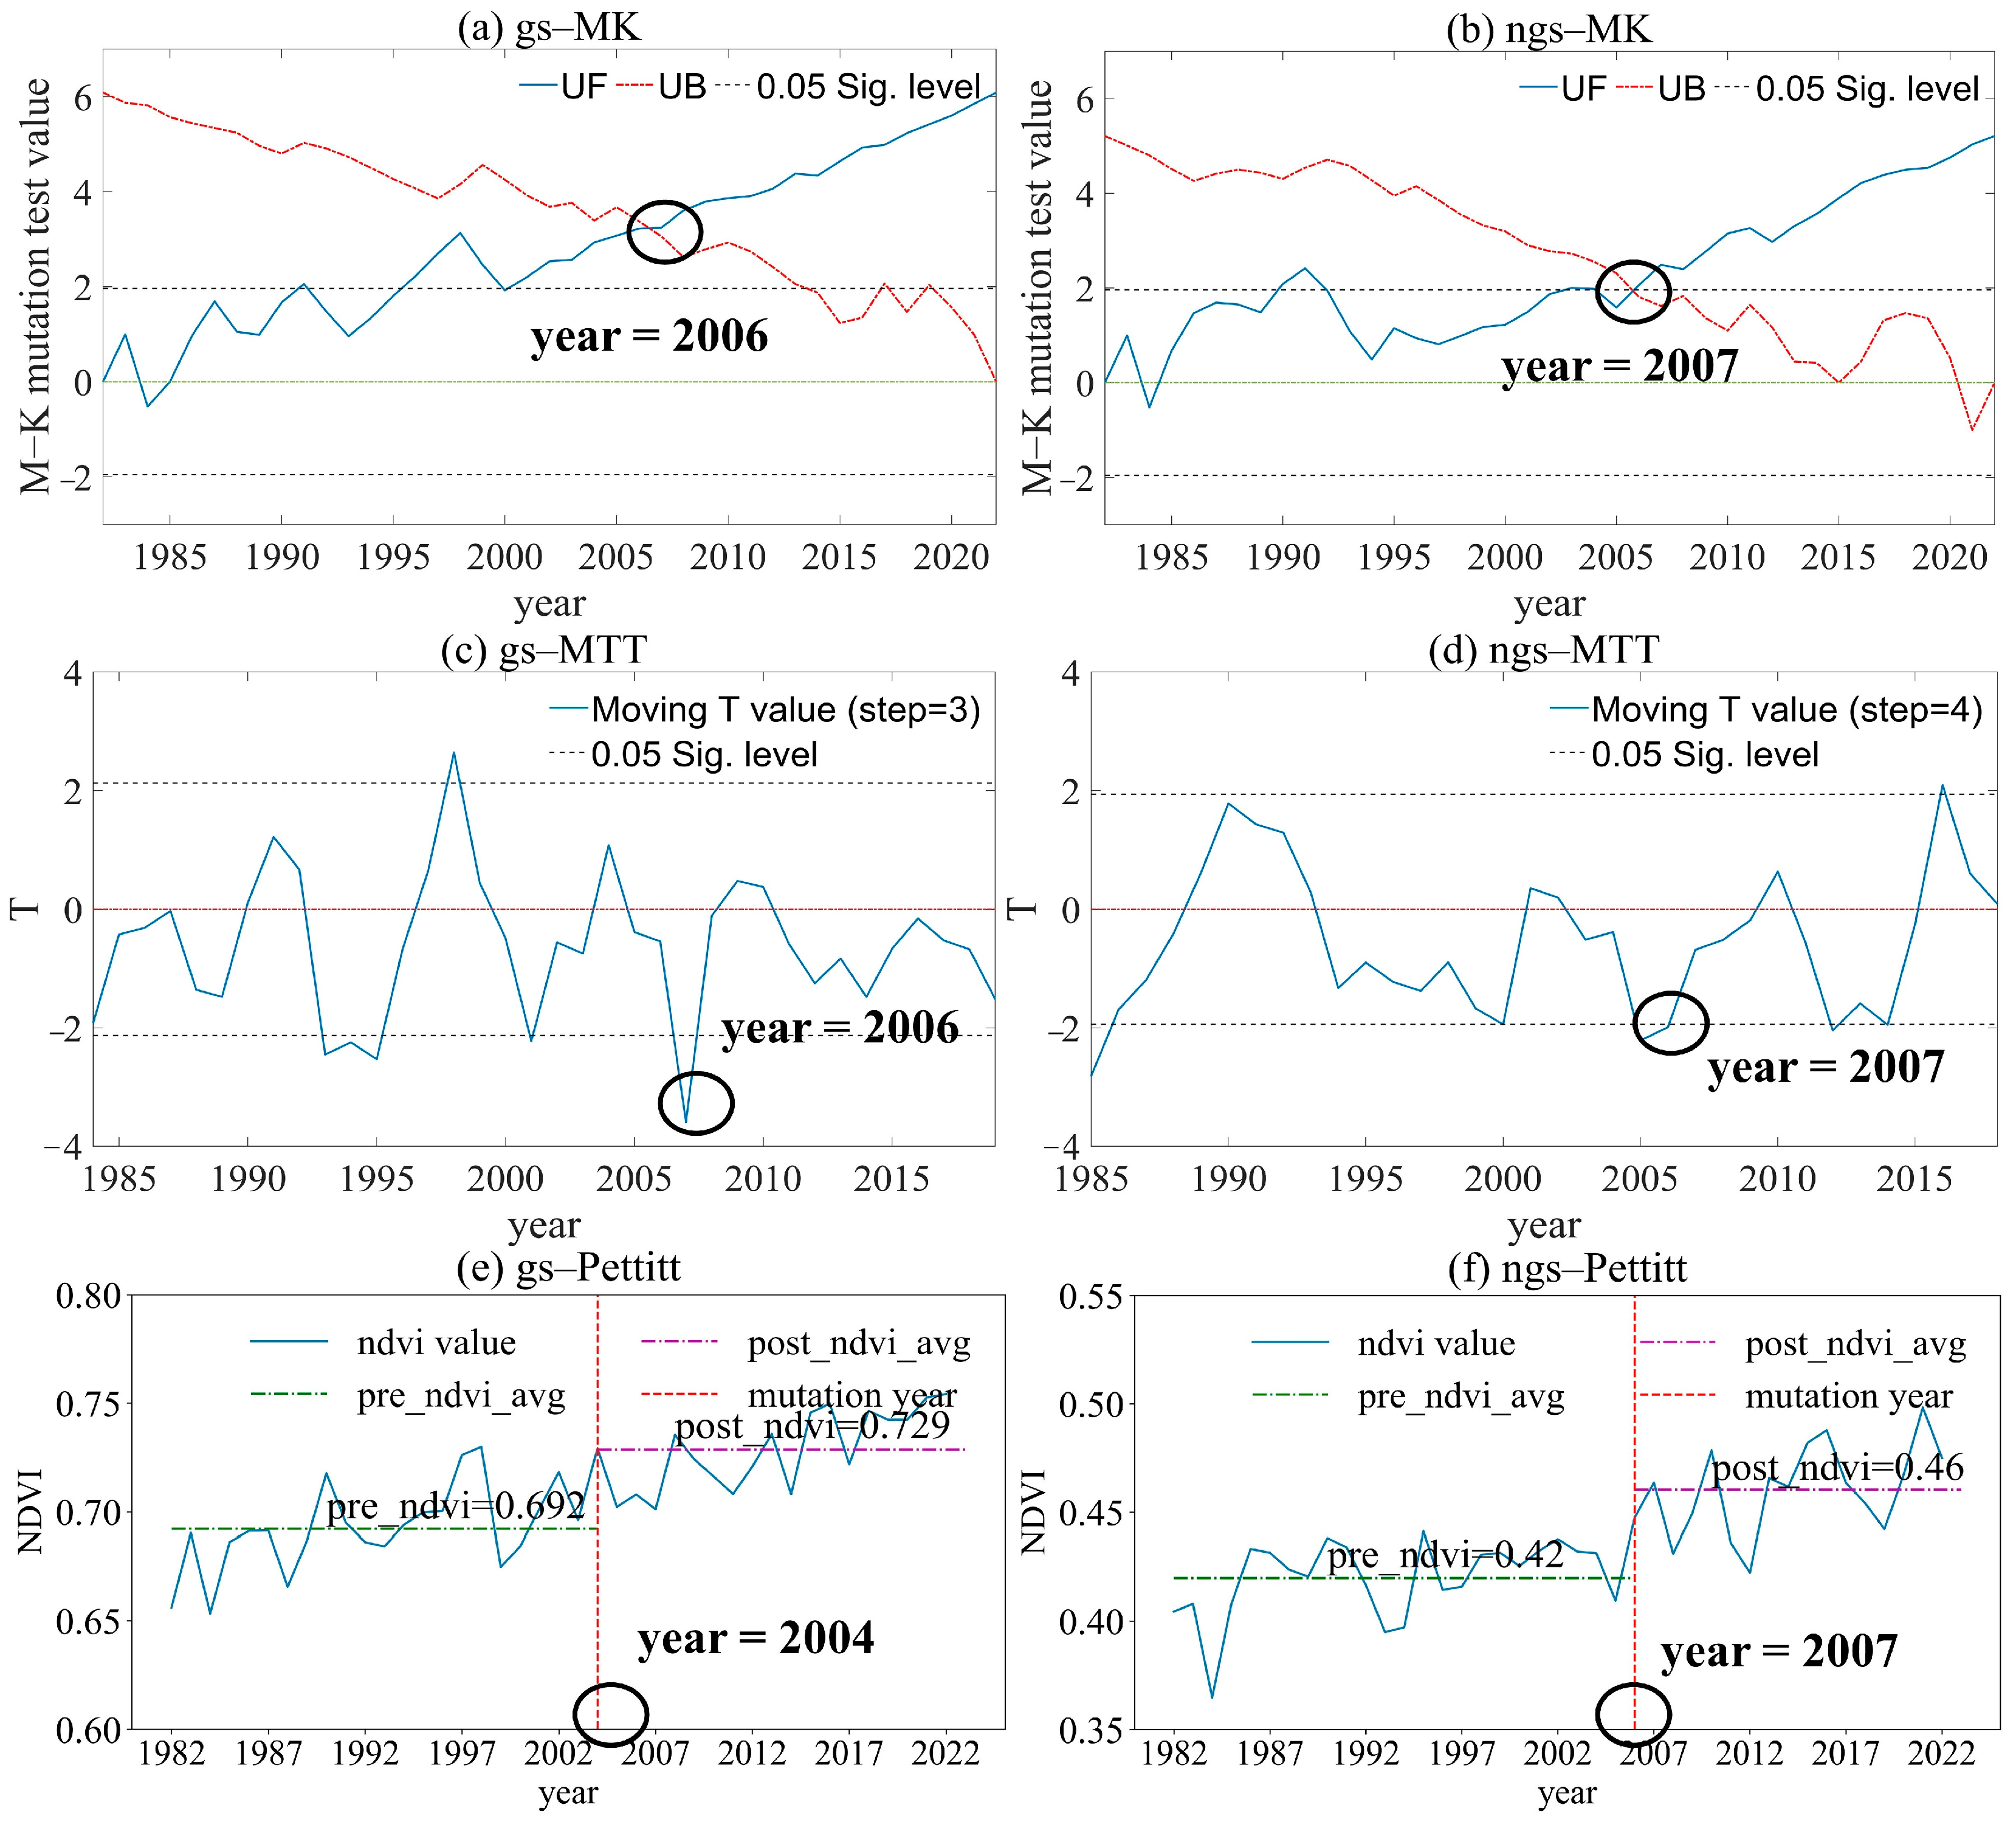
We detected the mutation point using the Mann–Kendall mutation test, MTT, and Pettitt’s test (Figure 4). This identified the mutation years for the growing season and non-growing season as 2006 and 2007, respectively. During the growing season, the trends in the Mann–Kendall statistics (UF and UB) intersected in 2006, indicating a potential mutation point, although the intersection was non-significant (Figure 4a); the MTT curve significantly exceeded the critical value in 2006 (Figure 4c); and the Pettitt test detected a mutation in 2004 (Figure 4e). The three methods thus detected growing-season mutation points that were only slightly different. For the non-growing season, a significant Mann–Kendall intersection occurred in 2007 (Figure 4b); the MTT curve significantly exceeded the critical value in 2007 (Figure 4d); and the Pettitt test identified a mutation in 2007 (Figure 4f).
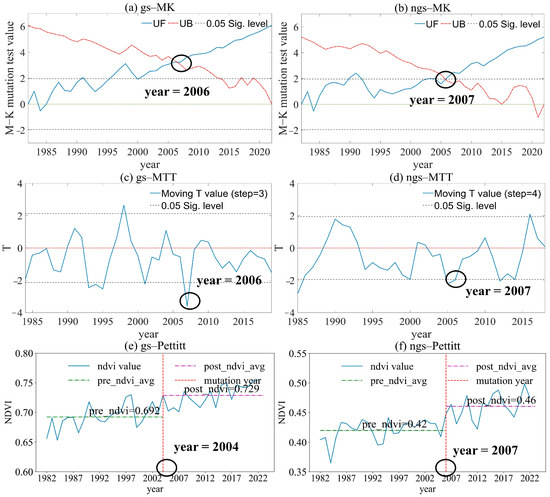
Figure 4.
Mutation tests for NDVI in the Qinba Mountains from 1982 to 2022. Mann–Kendall mutation test for the growing (a) and non-growing (b) seasons; MTT for the growing (c) and non-growing (d) seasons; Pettitt test for growing (e) and non-growing (f) seasons. Black circles, mutation years. Results were considered significant at α = 0.05.
3.2. Spatial Patterns of Changes in NDVI
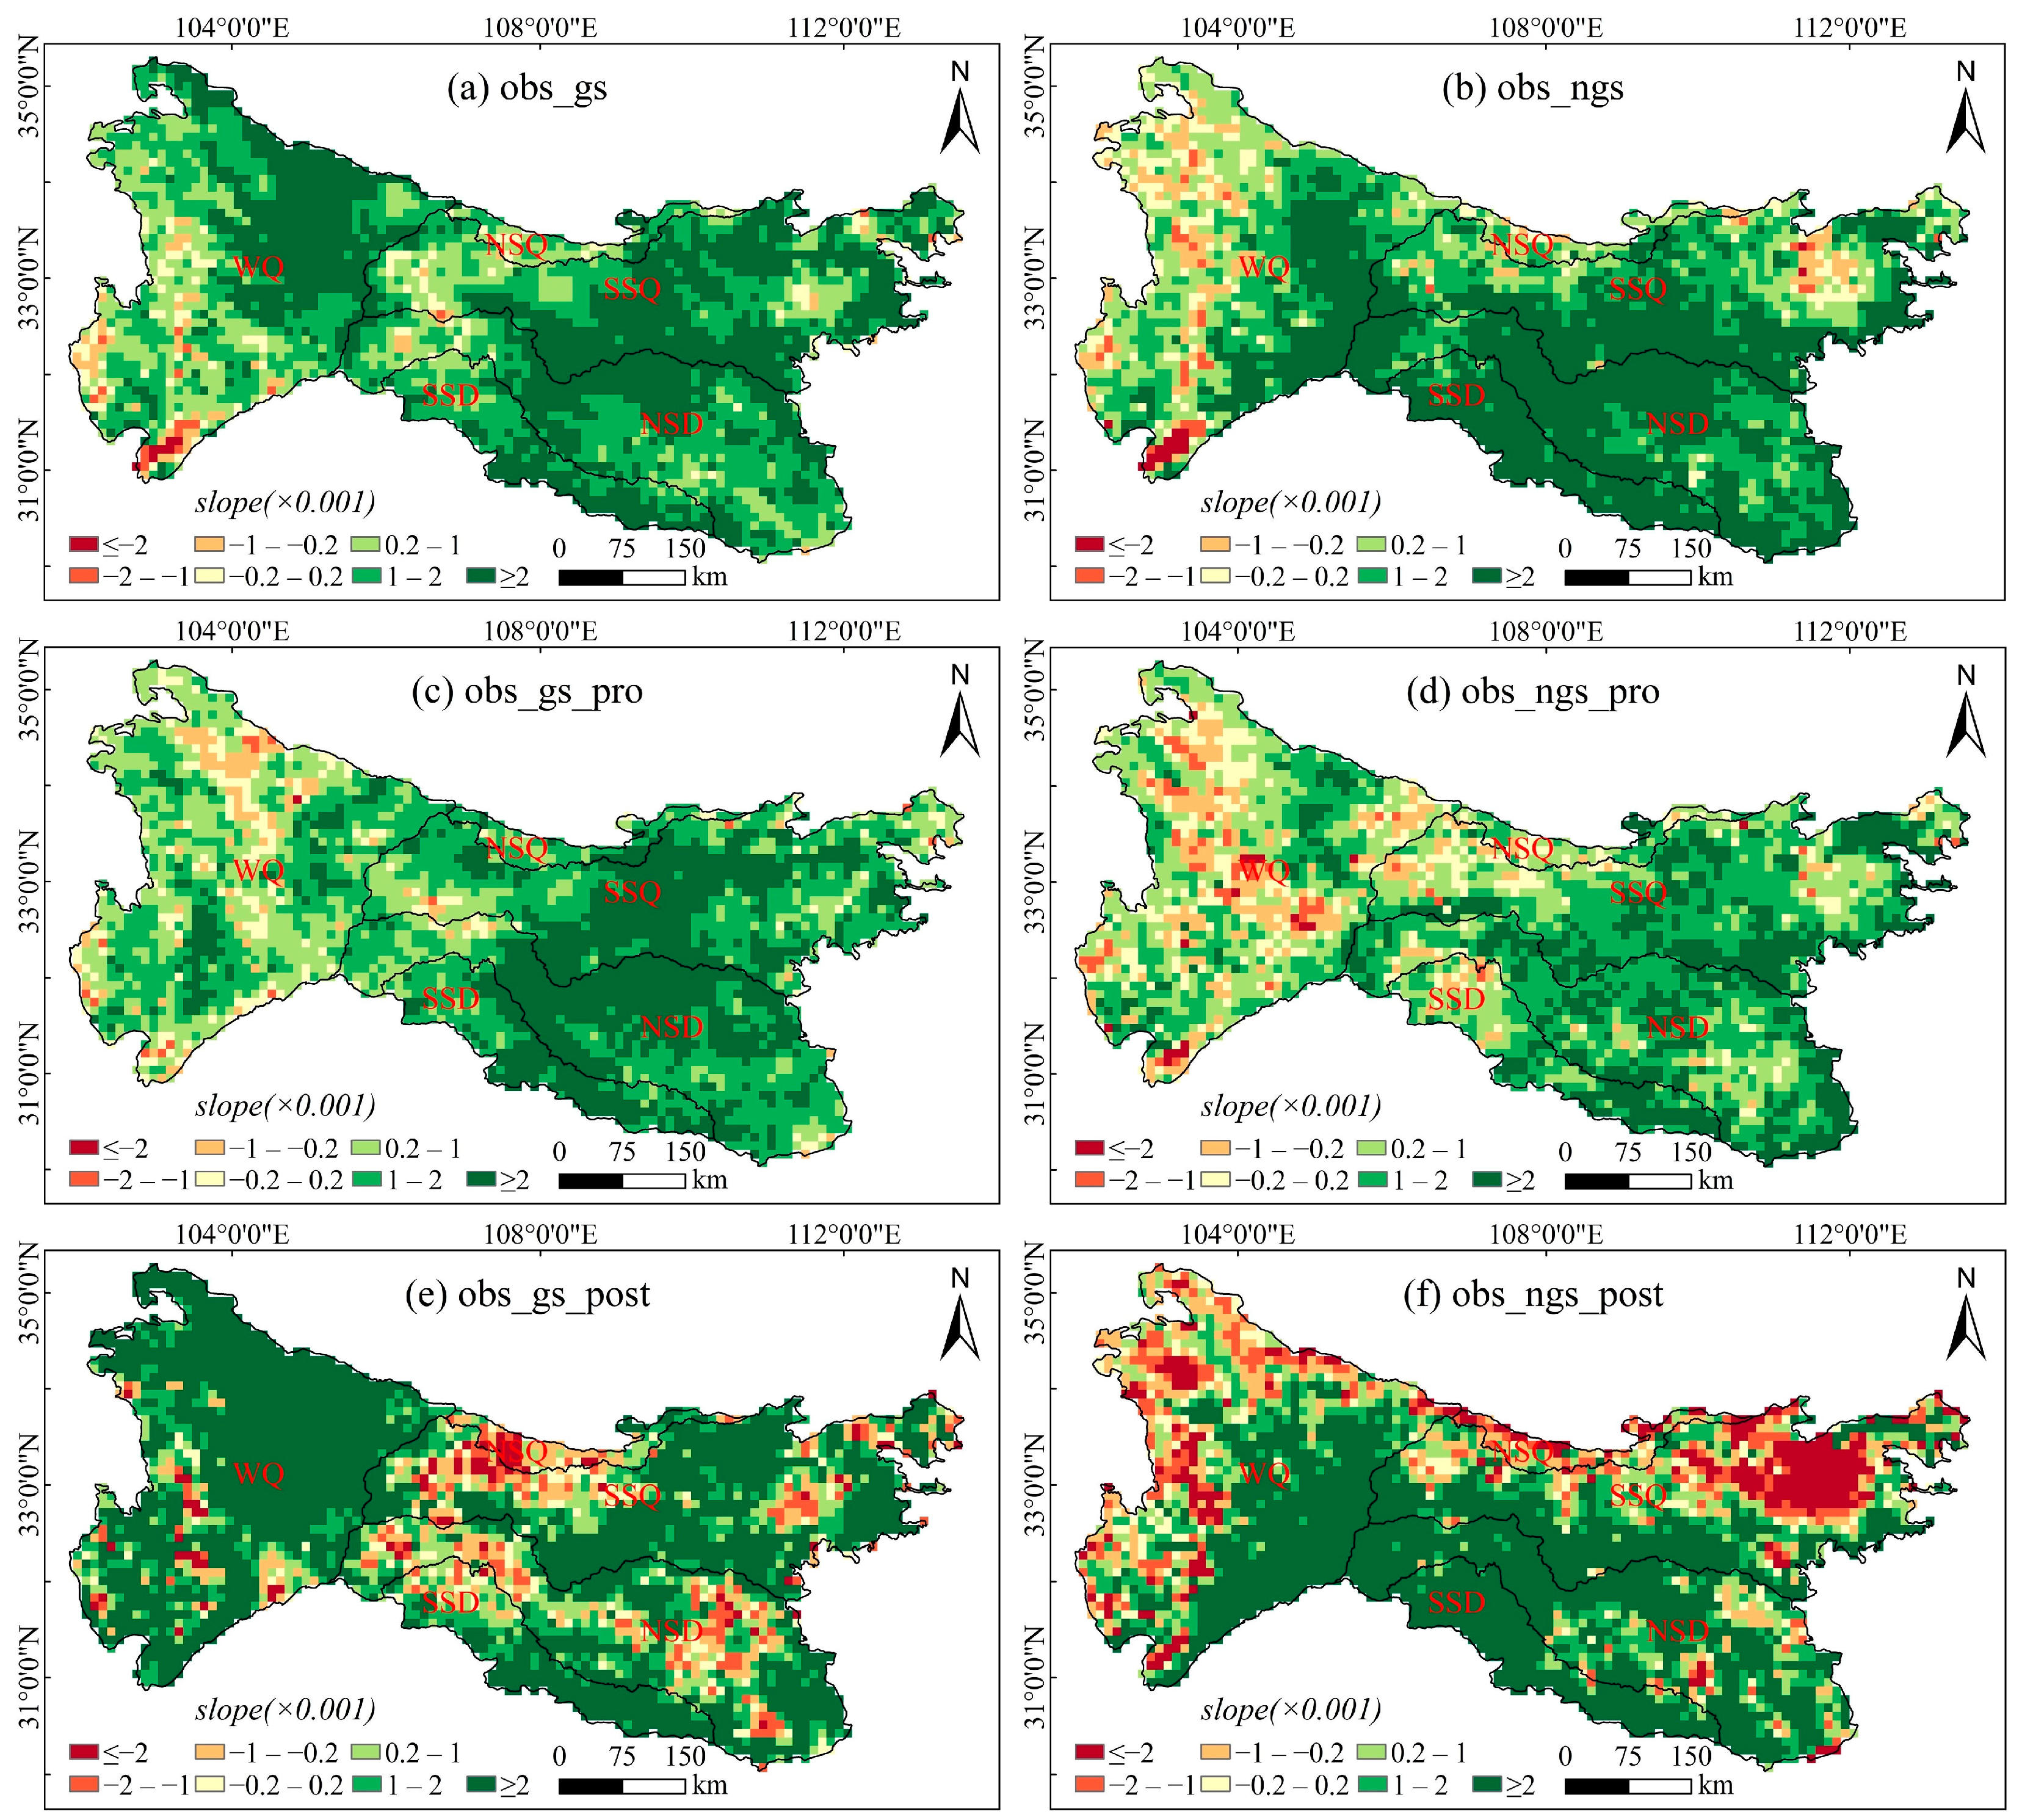
The spatial pattern of the observed NDVI values was examined (Figure 5). NDVIobs exhibited marked spatial heterogeneity throughout the time series, consistent with prior findings [2,54]. For all years, growing-season NDVIobs increased in ca. 93.4% of the area, with 40.3% exhibiting a marked increase (Figure S1a), primarily northeast of WQ, east of SSQ, and north of NSD (Figure 5a). Before the mutation point, NDVIobs increased in ca. 90.9% of the area, increasing markedly in 30.3% of the area (Figure S1b). The area exhibiting a marked increase in NDVIobs was ca. 10% smaller in the premutation period than over the entire period, primarily due to differences in WQ (Figure 5c). After the mutation point, the area exhibiting an increase in NDVI decreased to ca. 81.7%; the proportion of the area exhibiting a marked increase rose by 16.4%, primarily in WQ; and a larger proportion of the area (ca. 14%, primarily in NSQ, SSQ, and NSD) exhibited a decline in NDVIobs (Figure 5e and Figure S1c).

Figure 5.
Spatial pattern of the observed NDVI values in the growing and non-growing seasons in the Qinba Mountains from 1982 to 2022. (a,c,e) Growing-season results for the entire time series, before the mutation point, and after the mutation point, respectively; (b,d,f) Non-growing-season results for the entire time series, before the mutation point, and after the mutation point, respectively.
For the non-growing season (all years), ca. 88.2% of the area exhibited an increase in NDVIobs; this increase was marked in 45.4% (Figure S1d) of the area, primarily in the eastern part of the WQ, southern part of the SSQ, western part of the NSD, and in the SSD (Figure 5b). Before the mutation point, NDVIobs increased in ca. 80.1% of the area, markedly in 21.5% (Figure S1e). After the mutation point, the area with a marked increase in NDVI was 23.9% smaller, with all parts of the area showing a markedly lower increase (Figure 5d). After the mutation point, only ca. 70.6% of the area exhibited an increase in NDVIobs; the increase was marked in 46.6%, primarily in the eastern part of WQ and the southern parts of SSQ, NSQ, and SSD. After the mutation point, ca. 24.4% of the area (in the western parts of the WQ, NSQ, and northeastern part of the SSQ) exhibited a decrease in NDVIobs; this was particularly notable in the northeastern part of the SSQ (Figure 5f and Figure S1f).
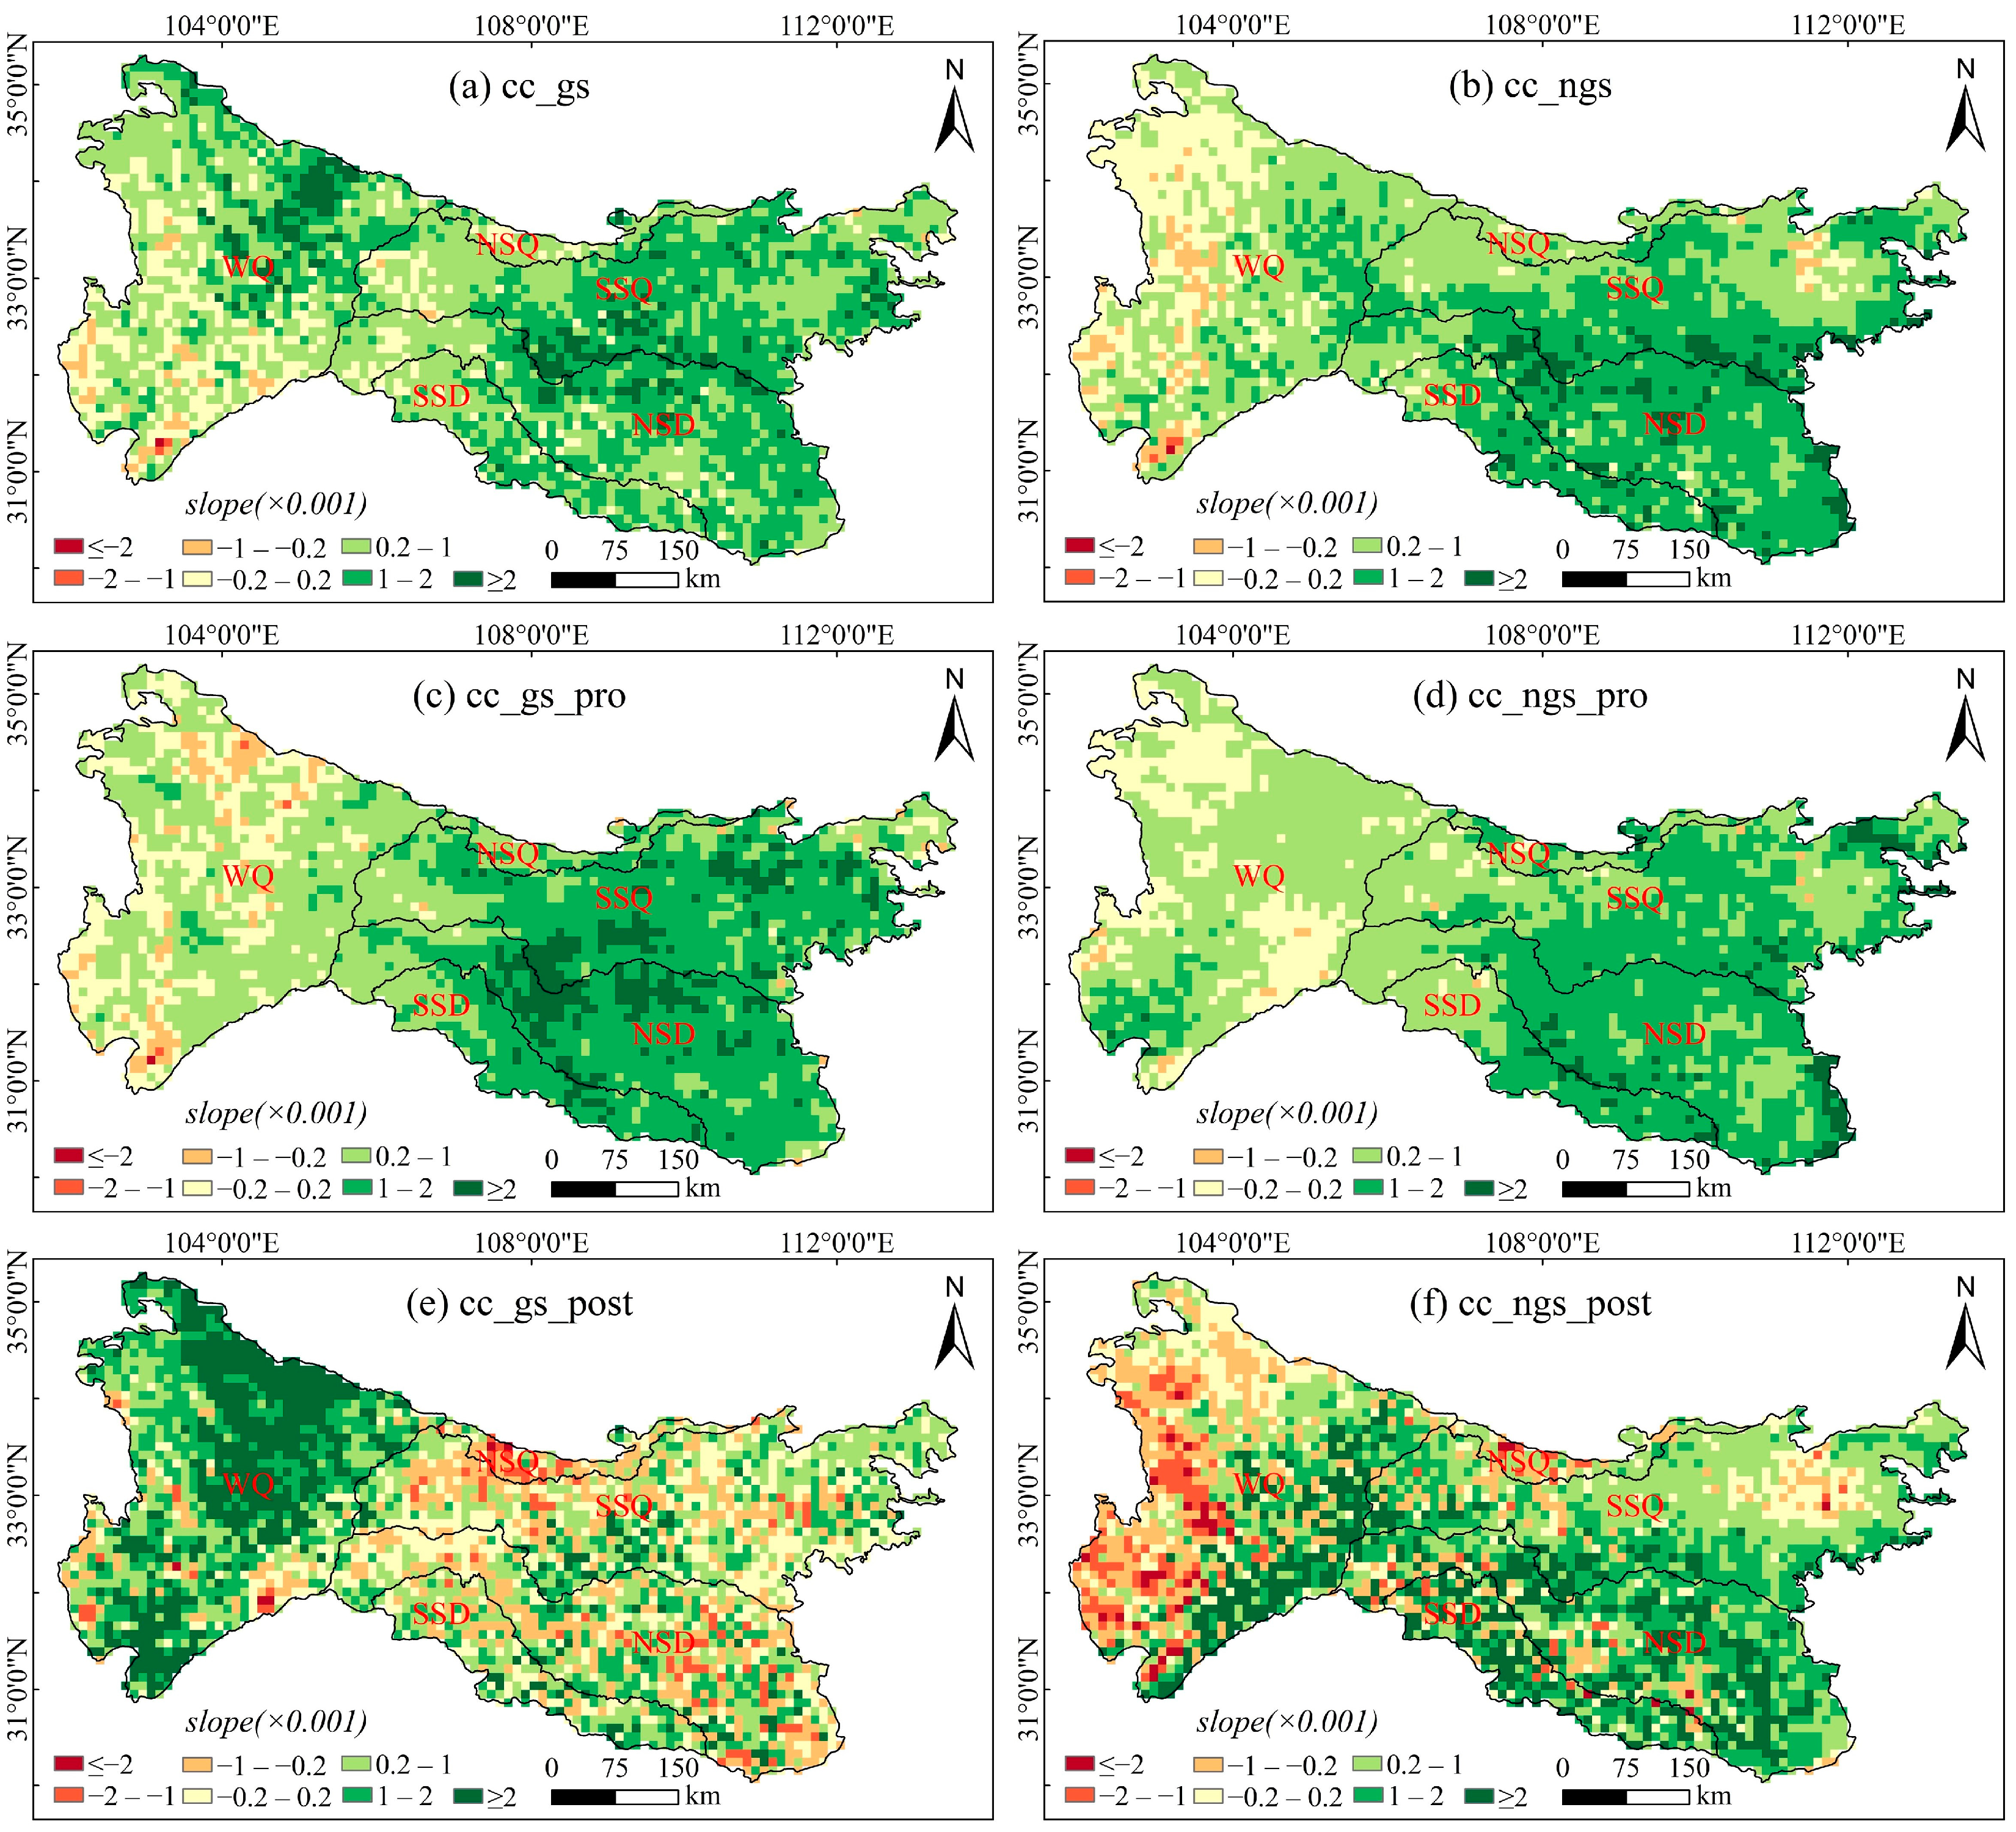
NDVIcc exhibited spatial heterogeneity that varied between the study periods (Figure 6). For all years, growing-season NDVIcc increased in ca. 85.1% of the area, moderately in 36.2% and markedly in 6.3% of the area (Figure S2a), primarily in the northeastern part of the WQ, middle part of the SSQ, middle and eastern parts of the NSD, and the lower part of the SSD (Figure 6a). Before the mutation point, growing-season NDVIcc increase in ca. 84.6% of the area, moderately in 39.3% and markedly in 8.2% (Figure S2b), primarily in SSQ, NSD, and SSD (Figure 6c). After the mutation point, ca. 63.7% of the area exhibited an increase in NDVIcc, which was moderate in 21.4% and marked in 16.5%, primarily in the WQ. In NSQ, SSQ, NSD, and SSD, ca. 18.4% of the area exhibited a decrease in NDVIcc (Figure 6e and Figure S2c).

Figure 6.
Spatial pattern of variability in NDVI in response to climate change (NDVIcc) during the growing and non-growing seasons in the Qinba Mountains from 1982 to 2022. (a,c,e) Growing-season results for the entire time series, before the mutation, and after the mutation, respectively; (b,d,f) Non-growing-season results for the entire time series, before the mutation, and after the mutation, respectively.
In the non-growing season, for all years, NDVIcc exhibited an increase in ca. 83.7% of the area, moderate in 39.3% and marked in 5.6% of the area (Figure S2d), primarily in the SSQ, NDS, and SSD (Figure 6b). Before the mutation point, non-growing-season NDVIcc exhibited an increase in ca. 86.8% of the area, moderate in 37.3% and marked in 3.6% (Figure S2e), with a spatial pattern similar to that for the entire time series (Figure 6d). After the mutation point, non-growing-season NDVIcc increased in only ca. 67.8% of the area, moderately in 23.7% and significantly in 16.3% of the area. Approximately 19.1% of the area, in the western part of WQ, exhibited slight decline in NDVIcc (Figure 6f and Figure S2f).
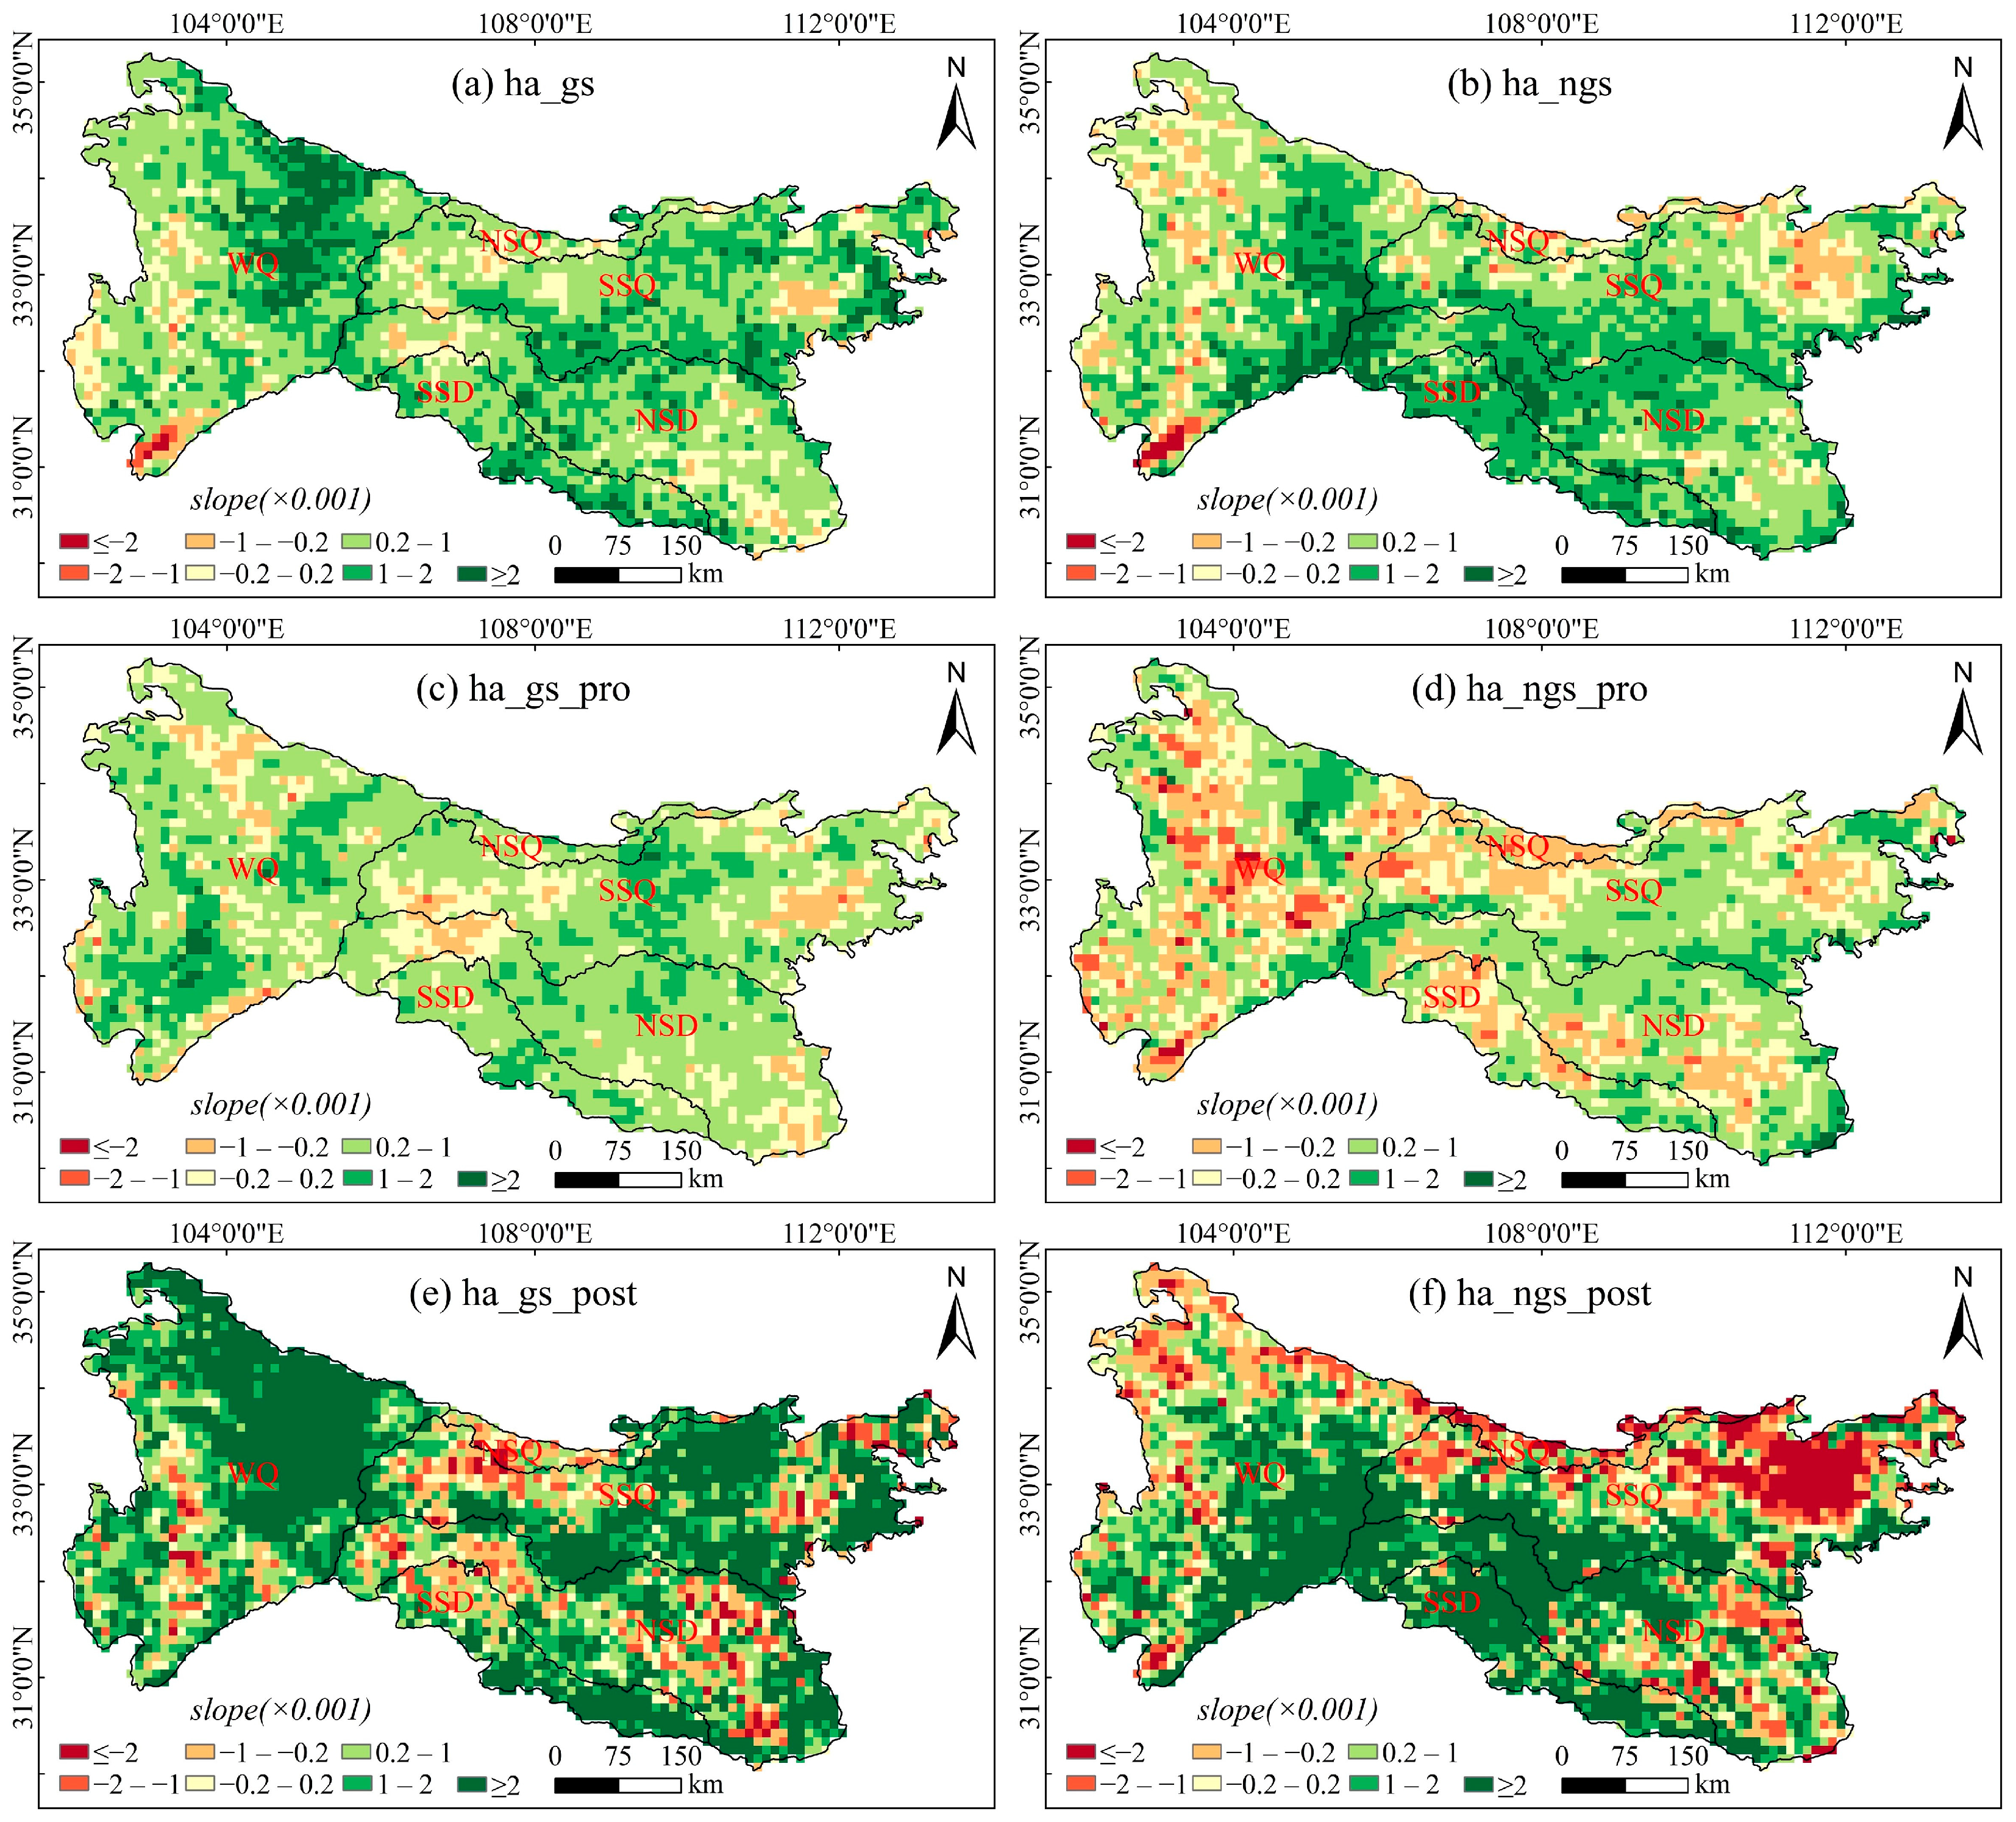
NDVIha varied over time (Figure 7) and this differed between the study periods. For all years, growing-season NDVIha increased in ca. 84.2% of the area, but markedly in only 8.4% of the area (Figure S3a), primarily in the northeastern part of the WQ (Figure 7a). Before the mutation point, growing-season NDVIha increased in ca. 75.8% of the area, moderately in 16% (Figure S3b), primarily in the southwestern part of the WQ and central part of the SSQ (Figure 7c). After the mutation point, growing-season NDVIha increased in ca. 77.8% of the area, markedly in ca. 41.9% of the area, primarily in the upper WQ, western SSQ, and lower SSD. After the mutation point, the area exhibiting a decline in growing-season NDVIha was ca. 16.3% (Figure 7e and Figure S3c).
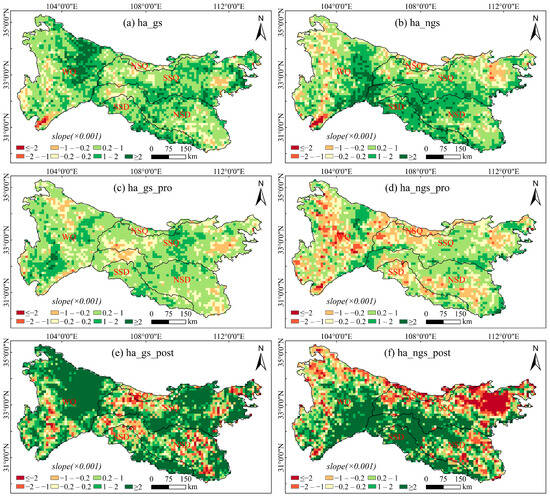
Figure 7.
Spatial pattern of the variability in NDVI associated with human activity (NDVIha; the variability not attributable to climate change) during the growing and non-growing seasons in the Qinba Mountains from 1982 to 2022. (a,c,e) Growing-season results for the entire time series, before the mutation, and after the mutation, respectively; (b,d,f) Non-growing-season results for the entire time series, before the mutation, and after the mutation, respectively.
For all years, non-growing-season NDVIha increased in ca. 78.4% of the area, moderately in 33.3% and markedly in 8.7% (Figure S3d), primarily in the western part of the WQ, the lower part of the SSQ, the upper part of the NSD, and in the SSD (Figure 7b). Before the mutation point, non-growing-season NDVIha increased in ca. 55.4% of the area, slightly in 44.5% and moderately in 13%. The area with a declining NDVIha (in the central WQ, NSQ, western SSQ, and upper SSD) expanded substantially to ca. 24.1% (Figure S3d and Figure 7e). After the mutation point, non-growing-season NDVIha increased in ca. 64.2% of the area, markedly in 32.5%, primarily in the western part of the WQ, lower part of the SSQ, and upper parts of the NSD and SSD (Figure S3f and Figure 7f).
3.3. Hot-Spot Analysis of the Change in NDVI
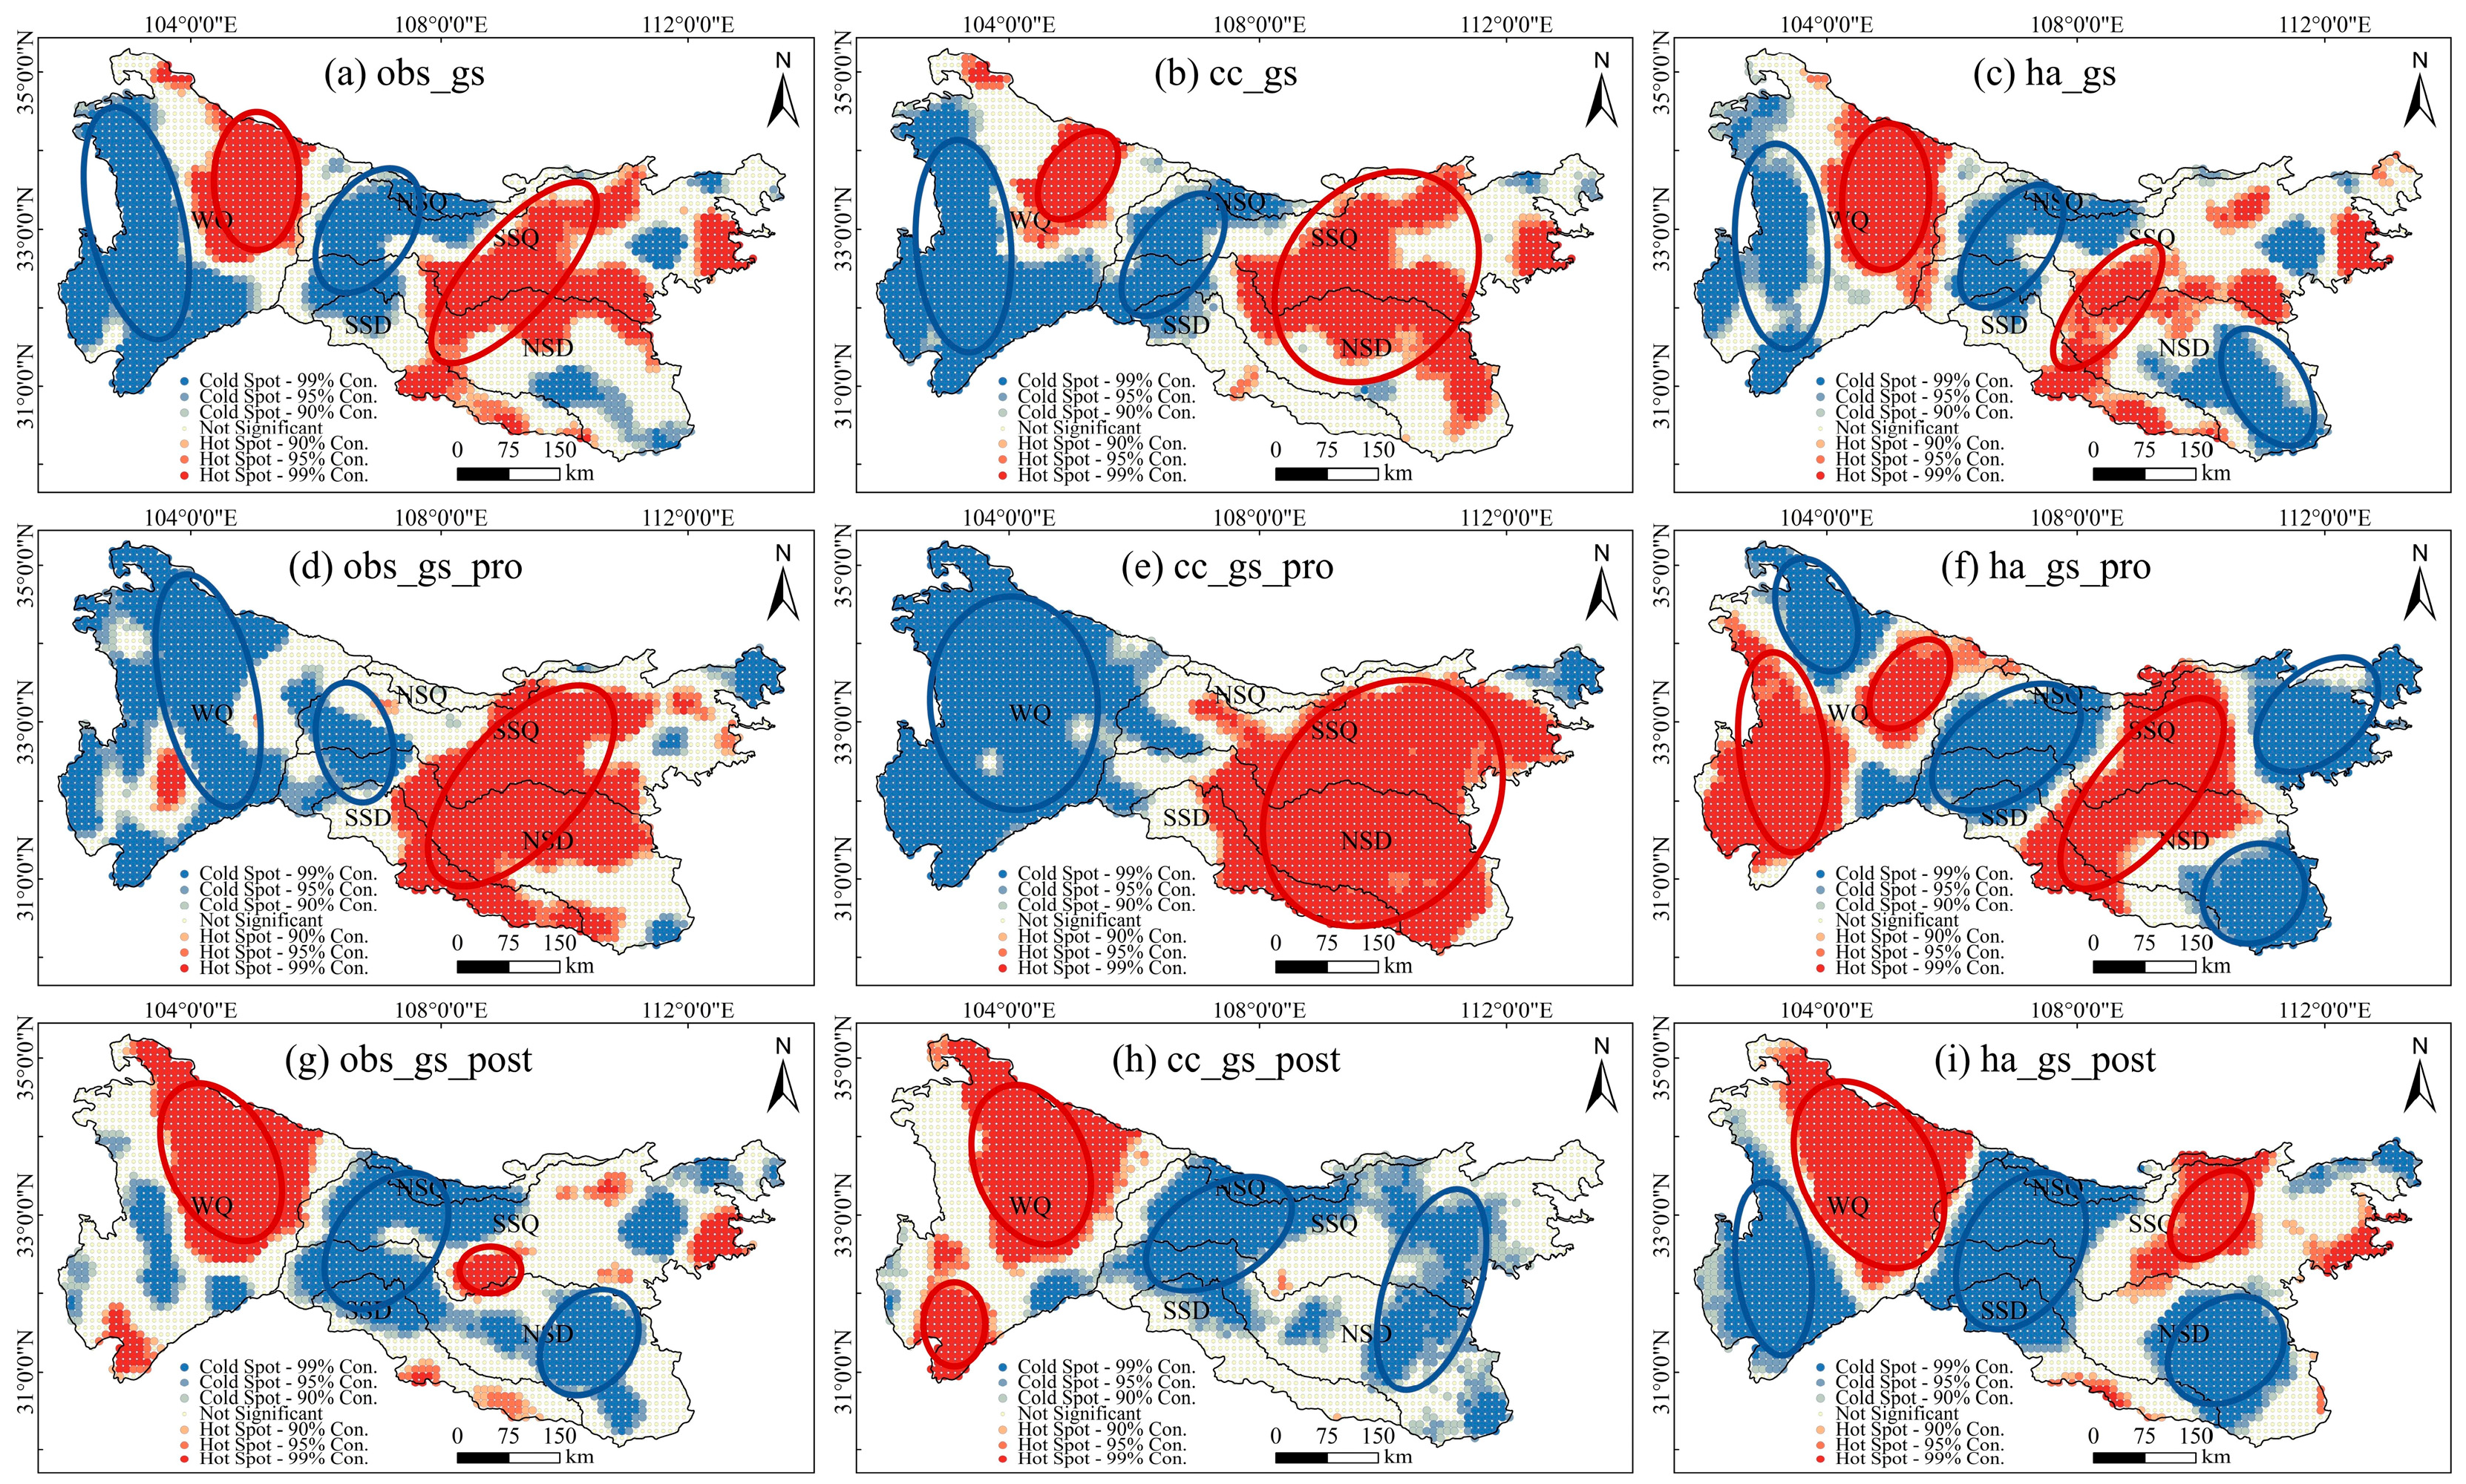
Hot-spot analysis of growing-season slope(NDVI) was conducted (Figure 8). For all years, slope(NDVIobs), slope(NDVIcc), and slope(NDVIha) each exhibit one cold spot and one hot spot in WQ, and their locations and ranges were similar. The cold spot is in the western part of the WQ at a higher altitude than the hot spot; this higher altitude at this location might explain the low rate of change in growing-season NDVI for all years. The hot spot for growing-season NDVI for all years is in the eastern part of the WQ and is smaller than the cold spot. In other areas, slope(NDVIobs) and slope(NDVIcc) each exhibit a single hot spot and single cold spot, with their hot spots being larger; slope(NDVIha) has one hot spot and two cold spots, and their ranges are similar. For the period before the mutation point, the effects on NDVI of climate change and human activity differed significantly. The parameter slope(NDVIcc) exhibits only one hot spot and one cold spot, and the cold spot completely occupies the WQ area, whereas the hot spot occupies the eastern Qinba Mountains. Climate change affected NDVI less in WQ than in other areas.

Figure 8.
Hot-spot analysis of growing-season slope(NDVI) in the Qinba Mountains. (a,d,g) Results for slope(NDVIobs) for all years, before the mutation point, and after the mutation point, respectively; (b,e,h) Results for slope(NDVIcc) for all years, before the mutation point, and after the mutation point, respectively; (c,f,i) Results for slope(NDVIha) for all years, before the mutation point, and after the mutation point, respectively. Red ellipse, hot spot (high-value cluster); blue ellipse, cold spot (low-value cluster).
The parameter slope(NDVIha) exhibits three hot spots and four cold spots, with strong local characteristics. The locations and ranges of the slope(NDVIha) hot and cold spots changed significantly at the mutation point. In WQ, for slope(NDVIobs) and slope(NDVIcc), the cold spots became hot spots, whereas hot spots in the other areas became cold spots. The hot and cold spots were smaller after the mutation point, possibly owing to an increase in extreme climatic events after the mutation point. In WQ, the hot and cold spots of slope(NDVIha) changed at the mutation point; the hot spots in other areas became smaller, and one cold spot disappeared, possibly owing to increased urbanization intensity after the mutation point.
Hot-spot analysis was conducted for slope(NDVI) for the non-growing season (Figure 9). Compared with the growing season, the non-growing season exhibits latitudinal differences in the cold and hot spots of slope(NDVI) outside the WQ. The non-growing-season hot spots are located primarily on the south slope and cold spots on the north slope. This phenomenon was particularly marked after the mutation point. This difference may be related to differences in climate and vegetation type between the north and south slopes. The south slope experiences primarily a subtropical monsoon climate and the north slope primarily a temperate continental climate; the south slope vegetation is dominated by evergreen broad-leaved forests, while that of the north slope is dominated by temperate deciduous broad-leaved forests. In the non-growing season, both the temperature and rainfall are reduced. NDVI therefore changed less on the north slope than on the south slope. In the WQ region, the cold spots are distributed at higher altitudes, and their locations and ranges are essentially the same before and after the mutation point.
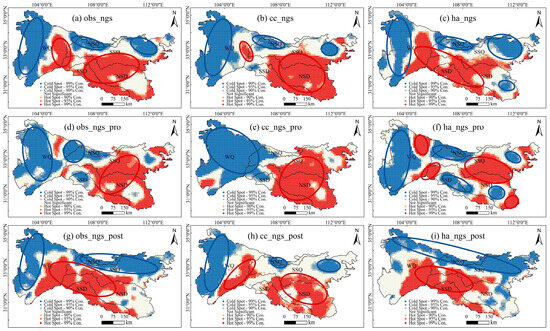
Figure 9.
Hot-spot analysis of slope(NDVI) in the Qinba Mountains in the non-growing season. (a,d,g) Results for slope(NDVIobs) for all years, before the mutation point, and after the mutation point, respectively; (b,e,h) Results for slope(NDVIcc) for all years, before the mutation point, and after the mutation point, respectively; (c,f,i) Results for slope(NDVIha) for all years, before the mutation point, and after the mutation point, respectively. Red ellipse, hot spot (high-value cluster); blue ellipse, cold spot (low-value cluster).
3.4. Spatial Patterns in the Effects of the Drivers on NDVI
Residual analysis was used to distinguish the effects of climate change and human activity on vegetation dynamics (Figure 10). For all years, during the growing season, vegetation growth was promoted by both these factors in ca. 95.6% of the study area, with 87.4% of the area affected by both factors (Figure S4a). Before the mutation point, these factors enhanced vegetation growth in ca. 93.9% of the area, with 81.3% affected by both factors. In ca. 2.9% of the area, in the northern part of the WQ, both factors together caused NDVI to decline (Figure 10c and Figure S4b). After the mutation point, these factors promoted vegetation growth in ca. 84.1% of the area, with both factors together affecting 59.9% of the area and human activity alone affecting 17.9% (Figure S4c). Of the areas where both factors enhanced NDVI before the mutation point, ca. 11.6% (primarily in SSQ, NSD, and SSD) was affected only by human activity after the mutation point (Figure 10e).
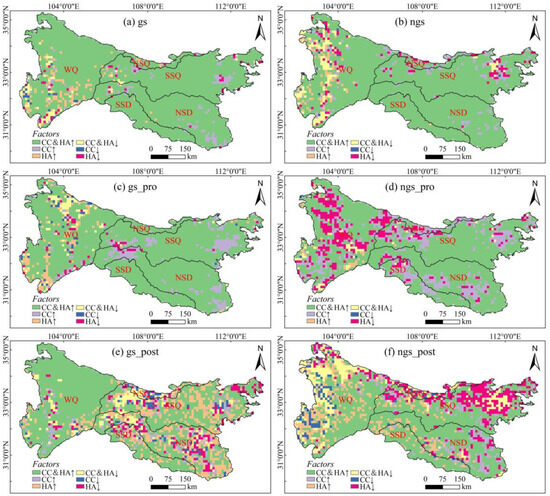
Figure 10.
Spatial patterns of the effects of the responses of NDVI to the drivers in the Qinba Mountains from 1982 to 2022. (a,c,e) Growing-season results for all years, before the mutation, and after the mutation, respectively; (b,d,f) Non-growing-season results for all years, before the mutation, and after the mutation, respectively. CC, climate change; HA, human activity; CC&HA, both factors together. ↑, enhanced vegetation growth; ↓, reduced vegetation growth.
For the non-growing season, for all years, the drivers promoted vegetation growth in ca. 91.7% of the area, with 82.9% affected by both factors. NDVI declined owing to both factors in ca. 4.3% of the western WQ and owing to human activity alone in ca. 3.7% of the northeastern SSQ (Figure 10b and Figure S4d). Before the mutation point, the drivers promoted vegetation growth in ca. 85.4% of the area, with ca. 65% affected by both factors and 19.4% affected by climate change alone. Vegetation growth declined in ca. 12.5% of the area (in the central WQ, NSQ, and northwest SSQ) owing to human activity alone (Figure 10d and Figure S4e). After the mutation point, these factors enhanced vegetation growth in ca. 73.3% of the area, with 52.4% affected by both factors and 12.6% affected by human activity alone. Both factors together caused vegetation growth to decline in ca. 10.2% of the area, primarily in the western part of the WQ and the northeastern part of the SSQ; human activity caused it to decline in ca. 13.1% of the area, primarily in the NSQ, the upper part of the SSQ, and the lower part of the NSD (Figure 10f and Figure S4f).
3.5. Relative Effects of the Drivers on NDVI
The effects of the drivers varied in magnitude and direction within each region. Using residual analysis and slope analysis (Table 2), we calculated the relative effects of the two drivers on NDVI at the pixel scale. This revealed marked spatial heterogeneity in their effects.
The spatial patterns of the effects of each driver during the growing season were evaluated (Figure 11). For all years, vegetation growth was substantially affected by human activity in WQ and SSD. Human activity contributed >60% to the change in NDVI in ca. 26.3% of the total area. NDVI was substantially affected by climate change ca. 39.3% of the area (in NSQ, SSQ, and NSD), where it contributed >60% to the change in NDVI (Figure 11a,b and Figure S5a,d). Before the mutation point, NDVI in WQ was primarily affected by human activity, and human activity contributed >40% to the change NDVI in ca. 37.3% of the area. In NSD, SSQ, NSD, and SSD, vegetation growth was primarily affected by climate change, which contributed >40% to the change in NDVI in ca. 77.3% of the total area (Figure 11c,d and Figure S5b,e). After the mutation point, NDVI was affected more by human activity than by climate change. Climate change contributed >40% to the change in NDVI in ca. 33.8% of the area, primarily in the western WQ, and human activity >40% in ca. 65.3% of the area (Figure 11e,f and Figure S5c,f).
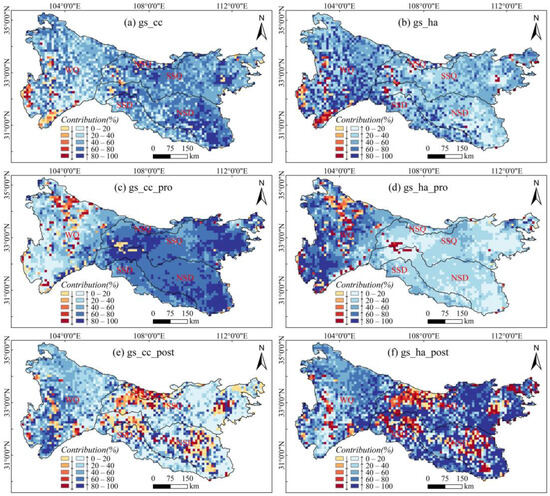
Figure 11.
Spatial patterns in the effects of the drivers on growing-season NDVI in the Qinba Mountains from 1982 to 2022. (a,c,e) Contributions of climate change to NDVI for all years, before the mutation point, and after the mutation point, respectively; (b,d,f) Contribution of human activity to NDVI for all years, before the mutation point, and after the mutation point, respectively. ↑, enhanced vegetation growth; ↓, reduced vegetation growth.
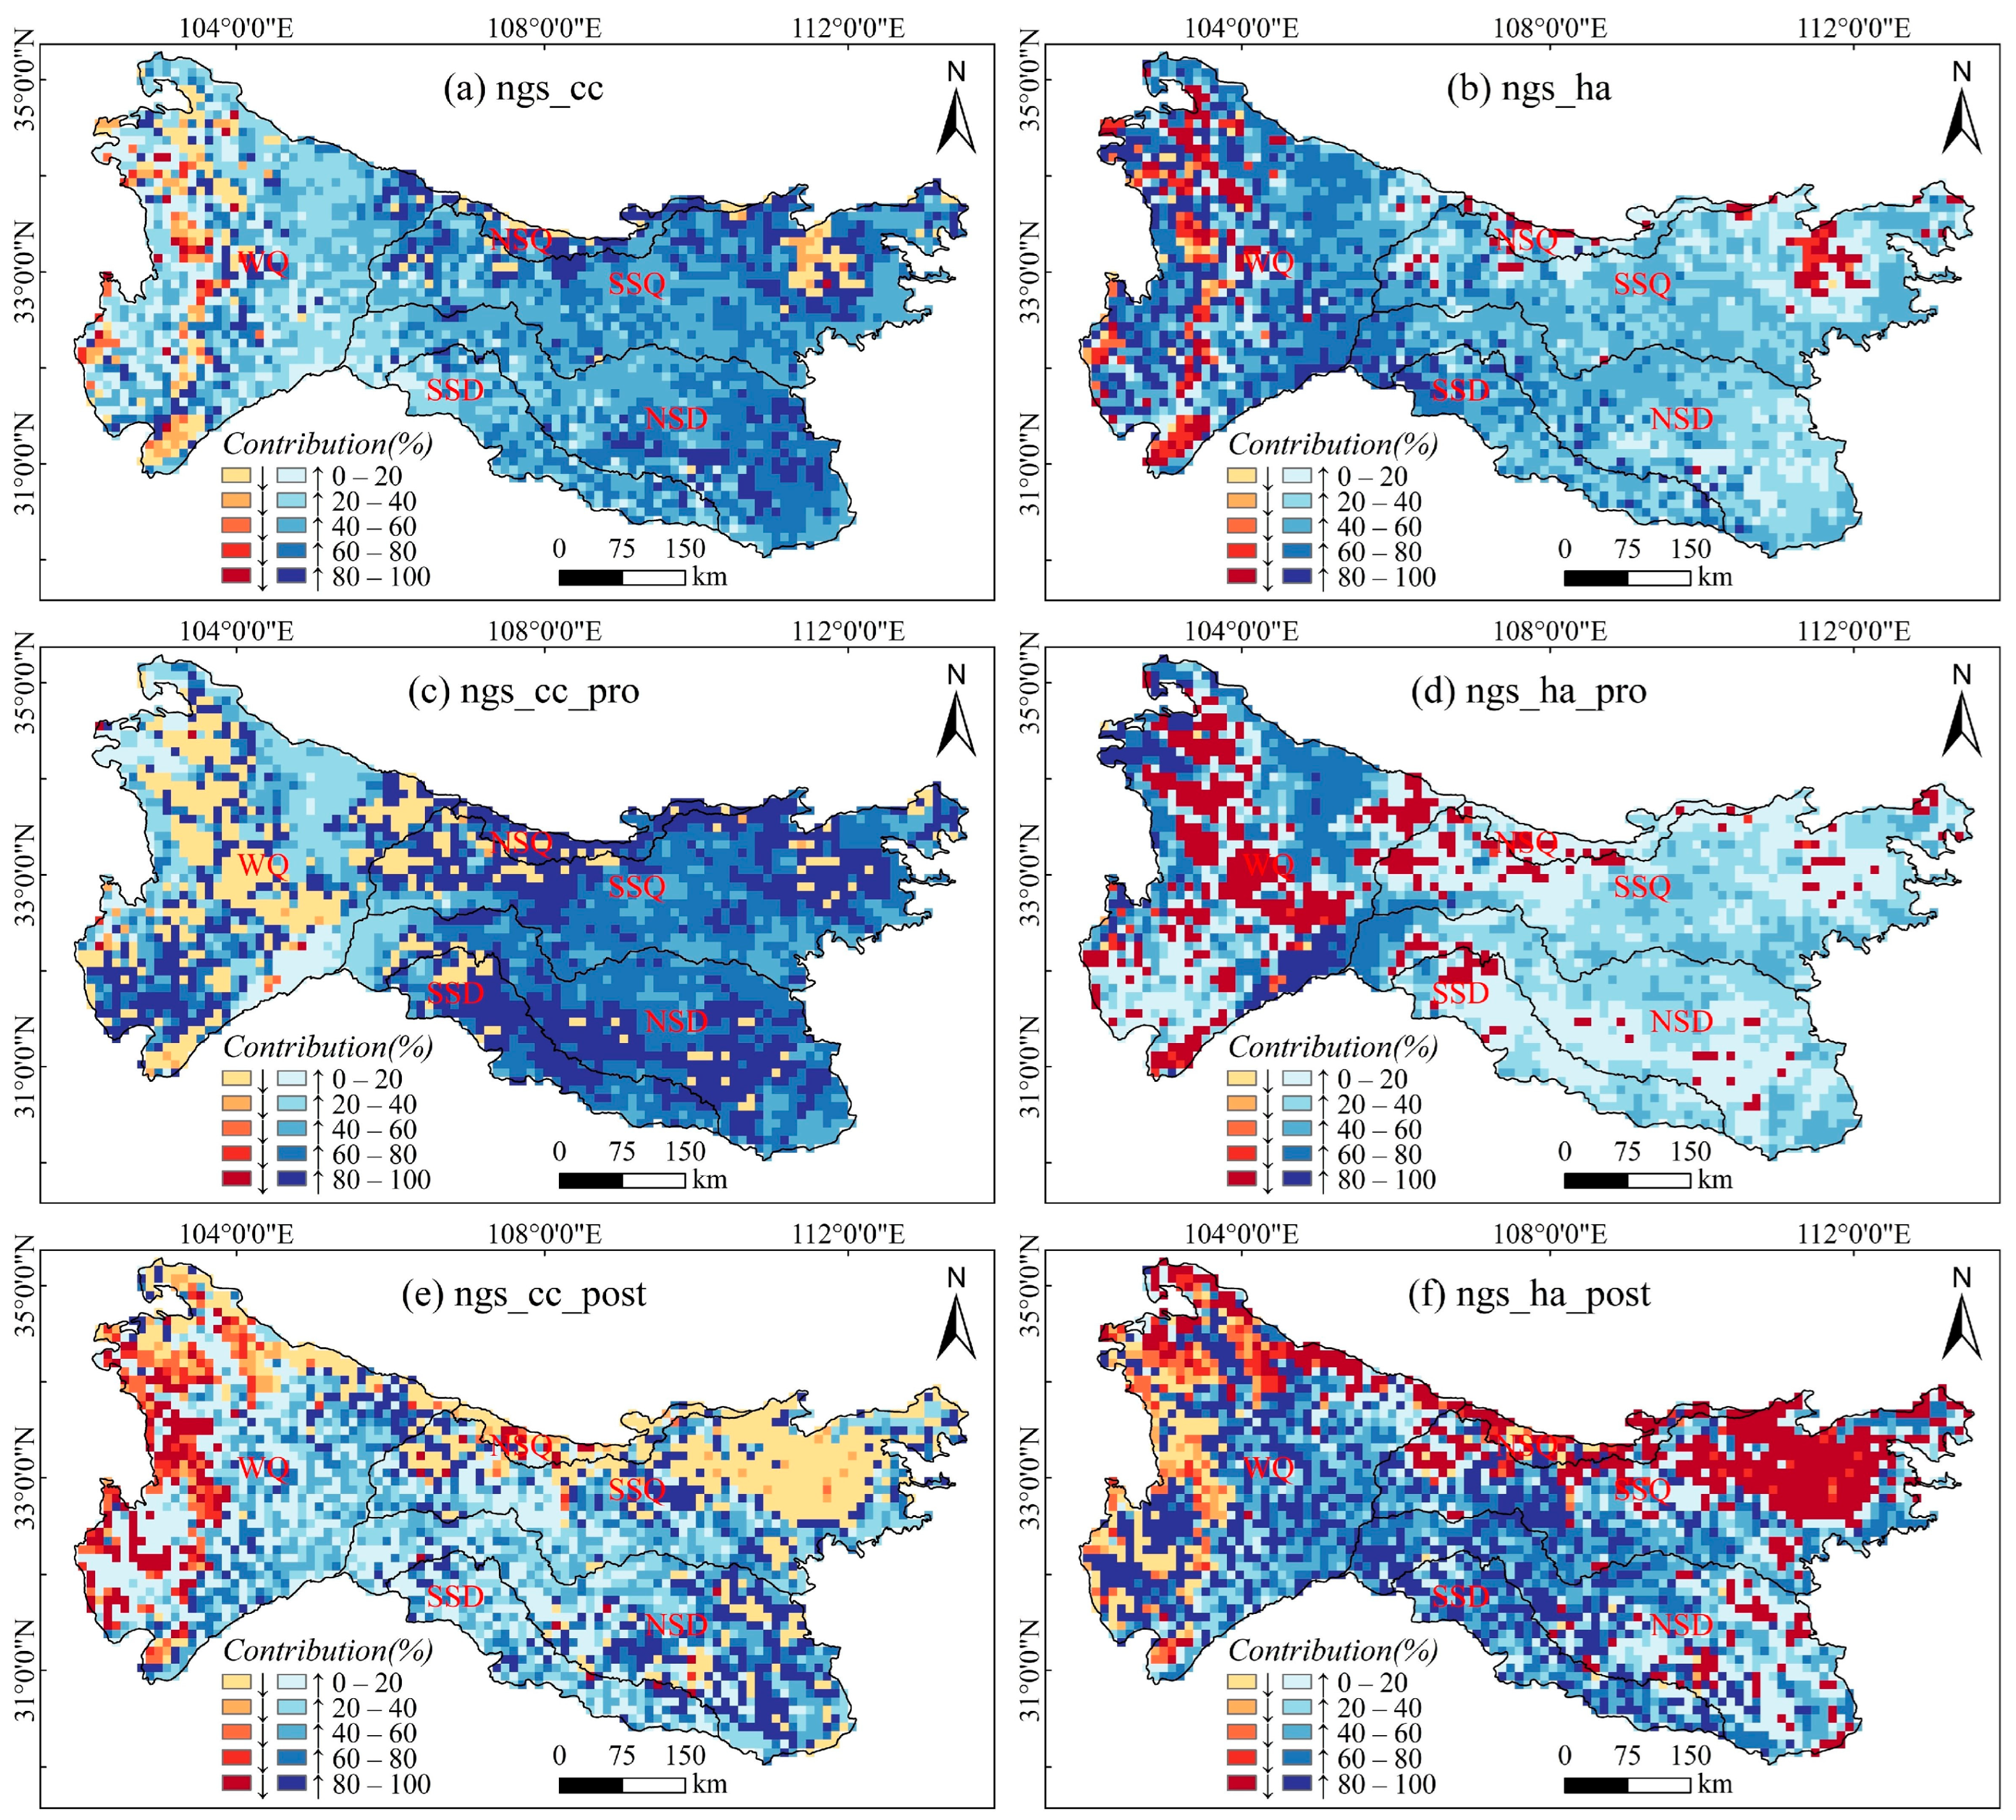
The spatial patterns in the effects of the drivers on non-growing-season NDVI were examined (Figure 12). Growing-season vegetation growth was affected by human activity more than by climate change. For all years, in those areas where these drivers reduced vegetation growth, human activity contributed >60%. In areas where they enhanced vegetation growth, human activity was the primary driver in the WQ, whereas climate change was the primary driver elsewhere (Figure 12a,b and Figure S6a,d). Before the mutation point, human activity reduced vegetation growth in ca. 13.7% of the total area (in the WQ), where it contributed >80%. In other areas, vegetation growth was affected more by climate change, which essentially enhanced it, contributing >60% in ca. 58.7% of the area (Figure 12c,d and Figure S6b,e). After the mutation point, climate change reduced vegetation growth in the western part of the WQ, where it contributed >60%; in the other areas (ca. 18.3% of the total area) human activity was the primary driver, contributing >60%. In areas where vegetation growth was promoted, human activity exerted a stronger influence than climate change. Human activity contributed >60% in ca. 36.4% of the total area, whereas climate change exerted this effect in ca. 21.8% of the area (Figure 12e,f and Figure S6c,f).

Figure 12.
Spatial patterns in the effects of the drivers on non-growing-season NDVI in the Qinba Mountains from 1982 to 2022. (a,c,e) Contribution of climate change to NDVI for all years, before the mutation point, and after the mutation point, respectively; (b,d,f) Contribution of human activity to NDVI for all years, before the mutation point, and after the mutation point, respectively. ↑, enhanced vegetation growth; ↓, reduced vegetation growth.
4. Discussion
4.1. Mutation-Point Detection
Mutation testing was used to detect mutation points in NDVI in the Qinba Mountains from 1982 to 2022. For the growing season, the three testing methods identified similar mutation-point years; for the non-growing season, they detected the same mutation-point year, 2007 (Figure 4). For growing season, the Pettitt method identified 2004 as the mutation point, while the Mann–Kendall test and MTT identified 2006. This difference may be related to differences in how these tests function [4,43,62]. The Mann–Kendall mutation test detects a mutation point by calculating the cumulative sum of the differences between sequential and non-sequential data, and the variables do not need to follow a normal distribution. The MTT divides the time series into two parts and compares whether the means differ significantly between these parts. The MTT test requires the data to follow a normal distribution. The Pettitt method detects mutation points in a time series by calculating statistics and significance levels; the data do not need to follow a normal distribution [1,62,63]. The Mann–Kendall mutation test and Pettitt method are insensitive to outliers, whereas the MTT is sensitive to outliers.
While we determined the average NDVI for the entire Qinba Mountains, the region has complex terrain, and its NDVI exhibits spatial heterogeneity. Such variability may cause different methods to identify different mutation points. Pixel-scale NDVI mutation-point testing for the Qinba Mountains identified mutation points primarily between 2004 and 2010, with 2006–2008 having the most pixels with mutation points [58].
4.2. Trends in NDVI
Growing-season NDVI exhibited large interannual variation before 2000, whereas it increased at a relatively stable rate from 2000 onward. This may be related to the implementation of the Natural Forest Protection Project and Qinling Ecological Protection Area Project. From 2000, the policy of returning farmland to forest was fully implemented in the Qinba Mountain region [54,58]. For all years, non-growing-season NDVI exhibited substantial variation, potentially owing to climatic factors such as temperature and precipitation. The Qinba Mountains have a unique topography and geographical location. Non-growing-season temperature and precipitation substantially affect vegetation growth, although the effects exhibit hysteresis [56,63]. These factors may result in substantial variation in non-growing-season NDVI.
The spatial patterns in NDVIobs changed at the mutation point. After the mutation point, growing-season NDVIobs increased markedly in WQ, whereas non-growing-season NDVIobs decreased markedly in the western part of WQ, NSQ, and the northeastern part of SSQ, potentially owing to their higher altitudes (Figure 1), more complex climatic environments, and more frequent extreme weather. Evidence indicates that extreme events in the WQ have changed recently, and that they have become less intense in the northeastern Qinba Mountains, while their frequency has increased [64,69]. Simultaneously, owing to the accelerated urbanization in Zhengzhou and Luoyang (in the northeastern part of the Qinba Mountains), a large area of natural land has been converted into construction land, resulting in severe degradation of the vegetation [57,58]. Although the area of urban expansion is limited, urbanization causes worse damage to vegetation than land occupation alone [60]. Our findings partially support this. In the future, the protection of vegetation in high-altitude areas should be strengthened; further, to reduce the degradation of vegetation caused by urban expansion, greater attention should be placed on the planning of urban construction land.
4.3. Drivers of Change in NDVI
The residual analysis revealed spatial patterns, at a pixel scale, in the effects of the drivers on NDVI (Figure 8). The relative contributions of climate change and human activity were revealed (Figure 9 and Figure 10). After the mutation point, the area affected by human activity during the growing season increased, particularly in NSQ, SSQ, SSD, and NSD. In these areas, some regions previously affected by both factors transitioned to being impacted only by human activity, which caused vegetation growth to either increase or decline. Therefore, rational urban planning is required to reduce the damage to vegetation around the city during urban expansion.
Human activity reduced non-growing-season vegetation growth in some areas, both before and after the mutation point; before the mutation point, these areas were primarily located in the WQ. This area has experienced severe degradation of the vegetation owing to overgrazing and tourism-resource development [54]. After the mutation point, human activity switched to promoting vegetation growth in some parts of this area, potentially because of the implementation of ecological-engineering projects. However, in some parts of western WQ, both drivers reduced vegetation growth, owing potentially to an increase in the intensity and frequency of extreme weather events in WQ in recent years [54,61]. Factors such as temperature and precipitation affect the growth and development of vegetation more during the non-growing season than during the growing season [45,47], and extreme weather increases uncertainty in the changes in NDVI. Both before and after the mutation point, human activity reduced vegetation growth in the northeastern parts of the NSQ and SSQ, owing largely to the degradation of vegetation resulting from urbanization.
Before the mutation point, the WQ region was affected primarily by human activity, which contributed >60% to the change in NDVI. In contrast, other areas were primarily affected by climate change, which promoted vegetation growth. However, after the mutation point, the contribution of human activity to the change in NDVI increased, with its contribution exceeding that of climate change. In recent years, the main driver of NDVI changes may have shifted from climate change to human activity [54,58]. During the non-growing season, vegetation growth was more strongly inhibited by human activity than by climate change.
4.4. Research Limitations
This study used a variety of methods to analyze vegetation dynamics in the Qinba Mountains. However, it has certain limitations. First, the NDVI trend was analyzed based on GIMMS NDVI data. Although this dataset provides a long time series, its spatial resolution is low (ca. 8 km). Low spatial resolution may cause the trends in some areas to be over- or underestimated. In future, data with higher spatial resolution will be used to analyze changes in NDVI in this area. Second, when analyzing the impact of climatic factors on changes in NDVI, we used only the two most critical factors, temperature and precipitation. Other climatic factors (solar radiation, wind speed, and relative humidity) should be included in future work. Finally, forest is a complex ecosystem, and only the overall trends in NDVI were analyzed. Changes in NDVI for different vegetation types, and their responses to the drivers, should be examined in future studies. Nonetheless, these findings help to elucidate the trends in NDVI and its drivers.
4.5. Implications for Vegetation Restoration
The Qinba Mountains form a transitional zone between northern and southern China and are a typical ecologically sensitive and fragile area [53]. Monitoring long-term dynamic changes in vegetation and distinguishing the impacts of different drivers on NDVI are of great significance for protecting the ecosystem of the region. While the region has rich tourism resources, excessive and poorly considered development can hamper vegetation growth [57]. Tourism resources should be rationally developed to ensure the protection of the environment, while promoting healthy economic development. Finally, with rapid economic development, urbanization is also accelerating; however, extensive development and poorly planned land use have led to severe degradation of vegetation [23,24,25,26,27,28,57]. In some parts of this region, the vegetation has been affected by urban expansion, especially after the mutation point. Therefore, rational urban planning is required to reduce the impact of urban development on the surrounding vegetation.
5. Conclusions
Using NDVI, temperature, and precipitation data, we conducted slope analysis, hot-spot analysis, mutation point analysis, and residual analysis to examine changes in NDVI in the Qinba Mountains from 1982 to 2022 and identify the main influencing factors. This revealed four key findings.
- (1)
- NDVI increased in the study area over the 41 years. Growing-season NDVI showed significant variation before 2000, whereas non-growing-season NDVI fluctuated throughout the entire study period. Notably, the non-growing-season NDVI exhibited greater variability than the growing-season NDVI. Significant changes occurred in 2006 for the growing season and in 2007 for the non-growing season.
- (2)
- NDVI changes displayed significant spatial heterogeneity. Before the mutation point, the WQ exhibited a slower increase in NDVI. After the mutation point, NDVI growth rates became more uniform across the region. Notably, NDVIha changed faster than NDVIcc, whether increasing or decreasing. Following the mutation point, the distribution of slope(NDVI) hot and cold spots shifted significantly in both position and extent during the growing season, with clear north–south differentiation observed in the non-growing season.
- (3)
- The influence of drivers on NDVI varied spatially before and after the mutation point. During the growing season, both factors promoted NDVI in ca. 81.3% of the area. However, after the mutation point, human activity became the sole driver in specific regions (NSQ, SSQ, NSD, and SSD). In the non-growing season, human activity caused NDVI to decline in ca. 12.5% of the area, primarily in WQ. Postmutation, human activity caused NDVI to decline in the upper parts of NSQ and SSQ. Interestingly, in certain WQ areas, the impact of human activity shifted from reducing to promoting vegetation growth.
- (4)
- Human activity has increasingly become the dominant factor affecting vegetation growth. Before the mutation point, in WQ, vegetation growth was affected more by human activity than by climate change, whereas the opposite pattern was observed in the other regions. After the mutation point, NDVI was affected more by human activity than climate change throughout the study region. Human activity accounted for over 80% of the observed reductions in vegetation growth and contributed more than 60% to the observed increases.
This study clarifies the spatiotemporal patterns of vegetation growth in the study area and identifies the relative impact of different drivers on NDVI. These findings provide critical insights for ecological protection and contribute to the pursuit of sustainable development goals.
Supplementary Materials
The following supporting information can be downloaded at: https://www.mdpi.com/article/10.3390/f15091561/s1, Figure S1: Spatial distribution statistics of the changing trend of NDVI observation values in the growing season and non-growing season in the Qinba Mountains from 1982 to 2022. (a–c) represent the statistical results of the entire time series of the growing season, before and after the mutation, respectively; (d–f) represent the statistical results of the entire time series of the growing season, before and after the mutation, respectively; Figure S2: Spatial distribution statistics of the changing trend of the part of NDVI affected by climate change (NDVIcc) in the growing season and non-growing season in the Qinba Mountains from 1982 to 2022. (a–c) represent the statistical results of the entire time series of the growing season, before and after the mutation, respectively; (d–f) represent the statistical results of the entire time series of the growing season, before and after the mutation, respectively; Figure S3: Spatial distribution statistics of the changing trend of the part of NDVI affected by human activities (NDVIha) in the growing season and non-growing season in the Qinba Mountains from 1982 to 2022. (a–c) represent the statistical results of the entire time series of the growing season, before and after the mutation, respectively; (d–f) represent the statistical results of the entire time series of the growing season, before and after the mutation, respectively; Figure S4: Spatial distribution statistics of factors affecting NDVI changes in the Qinba Mountains from 1982 to 2022. (a–c) represent the statistical results of the entire time series of the growing season, before and after the mutation, respectively; (d–f) represent the statistical results of the entire time series of the non-growing season, before and after the mutation, respectively. CC represents climate change; HA represents human activities; CC&HA represents climate change and human activities. ↑ represents the promotion of vegetation growth; ↓ represents the inhibition of vegetation growth; Figure S5: Spatial distribution statistics of the relative contribution of driving factors to NDVI changes in the growing season of the Qinba Mountains from 1982 to 2022. (a–c) respectively represent the spatial distribution statistics of the contribution of climate change to NDVI changes in the entire time series, before and after the mutation; (d–f) respectively represent the spatial distribution statistics of the contribution of human activities to NDVI changes in the entire time series, before and after the mutation. ↓ indicates inhibition of vegetation growth; ↑ indicates promotion of vegetation growth; Figure S6: Spatial distribution statistics of the relative contribution of the driving factors of NDVI changes in the non-growing season of the Qinba Mountains from 1982 to 2022. (a–c) respectively represent the spatial distribution statistics of the contribution of climate change to NDVI changes in the entire time series, before and after the mutation; (d–f) respectively represent the spatial distribution statistics of the contribution of human activities to NDVI changes in the entire time series, before and after the mutation. ↓ indicates inhibition of vegetation growth; ↑ indicates promotion of vegetation growth.
Author Contributions
Conceptualization, H.L., M.L. and T.L.; Data curation, H.L. and L.W.; Formal analysis, H.L., M.L. and T.L.; Investigation, M.L.; Methodology, H.L. and M.L.; Project administration, T.L.; Resources, T.L.; Software, H.L. and H.Z.; Supervision, T.L.; Validation, M.L. and L.W.; Visualization, H.L. and H.Z.; Writing—original draft, H.L. and M.L.; Writing—review and editing, H.L., L.W. and H.Z. All authors have read and agreed to the published version of the manuscript.
Funding
This research was funded by the Key Scientific Research Project of Higher Education Institutions of Henan Province (grant number 24A170021), the Natural Science Foundation of Henan Province of China (grant numbers 232300420161 and 242300420214), the National Natural Science Foundation of China (grant number 42005031), and the Science and Technology Development Project of Henan Province China (grant number 222102110419).
Data Availability Statement
The datasets generated and/or analyzed during the current study are open access datasets or are available from the corresponding author on reasonable request.
Acknowledgments
We thank the reviewers who provided valuable comments to improve the paper.
Conflicts of Interest
The authors declare no conflicts of interest.
References
- Wang, Y.; Tang, S.; Zheng, Z. Analysis of NDVI and the Impact of Human Activity in China from May to September During 1982 to 2006. J. Geo-Inf. Sci. 2015, 17, 1333–1340. [Google Scholar]
- Jin, K.; Wang, F.; Han, J.; Shi, S.; Ding, W. Contribution of climatic change and human activities to vegetation NDVI change over China during 1982–2015. Acta Geogr. Sin. 2020, 75, 961–974. [Google Scholar] [CrossRef]
- Geng, Q.; Chen, X.; He, X.; Tian, Z. Vegetation dynamics and its response to climate change human activties and based on different vegetation types in China. Acta Ecol. Sin. 2022, 42, 3557–3568. [Google Scholar] [CrossRef]
- Duo, A.; Zhao, W.; Qu, X.; Jing, R.; Xiong, K. Spatio-temporal variation of vegetation coverage and its response to climate change in North China plain in the last 33 years. Int. J. Appl. Earth Obs. Geoinf. 2016, 53, 103–117. [Google Scholar] [CrossRef]
- Gao, W.; Zheng, C.; Liu, X.; Lu, Y.; Chen, Y.; Wei, Y.; Ma, Y. NDVI-Based vegetation dynamics and their responses to climate change and human activities from 1982 to 2020: A case study in the Mu Us Sandy Land, China. Ecol. Indic. 2022, 137, 108745. [Google Scholar] [CrossRef]
- Friedlingstein, P.; O’Sullivan, M.; Jones, M.W.; Andrew, R.M.; Gregor, L. Global Carbon Budget 2022. Earth Syst. Sci. Data 2022, 14, 4811–4900. [Google Scholar] [CrossRef]
- Chen, J.M.; Ju, W.; Ciais, P.; Viovy, N.; Liu, R.; Liu, Y.; Lu, X. Vegetation structural change since 1981 significantly enhanced the terrestrial carbon sink. Nat. Commun. 2019, 10, 4259. [Google Scholar] [CrossRef]
- He, Q.; Yang, Q.; Jiang, S.; Zhan, C. A Comprehensive Analysis of Vegetation Dynamics and Their Response to Climate Change in the Loess Plateau: Insight from Long-Term kernel Normalized Difference Vegetation Index Data. Forests 2024, 15, 471. [Google Scholar] [CrossRef]
- Myers-Smith, I.H.; Kerby, J.T.; Phoenix, G.K.; Bjerke, J.W.; Epstein, H.E.; Assmann, J.J. Complexity revealed in the greening of the Arctic. Nat. Clim. Chang. 2020, 10, 106–117. [Google Scholar] [CrossRef]
- Baumbach, L.; Siegmund, J.F.; Mittermeier, M.; Donner, R.V. Impacts of temperature extremes on European vegetation during the growing season. Biogeosciences 2017, 14, 4891–4903. [Google Scholar] [CrossRef]
- Zhao, J.; Huang, S.; Huang, Q.; Wang, H.; Leng, G.; Fang, W. Time-Lagged response of vegetation dynamics to climatic and teleconnection factors. Catena 2020, 189, 104474. [Google Scholar] [CrossRef]
- Gong, X.; Du, S.; Li, F.; Ding, Y. Study of mesoscale NDVI prediction models in arid and semiarid regions of China under changing environments. Ecol. Indic. 2021, 131, 108198. [Google Scholar] [CrossRef]
- Ma, Y.; Guan, Q.; Sun, Y.; Zhang, J.; Yang, L.; Yang, E.; Li, H.; Du, Q. Three-Dimensional dynamic characteristics of vegetation and its response to climatic factors in the Qilian Mountains. Catena 2022, 208, 105694. [Google Scholar] [CrossRef]
- Shi, S.; Yu, J.; Wang, F.; Wang, P.; Zhang, Y.; Jin, K. Quantitative contributions of climate change and human activities to vegetation changes over multiple time scales on the Loess Plateau. Sci. Total Environ. 2021, 755, 142419. [Google Scholar] [CrossRef]
- Meng, X.; Gao, X.; Li, S.; Lei, J. Spatial and Temporal Characteristics of Vegetation NDVI Changes and the Driving Forces in Mongolia during 1982–2015. Remote Sens. 2020, 12, 603. [Google Scholar] [CrossRef]
- Tuoku, L.; Wu, Z.; Men, B. Impacts of climate factors and human activities on NDVI change in China. Ecol. Inform. 2024, 81, 102555. [Google Scholar] [CrossRef]
- Zhang, K.; Fan, P.; Wang, J.; Ye, H. Study on vegetation changes and climate factors in a karst region of southwest China. Ecol. Environ. Sci. 2019, 28, 1080. [Google Scholar] [CrossRef]
- Prentice, I.; Bondeau, A.; Cramer, W.; Harrison, S.; Hickler, T.; Lucht, W.; Sitch, S.; Smith, B. Dynamic Global Vegetation Modeling: Quantifying Terrestrial Ecosystem Responses to Large-Scale Environmental Change. In Terrestrial Ecosystems in a Changing World; Springer: Berlin/Heidelberg, Germany, 2013. [Google Scholar]
- An, S.; Chen, X.; Li, F.; Wang, X.; Shen, M.; Luo, X.; Ren, S. Long-Term species-level observations indicate the critical role of soil moisture in regulating China’s grassland productivity relative to phenological and climatic factors. Sci. Total Environ. 2024, 929, 172553. [Google Scholar] [CrossRef]
- Mohammad, A.G.; Alseekh, S.H. The effect of Sarcopoterium spinosum on soil and vegetation characteristics. Catena 2013, 100, 10–14. [Google Scholar] [CrossRef]
- Sitch, S.; Smith, B.; Prentice, I.C.; Arneth, A.; Bondeau, A.; Cramer, W.; Kaplan, J.O.; Levis, S.; Lucht, W.; Sykes, M.T.; et al. Evaluation of ecosystem dynamics, plant geography and terrestrial carbon cycling in the LPJ dynamic global vegetation model. Glob. Chang. Biol. 2003, 9, 161–185. [Google Scholar] [CrossRef]
- Geng, S.; Zhou, X.; Zhang, H.; Yang, L.; Sun, Z.; Yan, X.; Liu, M. Climatic and Anthropogenic Contributions to Vegetation Changes in Guangdong Province of South China. Remote Sens. 2023, 15, 5377. [Google Scholar] [CrossRef]
- Zhang, M.; Wu, X. The rebound effects of recent vegetation restoration projects in Mu Us Sandy land of China. Ecol. Indic. 2020, 113, 106228. [Google Scholar] [CrossRef]
- Zhou, Q.; Zhao, X.; Wu, D.; Tang, R.; Du, X.; Wang, H.; Zhao, J.; Xu, P.; Peng, Y. Impact of Urbanization and Climate on Vegetation Coverage in the Beijing–Tianjin–Hebei Region of China. Remote Sens. 2019, 11, 2452. [Google Scholar] [CrossRef]
- Liu, H.; Zheng, H.; Wu, L.; Deng, Y.; Chen, J.; Zhang, J. Spatiotemporal Evolution in the Thermal Environment and Impact Analysis of Drivers in the Beijing–Tianjin–Hebei Urban Agglomeration of China from 2000 to 2020. Remote Sens. 2024, 16, 2601. [Google Scholar] [CrossRef]
- Wu, S.; Zhou, S.; Chen, D.; Wei, Z.; Dai, L.; Li, X. Determining the contributions of urbanisation and climate change to NPP variations over the last decade in the Yangtze River Delta, China. Sci. Total Environ. 2014, 472, 397–406. [Google Scholar] [CrossRef] [PubMed]
- Wu, Y.; Tang, G.; Gu, H.; Liu, Y.; Yang, M.; Sun, L. The variation of vegetation greenness and underlying mechanisms in Guangdong province of China during 2001–2013 based on MODIS data. Sci. Total Environ. 2019, 653, 536–546. [Google Scholar] [CrossRef] [PubMed]
- Lee, H.; Lim, B.S.; Kim, D.U.; Kim, A.R.; Seol, J.W.; Lim, C.H.; Kil, J.H.; Moon, J.S.; Lee, C.S. Decline and Passive Restoration of Forest Vegetation Around the Yeocheon Industrial Complex of Southern Korea. Forests 2020, 11, 674. [Google Scholar] [CrossRef]
- Liu, D.; Chen, J.; Ouyang, Z. Responses of landscape structure to the ecological restoration programs in the farming-pastoral ecotone of Northern China. Sci. Total Environ. 2020, 710, 136311. [Google Scholar] [CrossRef]
- Chen, C.; Park, T.; Wang, X.; Piao, S.; Xu, B.; Chaturvedi, R.K.; Fuchs, R.; Brovkin, V.; Ciais, P.; Fensholt, R.; et al. China and India lead in greening of the world through land-use management. Nat. Sustain. 2019, 2, 122–129. [Google Scholar] [CrossRef]
- Piedallu, C.; Cheret, V.; Denux, J.P.; Perez, V.; Azcona, J.S.; Seynave, I.; Gegout, J.C. Soil and climate differently impact NDVI patterns according to the season and the stand type. Sci. Total Environ. 2019, 651, 2874–2885. [Google Scholar] [CrossRef]
- Wang, Z.; Lyu, L.; Liu, W.; Liang, H.; Huang, J.; Zhang, Q.-B. Topographic patterns of forest decline as detected from tree rings and NDVI. Catena 2021, 198, 105011. [Google Scholar] [CrossRef]
- Wu, X.; Wang, S.; Fu, B.; Feng, X.; Chen, Y. Socio-Ecological changes on the Loess Plateau of China after Grain to Green Program. Sci. Total Environ. 2019, 678, 565–573. [Google Scholar] [CrossRef]
- Gao, J.; Jiao, K.; Wu, S. Investigating the spatially heterogeneous relationships between climate factors and NDVI in China during 1982 to 2013. J. Geogr. Sci. 2019, 29, 1597–1609. [Google Scholar] [CrossRef]
- Lamchin, M.; Lee, W.K.; Jeon, S.W.; Wang, S.W.; Lim, C.H.; Song, C.; Sung, M. Long-Term trend and correlation between vegetation greenness and climate variables in Asia based on satellite data. Sci. Total Environ. 2018, 618, 1089–1095. [Google Scholar] [CrossRef]
- Babüroğlu, E.S.; Durmuşoğlu, A.; Dereli, T. Novel hybrid pair recommendations based on a large-scale comparative study of concept drift detection. Expert Syst. Appl. 2021, 163, 113786. [Google Scholar] [CrossRef]
- Cai, Q.; Liu, Y.; Zhang, H.; Song, H.; Li, Q.; Sun, C.; Wang, L.; Fang, C.; Liu, R. Evolution of the dry-wet variations since 1834 CE in the Lüliang Mountains, north China and its relationship with the Asian summer monsoon. Ecol. Indic. 2021, 121, 107089. [Google Scholar] [CrossRef]
- Spadoni, G.L.; Cavalli, A.; Congedo, L.; Munafò, M. Analysis of Normalized Difference Vegetation Index (NDVI) multi-temporal series for the production of forest cartography. Remote Sens. Appl. Soc. Environ. 2020, 20, 100419. [Google Scholar] [CrossRef]
- Zhu, X.; Xiao, G.; Zhang, D.; Guo, L. Mapping abandoned farmland in China using time series MODIS NDVI. Sci. Total Environ. 2021, 755, 142651. [Google Scholar] [CrossRef]
- Tucker, C.J.; Pinzon, J.E.; Brown, M.E.; Slayback, D.A.; Pak, E.W.; Mahoney, R.; Vermote, E.F.; El Saleous, N. An extended AVHRR 8-km NDVI dataset compatible with MODIS and SPOT vegetation NDVI data. Int. J. Remote Sens. 2010, 26, 4485–4498. [Google Scholar] [CrossRef]
- Fensholt, R.; Proud, S.R. Evaluation of Earth Observation based global long term vegetation trends—Comparing GIMMS and MODIS global NDVI time series. Remote Sens. Environ. 2012, 119, 131–147. [Google Scholar] [CrossRef]
- Pinzon, J.E.; Pak, E.W.; Tucker, C.J.; Bhatt, U.S.; Frost, G.V.; Macander, M.J. Global Vegetation Greenness (NDVI) from AVHRR GIMMS-3G+, 1981–2022; ORNL DAAC: Oak Ridge, TN, USA, 2023. [Google Scholar] [CrossRef]
- Li, J.; Wang, J.; Zhang, J.; Zhang, J.; Kong, H. Dynamic changes of vegetation coverage in China-Myanmar economic corridor over the past 20 years. Int. J. Appl. Earth Obs. Geoinf. 2021, 102, 102378. [Google Scholar] [CrossRef]
- Feng, D.; Bao, W.; Yang, Y.; Fu, M. How do government policies promote greening? Evidence from China. Land Use Policy 2021, 104, 105389. [Google Scholar] [CrossRef]
- Yang, L.; Feng, Q.; Adamowski, J.F.; Alizadeh, M.R.; Yin, Z.; Wen, X.; Zhu, M. The role of climate change and vegetation greening on the variation of terrestrial evapotranspiration in northwest China’s Qilian Mountains. Sci. Total Environ. 2021, 759, 143532. [Google Scholar] [CrossRef] [PubMed]
- Yang, L.; Shen, F.; Zhang, L.; Cai, Y.; Yi, F.; Zhou, C. Quantifying influences of natural and anthropogenic factors on vegetation changes using structural equation modeling: A case study in Jiangsu Province, China. J. Clean. Prod. 2021, 280, 124330. [Google Scholar] [CrossRef]
- Zhang, Y.; Zhang, L.; Wang, J.; Dong, G.; Wei, Y. Quantitative analysis of NDVI driving factors based on the geographical detector model in the Chengdu-Chongqing region, China. Ecol. Indic. 2023, 155, 110978. [Google Scholar] [CrossRef]
- Song, W.; Feng, Y.; Wang, Z. Ecological restoration programs dominate vegetation greening in China. Sci. Total Environ. 2022, 848, 157729. [Google Scholar] [CrossRef]
- Xiong, Q.; Xiao, Y.; Liang, P.; Li, L.; Zhang, L.; Li, T.; Pan, K.; Liu, C. Trends in climate change and human interventions indicate grassland productivity on the Qinghai–Tibetan Plateau from 1980 to 2015. Ecol. Indic. 2021, 129, 108010. [Google Scholar] [CrossRef]
- Xie, S.; Mo, X.; Hu, S.; Liu, S. Contributions of climate change, elevated atmospheric CO2 and human activities to ET and GPP trends in the Three-North Region of China. Agric. For. Meteorol. 2020, 295, 108183. [Google Scholar] [CrossRef]
- Zhao, Y.; Sun, R.; Ni, Z. Identification of Natural and Anthropogenic Drivers of Vegetation Change in the Beijing-Tianjin-Hebei Megacity Region. Remote Sens. 2019, 11, 1224. [Google Scholar] [CrossRef]
- Li, H.; Li, K.; Zhao, X.; Zhao, J. Changes in Vegetation Greenness and Their Influencing Factors in Southern China. Remote Sens. 2022, 14, 3291. [Google Scholar] [CrossRef]
- Xi, M.; Zhang, W.; Li, W.; Liu, H.; Zheng, H. Distinguishing Dominant Drivers on LST Dynamics in the Qinling-Daba Mountains in Central China from 2000 to 2020. Remote Sens. 2023, 15, 878. [Google Scholar] [CrossRef]
- Bai, Y. Analysis of vegetation dynamics in the Qinling-Daba Mountains region from MODIS time series data. Ecol. Indic. 2021, 129, 108029. [Google Scholar] [CrossRef]
- Fu, B. The integrated studies of geography: Coupling of patterns and processes. Acta Geogr. Sin. 2014, 69, 1052. [Google Scholar] [CrossRef]
- Chen, C.; Zhu, L.; Tian, L.; Li, X. Spatial-Temporal changes in vegetation characteristics and climate in the Qinling-Daba Mountains. Acta Ecol. Sin. 2019, 39, 3257–3266. [Google Scholar] [CrossRef]
- Chen, C.; Wang, L.; Zhu, W.; Zhu, L.; Dong, Q.; Li, Y.; Ren, H. Characteristics of Extreme Climate Change in the Qinling-Daba Mountainsandits Impacton Vegetation Dynamics. J. Soil Water Conserv. 2024, 38, 276–287. [Google Scholar] [CrossRef]
- Wang, B.; Xu, G.; Li, P.; Li, Z.; Zhang, Y.; Cheng, Y.; Jia, L.; Zhang, J. Vegetation dynamics and their relationships with climatic factors in the Qinling Mountains of China. Ecol. Indic. 2020, 108, 105719. [Google Scholar] [CrossRef]
- Qian, C.; Shao, L.; Hou, X.; Zhang, B.; Chen, W.; Xia, X. Detection and attribution of vegetation greening trend across distinct local landscapes under China’s Grain to Green Program: A case study in Shaanxi Province. Catena 2019, 183, 104182. [Google Scholar] [CrossRef]
- Liu, X.; Zhu, X.; Pan, Y.; Li, S.; Ma, Y.; Nie, J. Vegetation dynamics in Qinling-Daba Mountains in relation to climate factors between 2000 and 2014. J. Geogr. Sci. 2016, 26, 45–58. [Google Scholar] [CrossRef]
- Peng, S.; Ding, Y.; Liu, W.; Li, Z. 1 km monthly temperature and precipitation dataset for China from 1901 to 2017. Earth Syst. Sci. Data 2019, 11, 1931–1946. [Google Scholar] [CrossRef]
- Wei, F. The Current Statistical Climatic Diagnosis and Forecasting Technology; Beijing Meteorological Press: Beijing, China, 2007. [Google Scholar]
- Zhang, W.; Xi, M.; Liu, H.; Zheng, H. Low sensitivity of net primary productivity to climatic factors in three karst provinces in southwest China from 1981 to 2019. Ecol. Indic. 2023, 153, 110465. [Google Scholar] [CrossRef]
- Qu, B.; Zhu, W.; Jia, S.; Lv, A. Spatio-Temporal Changes in Vegetation Activity and Its Driving Factors during the Growing Season in China from 1982 to 2011. Remote Sens. 2015, 7, 13729–13752. [Google Scholar] [CrossRef]
- Sur, K.; Verma, V.K.; Panwar, P.; Shukla, G.; Chakravarty, S.; Nath, A.J. Monitoring vegetation degradation using remote sensing and machine learning over India—A multi-sensor, multi-temporal and multi-scale approach. Front. For. Glob. Chang. 2024, 7, 1382557. [Google Scholar] [CrossRef]
- Yu, Q.; Lu, H.; Yao, T.; Xue, Y.; Feng, W. Enhancing sustainability of vegetation ecosystems through ecological engineering: A case study in the Qinghai-Tibet Plateau. J. Environ. Manag. 2023, 325, 116576. [Google Scholar] [CrossRef] [PubMed]
- Zhang, D.; Ge, W.; Zhang, Y. Evaluating the vegetation restoration sustainability of ecological projects: A case study of Wuqi County in China. J. Clean. Prod. 2020, 264, 121751. [Google Scholar] [CrossRef]
- Geerken, R.; Ilaiwi, M. Assessment of rangeland degradation and development of a strategy for rehabilitation. Remote Sens. Environ. 2004, 90, 490–504. [Google Scholar] [CrossRef]
- Shao, Y.; Mu, X.; He, Y.; Sun, W.; Zhao, G.; Gao, P. Spatiotemporal variations of extreme precipitation events at multi-time scales in the Qinling-Daba mountains region, China. Quat. Int. 2019, 525, 89–102. [Google Scholar] [CrossRef]


Disclaimer/Publisher’s Note: The statements, opinions and data contained in all publications are solely those of the individual author(s) and contributor(s) and not of MDPI and/or the editor(s). MDPI and/or the editor(s) disclaim responsibility for any injury to people or property resulting from any ideas, methods, instructions or products referred to in the content. |
© 2024 by the authors. Licensee MDPI, Basel, Switzerland. This article is an open access article distributed under the terms and conditions of the Creative Commons Attribution (CC BY) license (https://creativecommons.org/licenses/by/4.0/).