Article

Comparison of Three Indoor Viewing Models and On-Site Experiences to Assess Visual Landscape Perception in Urban Forests

College of Landscape Architecture and Horticulture, Southwest Forestry University, Kunming 650224, China
*
Author to whom correspondence should be addressed.
These authors contributed equally to this work.
Forests 2024, 15(9), 1566; https://doi.org/10.3390/f15091566
Submission received: 18 August 2024 / Revised: 28 August 2024 / Accepted: 4 September 2024 / Published: 6 September 2024

Abstract

:
Contacting forests in different ways and conducting public perception evaluations of forests are important ways to evaluate forest construction. In order to explore the differences between on-site and manual post-collection indoor evaluations in forest landscape surveys, we combined subjective evaluation and objective indicator monitoring (eye movement characteristics, physiological indicators) based on different forest observation scales. We compared and analyzed the suitability of the following four visual approaches: on-site observation, manual collection, followed by indoor viewing normal photos (NP), videos (VD), and virtual reality panoramas (VR), in terms of public preference, perception, and psychological emotion. The results showed the following: (1) Compared with the on-site evaluation, the three indoor visual approaches (NP, VD, and VR) showed no significant difference in “landscape beauty” and “spatial perception”. VD also showed no significant difference in “landscape perception”, “seeing”, and “plant color preference” and had the strongest substitution for site evaluation. (2) With the exception of small-scale landscapes, in which on-site evaluation showed no substitutability, for the rest of the landscape scales, each of the three indoor visual approaches showed substitutability for on-site evaluation to varying degrees. (3) When conducting physiological and psychological surveys, watching videos and VR are more ideal. In terms of eye tracking, VR is closest to on-site observation. Practice shows that video was closer to on-site observation in most landscape preferences and perceptions. VR was suitable for presenting public visual behavioral characteristics, and NP showed some advantages in landscape beauty and spatial perceptions. The findings of the study can provide a scientific basis for the selection of visual approaches in future landscape evaluation.

1. Introduction

As an important part of urban ecosystems, urban forests have a wide range of environmental, social, and economic benefits, which are the ecological substrate for improving human well-being and sustainable development of green cities [1]. Constructing healthy and resilient urban forests with multiple types and benefits can help optimize the urban forest system, enhance the responsiveness to urban territorial risks, and promote positive interactions between citizens and urban forests [2]. Landscape evaluation integrates the subjective evaluation and objective physiological experience when people come into contact with forest landscapes from a comprehensive perspective [3]. It deeply explores people’s perception and evaluation of the quality of forest landscapes, which can promote the development and management of urban forests to be more in line with public needs [4] and better improve forest and service quality. Therefore, most of the existing studies have been conducted from a public perception perspective, such as the optimization of forest landscape patterns based on public preferences and perceptions [5], exploration of the development model of forest recreation bases, and the influence of forest structural attributes on public preference [6]. In addition, the benefits of natural spaces for the health and well-being of human beings have been widely demonstrated. Urban forests have very rich and valuable natural resources, and the space formed by vegetation enclosures or the natural scenery with broad views brings significant restorative capacity in many aspects of people’s physiological health, psychological stress level, and attention recovery [7]. For example, Liu, based on the physiological and psychological responses of the public, assessed the influence of the environmental characteristics of urban green space [8], and Song explored the potential of natural environments to restore the psychophysiological health of cancer patients [9]. In general, conducting such research is closely related to the form of acquisition and presentation of forest landscape materials, and there are two main evaluation methods in existing studies, one for on-site evaluation and one for manual post-collection indoor evaluation. On-site evaluation is to evoke a “sense of landscape” in participants by viewing and experiencing real scenes, while indoor evaluation involves the visualization of the landscape through the viewing of manually collected stimulus materials, such as photographs, videos, virtual reality, etc., to evoke a “sense of landscape” in participants [10].
Both methods are based on vision, which is the easiest to perceive [11], revealing the intrinsic law of human perceptual response and analyzing in depth the cognitive and emotional changes of the public when viewing urban forest landscapes. Although these methods have been widely used in various fields, each still has its own advantages and disadvantages if used individually. On-site evaluation has the advantages of interactivity and multi-sensory experience, combining questionnaires, interviews, scale measurements, physiological indicator monitoring, and other forms to truly and comprehensively reflect the participants’ on-site feelings [12,13]. Wang compared and analyzed the aesthetic differences between the public perception perspective and the expert model of landscapes through on-site scoring evaluations [14]. Sevenant added physiological health monitoring to the on-site evaluations to explore the restoration potential of natural environments for public perception [15]. However, in the on-site evaluation, the number of samples is interfered with by cost, uncontrollable environmental factors, and human factors, and the feedback information obtained has less validity and affects the experimental support. Thus, the manual post-collection indoor evaluation is widely used due to the convenience of obtaining landscape information and the authenticity of simulated environments, and the method can be better controlled by human intervention in all kinds of environmental impact factors. The experimental environment is more quiet and comfortable, making it easier to obtain a large number of sample data [16]. Existing landscape evaluation fields have carried out indoor evaluation from different perspectives to obtain public perceptions and preferences and then transform and improve the human environment. For example, the effects of different types of forest landscapes on public visual behavioral characteristics and perceptions [17], and the effects of landscape elements [18], color characteristics [19], and spatial complexity [20] on public preferences [21]. Although both approaches have their own characteristics, many known and unknown factors, such as site characteristics, seasonal changes, experimental methods, crowd characteristics, etc., will have an impact on the accuracy of the evaluation. Hetherington has shown that the closer the simulation experiment is to the “real scene”, the more accurately the experimental results reflect the “real scene” [22].
As technology continues to advance, the method of manually collecting landscapes has expanded from normal photos to videos and virtual reality panoramas. Normal photos are widely used because of their simplicity, low cost, and ease of controlling variables [23,24,25], and the scale and shooting angle of landscape photographs vary according to different research objectives. For example, Tang used remote sensing images and aerial views to explore the aesthetic preferences of different groups of people for landscape configuration and function [26], Tao selected landscape images with urban-scale features to explore the effects of different scales on public preferences [27], X Junge explored the extent to which seasonal variation in agricultural areas affects public preferences by presenting small-scale photographs of plant landscapes [28], and Marcin Furtak used photographs to compare the effects of individual plant elements and the overall landscape scale on attention in a forest [29]. Video technology is also updating and iterating, and the existing forms of presentation mainly include image processing, 3D modeling, landscape animation, etc. Chen explored user preferences for rural landscapes through TikTok short videos [30], Saun used video capture technology to assess user experience and then perform video quality enhancement [31], and Gong investigated the substitution of animation media in the assessment of plants’ visual landscape effect [32]. Mostajeran used virtual reality panoramas and video playback of natural landscapes to explore the differences in public physiological arousal between the two approaches [33]. The video presents real outdoor scenes in the form of a combination of dynamic live images and audio, which demonstrates a powerful functional effect in terms of scenic richness and human senses. Virtual reality, as an emerging use of technology, is presented or computer-generated three-dimensional realistic scenes that are manually collected and processed, realizing the multifaceted fusion of natural and virtual environments, so that the evaluator obtains a more realistic and interactive three-dimensional experience in the process of environmental perception. The manual collection method mainly uses a wide-angle camera and 360° panoramic camera to capture the scene image or 360° video, and the experimenter needs to use the head-mounted display to obtain the landscape information by rotating their head. According to the different shooting angles and observation needs, panoramas are categorized into 180° and 360° scenes, and the former is easier for the human eye to track, which is also one of the methods used in this paper [34]. Yu investigated the application of panoramic techniques in different forested landscapes and field-of-view landscapes [35], Anthes explored the effectiveness of panoramas in characterizing landscape integrity [36], and Li analyzed the differences in public visual perception under the interaction of different stand attributes in virtual reality panoramas [37]. As far as the results are concerned, VR, with its high degree of controllability and repeatability, provides a much deeper and more immersive experience than on-site observation. Among the above methods of manually collecting landscapes, normal photos are most widely used in different research areas such as visual assessment, preference surveys, affective assessment, and simulated experiences [38,39,40], but they also reflect inherent limitations to a certain extent, such as lack of perspective bias and subjective selectivity [41], etc. Some studies have verified the effectiveness of photos and the substitutability of on-site evaluation after comparing the public perception difference between photos and real scenes [42]. However, there are also studies that contradict this view. Akl found that in spiritual places of special significance, compared with viewing photographs, people’s attention in the same story scene was biased towards the more culturally spiritual one [43]. Video animation and virtual reality panoramas, as a synthesis of modern technology, have been emphasized by a large number of studies that highlight the clear advantages of both in landscape assessment, which are more likely to stimulate the attention of observers and arouse more positive emotions, and the evaluation results are more reliable [44]. In addition, video animations provide sensory information such as hearing, while panoramas provide more detailed and comprehensive visual information. Existing indoor evaluation methods after manual collection are largely based on the public’s visual attention and aesthetic preferences, and the research on forest landscape characteristics [45], aesthetic quality [46], forest stand structure [47], etc. However, there is a lack of scientific and systematic comparison among landscape presentation methods, which leads to the mixing of methods among different scholars when evaluating the same or different landscapes, and different choices of visualization approaches; the results produced will also have differences, affecting the comparative analysis of similar articles.
Visual scale is recognized as a strong driver of landscape preference and perception [48,49,50]. Researchers mainly focus on the public aesthetic differences in individual forests, stand landscapes, view landscapes, etc., but there is still a lack of systematic comparative analysis on which scale landscape evaluation methods are suitable for manual post-collection indoor evaluation. For example, “Are there differences among the methods in forest landscapes at different scales?” and “Under what circumstances can manual post-collection indoor evaluation be a more scientific and intuitive alternative to on-site evaluation? And under what circumstances is field evaluation irreplaceable?” By solving these questions, we can better understand the scope of application of each approach and select visual approaches in a more systematic and scientific way.
Therefore, the main objective of this study is to establish a comprehensive visual presentation system [51] in the evaluation of urban forest landscapes and to find the best alternative to on-site evaluations, comprehensively considering aspects such as public preferences, perception, eye movement characteristics, and physiological and psychological feedback, combined with four common observation scales in forest view landscape (mega-, large-, mid- and small-scale). Comparing the public’s preferences and perceptions of urban forest landscapes under different visual approaches to find the most accurate and convenient visual evaluation approach not only provides strong and reliable data support for urban forest construction, management, and other related research fields but also provides important practical guidance for the development of the future visual evaluation models. The research questions are as follows:
(1)
What are the differences in public preferences and perceptions between different visual presentations (viewing live scenes, photos, videos, virtual reality panoramas)?
(2)
What are the differences among on-site viewing, manual collection followed by indoor viewing normal photos, videos, and virtual reality panoramas at different forest observation scales?
(3)
What are the characteristics of different visual presentations and observation scales in public eye movements and psychophysiological perceptions?

2. Materials and Methods

2.1. Subsection

The study site is located in Junzi Mountain, Shizong County, Qujing City, Yunnan Province, Southwest China (104°16′ N, 24°63′ E) (Figure 1), and it has a northern subtropical climate. Occupying about 12 km2, the scenic area’s highest elevation is 2409.7 m and forest cover is about 68.8%.
After considering the basic conditions of this study site, such as landscape beauty, forest stand status, species diversity, and 180° panoramic view conditions, the spring landscape with better landscape and high universality was selected as the study sample site. Then, it was divided into four different landscape scales, according to the distance between the shooting site and the main landscape (mega-scale, ≥200 m; large-scale, 200–100 m; mid-scale, 100–50 m; and small-scale, ≤50 m). Along the main viewing route of Junzi Mountain, 28 initial sampling points were selected. Considering the 180° panoramic view, each sampling point was rotated in a non-overlapping manner to capture one view each of the inside or outside of the forest, which was presented in the form of a video or photograph (56 in total) and used expert evaluation. According to the difference of 4 landscape scales, 8 final sampling points were selected as experimental samples (Figure 2).

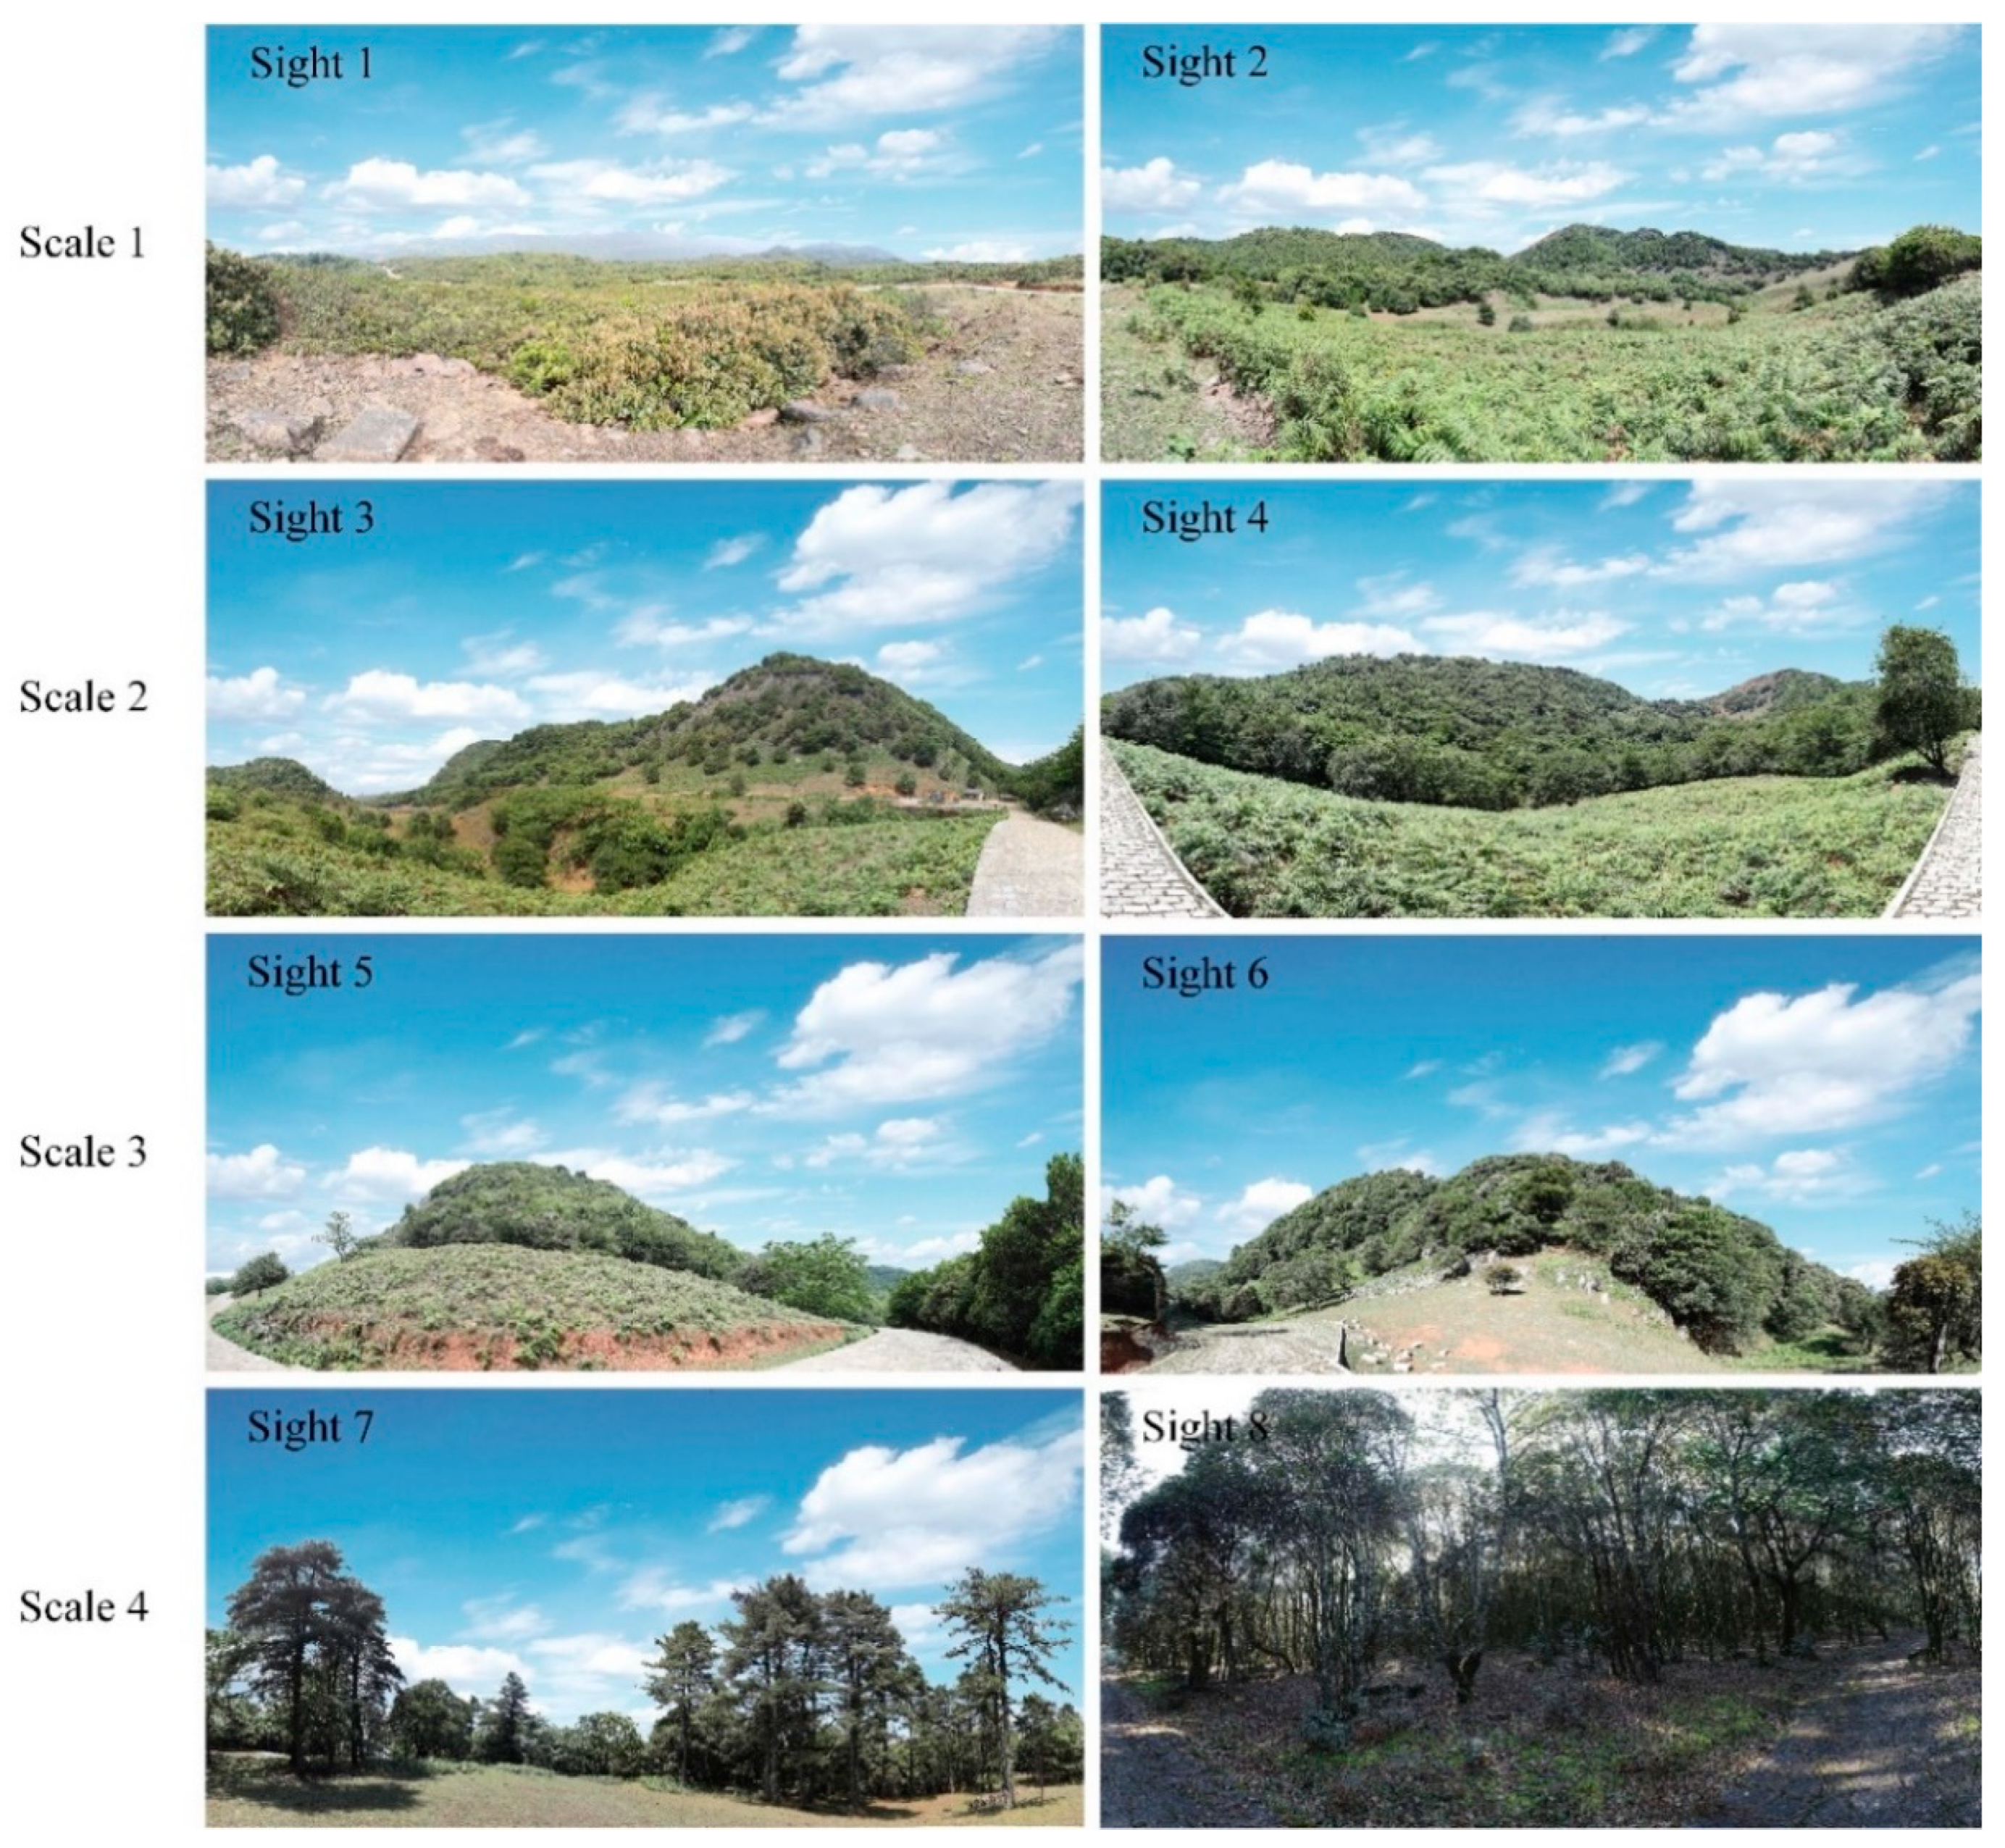
2.2. Material Acquisition and Processing

After investigating and collecting images of the sample points, we believe that the spring and summer landscapes are mainly green, with a high green coverage of trees, not many fallen leaves or unopened leaves, and the forest colors are more harmonious, so we chose this season for collection. In order to reduce the number of representative landscapes, a total of 8 were determined, and 180° virtual reality panoramas, ordinary photos, and 15-s videos with a 180° viewing angle were taken at the same height (160 cm). The panoramic images were captured horizontally using a 35 mm focal length lens (EOS 5D Mark 4, Canon, Beijing, China), with one image taken every 15°. The pan-tilt was rotated up and down 45° to take 3–5 sets of 48–60 images. At the same time, the overlap rate between adjacent images was ensured to be 20–50%, and the PTGUI Pro 12 software (New House, Internet Services BV, Rotterdam, The Netherlands) was used for image stitching. The video was shot manually at a uniform speed of 180° (Fuji XS10, Fujifilm, Beijing, China), and the editing time was 15 s using Premiere Pro CS6 software (Adobe, San Jose, CA, USA).

2.3. Experimental Design

Relevant studies generally agree that it is more feasible and representative to select college students for questionnaire surveys, visual behavior, and physiological and psychological change monitoring [52,53]. Therefore, this experiment recruited a total of 115 college students, graduate students, and teachers from different majors of Southwest Forestry University, with a male-to-female ratio close to 1:1. They were randomly divided into four groups: 30 in the virtual reality panorama group (VR), 30 in the video group (VD), 30 in the normal photo group (NP), and 25 in the on-site group (OS). One warm-up experiment was set up for all four groups, and the purpose, process, and questionnaire content were explained before the start of the experiments. Before the formal start of the experiment, subjects were asked to sit quietly with their eyes closed to measure the baseline values of heart rate (HR) and electrodermal activity (EDA). In the virtual reality panorama experiment, subjects were required to wear a VR headset to watch the 180° panoramic image for 15 s by themselves. The video group required subjects to wear headphones and watch a video with natural sounds on a monitor with a 180° view for 15 s; the normal photo playback time was also 15 s. All three manual post-collection indoor experiments required simultaneous measurement of subjects’ eye movement data and physiological data. The subjective questionnaire would play the same images and videos again, and the subject would dictate the questions and record the responses. To eliminate the order effect, different subjects would watch the video or images randomly on the device.
The on-site evaluation selected the same range of landscapes as those for the indoor evaluation after manual collection. In the same season, the subjects completed the same questionnaire after viewing the real scene. Due to poor controllability, there is no suitable eye movement observation equipment for the on-site evaluation experiment. Therefore, the subjects were required to outline the areas with longer fixation time and more attention in the printed photos of the same scene as an alternative to the eye movement heat map. At the same time, considering that the factors affecting physiological indicators in on-site and indoor evaluations are quite different, the on-site evaluation did not carry out the monitoring of physiological indicators.

2.4. Questionnaire and Experimental Equipment

All four experimental groups were required to carry out questionnaires, which were set according to the characteristics of landscape elements, spatial characteristics, and research needs of the study site. The first part was the collection of basic information about the subjects, which included name, age, professional background, and real-time mental state survey (YS-90 Mood States). The second part was a preference survey [54,55,56], which included landscape preference (landscape beauty, plant color preference) and activity preference [57] (traveling, seeing, walking, and taking photos). The third part was a perception survey [58], which included landscape perception (landscape element richness, plant color richness) and spatial perception (attention, landscape scale, and landscape openness). The fourth part was a public psychological emotion survey (Positive and Negative Affect Schedule, PANAS [59]), which included positive emotions (relaxed, excited) and negative emotions (irritating, depressive). And the survey questions were all scored by a five-point Likert scale [55] (Figure 3).
The virtual reality panorama group used the Tobii Pro VR virtual reality eye-tracking device (Tobii Pro, Stockholm, Sweden) with a binocular sampling rate of 120 Hz. The video group and normal photo group used a Tobii Pro Fusion telemetric eye-tracking device (Tobii Pro, Stockholm, Sweden) with a binocular sampling rate of 250 Hz, mounted below a 24-inch monitor with a resolution of 1920 × 1080 pixels. Physiological indexes were measured using an ErgoLAB smart wearable human factors physiological recorder (KINGFAR, Beijing, China), which collected skin conductivity and heart rate. All test sessions were equipped with monitors for real-time observation of experimental data. The experimental process and data processing were controlled by the ErgoLAB V3.0 human-computer environment synchronization platform (KINGFAR, Beijing, China).

2.5. Data Analysis

Based on the reliability analysis and normality test, Kruskal-Wallis ANOVA was used to compare the questionnaire data, physiological data, and visual behavior data of the four experiments. In addition, we standardized the “Landscape beauty” scores of all subjects. All data were statistically analyzed by SPSS26.0 software (IBM, Armonk, NY, USA).
In order to verify the differences in fixation heat maps for different visual behavior styles, we compared four sets of eye-movement heat maps. Among them, the picture presented by the video was dynamic and difficult to visualize, but its landscape scope was almost the same as that of the panorama. Therefore, in this study, the fixation heat maps of the video were manually added to the panorama by the mapping method on a frame-by-frame basis. The on-site eye-tracking heat maps were also manually added to the panorama according to the content outlined by the on-site subjects.

3. Results

3.1. Comparison of Public Preferences and Perceptions under Four Visual Approaches

The on-site evaluation scores were compared pairwise with three groups of manual post-collection indoor evaluation, respectively, to analyze the differences in public landscape preference and perception. The experimental data did not conform to a normal distribution; therefore, a nonparametric Kruskal–Wallis ANOVA method was used for analysis (Figure 4).
In the public preference, there was no significant difference among the four visual methods of “Landscape beauty”. In the indicator of “Plant color preference”, there was no significant difference between the on-site group and the video group (p > 0.05), while the remaining two indoor groups were both highly significantly different from the on-site group (p = 0.000), with the on-site group having a higher mean value. Among the activity preferences, only the video group was not significantly different from the on-site group in “Seeing” (p > 0.05), while the remaining two indoor groups were both significantly different from the on-site group (p = 0.000). In terms of the mean value, the on-site group had the highest value in all activity preference indicators, while the video group’s value was closer to it.
In the public’s landscape perception, compared with the on-site group, there was no significant difference between the video group and the normal photo group (p > 0.05), and the mean values were as follows: on-site group > video group > normal photo group, in descending order. As for spatial perception, there was no significant difference among the three manual post-collection indoor groups and the on-site group, and in “Attention”, the mean values of the photo group and virtual reality panorama group were higher than those of the on-site group.

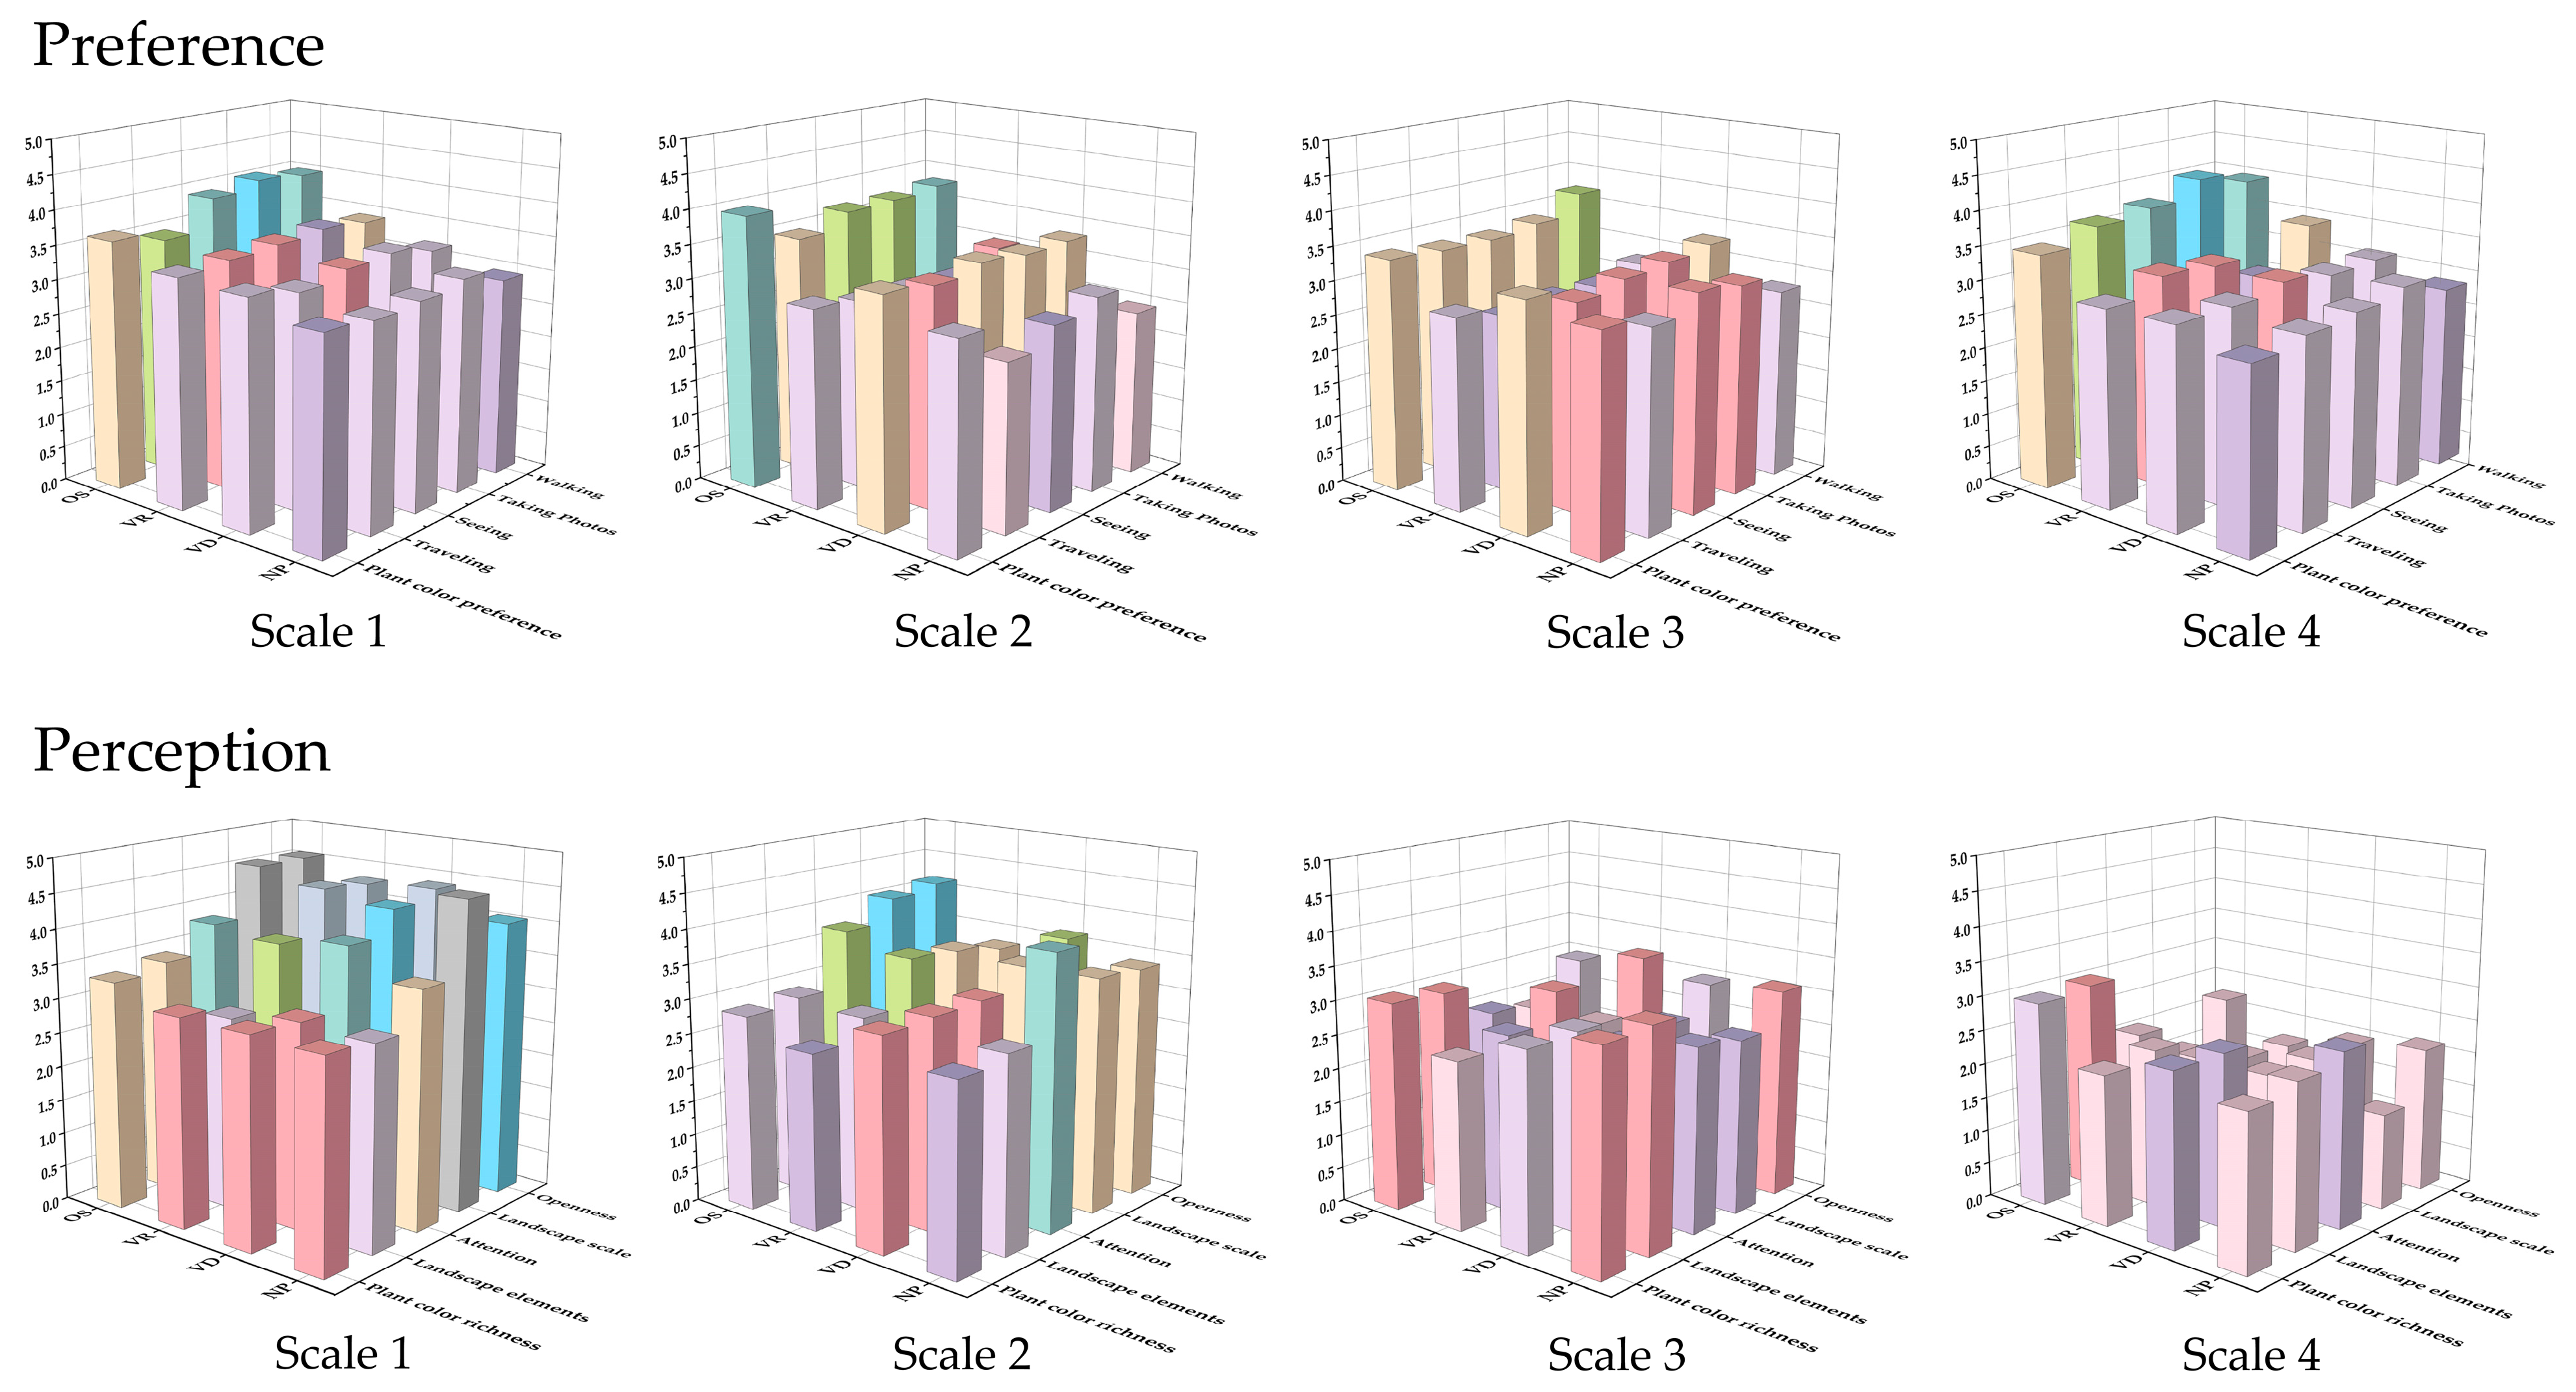
3.2. Differential Analysis of Four Visual Approaches Based on Different Scales of Forest Observation

In this part, based on four different forest observation scales, we analyzed the differences in landscape preference and perception among the three sets of manual post-collection indoor evaluation and on-site evaluation (Figure 5, Table 1).
When using a virtual reality panorama to view mega-scale landscapes, the results are closest to the on-site evaluation, with only the perception of “Landscape elements” significantly different, and the rest of the indicators are not significantly different. In the other three landscape scales, there was no difference between the virtual reality panorama group and the on-site evaluation in terms of “Landscape beauty”, “Attention”, and “Landscape perception”. It was worth noting that some of the activity preferences (“Traveling”, “Seeing”) were not significantly different from the on-site evaluation when using a virtual reality panorama to view mid- and small-scale landscapes.
The video group was not significantly different from the on-site group for all indicators in the mid-scale landscape and was nearly identical to the on-site evaluation results. In large-scale landscapes, except for the difference in the perception of the “Landscape scale”, the other indicators were not significantly different from the on-site evaluation. The perception of activity preference and landscape richness was weaker when using video to view the mega- and small-scale landscapes.
When viewing the four landscape scales through the normal photos, it was found that in the mid-scale landscape, only “Walking” had a significant difference, the rest of the indicators did not have any significant difference, and the visual mode of the normal photos in this scale was closer to the on-site. There were no significant differences in the indicators related to landscape perception, spatial perception, and the degree of beauty, while the indicators related to activity preference were all different from those of the site (p < 0.05).

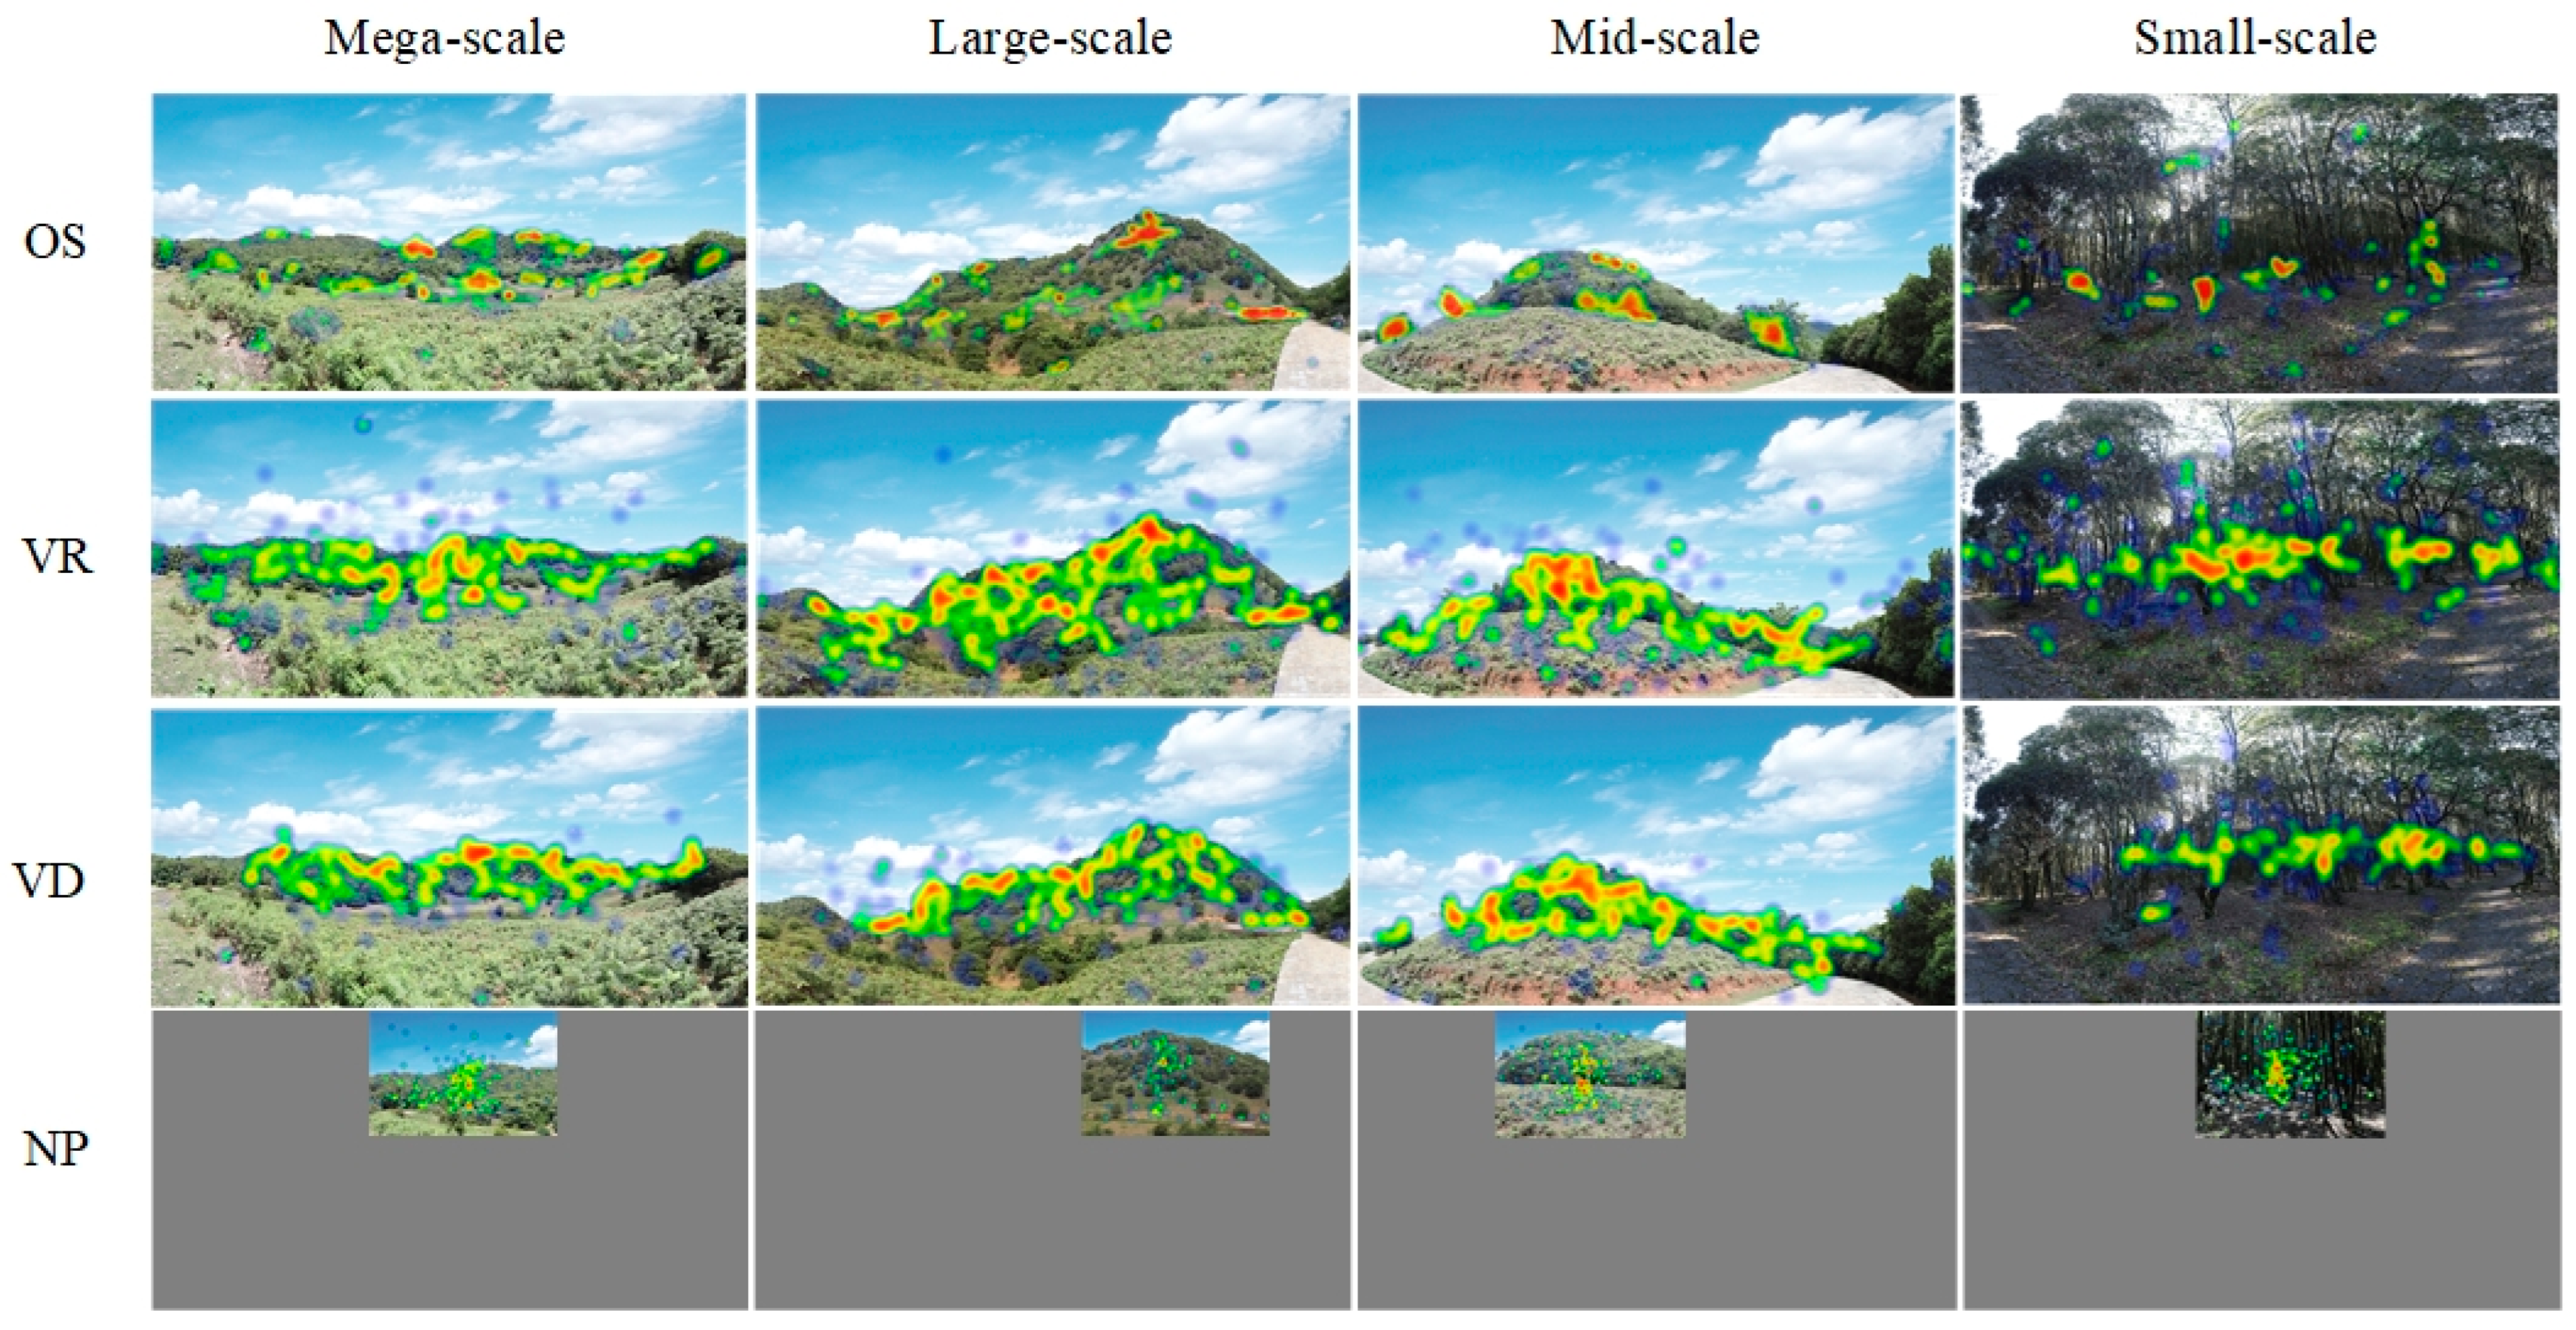
3.3. Differential Analysis of Four Visual Approaches Based on the Public Fixation Heat Map

Heat maps of fixation duration were used to intuitively show participants’ fixation areas, distinguishing correlations using different colors. Areas with longer fixation durations were shown in red, whereas shorter fixation durations were shown in green. The heat map was generated by superimposing the fixation data of all participants who observed the image. The on-site observation was limited by the equipment and was generated by manually ticking the range of fixation and then overlaying them (Figure 6). The stimulus materials were forest landscapes at four different observation scales, and the results showed that: (1) The fixation duration in the on-site group was significantly shorter than that of the other three indoor groups, with the virtual reality panorama group having the longest duration, followed by the video group, and the range of fixation was widely distributed in the more central parts of the picture, such as the mountain, vegetation, and the branches in the undergrowth of the forest. (2) The heat map of attention in the on-site group was mainly concentrated on the top of the mountain, buildings, the junction of the mountain and the sky, etc. The heat map of attention in the virtual reality panorama group was more similar to those in the on-site group. (3) The fixation duration and heat map of the normal photo group were different from those of the other three groups, as follows: the fixation duration was shorter, the heat map was mainly concentrated in the center of the picture, and there was no obvious object of fixation in the four different scales of the landscape.

3.4. Appropriateness Analysis of Visual Approaches Based on Public Physiological and Psychological Indicators

In terms of psychological emotions, there was a significant difference (p = 0.000) in the evaluation of positive emotions (“Relaxed”, “Excited”) among all four visual approaches, and the mean value of the on-site evaluation was higher. In addition, compared with the on-site group, there was no significant difference between the virtual reality panorama group and video group in negative emotions (“Irritating”, “Depressive”). On the contrary, there was a significant difference in the normal photo group (p < 0.05); normal photos were more likely to cause negative emotions in participants (Table 2).
In order to further compare the physiological contribution of the three groups of manual post-collection indoor evaluation indicators, we added two physiological indicators, electrodermal activity (EDA) and heart rate (HR), to this study. The experimental results showed that among all observation scales, only the mega-scale (Scale 1) had significant differences in heart rate (Table 3).

4. Discussion

4.1. Public Preferences, Perceptions, and Visual Approaches

4.1.1. Public Preferences and Visual Approaches

Some studies have shown that people prefer landscape spaces that are intuitive and visually appealing. By comparing four different visual approaches, this study found that visual approaches that generate a high degree of experience, a sense of participation, and evoke an emotional connection with the venue were more likely to have an impact on public preference. In the landscape beauty evaluation, a large number of studies have verified the importance of photographs as landscape materials in the field of public perception and their substitutability for on-site evaluation [60], whereas in this study, by comparing the scores of landscape beauty under various visual approaches, it was found that people’s perception of the overall beauty of the landscape was not affected by the visual approaches, thus all three manual post-collection indoor visualization approaches were satisfactory substitutability. In plant color preference, the results of two manual post-collection indoor evaluations of the video group and virtual reality panorama group were closer to the on-site evaluation, which may be due to the fact that color, as the most intuitive visual element [61], is more visually stimulating in terms of patch proportions and spatial distribution than the landscape itself [62]. It has also been shown that virtual reality panorama viewing is more conducive to evoking perceptions about color texture when shape, motion, color texture, or three-dimensional nature are present simultaneously [63]. In the activity preference, video viewing was closer to on-site observation, only in the indicator of “Seeing”. The analysis found that compared with viewing virtual reality panoramas and photos, video images are rich in dynamic changes, and the shooting path is similar to people’s daily observation habits, which is more capable of evoking people’s memories of the scene and emotional connection [64]. When the activity is strongly associated with the public sense of experience, such as taking photos and traveling, the on-site evaluation shows irreplaceable advantages, and the real scene is more likely to arouse people’s desire to explore the environment, which is consistent with Kjellgren’s conclusion that real natural environments can stimulate more energy and alteration of the state of consciousness [65], and neither photographs nor videos can fully contain information about the scene, such as plant smells, sunshine breeze [66], etc. Therefore, on-site preference testing is better for multisensory landscape perception.

4.1.2. Public Perceptions and Visual Approaches

When discussing the relationship between public perception and visual approaches, we were surprised to find that manual post-collection indoor evaluations were not only beneficial for people to concentrate their attention but also for people to perceive and observe scenarios with rich landscape elements. The quiet indoor environments are more conducive to the brain’s ability to capture and process landscape information in depth. This may be because visual perception is more compatible with the environment, and visual approaches that can grasp landscape information in a short period of time are more conducive to a complete and in-depth exploration of the environment. In landscape perception, the dynamics and temporal sequence of video reduce the difficulty of information acquisition, and people’s perception of the landscape increases as the picture changes [67], and the pervasiveness of photographs and the completeness in presenting the landscape helps the human brain to quickly acquire, process, and perceive information about the scene. Sun found that in outdoor observation, people prefer to spend their time exploring the space of the scene [68], whereas in indoors, people’s fixation duration is relatively evenly distributed and more elements are easily noticed, which further explains the weaker sense of public participation in the activity bias. In spatial perception, video can better show the overall scale of the landscape and spatial absconding changes, the auditory information integrated with the scene changes emphasizes the sense of space to a certain extent, and it has also been found that audio input is more influential than vision in the hybrid audio-visual evaluation of environmental representations [69]. In terms of public attention, manual post-collection indoor viewing both normal photos and virtual reality panoramas was more beneficial to people’s concentration, probably because indoor viewing reduces distractions in an outdoor environment and people only need to focus all their attention on the computer screen and the fixed camera angle. The choice of a fixed camera angle during the collection of the stimulus materials ensured that each participant saw the same range of landscapes, eliminating the distractions and individual differences that can exist in on-site observations [70]. Kang pointed out that when using head-mounted displays to watch 3D clips, people can move their bodies freely to explore the landscape, and the unknown visual range can arouse more viewing interest from subjects, which increased impulsive desire by 75%, emotion by 62% over watching videos and normal photographs, and improved the participants’ level of enjoyment of nature and concentration [71]. Therefore, when exploring the degree of landscape attractiveness, researchers may choose a more appropriate manual collection post-indoor evaluation method based on experimental needs.

4.2. Visual Approaches and Scales of Observation

By comparing public perception and preference, this study concluded the scope of applicability of each visual approach at different observation scales and that in all three observation scales of mega-, large-, and mid-scale, a suitable manual post-collection indoor evaluation modality can be chosen to replace in on-site evaluation, while in small-scale landscapes, on-site evaluation shows the irreplaceable advantage. Synthesizing the four forest observation scales and evaluation results, virtual reality panoramas can better reflect the spatial sense and elemental integrity of mega-scale landscapes and greatly enhance the participants’ sense of presence in the environment, which mainly comes from the specific attributes of virtual reality technology, such as a sense of control, participation, and curiosity over the spatial environment. It has also been shown that in virtual reality panoramas, participants pay more attention to the spatial layout form and overall atmosphere [72], similar to the results of this study. Video was perfectly suitable for mid-scale landscape evaluation; meanwhile, in large-scale landscapes, the form of audio-visual integration strengthened people’s attention and perception of the space, but factors such as the size of the screen and the screen boundary in the broadcasting process limited people’s observation line of sight, which affected the overall perception of the landscape [73]. Photographs were suitable for the presentation of mid-scale landscapes; static images can clearly reflect the real details of the scene, and the mid-scale landscapes of this study were forest spaces with simple, intuitive plant structures, similar to the green spaces that people come into contact with on a daily basis, which reduced the need for participant identification and perception of space [74]. In the case of small-scale landscapes, none of the above three manual post-collection indoor visualization approaches can replace the on-site observation, in which participants can observe the detailed elements in the small-scale scene more closely and from multiple angles, and the rich sensory experience increases the environmental interactivity. This is similar to Brush’s conclusion that static images cannot accurately reflect forest stand beauty and cannot provide complete spatial information [41]. Appropriate manual post-collection indoor visualization approaches could be selected as an alternative to on-site evaluation for all landscape scales except the small scale.

4.3. Visual Approaches and Eye Movement Heat Maps

Many studies have shown that eye-tracking was more objective than self-reporting in the evaluation of visual effects [75]. In this study, after comparing the eye-movement heat maps of each visual approach, we found that there was a significant difference between the fixation points of on-site evaluation and manual post-collection indoor evaluations. People’s perception and exploration of the environment were mainly influenced by visual approaches, while the observation scale had little impact on the fixation patterns. On-site evaluation showed a small range of fixation and low visual activity, and a study comparing urban landscape and natural landscape found that people preferred natural landscape, which was less informative and easy to understand, and the visual processing of natural elements was relatively simple [76]. In the manual post-collection indoor evaluation, the eye-movement heat maps had the highest overlap when viewing virtual reality panoramas and on-site observations. The head-mounted devices increased the level of immersion in the experiment, where people were free to explore the landscape space. This finding was similar to Banchi’s study, which compared the difference in concentration between viewing a 360° panorama and viewing a two-dimensional image, confirming that conscious active observation was more impactful and more likely to impress people than unconscious attraction [77]. The video showed a similar range of fixation as the virtual reality panoramas, which correlates with the dynamic nature of the image.
In addition, most of the experiments on visual tracking techniques use static images and are rarely applied to video viewing and on-site observation because the eye movement hotspots during video viewing are mainly visualized and analyzed for each frame through screenshots, which has a large amount of data and is difficult to compare and analyze. In this study, the panoramic mapping method was used, which is more convenient for comparing the differences in gaze points, but some data are still missing. By observing the subjects, we have a new explanation for this phenomenon. First, the subject’s line of sight is easily affected by the video playback order, and their line of sight is more likely to be fixed at the end of the previous video or at the edge of the screen, which leads to the missing data of the starting point of gaze in the latter video. Second, the fixed shooting direction, compared with the other three groups of experiments, misses the ability to control the scene autonomously; attention is easily dominated by the fixed shooting sequence, which will make the observation uninteresting. In summary, virtual reality panoramas make up for the lack of exploratory and spatial three-dimensionality in two-dimensional images, and the eye movement data differ minimally from on-site observation.

4.4. Visual Approaches and Psychophysiological Assessment

Physiological monitoring further enhances the accuracy of manual post-collect indoor evaluations; numerous studies have shown that viewing natural scenes through normal photos, videos, or other manual post-collection indoor visualization approaches can alter people’s physiological indicators and have a positive impact on human health [78]. On this basis, this study compared the effects of different observation scales on public physiology, and the results showed that viewing mega-scale landscapes through virtual reality panoramas can make people feel soothed. A wide visual range, rich landscape elements, and autonomous control of viewing devices were all beneficial for reducing emotional fluctuations and unnecessary energy consumption. Olszewska had similar conclusions that a bigger picture and a wider field of view can distract participants’ attention and reduce stress [79]. On the contrary, the video and normal photos were limited by the screen size and the experimental environment, which tended to make participants nervous and anxious. Many studies have shown that situational changes and instantaneous factors can have an impact on emotions, and the virtual reality panorama has shown great advantages in the degree of natural simulation and the controllability of experimental environments, providing new possibilities for manual post-collection indoor visualization approaches [80]. The virtual reality panoramas in the present study also have the above characteristics, but they are only effective in mega-scale landscapes. Participants’ levels of negative emotions while watching videos and virtual reality panoramas were closer to the on-site observation, and some studies have shown that both virtual reality panoramas and videos help to relieve stress and eliminate negative emotions [81]. However, some studies have suggested a different perspective, with Marcus Hedblom using 360° virtual photographs for assessment and finding that auditory and olfactory stimuli were more helpful in alleviating negative emotions than visuals [82]. In contrast to the virtual reality panorama group, the video group in this study included live audio, resulting in a non-significant difference between the two visual approaches.

4.5. Limitations and Future Research

This study compares the differences among four visual approaches commonly used in evaluating urban forest landscapes, namely, on-site observation and manual post-collection indoor viewing of normal photos, videos, and virtual reality panoramas, and the applicability of the results to all forms of forest landscapes needs to be further explored. There are some shortcomings in this study that limit a broader interpretation of the results: First, although the subjects in this experiment included different age groups and academic backgrounds, the number of graduate students and majors exceeded 60%, and whether the results of the experiment can represent the public needs to be further discussed, and future experiments need to strictly control the subjects’ backgrounds in all statistics [83]. Second, the number of people in this study was large, and the on-site evaluation was limited by weather changes and site security, which prevented the monitoring of physiological and visual behaviors and lacked the comparison of physiological indexes; this part of the experiment can be repeated subsequently using more portable instruments to complete the experimental results. Third, the study only selected urban forest landscapes in spring, with less variation in plant color, which may lead to insignificant variability among different visual modalities and could be followed up by increasing the sample size and comparisons among landscapes in different seasons. In addition, people’s perception of the environment is characterized by complexity and multisensory, and the future indoor evaluation after manually collected can simulate the real outside environment from a multisensory perspective to enrich the sensory plurality and further analyze the influence mechanism of each modality on the evaluation of public perception.

5. Conclusions

This study explores the relationship between different visualization approaches and public perceptual preferences in on-site and manual post-collection indoor evaluations, aiming to provide a basis for selection and theoretical support for the method of landscape evaluation parties. Specifically, people prefer the urban forest landscape with unique landscape elements and strong visual impact. The visual way that can make participants have a strong sense of presence, high compatibility between visual perception and environment, arouse the emotional connection between people and the scene, and strong controllability is the best alternative to on-site observation. Among them, video is closer to an on-site evaluation in most landscape preferences and perceptions, virtual reality panorama is more suitable for evaluating the public’s visual evaluation of behavioral characteristics, and normal photos differ greatly from on-site evaluation except for the degree of landscape beauty and spatial perception; the three observation scales of the mega-, large-, and mid-scale can be selected to replace on-site evaluation with suitable indoor visualization approaches, while on-site evaluation shows irreplaceable advantages in small-scale landscapes. In addition, this study effectively integrates public subjective preference perception data with objective eye tracking and physiological monitoring data, which strengthens the accuracy of the experiment, reveals the behavioral mechanisms behind vision, and comprehensively explains the relationship between different visual modalities, observation scales, and the public’s perceived preferences. Both video and virtual reality panorama help to recover from negative emotions, and it is more beneficial to soothe the body and mind when viewing the mega-scale landscape through a virtual reality panorama. This study not only deepens our understanding of human landscape perceptual preferences but also highlights eye-tracking technology and physiological indicator monitoring as a valuable and promising tool in landscape evaluation, providing new ways to study the interactions between humans and the natural environment.

Supplementary Materials

The following supporting information can be downloaded at: https://www.mdpi.com/article/10.3390/f15091566/s1, Table S1: Questionnaire on four visual scales; Table S2: Questionnaire on four visual approaches; Table S3: Eye tracking data while watching videos; Table S4: Physiological indicator.

Author Contributions

Conceptualization, X.D., Z.Z. and J.Z.; methodology, X.D. and W.L.; software, X.D., J.Z. and Y.M.; formal analysis, X.D., Y.W. and J.Z.; investigation, Z.L. and X.D.; writing-original draft preparation, X.D. and J.Z.; project administration, J.W.; writing-review and editing, Z.Z; funding acquisition, Z.Z. All authors have read and agreed to the published version of the manuscript.

Funding

This research was supported by the National Natural Science Foundation of China, grant No. 31860234, and the Yunnan Fundamental Research Projects, grant No. 202301AT070222.

Data Availability Statement

The data used in this study are included in the Supplementary Material, and any additional inquiries could be directed to the corresponding authors.

Acknowledgments

This study was supported by the “Scientific Research Support” project provided by Kingfar International Inc. Thanks for the research technical and ErgoLAB Man-Machine- Environment Testing Cloud Platform-related scientific research equipment support of the Kingfar pro-508ject team.

Conflicts of Interest

The authors declare no conflicts of interest.

References

  1. Yang, W.; Fen, X. International experience and inspiration of urban forest management, China. World For. Res. 2023, 36, 33–38. [Google Scholar] [CrossRef]
  2. Wang, P.; Fan, B.; He, Y.; Wang, J.; Li, Z. Analysis on the concept and problems of urban forest as green infrastructure, China. World For. Res. 2018, 31, 88–92. [Google Scholar] [CrossRef]
  3. Chen, Y.; Zhong, Q.; Li, B. Positive or Negative Viewpoint Determines the Overall Scenic Beauty of a Scene: A Landscape Perception Evaluation Based on a Panoramic View. Sustainability 2023, 15, 11458. [Google Scholar] [CrossRef]
  4. Zhang, Z. Forest Color Characteristics and Their Effects Based on Public Response Evaluation; Chinese Academy of Forestry: Beijing, China, 2017; pp. 1–220. [Google Scholar]
  5. Zhang, Y.; Su, T.; Ma, Y.; Wang, Y.; Wang, W.; Zha, N.; Shao, M. Forest ecosystem service functions and their associations with landscape patterns in Renqiu City. PLoS ONE 2022, 17, e0265015. [Google Scholar] [CrossRef]
  6. Cheng, B.; Li, S. The influence of spatial structure features on visual perception and preference in forest: Based on tree arrangement, branching characteristics, and sub branch characteristics, China. J. Chin. Urban For. 2023, 21, 43–51. [Google Scholar]
  7. Stoltz, J.; Schaffer, C. Salutogenic affordances and sustainability: Multiple benefits with edible forest gardens in urban green spaces. Front. Psychol. 2018, 9, 343957. [Google Scholar] [CrossRef]
  8. Liu, L.; Qu, H.; Ma, Y.; Wang, K.; Qu, H. Restorative benefits of urban green space: Physiological, psychological restoration and eye movement analysis. J. Environ. Manag. 2022, 301, 113930. [Google Scholar] [CrossRef] [PubMed]
  9. Song, R.; Chen, Q.; Zhang, Y.; Jia, Q.a.; He, H.; Gao, T.; Qiu, L. Psychophysiological restorative potential in cancer patients by virtual reality (VR)-based perception of natural environment. Front. Psychol. 2022, 13, 1003497. [Google Scholar] [CrossRef] [PubMed]
  10. Fujisaki, I.; Mohammadi-Aragh, M.J.; Evans, D.L.; Moorhead, R.J.; Irby, D.W.; Roberts, S.D.; Grado, S.C.; Schultz, E.B. Comparing forest assessment based on computer visualization versus videography. Landsc. Urban Plan. 2007, 81, 146–154. [Google Scholar] [CrossRef]
  11. Profice, C.C.; Grenno, F.E.; Fandi, A.C.; Menezes, S.M.; Seminara, C.I.; Cassano, C.R. Learning in the forest: Environmental perception of Brazilian teenagers. Front. Psychol. 2023, 14, 1046405. [Google Scholar] [CrossRef]
  12. Jeon, J.Y.; Jo, H.I. Effects of audio-visual interactions on soundscape and landscape perception and their influence on satisfaction with the urban environment. Build. Environ. 2020, 169, 106544. [Google Scholar] [CrossRef]
  13. Leite, S.K.; Vendruscolo, G.S.; Renk, A.A.; Kissmann, C. Perception of farmers on landscape change in southern Brazil: Divergences and convergences related to gender and age. J. Rural Stud. 2019, 69, 11–18. [Google Scholar] [CrossRef]
  14. Song, S.; Wang, S.; Shi, M.; Hu, S.; Xu, D. Urban blue–green space landscape ecological health assessment based on the integration of pattern, process, function and sustainability. Sci. Rep. 2022, 12, 7707. [Google Scholar] [CrossRef] [PubMed]
  15. Sevenant, M.; Antrop, M. Landscape representation validity: A comparison between on-site observations and photographs with different angles of view. Landsc. Res. 2011, 36, 363–385. [Google Scholar] [CrossRef]
  16. Gao, T.; Liang, H.; Chen, Y.; Qiu, L. Comparisons of landscape preferences through three different perceptual approaches. Int. J. Environ. Res. Public Health 2019, 16, 4754. [Google Scholar] [CrossRef]
  17. Gao, Y.; Zhang, T.; Zhang, W.; Meng, H.; Zhang, Z. Research on visual behavior characteristics and cognitive evaluation of different types of forest landscape spaces. Urban For. Urban Green. 2020, 54, 126788. [Google Scholar] [CrossRef]
  18. Ode, A.; Fry, G.; Tveit, M.S.; Messager, P.; Miller, D. Indicators of perceived naturalness as drivers of landscape preference. J. Environ. Manag. 2009, 90, 375–383. [Google Scholar] [CrossRef]
  19. Lin, W.; Mu, Y.; Zhang, Z.; Wang, J.; Diao, X.; Lu, Z.; Guo, W.; Wang, Y.; Xu, B. Research on cognitive evaluation of forest color based on visual behavior experiments and landscape preference. PLoS ONE 2022, 17, e0276677. [Google Scholar] [CrossRef] [PubMed]
  20. Franěk, M. Landscape Preference: The Role of Attractiveness and Spatial Openness of the Environment. Behav. Sci. 2023, 13, 666. [Google Scholar] [CrossRef]
  21. Zhou, X.; Cen, Q.; Qiu, H. Effects of urban waterfront park landscape elements on visual behavior and public preference: Evidence from eye-tracking experiments. Urban For. Urban Green. 2023, 82, 127889. [Google Scholar] [CrossRef]
  22. Hetherington, J.; Daniel, T.C.; Brown, T.C. Is motion more important than it sounds?: The medium of presentation in environment perception research. J. Environ. Psychol. 1993, 13, 283–291. [Google Scholar] [CrossRef]
  23. Kroh, D.P.; Gimblett, R.H. Comparing live experience with pictures in articulating landscape preference. Landsc. Res. 1992, 17, 58–69. [Google Scholar] [CrossRef]
  24. Trent, R.B.; Neumann, E.; Kvashny, A. Presentation mode and question format artifacts in visual assessment research. Landsc. Urban Plan. 1987, 14, 225–235. [Google Scholar] [CrossRef]
  25. Palmer, J.F.; Hoffman, R.E. Rating reliability and representation validity in scenic landscape assessments. Landsc. Urban Plan. 2001, 54, 149–161. [Google Scholar] [CrossRef]
  26. Tang, X.; Feng, S.; Liang, G.; Ding, S. Landscape preferences of different stakeholders in highly intensive agricultural landscapes, China. Chin. J. Appl. Ecol. 2018, 29, 2633–2640. [Google Scholar] [CrossRef]
  27. Luo, T.; Tang, F.; Huang, L.; Xu, M. Where to send homesickness?—Reflections triggered by the comparative study of landscape preference of high school students in Xiamen and Xinjiang, China. Chin. Landsc. Archit. 2019, 35, 98–103. [Google Scholar]
  28. Junge, X.; Schüpbach, B.; Walter, T.; Schmid, B.; Lindemann-Matthies, P. Aesthetic quality of agricultural landscape elements in different seasonal stages in Switzerland. Landsc. Urban Plan. 2015, 133, 67–77. [Google Scholar] [CrossRef]
  29. Wang, H.; Ye, J.; Tarin, M.W.K.; Liu, Y.; Zheng, Y. Tourists’ Safety Perception Clues in the Urban Forest Environment: Visual Quality, Facility Completeness, Accessibility—A Case Study of Urban Forests in Fuzhou, China. Int. J. Environ. Res. Public Health 2022, 19, 1293. [Google Scholar] [CrossRef] [PubMed]
  30. Chen, H.; Wang, M.; Zhang, Z. Research on rural landscape preference based on TikTok short video content and user comments. Int. J. Environ. Res. Public Health 2022, 19, 10115. [Google Scholar] [CrossRef]
  31. Saun, T.J.; Grantcharov, T.P. Development of the user experience (UX) and video quality evaluation (VQE) instruments for assessment of intraoperative video capture technology. J. Surg. Educ. 2021, 78, 201–206. [Google Scholar] [CrossRef]
  32. Gong, P.; Liu, C.; Gu, X. Study on substitution effect of photo and animation media in urban plant visual landscape evaluation, China. Chin. Landsc. Archit. 2017, 33, 97–102. [Google Scholar]
  33. Mostajeran, F.; Krzikawski, J.; Steinicke, F.; Kühn, S. Effects of exposure to immersive videos and photo slideshows of forest and urban environments. Sci. Rep. 2021, 11, 3994. [Google Scholar] [CrossRef] [PubMed]
  34. Foltête, J.-C.; Ingensand, J.; Blanc, N. Coupling crowd-sourced imagery and visibility modelling to identify landscape preferences at the panorama level. Landsc. Urban Plan. 2020, 197, 103756. [Google Scholar] [CrossRef]
  35. Lei, K.; Zhang, H.; Qiu, H.; Yang, T.; Liu, Y.; Zhang, J.; Hu, X.; Cui, Z. A novel strategy for constructing large-scale forest scene: Integrating forest hierarchical models and tree growth models to improve the efficiency and stability of forest polymorphism simulation. Forests 2023, 14, 1595. [Google Scholar] [CrossRef]
  36. Chen, W. On boat: A magnificent panorama of River Basin in Tang Dynasty. Heliyon 2023, 9, e12771. [Google Scholar] [CrossRef] [PubMed]
  37. Li, C.; Du, C.; Ge, S.; Tong, T. An eye-tracking study on visual perception of vegetation permeability in virtual reality forest exposure. Front. Public Health 2023, 11, 1089423. [Google Scholar] [CrossRef]
  38. Chen, G.; Sun, X.; Yu, W.; Wang, H. Analysis Model of the Relationship between Public Spatial Forms in Traditional Villages and Scenic Beauty Preference Based on LiDAR Point Cloud Data. Land 2022, 11, 1133. [Google Scholar] [CrossRef]
  39. Qin, X.; Fang, M.; Yang, D.; Wangari, V.W. Quantitative evaluation of attraction intensity of highway landscape visual elements based on dynamic perception. Environ. Impact Assess. Rev. 2023, 100, 107081. [Google Scholar] [CrossRef]
  40. Gobster, P.H.; Ribe, R.G.; Palmer, J.F. Themes and trends in visual assessment research: Introduction to the Landscape and Urban Planning special collection on the visual assessment of landscapes. Landsc. Urban Plan. 2019, 191, 103635. [Google Scholar] [CrossRef]
  41. Brush, R.O. The attractiveness of woodlands: Perceptions of forest landowners in Massachusetts. For. Sci. 1979, 25, 495–506. [Google Scholar]
  42. Stewart, T.R.; Middleton, P.; Downton, M.; Ely, D. Judgments of photographs vs. field observations in studies of perception and judgment of the visual environment. J. Environ. Psychol. 1984, 4, 283–302. [Google Scholar] [CrossRef]
  43. Sun, M.; Herrup, K.; Shi, B.; Hamano, Y.; Liu, C.; Goto, S. Changes in visual interaction: Viewing a Japanese garden directly, through glass or as a projected image. J. Environ. Psychol. 2018, 60, 116–121. [Google Scholar] [CrossRef]
  44. Brivio, E.; Serino, S.; Negro Cousa, E.; Zini, A.; Riva, G.; De Leo, G. Virtual reality and 360 panorama technology: A media comparison to study changes in sense of presence, anxiety, and positive emotions. Virtual Real. 2021, 25, 303–311. [Google Scholar] [CrossRef]
  45. Lehto, C.; Hedblom, M.; Filyushkina, A.; Ranius, T. Seeing through their eyes: Revealing recreationists’ landscape preferences through viewshed analysis and machine learning. Landsc. Urban Plan. 2024, 248, 105097. [Google Scholar] [CrossRef]
  46. Kalivoda, O.; Vojar, J.; Skřivanová, Z.; Zahradník, D. Consensus in landscape preference judgments: The effects of landscape visual aesthetic quality and respondents’ characteristics. J. Environ. Manag. 2014, 137, 36–44. [Google Scholar] [CrossRef]
  47. Gundersen, V.; Stange, E.; Kaltenborn, B.; Vistad, O. Public visual preferences for dead wood in natural boreal forests: The effects of added information. Landsc. Urban Plan. 2017, 158, 12–24. [Google Scholar] [CrossRef]
  48. Clay, G.R.; Smidt, R.K. Assessing the validity and reliability of descriptor variables used in scenic highway analysis. Landsc. Urban Plan. 2004, 66, 239–255. [Google Scholar] [CrossRef]
  49. Coeterier, J.F. Cues for the perception of the size of space in landscapes. J. Environ. Manag. 1994, 42, 333–347. [Google Scholar] [CrossRef]
  50. Bourassa, S.C. A paradigm for landscape aesthetics. Environ. Behav. 1990, 22, 787–812. [Google Scholar] [CrossRef]
  51. Ribe, R.G.; Armstrong, E.T.; Gobster, P.H. Scenic vistas and the changing policy landscape: Visualizing and testing the role of visual resources in ecosystem management. Landsc. J. 2002, 21, 42–66. [Google Scholar] [CrossRef]
  52. Tansey, L.; Gonzalez-Perez, M.-A. University Platform and Student Volunteering: Harnessing Student Civic Engagement through Volunteering; Community Knowledge Initiative National University of Ireland: Galway, Ireland, 2006; pp. 1–14. [Google Scholar]
  53. Williamson, I.; Wildbur, D.; Bell, K.; Tanner, J.; Matthews, H. Benefits to university students through volunteering in a health context: A new model. Br. J. Educ. Stud. 2018, 66, 383–402. [Google Scholar] [CrossRef]
  54. Daniel, T.C. Measuring Landscape Esthetics: The Scenic Beauty Estimation Method; Department of Agriculture, Forest Service, Rocky Mountain Forest and Range Experiment Station: Fort Collins, CO, USA, 1976; Volume 167. [Google Scholar]
  55. Hagerhall, C. Consensus in landscape preference judgements. J. Environ. Psychol. 2001, 21, 83–92. [Google Scholar] [CrossRef]
  56. Mitchell, R. Is physical activity in natural environments better for mental health than physical activity in other environments? Soc. Sci. Med. 2013, 91, 130–134. [Google Scholar] [CrossRef]
  57. Jiang, S.; Allison, D.; Duchowski, A.T. Hospital Greenspaces and the Impacts on Wayfinding and Spatial Experience: An Explorative Experiment Through Immersive Virtual Environment (IVE) Techniques. Herd 2022, 15, 206–228. [Google Scholar] [CrossRef]
  58. Herzog, T.R. A cognitive analysis of preference for field-and-forest environments. Landsc. Res. 1984, 9, 10–16. [Google Scholar] [CrossRef]
  59. Watson, D.; Clark, L.A.; Tellegen, A. Development and validation of brief measures of positive and negative affect: The PANAS scales. J. Personal. Soc. Psychol. 1988, 54, 1063. [Google Scholar] [CrossRef]
  60. Sáenz de Tejada Granados, C.; Santo-Tomás Muro, R.; Rodríguez Romero, E.J. Exploring landscape preference through photo-based Q methodology. Madrid seen by suburban adolescents. Int. Res. Geogr. Environ. Educ. 2021, 30, 255–278. [Google Scholar] [CrossRef]
  61. Chang, Z.; Han, W.; Wang, C. The influence of plant color on the visual attractiveness of summer and autumn landscape on the urban bank of Chaobai River, China. Sci. Silvae Sin. 2023, 59, 30–39. [Google Scholar]
  62. Park, S.S.-C. Handbook of Vitreo-Retinal Disorder Management: A Practical Reference Guide; World Scientific: London, UK, 2015. [Google Scholar]
  63. Taylor, R.; Savickaite, S.; Henderson, S.; Simmons, D. Using immersive virtual reality to recreate the synaesthetic experience. i-Perception 2023, 14, 20416695231166305. [Google Scholar] [CrossRef]
  64. Browning, M.H.; Mimnaugh, K.J.; Van Riper, C.J.; Laurent, H.K.; LaValle, S.M. Can simulated nature support mental health? Comparing short, single-doses of 360-degree nature videos in virtual reality with the outdoors. Front. Psychol. 2020, 10, 2667. [Google Scholar] [CrossRef]
  65. Kjellgren, A.; Buhrkall, H. A comparison of the restorative effect of a natural environment with that of a simulated natural environment. J. Environ. Psychol. 2010, 30, 464–472. [Google Scholar] [CrossRef]
  66. Tsunetsugu, Y.; Lee, J.; Park, B.-J.; Tyrväinen, L.; Kagawa, T.; Miyazaki, Y. Physiological and psychological effects of viewing urban forest landscapes assessed by multiple measurements. Landsc. Urban Plan. 2013, 113, 90–93. [Google Scholar] [CrossRef]
  67. Chung, K.; Lee, D.; Park, J.Y. Involuntary attention restoration during exposure to mobile-based 360 virtual nature in healthy adults with different levels of restorative experience: Event-related potential study. J. Med. Internet Res. 2018, 20, e11152. [Google Scholar] [CrossRef]
  68. Nie, X.; Wang, Y.; Zhang, C.; Zhao, Y.; Kirkwood, N. The varied restorative values of campus landscapes to students’ well-being: Evidence from a Chinese University. BMC Public Health 2024, 24, 487. [Google Scholar] [CrossRef]
  69. Restout, J.; Bernache-Assollant, I.; Morizio, C.; Boujut, A.; Angelini, L.; Tchalla, A.; Perrochon, A. Fully immersive virtual reality using 360 videos to manage well-being in older adults: A scoping review. J. Am. Med. Dir. Assoc. 2023, 24, 564–572. [Google Scholar] [CrossRef]
  70. Svobodova, K.; Vojar, J.; Sklenicka, P.; Filova, L. Presentation matters: Causes of differences in preferences for agricultural landscapes displayed via photographs and videos. Space Cult. 2018, 21, 259–273. [Google Scholar] [CrossRef]
  71. Kang, H. Impact of VR on impulsive desire for a destination. J. Hosp. Tour. Manag. 2020, 42, 244–255. [Google Scholar]
  72. Shi, J.; Honjo, T.; Zhang, K.; Furuya, K. Using virtual reality to assess landscape: A comparative study between on-site survey and virtual reality of aesthetic preference and landscape cognition. Sustainability 2020, 12, 2875. [Google Scholar] [CrossRef]
  73. Olszewska-Guizzo, A.; Sia, A.; Fogel, A.; Ho, R. Features of urban green spaces associated with positive emotions, mindfulness and relaxation. Sci. Rep. 2022, 12, 20695. [Google Scholar] [CrossRef]
  74. Sofield, T.H.; Marafa, L.M. Revitalizing fieldtrips in tourism: Visual anthropology, photo elicitation, rapid appraisal, participant observation and Habermas. Tour. Manag. 2019, 75, 522–546. [Google Scholar] [CrossRef]
  75. Lima, D.d.S.; Ventura, D.F. A review of experimental task design in psychophysical eye tracking research. Front. Hum. Neurosci. 2023, 17, 1112769. [Google Scholar] [CrossRef] [PubMed]
  76. Xiao, L.; Wang, S. Mobile marketing interface layout attributes that affect user aesthetic preference: An eye-tracking study. Asia Pac. J. Mark. Logist. 2023, 35, 472–492. [Google Scholar] [CrossRef]
  77. Lin, Z.; Zhang, L.; Tang, S.; Song, Y.; Ye, X. Evaluating cultural landscape remediation design based on VR technology. ISPRS Int. J. Geo-Inf. 2021, 10, 423. [Google Scholar] [CrossRef]
  78. Hedblom, M.; Gunnarsson, B.; Iravani, B.; Knez, I.; Schaefer, M.; Thorsson, P.; Lundström, J.N. Reduction of physiological stress by urban green space in a multisensory virtual experiment. Sci. Rep. 2019, 9, 10113. [Google Scholar] [CrossRef]
  79. Olszewska, A.A.; Marques, P.F.; Ryan, R.L.; Barbosa, F. What makes a landscape contemplative? Environ. Plan. B Urban Anal. City Sci. 2018, 45, 7–25. [Google Scholar] [CrossRef]
  80. Colombo, D.; Díaz-García, A.; Fernandez-Lvarez, J.; Botella, C. Virtual reality for the enhancement of emotion regulation. Clin. Psychol. Psychother. 2021, 28, 519–537. [Google Scholar] [CrossRef] [PubMed]
  81. Young, C.; Hofmann, M.; Frey, D.; Moretti, M.; Bauer, N. Psychological restoration in urban gardens related to garden type, biodiversity and garden-related stress. Landsc. Urban Plan. 2020, 198, 103777. [Google Scholar] [CrossRef]
  82. Gu, L.; Sun, B.; Liu, L.; Li, Y.; Zhang, Q.; Yang, J. Research and verification of a new relaxation technology based on virtual reality for human psychological security and psychosomatic recovery. In Proceedings of the 2021 IEEE International Conference on Intelligence and Safety for Robotics (ISR), Tokoname, Japan, 4–6 March 2021; pp. 33–37. [Google Scholar]
  83. Johnson, T.; Burgoyne, A.P.; Mix, K.S.; Young, C.J.; Levine, S.C. Spatial and mathematics skills: Similarities and differences related to age, SES, and gender. Cognition 2022, 218, 104918. [Google Scholar] [CrossRef]
Figure 1. Location of the research site.
Forests 15 01566 g001
Figure 2. Panoramic photos of each vista used as experimental samples at four different landscape (viewing distance) scales. (Scale 1: mega-scale, ≥200 m; Scale 2: large-scale, 200–100 m; Scale 3: mid-scale, 100–50 m; Scale 4: small-scale, ≤50 m).
Forests 15 01566 g002
Figure 3. Procedure. Notes. (a) Tobii Pro VR eye-tracking device (VR group), (b) ErgoLAB V3.0 smart wearable human factors physiological recorder; (c) Tobii Pro Fusion virtual reality eye-tracking device (VD group, NP group); (d) ErgoLAB V3.0 human-computer environment synchronization platform; (e) Flowchart of experimental design; (f) Experimental Groups. OS: On-site group, VR: Virtual reality panorama group, VD: Video group, NP: Normal photo group. (g) Experimental monitoring index.
Forests 15 01566 g003
Figure 4. Means of questionnaires for different public preferences and perceptions. Notes. *: p < 0.05; **: p < 0.01.
Forests 15 01566 g004
Figure 5. Means of questionnaires for different landscape scales.
Forests 15 01566 g005
Figure 6. Heat map for different landscape scales. Notes. Since ordinary photos cover a smaller angle than other methods, the image size ratio is not guaranteed to be the same, and gray is used to fill in the unfilmed areas.
Forests 15 01566 g006
Table 1. Kruskal–Wallis ANOVA analysis of variance with four presentation modes for different sights.
OS and VROS and VDOS and NP
ItemScale 1Scale 2Scale 3Scale 4Scale 1Scale 2Scale 3Scale 4Scale 1Scale 2Scale 3Scale 4
Landscape beauty0.224---0.901---1---
Plant color preference0.8680.027 *0.021 *0.028 *0.541110.0790.020 *0.18610.001 **
Traveling-0.014 **0.015 *0.206-110.019 *-0.000 **0.7630.003 **
Seeing0.1290.000 **0.3000.025 *0.013 *0.63410.025 *0.000 **0.000 **10.002 **
Taking Photos0.0980.000 **0.021 *0.000 **0.008 **0.48010.000 **0.001 **0.004 **10.000 **
Walking0.0710.006 *0.001 **0.2160.000 **0.2280.3970.005 **0.000 **0.000 **0.001 **0.000 **
Plant color richness-0.6610.026 *0.000 **-110.049 *-110.001 **
Landscape elements0.005 **-0.1310.002 **0.073-10.025 *0.059-10.002 **
Attention-1---0.236---1--
Landscape scale-0.092---0.036 *---0.083--
Openness-0.006 **---0.277---0.042 *--
Notes. *: p < 0.05; **: p < 0.01; Hyphen (-) in the table indicates that if there is no overall difference among the three approaches; further analysis between each approach will no longer be processed. OS: On-site group, VR: Virtual reality panorama group, VD: Video group, NP: Normal photo group.
Table 2. Kruskal–Wallis ANOVA analysis of variance with four presentation modes for all sights.
CategoryQuestionnaireSig.
OS, VR, VD, and NPOS and VROS and VDOS and NP
PsychologicalPERelaxed0.000 **0.000 **0.000 **0.000 **
Excited0.000 **0.000 **0.000 **0.000 **
NEIrritating0.004 **110.034 *
Depressive0.001 **110.002 **
Notes. *: p < 0.05; **: p < 0.01.
Table 3. Kruskal–Wallis ANOVA analysis of all psychological indicators in the four landscape scales.
Landscape ScaleSig.
EDA (μs)HR (ms)
Scale 10.8450.002 *
Scale 20.9800.050
Scale 30.6270.687
Scale 40.9060.650
Notes. *: p < 0.05.
Disclaimer/Publisher’s Note: The statements, opinions and data contained in all publications are solely those of the individual author(s) and contributor(s) and not of MDPI and/or the editor(s). MDPI and/or the editor(s) disclaim responsibility for any injury to people or property resulting from any ideas, methods, instructions or products referred to in the content.

