Article

Biomass Equations and Carbon Stock Estimates for the Southeastern Brazilian Atlantic Forest

by
Tatiana Dias Gaui
1,*,
Vinicius Costa Cysneiros
2,
Fernanda Coelho de Souza
3,
Hallefy Junio de Souza
1,
Telmo Borges Silveira Filho
4,
Daniel Costa de Carvalho
1,
José Henrique Camargo Pace
1,
Graziela Baptista Vidaurre
5 and
Eder Pereira Miguel
1
1
Department of Forestry, Campus Darcy Ribeiro, University of Brasilia, Brasília 70910-900, Brazil
2
Department of Agriculture, Biodiversity and Forests, Federal University of Santa Catarina, Campus Curitibanos, Curitibanos 89520-000, Brazil
3
BeZero Carbon, London E1 6JE, UK
4
Department of Environmental Science, Federal Rural University of Rio de Janeiro, Seropédica 23890-000, Brazil
5
Department of Forestry and Wood, Federal University of Espírito Santo, Jerônimo Monteiro 29550-000, Brazil
*
Author to whom correspondence should be addressed.
Forests 2024, 15(9), 1568; https://doi.org/10.3390/f15091568
Submission received: 25 June 2024 / Revised: 23 July 2024 / Accepted: 31 July 2024 / Published: 6 September 2024
(This article belongs to the Section Forest Ecology and Management)

Abstract

:
Tropical forests play an important role in mitigating global climate change, emphasizing the need for reliable estimates of forest carbon stocks at regional and global scales. This is essential for effective carbon management, which involves strategies like emission reduction and enhanced carbon sequestration through forest restoration and conservation. However, reliable sample-based estimations of forest carbon stocks require accurate allometric equations, which are lacking for the rainforests of the Atlantic Forest Domain (AFD). In this study, we fitted biomass equations for the three main AFD forest types and accurately estimated the amount of carbon stored in their above-ground biomass (AGB) in Rio de Janeiro state, Brazil. Using non-destructive methods, we measured the total wood volume and wood density of 172 trees from the most abundant species in the main remnants of rainforest, semideciduous forest, and restinga forest in the state. The biomass and carbon stocks were estimated with tree-level data from 185 plots obtained in the National Forest Inventory conducted in Rio de Janeiro. Our locally developed allometric equations estimated the state’s biomass stocks at 70.8 ± 5.4 Mg ha−1 and carbon stocks at 35.4 ± 2.7 Mg ha−1. Notably, our estimates were more accurate than those obtained using a widely applied pantropical allometric equation from the literature, which tended to overestimate biomass and carbon stocks. These findings can be used for establishing a baseline for monitoring carbon stocks in the Atlantic Forest, especially in the context of the growing voluntary carbon market, which demands more consistent and accurate carbon stock estimations.

1. Introduction

Tropical rainforests are crucial in regulating biogeochemical cycles, annually absorbing carbon equivalent to global anthropogenic emissions [1] and storing an order of magnitude greater [2]. However, these forests are under increasing anthropogenic pressure, such as land use and climate changes. In Brazil’s Atlantic coastal zone, which is home to almost 70% of the population, intense anthropogenic pressure has led to extensive forest conversion. Presently, a mere ~10% of the original forest cover persists, fragmented into small remnants [3]. These fragments are heavily affected by edge effects and have lost and continue to lose large amounts of biomass and biodiversity [4]. Currently, most remnants are isolated secondary forests at different successional stages [5]. As a result, the Atlantic Forest Domain (AFD) [6] is one of the most threatened biodiversity hotspots in the world [7]. AFD remnants are primarily located in protected areas, including conservation units and Permanent Preservation Areas designated for slope stability and water supply to mountainous megacities like Rio de Janeiro.
Although the AFD is widely recognized for its biological importance and role in climate change mitigation, little is known about its capacity to store and sequester carbon [8,9,10]. To establish a credible evidence base for formulating public policies targeting the continued maintenance of carbon storage and sequestration in the AFD, reliable estimates of stored carbon are needed. However, the AFD lacks specific allometric models for its main vegetation types [11], which limits the calculation of reliable estimates of carbon stocks and sequestration [12].
In tropical forests, equations that quantify forest biomass are usually produced through destructive methods, wherein selected trees are felled to facilitate measurement and weighing [13,14,15,16]. However, in threatened ecosystems protected by environmental legislation, such as those within the AFD, non-destructive methods are required to obtain the necessary data for fitting allometric equations [17]. A possible approach to estimating biomass stocks is applying pantropical allometric models using available data on tree diameter, height, and wood density [18]. Although widely used, this approach can result in substantial uncertainty [16], highlighting the need to develop local models that potentially produce more accurate and reliable estimates of biomass [19,20], especially in ecosystems that contain multiple vegetation types.
Developing local models to reliably estimate biomass and carbon stocks is particularly relevant in Rio de Janeiro state, where nearly 30% of its area is composed of AFD remnants in well-preserved conditions [21]. Moreover, locally developed equations may also enable the creation of financial mechanisms for compensating environmental conservation actions in the state, such as Payment for Environmental Services (PES) and Reducing Emissions from Deforestation and Forest Degradation (REDD+). These initiatives have been growing due to expansions in PES schemes and the voluntary carbon market. However, estimates of emission reductions and carbon removal are often overestimated in carbon market projects, which is likely attributable to the choice of the allometric equation [22]. The quantity and quality of carbon credits produced through REDD+ depend on the accuracy, or at the very least, the conservativeness of carbon estimates. At present, no such specific and locally calibrated allometric models exist for Rio de Janeiro state. Aiming to fill this gap, we produced allometric equations for the main AFD forest types, namely, rainforest, semideciduous forest, and restinga forest. We hypothesized that these forest-specific equations would produce more accurate biomass and carbon estimates than (1) a local-generic equation and (2) a pantropical equation. To test this, we applied a non-destructive method to take measurements along the stem and crown (i.e., diameter, height) of 172 standing trees in the three forest types and determined the basic wood density of samples collected at different tree heights. We then used these data for (i) fitting different allometric equations for each forest type, (ii) estimating total above-ground biomass and carbon stocks, and (iii) comparing the accuracy of the estimates using the pantropical, local-generic, and forest-specific allometric equations.

2. Material and Methods
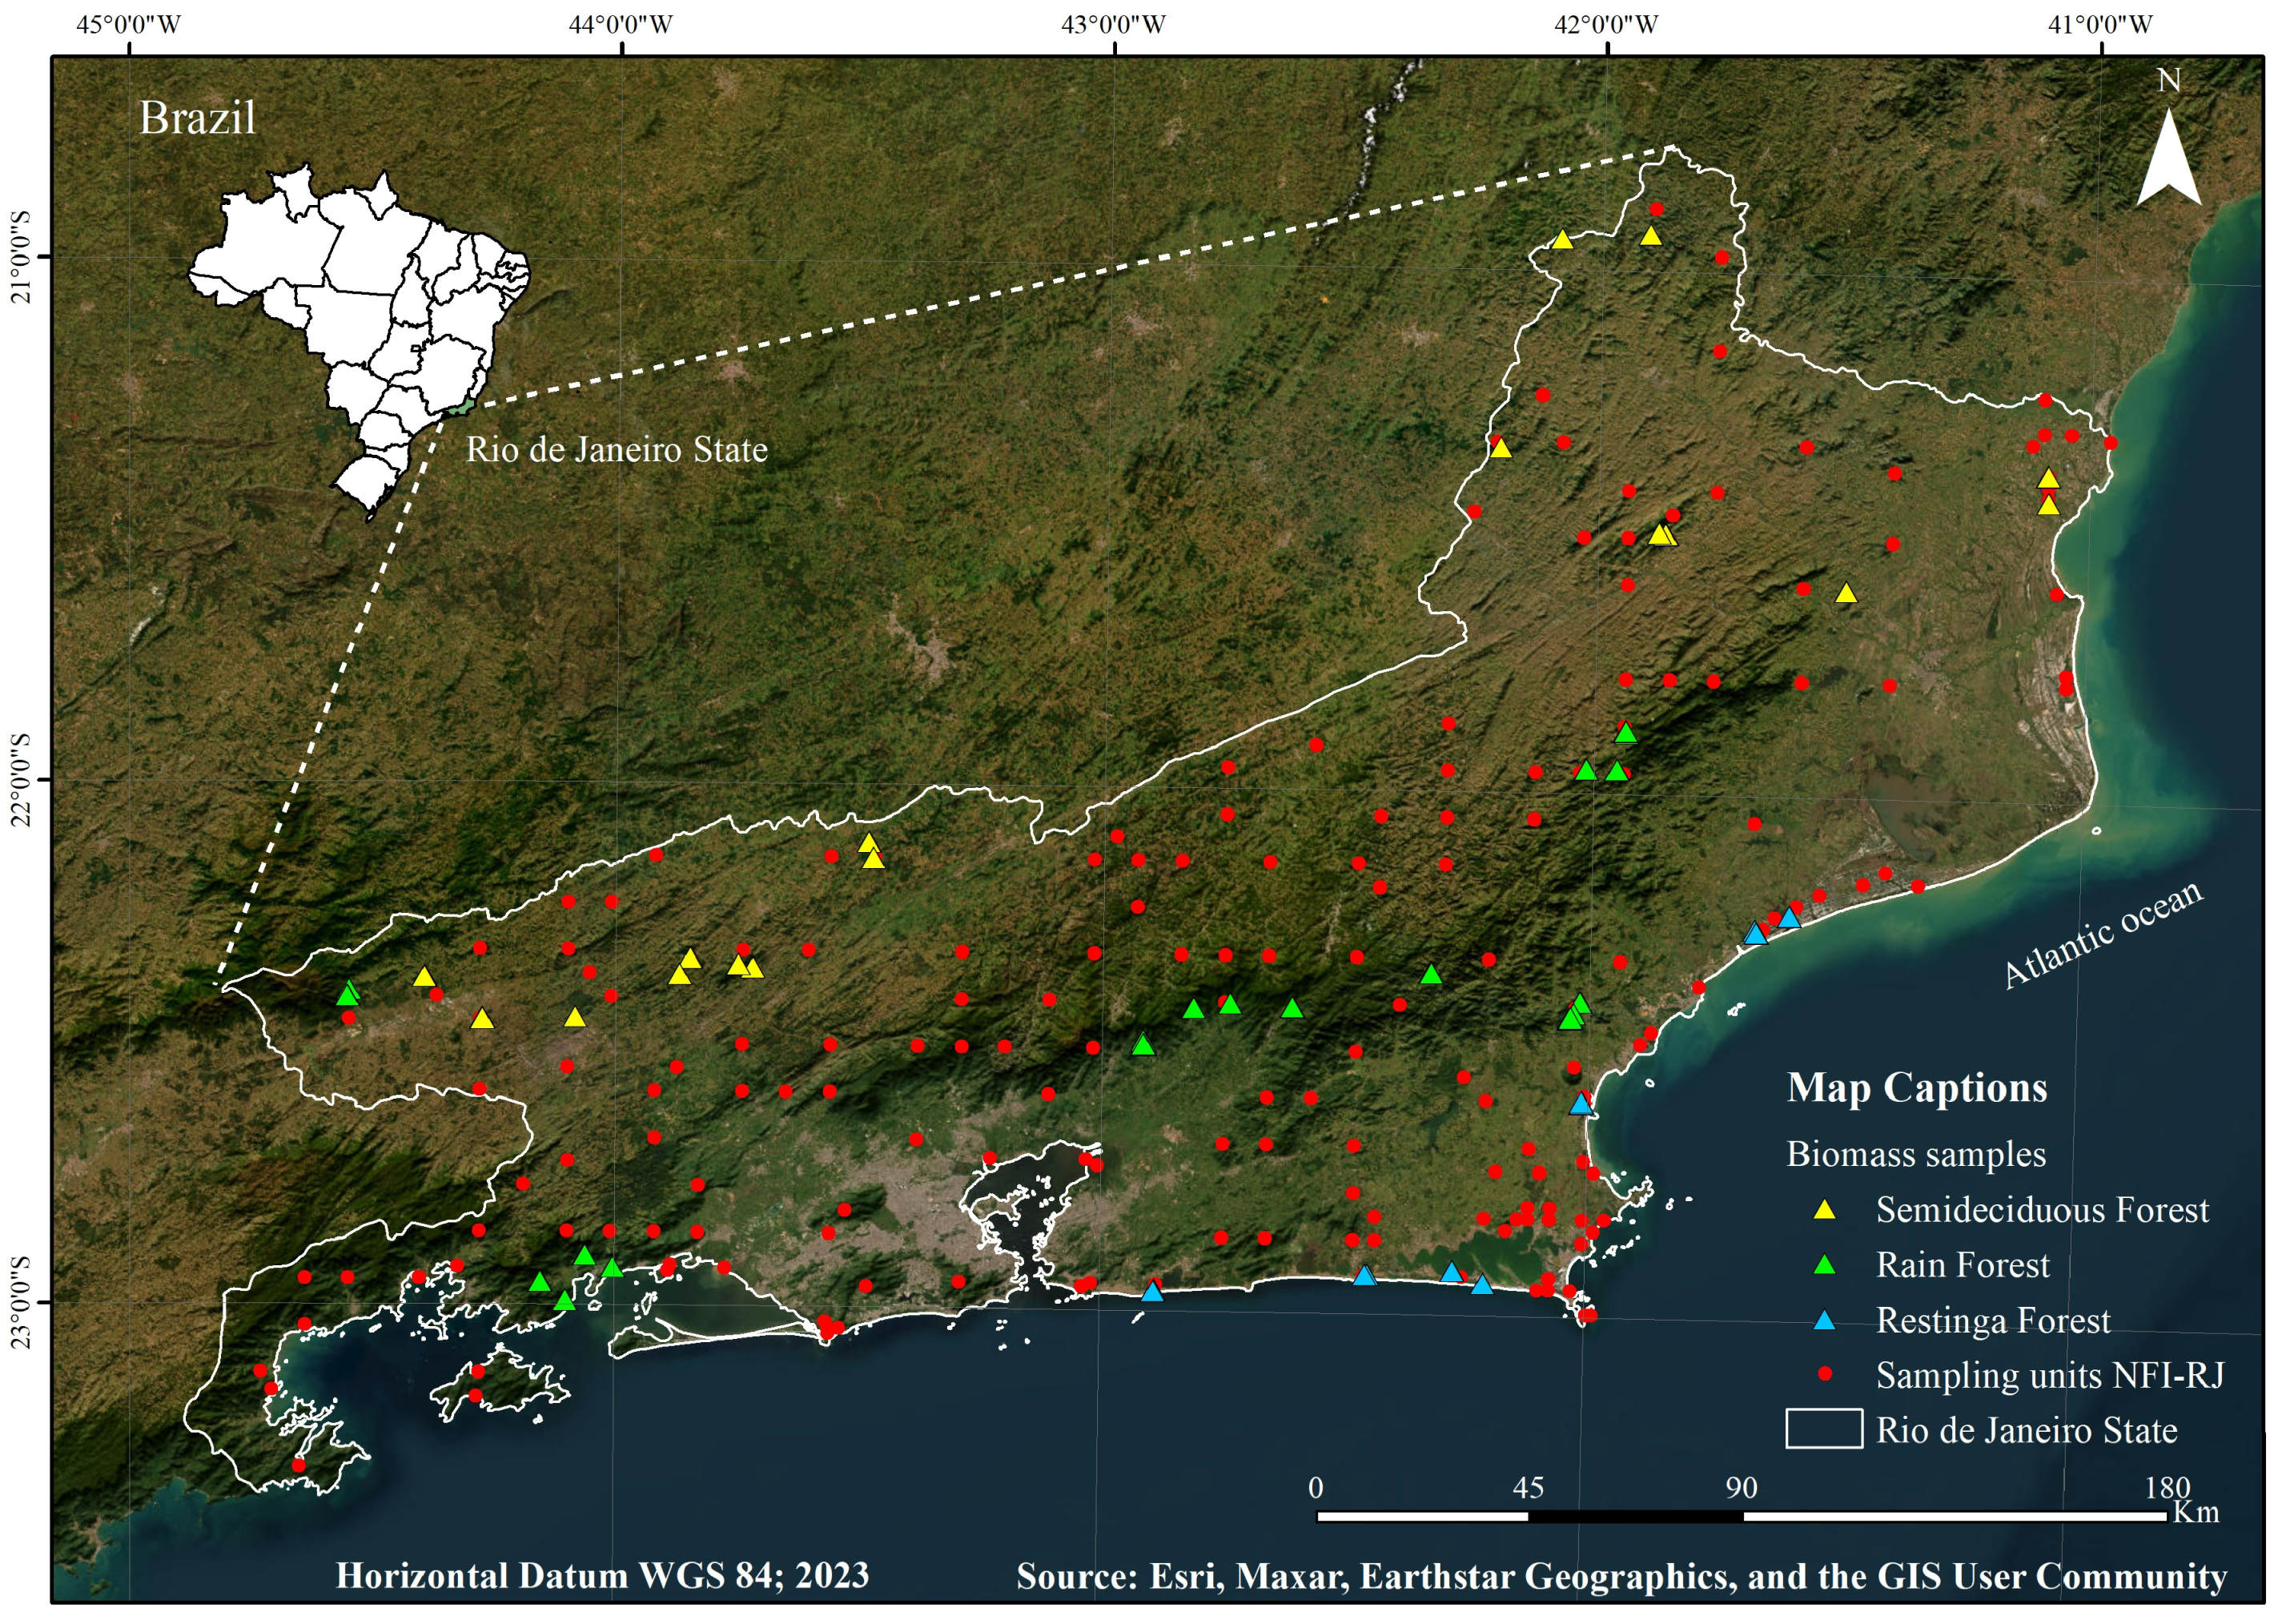
2.1. Study Area

This study was conducted in the Rio de Janeiro state (Brazil), which has a total area of 43,782 km2 and is completely within the Atlantic Forest Domain (AFD) [6]. To develop the allometric equations, we selected the three main forest types in the state: Rainforest (RAF), Semideciduous Forest (SF), and Restinga Forest (RF), which correspond to approximately 69%, 27%, and 2% of the state’s native vegetation remanences [21]. These forest types occur under different environmental conditions at altitudes that vary between 5 and 900 m above sea level. According to the Köppen climate classification, the climates vary from tropical (Af, Am, and Aw) to humid subtropical (Cfa, Cfb, Cwa, and Cwb), with a predominance of ‘tropical with dry winter’ (Aw) and ‘subtropical with hot summer’ (Cwa) climates [23]. The mean annual temperature varies between 12 and 24 °C, and the mean annual precipitation is between 1000 and 2000 mm [23]. The main geological formations in the state are associated with acidic rocks like granites, gneisses, and migmatites [24]. The weathering of these rocks or the degradation of their sediments results in Acrisols, Latosols, and Cambisols, which are commonly found throughout the state [24]. Soils were classified following the 2018 Brazilian Soil Classification System [25] and are equivalent to the World Reference Base for Soil Resources [26].

2.2. Experimental Design

To optimize the spatial distribution of sample trees for biomass determination, we selected 28 sampling sites in the main RAF, SF, and RF fragments in the state (Figure 1). These strategic sampling sites for biomass data collection were selected based on information obtained from the National Forest Inventory conducted in Rio de Janeiro state (NFI-RJ), including species composition, vegetation type classification, conservation state, accessibility to the fragment, and logistical support. Our inventory data to estimate carbon stocks included 185 widely distributed permanent plots (sampling unities) within forest cover from the NFI-RJ (Figure 1). To generate the location map, the ArcgisTM software (version 10.1, ESRI, Redlands, CA, USA) was used.

2.3. Sampling for the Biomass Equation Fitting

To fit the biomass equations, we selected the most abundant species of each forest type (RAF, SF, and RF) as defined by a preliminary analysis of the NFI-RJ data. Tree selection for biomass determination followed the negative exponential distribution, which commonly describes the diameter distribution of tropical and subtropical forest trees. In short, we collected for each species a higher number of samples from smaller diameter classes and a lower number of samples from larger diameter classes.
Botanical samples were collected from all trees and sent for identification and registration in the RBR Herbarium in the Department of Botany of the Federal Rural University of Rio de Janeiro. Wood samples measured for biomass determination were collected from 172 trees (61 species, 50 genera, and 24 plant families). From the total sample, 78 trees belonged to RAF, 57 to SF, and 37 to RF. The species were classified following the Angiosperm Phylogeny Group system [27] and the updated nomenclature was cross-checked in the Flora e Funga do Brasil database [28].

2.4. Non-Destructive Wood Volume Determination

A non-destructive method was used to climb trees and obtain wood volume without cutting the trees down. We employed tree climbing techniques with suitable equipment and telescopic ladders that were 8 m in height (Supplementary Information Figure S1; Figure 2), which did not cause any damage to the tree. From all sample trees, the following measurements were taken: diameter at breast height (DBH, measured 1.3 m above ground level), total tree height (Ht), stem height (Hs), and diameters along the stem (Di, at heights 0.3, 0.5, 1.0, 1.3, 2.0 m, and every 1.0 m until the last section of the stem). The diameters were obtained with a measuring tape and stem height with a self-retracting tape measure. Stem height was defined as the vertical length from the tree’s base to the point where significant branching begins, indicating the start of the crown.
Tree crowns with varying architectures were also measured. Each branch was individually measured in 1-m sections until reaching a diameter of 5 cm. Beyond this point, the sections were considered as twigs. This minimum diameter value was determined for the sake of climbers’ safety. Stem and branch volumes were obtained with Smalian’s formula [29]. The sum of the section volumes (i.e., stem and crown) yielded the total volume of the tree.

2.5. Basic Wood Density and Carbon Content

To determine the basic wood density (WD) of the measured trees, we collected three wood samples at different heights in the tree (two from the stem and one from a branch) using a non-destructive method (Figure 2). From the trunk, we removed two wood cores from the bark to the pith with a 5-mm diameter wood increment corer (Haglöf Sweden, Långsele, Sweden). The first core was taken at breast height (BH, 1.3 m above the ground), and the second at mid-stem height (MSH). If a tree’s reduced diameter did not allow for sample retrieval at MSH, the cores were taken at stem-base height (SBH, 50 cm above the ground) (Figure 2). The samples were collected at MSH using climbing techniques that were harmless to the trees (Supplementary Information—SI, Figure S1). The retrieval of stem wood cores was performed, whenever possible, in the North/South direction. To control post-collection damage to the tree, the wound was treated with Bordeaux mixture, and the hole caused by the extraction was sealed with a wooden cylinder and beeswax. Wood samples were also collected from thick branches (minimum 5 cm in diameter) to measure WD from the tree crowns (Figure 2).
The WD of each sample tree was obtained by averaging the three wood samples collected at different heights. The samples were sent to the Wood Quality Laboratory of the Federal University of Espírito Santo (UFES) for WD determination. Wood saturated volume was determined by immersing the samples in water, while wood dry mass was obtained with a precision scale after oven-drying the samples at 103 °C. The WD of each species was obtained by averaging all WD values sampled from that species with the formula: WD = Bd/Vs. Here, WD stands for basic wood density (g cm−3), Bd for dry biomass (g), and Vs for saturated volume (cm3). The carbon content was indirectly estimated by applying the conversion factor of 0.49 [30].

2.6. Sampling for Biomass Estimation (Forest Inventory)

To estimate the biomass stocks of Rio de Janeiro state, we used NFI-RJ data collected in sampling units located in natural forest areas (Figure 2). Each sampling unit was composed of four subunits of 20 × 50 m, subdivided into 10 subplots of 10 × 10 m [21]. These subunits were arranged in a cross shape pointing to the four cardinal directions (North, South, East, and West) and distanced 50 m from a central point. To sample the tree layer, the DBH, Ht, and Hs of all individuals with a DBH ≥ 10 cm were recorded. In each sampling unit, at least one botanical voucher was collected from each recorded species. The plants were identified by a team of taxonomists from the Rio de Janeiro Botanic Garden—JBRJ.
The estimates of above-ground forest biomass for the Rio de Janeiro state were obtained with data from 185 sampling units (51.6 ha of sampled area): 68 sampling units in the RAF (19.1 ha), 63 in SF (16.8 ha), 22 in RF (7.1 ha), 19 in Mangrove Forests (MF, 5.7 ha), and 13 in Deciduous Forest (DF, 3.4 ha). Although each sampling unit had a fixed area of 4000 m2, many had to be partially sampled due to natural and anthropogenic conditions, such as rock outcrops and deforested portions of land. Using the field-based land cover classification of each 10 m × 10 m sub-plot, we recalculated the area effectively captured in the sampling units and their subunits. Non-sampled areas due to impediments or lack of forest cover were excluded from the total quantification. Hence, the fixed-size inventory subunits (20 m × 50 m = 1000 m2) had effective sampling areas that varied between 100 and 1000 m2.

2.7. Data Analysis

2.7.1. Allometric Equation Fitting

By integrating total wood volume and basic wood density, we obtained the total dry mass for each sampled tree (Figure 2). Non-linear regression models were fitted to estimate total above-ground biomass with DBH and Ht as predictor variables. We tested non-linear models drawn from classic forest science studies (Table 1) [31,32], including single-predictor (with DBH) and two-predictor regressions (with DBH and Ht). We fitted specific equations for estimating above-ground biomass in each forest type (RAF, SF, and RF) and a local-generic equation for the state’s entire forest cover. These analyses were performed in R v. 4.3.2 [33].
The model fits were assessed using graphical and statistical criteria [37,38], namely, the Coefficient of Determination, which was calculated by correlating real and estimated values following Equation (1); the Relative Standard Error of the estimate following Equation (2), which indicates estimate precision; the Akaike Information Criterion following Equation (3), which guides model selection based on information content [39]; and the graphical analysis of residuals. Residual analysis remains crucial in regression model selection, even when other statistical criteria are inconclusive [40].
The assumptions of regression analyses were confirmed for all fitted equations. We assessed residual homoscedasticity through a score test for non-constant error variance by applying the Breusch-Pagan test using the ncvTest function, which indicated a heteroscedastic distribution of residuals. To resolve this, we used the Generalised Least Squares (GLS) model, a power variance function structure (varPower) that allows for modeling unequal variances. Applying a variance function is a common practice in representing the variance structure of errors within groups, where we used an exponential parameter as a covariate, whose estimate was obtained through an iterative process. The transformation did not alter the observed patterns in the distribution and dispersion of dendrometric variables among the forest types. We assessed the significance of the regression coefficients (βi) with a t-test (α = 0.01). These analyses were performed in R v. 4.3.2 [33] using the car, caret, ds, nlme, and ggplot packages.
R y y = x x ¯ y y ¯ x x ¯ 2 y y ¯ 2
S y x   % = i = 1 n y i y i ^ 2 n p y ¯ × 100
A I C = 2 log   ( L v ) + 2 v + 1 + 1
where yi = observed value; y i ^ = value estimated by the model; n = number of observations; p = number of model coefficients; y ¯ = mean of observed values of the dependent variable; L v = maximum likelihood function of the model, and v = number of explanatory variables included in the model.

2.7.2. Biomass Stock Estimates

The biomass stock of the forest cover in Rio de Janeiro state was estimated with data from 185 sampling units from the NFI-RJ. Due to variation in the area sampled by the sampling units, we analyzed the data using the ratio estimates method [41] recommended for the NFI analyses by the Brazilian Forest Service (SFB). The biomass estimates were obtained for the entire set of sampling units and considered only trees with DBH ≥ 10 cm. The estimates aimed for an acceptable error of 10% of the mean with a 90% confidence level.
To estimate the state’s aboveground biomass stocks, we applied the forest-specific allometric equations to the main forest types and the local-generic equation (fitted to the whole dataset) to the entire forest cover. As there were no fitted equations available for Mangrove Forest (MF) and Deciduous Forest (DF), we opted to apply the local-generic equation to these forest types, which account for less than 2% of the forest cover in Rio de Janeiro state.
For comparison purposes, the pantropical allometric equation proposed by Chave et al. (2014) was also applied [12]. This equation is widely employed in studies examining above-ground biomass stocks in tropical forests and uses species-level WD and tree-level DBH and Ht as predictor variables. To apply this equation, we used the WD values collected directly in the field for 85 species of Rio de Janeiro’s Atlantic Forest. For the remaining species recorded in the inventory, WD values were drawn from online repositories [42,43]. Only data from South America were selected from these databases.
We obtained species-level WD for 32.8% of the individuals, genus-level WD for 38.4% of the individuals (the mean of all species within the genus with available WD data), and family-level WD for 23% of the individuals (the mean of all species within the family with available WD data). In the few cases where no WD value could be assigned to the species (6%, represented exclusively by the dead, unidentified individuals), the average wood density value for the set of species belonging to the same sampling unit was adopted.

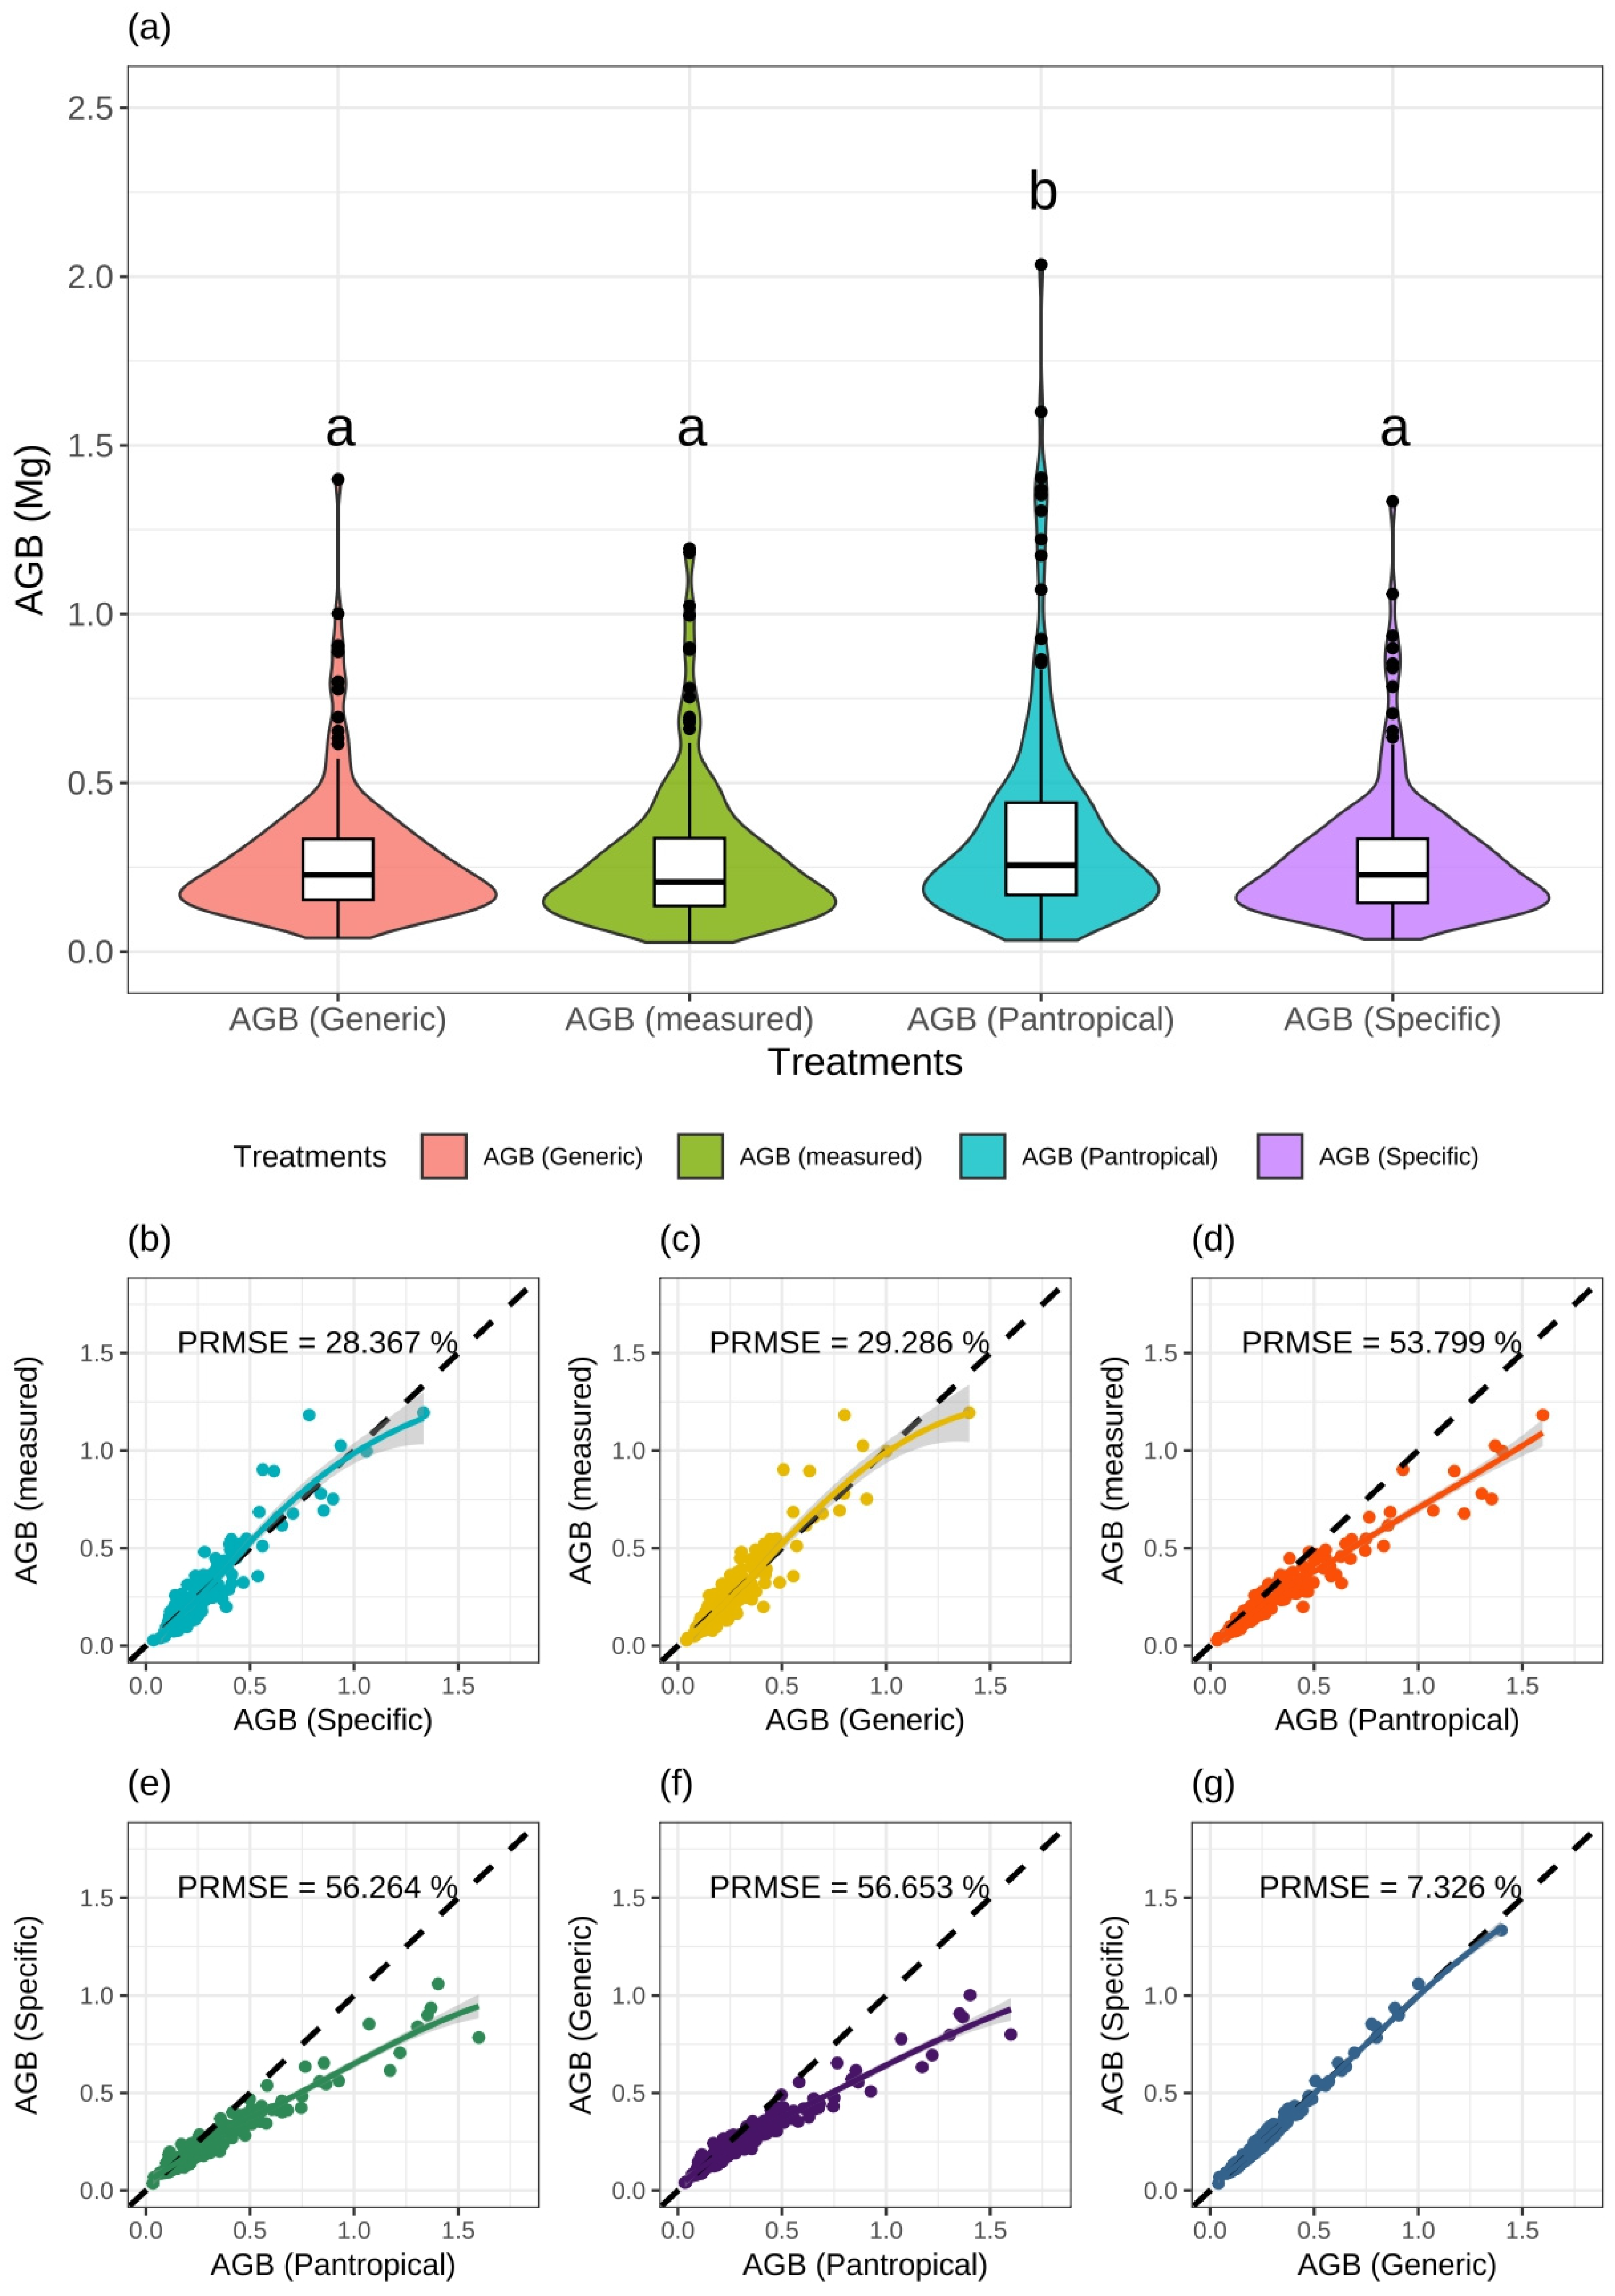
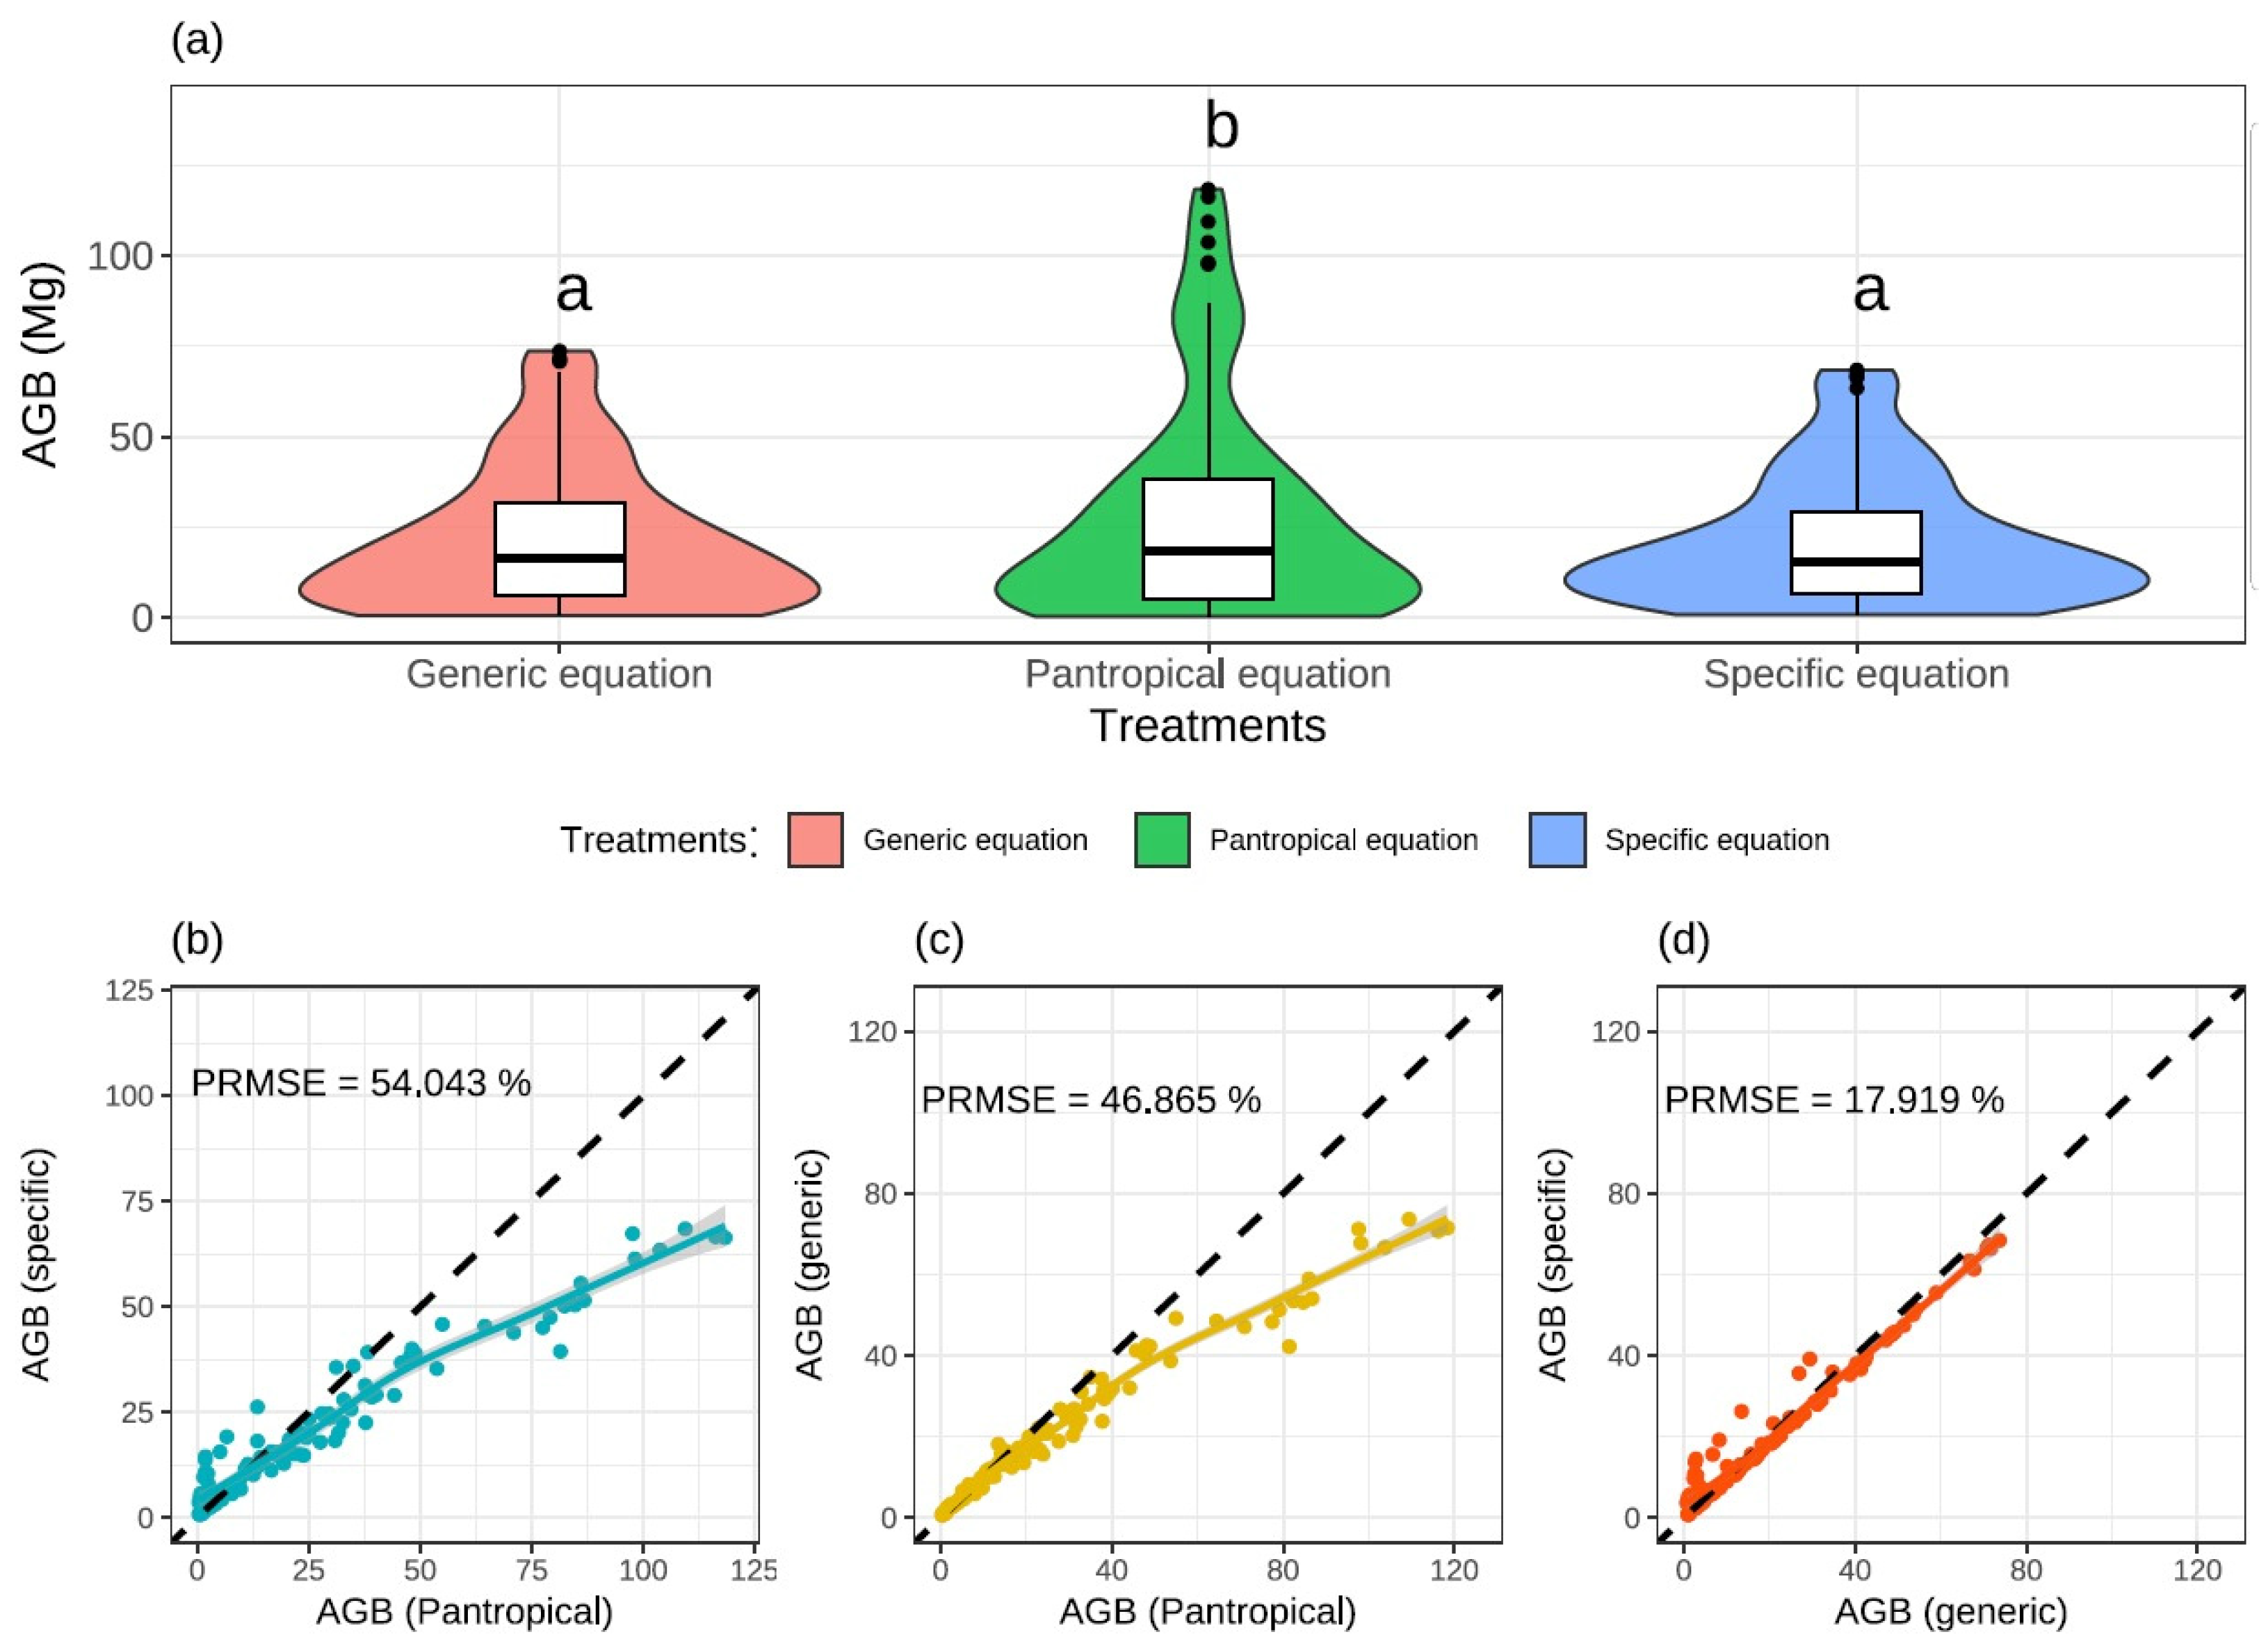
2.7.3. Model Validation and Hypothesis Testing

The selected models were validated through a cross-validation analysis following the k-fold approach [44], implemented in the R package caret. In this process, the data were divided into 10 subsets (folds) for training, and one-fold at a time was set aside for testing the database while the model was refitted n times (Figure 2). For each training subset, the model was refitted, and statistical parameters such as precision and accuracy, coefficient of determination, mean absolute error (MAE), and root mean square error (RMSE) were obtained. The averages of these metrics were used to validate the models.
To compare precision and efficiency between pantropical, local-generic, and forest-specific equations, the variations in the percentage of root mean square value (PRMSE) and coefficients of determination were calculated for each fit. The selected equations were compared in three situations: (1) local-generic equation against forest-specific equations, (2) local-generic equation against the pantropical-generic equation [12], and (3) forest-specific equations against the pantropical-generic equation. These comparisons were performed considering only the three main vegetation types in the state (RAF, SF, and RF), for which specific equations were developed to estimate above-ground biomass.
Additionally, to compare the estimates yielded by the three types of equation (forest-specific, local-generic, and pantropical) with the observed biomass values (α = 0.01), we applied an equivalence test (regression-based TOST using bootstrap). This has been widely used to compare means or similarities between estimates and actual observations [45,46]. It stands out as the most appropriate method for evaluating a model [45] or verifying statistical equivalence between estimates of a variable obtained through two different assessment methods.
The equivalence test evaluated individual tree biomass and involved multiple steps: (a) calculated the difference between the field-obtained biomass mean and the values estimated using the equations; (b) established equivalence regions for regression parameters, with (I) I0 = y ± 25% for the intercept and (II) I1 = 1.0 ± 25% for the slope; (c) performed a non-parametric bootstrap with 1000 replications to determine confidence intervals around observed means, checking if predictions were within the equivalence region at a significance level of 0.05; (d) fitted a linear regression between estimated and field-obtained actual biomass; (e) tested equality for the intercept by calculating confidence intervals for the parameter, comparing it with the estimated equivalence region; (f) similarly tested equality for the slope by calculating the one-sided confidence interval, comparing it with the estimated equivalence region; and (g) accepted or rejected the dissimilarity hypothesis based on tests for the regression intercept and slope.
Following the same methodology, the equivalence test was also applied to compare the estimates generated for each forest type by the three types of equation (forest-specific, local-generic, and pantropical). This was only carried out for the three main forest types for which specific biomass equations were fitted (RAF, SF, and RF). Other forest types, such as MF and DF, were excluded from this analysis for occurring in less than 2% of the state’s total area.

3. Results

3.1. Model Fitting and Selection

The fitted models showed precision in the estimates (low Syx%) and high correlation between observed and predicted values (high Ryy), with significant regression coefficients (α ≤ 0.01) for most evaluated datasets (Table 2). Overall, the models that included both diameter and height as predictors, showed the best model-fitting statistics, underscoring the importance of total tree height (Ht) in above-ground biomass estimation. However, the non-linear Husch model with diameter as the single predictor (Model 1) also yielded satisfactory fits, especially for Semideciduous Forests (SFs) (Table 2). Due to the difficulties and costs involved in measuring tree height in the field, these single-predictor equations, based solely on diameter, may prove valuable for obtaining estimates of above-ground biomass.
The non-linear Schumacher and Hall model (Model 3) provided the best fit for the total dataset and all forest types. Compared to the other tested models, Model 3 produced the lowest standard errors of the estimate (Syx%), the highest coefficients of determination (Ryy), and the lowest AIC values (Table 2). However, despite Model 3 showing the best statistical results for the Restinga Forest (RF), the regression coefficients were not significant, which hinders the utility of this model. For this forest type, the B0 coefficient of the single-predictor Husch model (Model 1) was also not significant. Therefore, due to its good fit and appropriate residual distribution (Table 2), the Spurr model (Model 2) was chosen to estimate biomass in RF.
Graphical analysis of the residuals revealed non-constant error variance, indicating heteroscedasticity trends (Supplementary Information Figures S2–S5). All fitted models exhibited this behavior, which was stronger for the RAF and the total dataset. Outliers were also observed, likely due to the presence of atypical data points in the sample, indicating an inadequate fit of the models for one or more observations. The RF, which contained a smaller dataset, showed more evenly distributed residuals (Supplementary Information Figure S5). Despite the issues detected, the graphical analysis of residuals reinforces the non-linear Schumacher and Hall model (Model 3) as the most adequate to estimate biomass in RAF, SF, and the entire dataset, while the Spurr model (Model 2) was the most adequate for the RF.
The specific equations fitted for the three forest types were more precise (lower Syx%) than the local-generic equation, which was fitted for the entire dataset (Table 2). However, the hypothesis tests (regression-based TOST) did not reveal significant differences (p-value > 0.01) between the observed values (measured on-site) and those obtained by either the forest-specific or the local-generic equations (Figure 3; Supplementary Information Table S1). Hence, the forest-specific and local-generic equations produced statistically similar biomass estimates. Conversely, the pantropical equation yielded estimates that were significantly different from the observed values (measured on-site) and those generated by forest-specific and local-generic equations (Figure 3; Supplementary Information Table S1).

3.2. Estimates of the Biomass and Carbon Stocks

Although the forest-specific models showed higher precision in estimating biomass stocks than the local-generic model, they were statistically similar. Both types of equation exhibited good fit and precision in the biomass estimates (Table 3 and Table 4). The difference in precision, as indicated by the sampling error, was approximately 1%; while the forest-specific equations generated a sampling error of 7.67%, that number was 8.74% for the local-generic equation.
The average above-ground biomass stocks per hectare, estimated by forest type and for the entire Atlantic Forest cover in Rio de Janeiro state using forest-specific allometric equations, was 70.7 Mg ha−1 (±5.4 Mg ha−1), with a sampling error of 7.67% (Table 3). This corresponds to approximately 35.4 Mg ha−1 (±2.7 Mg ha−1) of stored carbon. Considering the overall forest cover in Rio de Janeiro state (approximately 1,410,568 ha), the specific equations indicate that the total above-ground biomass stored in the state is 99.8 Tg (±7.6 Tg), corresponding to 49.9 Tg (±3.8 Tg) of stored carbon.
The local-generic equation estimated a similar (although inferior) biomass stock to the forest-specific equations. With a sampling error of 8.74%, it estimated 67.5 Mg ha−1 (±5.9 Mg ha−1) of biomass (Table 4), which corresponds to 33.8 Mg ha−1 (±2.9 Mg ha−1) of carbon stock. Compared to the estimates produced by the forest-specific equations, the local-generic equation also underestimated the biomass and carbon stocks in SF and RF. Conversely, the RAF estimate obtained using the local-generic equation was higher than that obtained using the RAF-specific equation.
The biomass stored in RAF was greater than in any other forest type. The RAF-specific equation estimated its above-ground biomass stock at 85.5 Mg ha−1 (±10.0 Mg ha−1), corresponding to 41.3 Mg ha−1 (±5.1 Mg ha−1) of carbon, while the local-generic equation estimated 92.4 Mg ha−1 (±10.0 Mg ha−1) of biomass and, accordingly, 46.8 Mg ha−1 (±5.0 Mg ha−1) of carbon. According to the forest-specific equations, the vegetation types in Rio de Janeiro’s Atlantic Forest with the lowest biomass stocks per hectare are DF (32.8 ± 9.4 Mg ha−1) and RF (48.7 ± 11.7 Mg ha−1).
The estimates generated with the pantropical equation [12] for comparison purposes further highlighted the greater precision of the forest-specific equations (Table 5). The average biomass per hectare quantified for the total dataset using the pantropical equation was 79 Mg ha−1 (±9.3 Mg ha−1), which was greater than the estimate produced by the forest-specific equations. The total biomass stock estimated in the state with the pantropical equation had a sampling error of 11.81%, compared to 7.67% obtained with the specific equations. The pantropical equation, widely used to estimate above-ground biomass in tropical forests, tended to overestimate the biomass stocks contained in the Atlantic Forest of Rio de Janeiro state by 11.7%.
The hypothesis tests revealed no significant differences (p-value > 0.01) between the biomass estimates produced with forest-specific equations and those produced with the local-generic equation for 185 field-sampled plots with a total of 25,357 trees (Figure 4; Supplementary Information Table S2). In other words, the forest-specific equations and the local-generic equation provided statistically similar estimates. Consequently, we rejected hypothesis H1, asserting the superior precision of forest-specific equations over the local-generic equation, while accepting hypothesis H2, stating that both types of equation (forest-specific and local-generic) produce more accurate estimates compared to those obtained with the pantropical equation.

4. Discussion

Our results showed that the specific allometric equations fitted for the three main Atlantic Forest vegetation types and the local-generic equation, fitted for the entire dataset, demonstrated good fits and generated statistically similar estimates (Figure 3, Supplementary Information Table S1). Thus, our hypothesis H1 that forest-specific equations would outperform the local-generic equation was rejected, highlighting the possibility of generalizing estimates using a single locally produced equation. Conversely, the estimates generated by the pantropical equation [12] differed significantly from those produced with the equations presented in this study, supporting our hypothesis H2. More specifically, the locally developed equations generated more precise and accurate estimates than the pantropical alternative (Figure 3 and Figure 4; Supplementary Information Tables S1 and S2). Although it was based on a global dataset of field-measured trees in 58 locations encompassing broad variation in climate and vegetation types (4004 trees with stem diameter ≥ 5 cm), the pantropical equation overestimated the local biomass stock by 11.7%, emphasizing the need for locally fitted equations for more consistent biomass and carbon estimates. Indeed, the choice of allometric equation represents one of the main bottlenecks for accurately estimating biomass and carbon in a specific forest area. In particular, the use of non-conservative allometric equations can overestimate biomass stocks by up to 30% [22].
Although statistically similar, the forest-specific equations slightly improved the biomass estimates and showed greater precision than the local-generic equation. This was demonstrated by the specific equations’ higher coefficients of determination (Ryy) and lower relative standard errors of the estimate (Syx%). Compared to the specific equations, the local-generic equation overestimated by 8% and underestimated by 12.7% and 43% the biomass stocks of the Rainforest (RAF), the Semideciduous Forest (SF), and the Restinga Forest (RF), respectively. The standard error of the biomass estimate obtained with the local-generic equation for the RF was about 40%, indicating low estimate precision, in comparison with the 24% error obtained with the specific equations. Despite these differences, our results highlight that the forest-specific equations and the local-generic equation can be used to obtain precise estimates of above-ground biomass stored in the forest cover of Rio de Janeiro state. Because the local-generic equation was fitted using data from the three main vegetation types in Rio de Janeiro’s Atlantic Forest (RAF, SF, and RF) [17], their biomass variability could be integrated into the final model. Thus, the use of specific equations is recommended for typical RAF, SF, and RF forests, especially if located in other Atlantic Forest sites outside Rio de Janeiro.
Differences in structure and species composition reported for the RAF and SF forest types [47,48] translate into their biomass stocks. On average, the RAF had a biomass stock 10% greater than that estimated for the SF. At the same time, both showed much greater biomass values than other vegetation types of Rio de Janeiro’s Atlantic Forest, such as the Deciduous Forest (DF), the Restinga Forest (RF), and the Mangrove Forest (MF). For instance, the biomass stocks estimated for the RAF and SF were, respectively, 43% and 36% greater than that estimated for the RF. While the RAF occurs in humid environments with favorable conditions for tree growth and typically contains larger trees with a greater above-ground biomass stock, the RF occurs on sandy coastal plains with low soil fertility subject to frequent inundations, which impose environmental constraints on tree growth [49].
The average biomass stocks estimated with the specific equations for RAF and SF (85.5 Mg ha−1 and 76.4 Mg ha−1) were lower than those found in other Atlantic Forest regions. For example, in Santa Catarina state, Atlantic Forest biomass estimates were 38% higher for the RAF (117.7 Mg ha−1) and 14% higher for the SF (86.9 Mg ha−1) [50]. In Minas Gerais state, Atlantic Forest biomass estimates were 58% higher for the RAF (135.3 Mg ha−1) and 35% higher for the SF (102.9 Mg ha−1) [8]. Even when considering a comparable area encompassing the entirety of the forested regions in Rio de Janeiro, calculations using Atlantic Forest equations tailored for Minas Gerais, a neighboring state under distinct environmental conditions, a recent study yielded estimates of 91 tons per hectare [21]. This figure is approximately 28% higher than our estimates derived from our locally developed equations. These differences reinforce the need to develop local equations to accurately capture biomass variation among Atlantic Forest fragments and could be an indication of the secondary successional status of Rio de Janeiro’s forests. Secondary forests are characterized by fast-growing, short-lived, and low-wood-density trees, which result in lower carbon stocks per unit area [51]. Although the carbon reserves of secondary forests are lower compared to mature forests, their rapid growth rates enhance their carbon absorption potential [52,53], making them important carbon sinks [51]. However, they are also more susceptible to natural and anthropogenic disturbances like windstorms and fires [54]. Thus, despite their lower biomass stock, secondary forests are more susceptible to extreme events and have an important role in climate change mitigation, which highlights their conservation need. In addition to avoiding further deforestation and promoting sustainable forest management, fostering secondary forest regeneration provides a low-cost carbon sequestration mechanism with multiple benefits for biodiversity and ecosystem services [52].
The average above-ground biomass stock in Rio de Janeiro’s forests was estimated at 70.7 ± 5.4 Mg ha−1 using specific allometric equations. Compared to our estimate, the widely used pantropical equation proposed by Chave et al. (2014) [12] overestimated biomass stocks by 11.7%. It is important to state that, similarly, our local equations can be expected to generate uncertainties in different forest types or even in the same forest type under completely distinct environmental conditions; thus, it should be applied with caution. Our observed uncertainties could be attributed to the equation being fitted to a large dataset that included primary forests of the Amazon Rainforest Domain. Models fitted with Amazon data using only diameter at breast height (DBH) as a predictor variable are likely to overestimate the biomass of Atlantic Forest trees because, on average, for a given DBH, Amazon trees tend to be taller than those in the Atlantic Forest [55]. Including total tree height (Ht) and wood density (WD) as predictor variables in addition to DBH in the pantropical model improves the precision of the estimates [56,57] and enables broader applicability, including a better fit to environmental variation. At the same time, however, including these variables as predictors in the model also produces uncertainty in the biomass estimates.
Because tree height is difficult to measure and often estimated visually in forest inventories, including it in allometric models is not recommended [58]. However, tree height is also an important component in describing tree shape and improving biomass estimates [17], which led us to include it as a predictor. Similarly, including wood density can produce uncertainty in biomass estimation due to its high geographical, within-species, and even within-tree variability along vertical and radial axes [59,60]. It is important to highlight the caveats and limitations of the present study, and we can list a few that may have influenced our analysis and interpretations. First, we assumed that measured biomass was accurate, although it has not been measured through a widely used destructive method. This methodology was adapted and developed as an alternative to destructive methods due to the current highly threatened status of the Atlantic Forest. Field-measured dry biomass of the trees sampled in this study, used as a response variable for fitting the equations, was obtained through a non-destructive method by multiplying rigorously measured tree volume by scaling standing trees, and average wood density was collected at different tree heights. To assess the uncertainty associated with this non-destructive approach, we suggest that future studies collect these data through a destructive method that allows the sample trees to be felled and weighed in licensed areas for vegetation removal. Second, our AGB estimates focused on three main vegetation types in the Atlantic Forest. Additional sampling within the less represented forest types, such as the particularly challenging mangrove ecosystems and deciduous forests within small and highly fragments, is likely needed to expand our work.
For the entire forest cover of Rio de Janeiro state (43,782 km2), the specific equations estimated an above-ground biomass stock of 99.8 ± 7.6 Tg and a carbon stock of 49.9 ± 3.8 Tg. We highlight that these values correspond to only a portion of the entire carbon stock in the state and the Atlantic Forest Domain. Although live above-ground biomass is mainly contained in trees, carbon is also stored in other forest compartments, such as in roots, necromass, litter, and soil organic matter. Moreover, the carbon stored in other land cover types, including anthropogenic land uses such as pastures, agricultural land, and planted forests, should also be considered for a more comprehensive estimate. For example, in the state of Acre (160,000 km2), located in the Amazon Forest Domain, the above-ground biomass stock was estimated at 3.6 ± 0.8 Pg, including anthropogenic land uses [61]. These authors found that, although they occupy 14% of the state’s area, anthropogenic land uses contribute only 6% of the state’s total carbon stock.
The allometric equations fitted in this study to estimate above-ground biomass are pioneering in the state of Rio de Janeiro and are some of the few developed for the Atlantic Forest Domain. We suggest that these equations serve as a baseline for the implementation of public policies toward the conservation of ecosystem services and the reduction of CO2 emissions. For example, public policies that monitor aboveground carbon stocks and removals within the state. In the future, carbon monitoring, reporting, and verification (MRV) protocols will become increasingly reliant on remote sensing techniques, but their calibration will still depend on the precision of ground-based carbon storage estimates [62,63,64,65], and our study can largely contribute to that. In this regard, we recommend that other local and specific equations for other Atlantic Forest vegetation types be developed to improve the precision of biomass and carbon stock estimates on regional and global scales.
These results are particularly important given the current strategies targeting forest conservation and local climate change mitigation. The choice of allometric equation is one of the most important sources of imprecision in biomass estimation [22]; hence, the equations presented in this study can aid in improving the quality of these estimates. Projects conducted in regions with low data availability can use ill-suited allometric equations, resulting in less robust estimates of above-ground biomass [66]. Given the growing pressures from real estate speculation and associated infrastructure enterprises in Rio de Janeiro state, these locally developed equations are recommended for environmental licensing projects. This application would not only quantify the wood volume to be removed but also the corresponding carbon stock, providing a baseline for competent environmental authorities to demand compensatory measures for these emissions.
Moreover, given the growing number of Payment for Ecosystem Services programs [67,68,69] and the expansion of the voluntary carbon market, the equations developed in this study can be potentially relevant to improve the accuracy of these estimates. Generic allometric equations yield estimates around 15.4% higher than the average obtained with better-fitted and conservative equations [22]. Therefore, the fact that compensation for forest conservation in the voluntary carbon market is directly proportional to the amount of stored carbon emphasizes the importance of choosing locally produced and more conservative equations. This choice improves the accuracy of credit issuance calculations and avoids over-crediting risks that affect carbon credit performance.

5. Conclusions

Our results highlight the better performance of local-specific allometric equations in providing precise estimates for aboveground biomass stocks. Locally developed equations proved to be more accurate than widely used pantropical equation, which were found to yield non-conservative biomass estimates. This finding underscores the need of considering the specific characteristics of each region and forest type when modeling biomass, particularly in highly diverse ecosystems such as the Atlantic Forest. Further, these results have important implications for the formulation of public policies aimed at mitigating CO2 emissions, offering robust scientific support for more effective conservation and forest management strategies.

Supplementary Materials

The following supporting information can be downloaded at: https://www.mdpi.com/article/10.3390/f15091568/s1, Figure S1: Non-destructive climbing method for tree measurements. (A): tree stem measurements with ladder; (B): tree stem measurements with climbing equipment; (C): tree crown measurements with climbing equipment; (D): adapted method with two measurers for large trees.; Figure S2: Graphical analysis of percentage residuals (a1, a2, a3), correlations between observed and predicted above-ground biomass values (b1, b2, b3), and frequency histogram of the relative errors (c1, c2, c3) produced by the models of Husch (a1, b1, c1), Spurr (a2, b2, c2), and Schumacher and Hall (a3, b3, c3) based on the total dataset to estimate the total above-ground biomass in the Atlantic Forest cover of Rio de Janeiro state, Brazil.; Figure S3: Graphical analysis of percentage residuals (a1, a2, a3), correlations between observed and predicted above-ground biomass values (b1, b2, b3), and frequency histogram of the relative errors (c1, c2, c3) produced by the models of Husch (a1, b1, c1), Spurr (a2, b2, c2), and Schumacher and Hall (a3, b3, c3) to estimate the total above-ground biomass of Rainforests in Rio de Janeiro state, Brazil.; Figure S4: Graphical analysis of percentage residuals (a1, a2, a3), correlations between observed and predicted above-ground biomass values (b1, b2, b3), and frequency histogram of the relative errors (c1, c2, c3) produced by the models of Husch (a1, b1, c1), Spurr (a2, b2, c2), and Schumacher and Hall (a3, b3, c3) to estimate the total above-ground biomass of Semideciduous Forests in Rio de Janeiro state, Brazil.; Figure S5: Graphical analysis of percentage residuals (a1, a2, a3), correlations between observed and predicted above-ground biomass values (b1, b2, b3), and frequency histogram of the relative errors (c1, c2, c3) produced by the models of Husch (a1, b1, c1), Spurr (a2, b2, c2), and Schumacher and Hall (a3, b3, c3) to estimate the total above-ground biomass of Restinga Forests in Rio de Janeiro state, Brazil. Table S1: Results for equivalence test (regression-based TOST using bootstrap) for comparing means or similarities between field-measured biomass and the estimates produced by the forest-specific, local-generic, and pantropical equations. The analyses were based on biomass samples taken from 172 trees measured on-site.; Table S2: Results for equivalence test (regression-based TOST using bootstrap) to compare means or similarities between the estimates generated by the forest-specific, local-generic, and pantropical equations. The analyses were based on field-measured biomass samples from 185 plots.; Table S3: Summary of the statistical results for biomass samples taken from 172 trees measured on site.

Author Contributions

T.D.G., V.C.C. and E.P.M. designed the study. T.D.G., V.C.C., J.H.C.P. and G.B.V. collected data. T.D.G., F.C.d.S., V.C.C., H.J.d.S., D.C.d.C. and T.B.S.F. conducted data analyses and wrote the manuscript. All authors have read and agreed to the published version of the manuscript.

Funding

This research was funded by the Carbon Clima Rio Program, with support from Fundação Flora de Apoio à Botânica, and the scholarship provided by the National Council for Scientific and Technological Development (CNPq).

Data Availability Statement

The raw data supporting the conclusions of this article will be made available by the authors on request.

Acknowledgments

I would like to acknowledge the National Council for Scientific and Technological Development (CNPq) for the provided scholarship. Special thanks to the Fundação Flora de Apoio a Botânica for their support in the execution of the Carbon Clima Rio Program. I extend my appreciation to the Secretaria de Estado do Ambiente e Sustentabilidade (SEAS-RJ) and the Brazilian Forest Service for providing the data from the National Forest Inventory of the State of Rio de Janeiro.

Conflicts of Interest

Author Fernanda Coelho de Souza was employed by the company BeZero Carbon. The remaining authors declare that the research was conducted in the absence of any commercial or financial relationships that could be construed as a potential conflict of interest.

References

  1. Beer, C.; Reichstein, M.; Tomelleri, E.; Ciais, P.; Jung, M.; Carvalhais, N.; Rödenbeck, C.; Arain, M.A.; Baldocchi, D.; Bonan, G.B.; et al. Terrestrial Gross Carbon Dioxide Uptake: Global Distribution and Covariation with Climate. Science 2010, 329, 834–838. [Google Scholar] [CrossRef] [PubMed]
  2. Malhi, Y.; Wright, J. Spatial patterns and recent trends in the climate of tropical rainforest regions. R. Soc. 2004, 359, 311–329. [Google Scholar] [CrossRef] [PubMed]
  3. SOS MATA ATLÂNTICA; INPE. Atlas dos Remanescentes Florestais da Mata Atlântica Período 2019–2020. Fundação SOS Mata Atlântica and INPE: São Paulo, Brazil, 2021; p. 73. Available online: https://cms.sosma.org.br/wp-content/uploads/2021/05/SOSMA_Atlas-da-Mata-Atlantica_2019-2020.pdf (accessed on 13 December 2023).
  4. Lima, R.A.F.; Oliveira, A.A.; Pitta, G.R.; Gasper, A.L.; Vibrans, A.C.; Chave, J.; ter Steege, H.; Prado, P.I. The erosion of biodiversity and biomass in the Atlantic Forest biodiversity hotspot. Nat. Commun. 2020, 11, 6347. [Google Scholar] [CrossRef] [PubMed]
  5. Metzger, J.P.; Martensen, A.C.; Dixo, M.; Bernacci, L.C.; Ribeiro, M.C.; Teixeira, A.M.G.; Pardini, R. Time-lag in biological responses to landscape changes in a highly dynamic Atlantic forest region. Biol. Conserv. 2009, 142, 1166–1177. [Google Scholar] [CrossRef]
  6. Morrone, J.J.; Escalante, T.; Rodríguez-Tapia, G.; Carmona, A.; Arana, M.; Mercado-Gómez, J.D. Biogeographic regionalization of the Neotropical region: New map and shapefile. An. Acad. Bras. Ciências 2022, 94, e20211167. [Google Scholar] [CrossRef]
  7. Myers, N.; Mittermeier, R.A.; Mittermeier, C.G.; Fonseca, G.A.B.; Kent, J. Biodiversity hotspots for conservation priorities. Nature 2000, 403, 853–858. [Google Scholar] [CrossRef]
  8. Scolforo, J.R.; Oliveira, A.D.; Acerbi-Júnior, F.W. Inventário Florestal de Minas Gerais: Equações de Volume, peso de Matéria seca e Carbono para Diferentes Fisionomias da Flora Nativa, 1st ed.; Editora UFLA: Lavras, Brazil, 2008; p. 216. [Google Scholar]
  9. Souza, A.L.; Boina, A.; Soares, C.P.B.; Vital, B.R.; Gaspar, R.O.; Lana, J.M. Estrutura fitossociológica, estoques de volume, biomassa, carbono e dióxido de carbono em Floresta Estacional Semidecidual. Rev. Árvore 2012, 36, 169–179. [Google Scholar] [CrossRef]
  10. Figueiredo, L.T.M.; Soares, C.P.B.; Sousa, A.L.; Leite, H.G.; Silva, G.F. Dinâmica do estoque de carbono em fuste de árvores de uma Floresta Estacional Semidecidual. Cerne 2015, 21, 161–167. [Google Scholar] [CrossRef]
  11. Vibrans, A.C.; Moser, P.; Oliveira, L.Z.; Maçaneiro, J.P. Generic and specific stem volume models for three subtropical forest types in southern Brazil. Ann. For. Sci. 2015, 72, 865–874. [Google Scholar] [CrossRef]
  12. Chave, J.; Réjou-Méchain, M.; Búrquez, A.; Chidumayo, E.; Colgan, M.S.; Delitti, W.B.C.; Duque, A.; Eid, T.; Fearnside, P.M.; Goodman, R.C.; et al. Improved allometric models to estimate the aboveground biomass of tropical trees. Glob. Chang. Biol. 2014, 20, 3177–3190. [Google Scholar] [CrossRef]
  13. Souza, C.R.; Azevedo, C.P.; Rossi, L.M.B.; Silva, K.E.; Santos, J.; Higuchi, N. Dynamics and carbon storage in primary forest in the region of Manaus/AM. Acta Amazon. 2012, 42, 501–506. [Google Scholar] [CrossRef]
  14. Nogueira, E.M.; Yanai, A.M.; Fonseca, F.O.R.; Fearnside, P.M. Carbon stock loss from deforestation through 2013 in Brazilian Amazonia. Glob. Chang. Biol. 2015, 21, 1271–1292. [Google Scholar] [CrossRef] [PubMed]
  15. Silva, K.E.; Souza, C.R.; Azevedo, C.P.; Rossi, L.M.B. Dinâmica florestal, estoque de carbono e fitossociologia de uma floresta densa de terra-firme na Amazônia Central. Sci. For. 2015, 43, 193–201. [Google Scholar]
  16. Marra, D.M.; Higuchi, N.; Trumbore, S.E.; Ribeiro, G.H.P.M.; Santos, J.; Carneiro, V.M.C.; Lima, A.J.N.; Chambers, J.Q.; Negrón-Juárez, R.I.; Holzwarth, F.; et al. Predicting biomass of hyperdiverse and structurally complex central Amazonian forests—A virtual approach using extensive field data. Biogeosciences 2016, 13, 1553–1570. [Google Scholar] [CrossRef]
  17. Cysneiros, V.C.; Gaui, T.D.; Filho, T.B.S.; Pelissari, A.L.; Machado, S.A.; Carvalho, D.C.; Moura, T.A.; Amorim, H.B. Tree volume modeling for forest types in the Atlantic Forest: Generic and specific models. iForest 2020, 13, 417–425. [Google Scholar] [CrossRef]
  18. Vieira, S.A.; Alves, L.F.; Aidar, M.; Araújo, L.S.; Baker, T.; Batista, J.L.F.; Campos, M.C.; Camargo, P.B.; Chave, J.; Delitti, W.B.C.; et al. Estimation of biomass and carbon stocks: The case of the Atlantic Forest. Biota Neotrop. 2008, 8, 21–29. [Google Scholar] [CrossRef]
  19. Colmanetti, M.A.A.; Weiskittel, A.; Scolforo, H.F.; Sotomayor, J.F.M.; Couto, H.T.Z. Calibrating individual tree biomass models for contrasting tropical species at an uneven-aged site in the native Atlantic Forest of Brazil: A direct comparison of alternative approaches, sample sizes, and sample selection methods. For. Ecol. Manag. 2020, 473, 118306. [Google Scholar] [CrossRef]
  20. Vorster, A.G.; Evangelista, P.H.; Stovall, A.E.L.; Ex, S. Variability and uncertainty in forest biomass estimates from the tree to landscape scale: The role of allometric equations. Carbon Balance Manag. 2020, 15, 8. [Google Scholar] [CrossRef] [PubMed]
  21. SFB—Serviço Florestal Brasileiro. Inventário Florestal Nacional: Principais Resultados: Rio de Janeiro, 1st ed.; MMA: Brasília, Brazil, 2018; p. 83. Available online: https://snif.florestal.gov.br/images/pdf/publicacoes/periodo_eleitoral/publicacoes_ifn/relatorios/IFN_RJ_2018_periodo_eleitoral.pdf (accessed on 13 January 2024).
  22. Haya, B.K.; Alford-Jones, K.; Anderegg, W.R.L.; Beymer-Farris, B.; Blanchard, L.; Bomfim, B.; Chin, D.; Evans, S.; Hogan, M.; Holm, J.A.; et al. Quality Assessment of REDD+ Carbon Credit Projects; Berkeley Public Policy: Berkeley, CA, USA, 2023; p. 12. Available online: https://gspp.berkeley.edu/assets/uploads/page/Quality-Assessment-of-REDD+-Carbon-Crediting-EXECUTIVE-SUMMARY.pdf (accessed on 10 January 2024).
  23. Alvares, C.A.; Stape, J.L.; Sentelhas, P.C.; Gonçalves, J.L.; Sparovek, G. Köppen’s climate classification map for Brazil. Meteorol. Z. 2013, 22, 711–728. [Google Scholar] [CrossRef]
  24. Pereira, M.G.; Anjos, L.H.C.; Neto, E.C.S.; Junior, C.R.P. Solos do Rio de Janeiro: Gênese, Classificação e Limitações ao Uso Agrícola, 1st ed.; Atena: Ponta Grossa, Brazil, 2023; p. 231. [Google Scholar] [CrossRef]
  25. Santos, H.G.; Jacomine, P.K.T.; Anjos, L.H.C.; Oliveira, V.A.; Lumbreras, J.F.; Coelho, M.R.; Almeida, J.A.; Araujo Filho, J.C.; Oliveira, J.B.; Cunha, T.J.F. Sistema Brasileiro de Classificação de Solos, 5th ed.; Embrapa: Brasília, Brazil, 2018; p. 356. Available online: https://www.agroapi.cnptia.embrapa.br/portal/assets/docs/SiBCS-2018-ISBN-9788570358004.pdf (accessed on 13 January 2024).
  26. IUSS—International Union of Soil Sciences Working Group WRB. World Reference Base for Soil Resources: International Soil Classification System for Naming Soils and Creating Legends for Soil Maps, 4th ed.; International Union of Soil Sciences: Vienna, Austria, 2022; p. 236. Available online: https://www.isric.org/sites/default/files/WRB_fourth_edition_2022-12-18.pdf (accessed on 13 January 2024).
  27. APG IV. An update of the Angiosperm Phylogeny Group classification for the orders and families of flowering plants: APG IV. Bot. J. Linn. Soc. 2016, 181, 1–20. [Google Scholar] [CrossRef]
  28. REFLORA—Flora e Funga do Brasil. Available online: http://floradobrasil.jbrj.gov.br/ (accessed on 1 June 2024).
  29. Avery, T.E.; Burkhart, H.E. Forest Measurements, 5th ed.; Waveland Press: Long Grove, IL, USA, 2015; p. 456. [Google Scholar]
  30. IPCC—Intergovernmental Panel on Climate Change. Climate Change 2007: Climate Change Impacts, Adaption and Vulnerability, 1st ed.; Cambridge University Press: New York, NY, USA, 2007; p. 976. Available online: https://www.ipcc.ch/site/assets/uploads/2018/03/ar4_wg2_full_report.pdf (accessed on 10 January 2024).
  31. Clutter, J.; Fortson, J.C.; Pienaar, L.V.; Brister, G.H.; Bailey, R.L. Timber Management: A Quantitative Approach, 1st ed.; John Wiley and Sons: New York, NY, USA, 1983; p. 333. [Google Scholar]
  32. Loetsch, F.; Zöhrer, F.; Haller, K.E. Forest Inventory, 2nd ed.; BLV Verlagsgesellschaft: Munich, Germany, 1973; p. 469. [Google Scholar]
  33. R Core Team. Available online: http://www.R-project.org (accessed on 3 December 2023).
  34. Husch, B.; Beers, T.W.; Kershaw, J.A., Jr. Forest Mensuration, 4th ed.; John Wiley and Sons, Inc.: Hoboken, NJ, USA, 2003; p. 443. [Google Scholar]
  35. Spurr, S.H. Forestry Inventory, 1st ed.; Ronald Press: New York, NY, USA, 1952; p. 476. [Google Scholar]
  36. Schumacher, F.; Hall, F. Logarithmic expression of timber-tree volume. J. Agric. Res. 1933, 47, 719–734. [Google Scholar]
  37. Sileshi, G.W. A critical review of forest biomass estimation models, common mistakes and corrective measures. For. Ecol. Manag. 2014, 329, 237–254. [Google Scholar] [CrossRef]
  38. Aabeyir, R.; Adu-Bredu, S.; Agyare, W.A.; Weir, M.J.C. Allometric models for estimating aboveground biomass in the tropical woodlands of Ghana, West Africa. For. Ecosyst. 2020, 7, 41. [Google Scholar] [CrossRef]
  39. Li, Y.; Deng, X.; Huang, Z.; Xiang, W.; Yan, W.; Lei, P.; Zhou, X.; Peng, C. Development and evaluation of models for the relationship between tree height and diameter at breast height for Chinese-fir plantations in Subtropical China. PLoS ONE 2015, 10, e0125118. [Google Scholar] [CrossRef]
  40. Draper, N.R.; Smith, H. Applied Regression Analysis, 3rd ed.; John Wiley and Sons: New York, NY, USA, 1998; p. 736. [Google Scholar] [CrossRef]
  41. Queiroz, W.T. Amostragem em Inventário Florestal, 1st ed.; Edufra: Belém, Brazil, 2012; p. 441. [Google Scholar]
  42. Chave, J.; Coomes, D.; Jansen, S.; Lewis, S.L.; Swenson, N.G.; Zanne, A.E. Towards a worldwide wood economics spectrum. Ecol. Lett. 2009, 12, 351–366. [Google Scholar] [CrossRef] [PubMed]
  43. Zanne, A.E.; Lopez-Gonzalez, G.; Coomes, D.A.; Ilic, J.; Jansen, S.; Lewis, S.L.; Miller, R.B.; Swenson, N.G.; Wiemann, M.C.; Chave, J. Data from: Global Wood Density Database. Dryad Digit. Repos. 2009. Available online: https://doi.org/10.5061/dryad.234 (accessed on 6 December 2023).
  44. Kuhn, M. Building Predictive Models in R Using the caret Package. J. Stat. Softw. 2008, 5, 1–26. [Google Scholar] [CrossRef]
  45. Robinson, A.P.; Duursma, R.A.; Marshall, J.D. A regression-based equivalence test for model validation: Shifting the burden of proof. Tree Physiol. 2005, 25, 903–913. [Google Scholar] [CrossRef] [PubMed]
  46. Weiskittel, A.R.; Hann, D.W.; Kershaw, J.A.; Vanclay, J.K. Forest Growth and Yield Modeling, 1st ed.; John Wiley and Sons: New York, NY, USA, 2011; p. 432. [Google Scholar] [CrossRef]
  47. Oliveira-Filho, A.T.; Fontes, M.A.L. Patterns of Floristic Differentiation among Atlantic Forests in Southeastern Brazil and the Influence of Climate. Biotropica 2000, 32, 793–810. [Google Scholar] [CrossRef]
  48. Scarano, F.R. Structure, Function and Floristic Relationships of Plant Communities in Stressful Habitats Marginal to the Brazilian Atlantic Rainforest. Ann. Bot. 2002, 90, 517–524. [Google Scholar] [CrossRef]
  49. Assis, M.A.; Prata, B.E.M.; Pedroni, F. Florestas de restinga e de terras baixas na planície costeira do sudeste do Brasil: Vegetação e heterogeneidade ambiental. Biota Neotrop. 2011, 11, 103–121. [Google Scholar] [CrossRef]
  50. Vibrans, A.C.; Oliveira, L.Z.; Gasper, A.L.; Lingner, D.V.; Schorn, L.A.; Silva, D.A. Unprecedented large-area turnover estimates for the subtropical Brazilian Atlantic Forest based on systematically-gathered data. For. Ecol. Manag. 2022, 505, 119902. [Google Scholar] [CrossRef]
  51. Chave, J.; Piponiot, C.; Maréchaux, I.; Foresta, H.; Larpin, D.; Fischer, F.J.; Derroire, G.; Vincent, G.; Hérault, B. Slow rate of secondary forest carbon accumulation in the Guianas compared with the rest of the Neotropics. Ecol. Appl. 2020, 30, e02004. [Google Scholar] [CrossRef] [PubMed]
  52. Chazdon, R.L.; Broadbent, E.N.; Rozendaal, D.M.A.; Bongers, F.; Zambrano, A.M.A.; Aide, T.M.; Balvanera, P.; Becknell, J.M.; Boukili, V.; Brancalion, P.H.S.; et al. Carbon sequestration potential of second-growth forest regeneration in the Latin American tropics. Sci. Adv. 2016, 2, e1501639. [Google Scholar] [CrossRef] [PubMed]
  53. Poorter, L.; Bongers, F.; Aide, T.; Zambrano, A.M.A.; Balvanera, P.; Becknell, J.M.; Boukili, V.; Brancalion, P.H.S.; Broadbent, E.N.; Chazdon, R.L.; et al. Biomass resilience of Neotropical secondary forests. Nature 2016, 530, 211–214. [Google Scholar] [CrossRef] [PubMed]
  54. Brando, P.M.; Balch, J.K.; Nepstad, D.C.; Morton, D.C.; Putz, F.E.; Coe, M.T.; Silvério, D.; Macedo, M.N.; Davidson, E.A.; Nóbrega, C.C.; et al. Abrupt increases in Amazonian tree mortality due to drought–fire interactions. Proc. Natl. Acad. Sci. USA 2014, 111, 6347–6352. [Google Scholar] [CrossRef] [PubMed]
  55. Scaranello, M.A.S.; Alves, L.F.; Vieira, S.A.; Camargo, P.B.; Joly, C.A.; Martinelli, L.A. Height-diameter relationships of tropical Atlantic moist forest trees in southeastern Brazil. Sci. Agric. 2012, 69, 26–37. [Google Scholar] [CrossRef]
  56. Chave, J.; Andalo, C.; Brown, S.; Cairns, M.A.; Chambers, J.Q.; Eamus, D.; Fölster, H.; Fromard, F.; Higuchi, N.; Kira, T.; et al. Tree allometry and improved estimation of carbon stocks and balance in tropical forests. Oecologia 2005, 145, 87–99. [Google Scholar] [CrossRef]
  57. Feldpausch, T.R.; Lloyd, J.; Lewis, S.L.; Brienen, R.J.W.; Gloor, M.; Mendoza, A.M.; Lopez-Gonzalez, G.; Banin, L.; Salim, K.A.; Affum-Baffoe, K.; et al. Tree height integrated into pantropical forest biomass estimates. Biogeosciences 2012, 9, 3381–3403. [Google Scholar] [CrossRef]
  58. Hunter, M.O.; Keller, M.; Victoria, D.; Morton, D.C. Tree height and tropical forest biomass estimation. Biogeosciences 2013, 10, 8385–8399. [Google Scholar] [CrossRef]
  59. Fearnside, P.M. Wood density for estimating forest biomass in Brazilian Amazonia. For. Ecol. Manag. 1997, 90, 59–87. [Google Scholar] [CrossRef]
  60. Minini, D.; Silva, J.G.M.; Paula, R.R.; Rocha, S.M.G.; Filho, T.B.S.; Gaui, T.D.; Dias, H.M.; Nabais, C.; Vidaurre, G.B. Insights about wood density in Atlantic Forest ecosystems: Spatial variability and alternative measurement. Can. J. For. Res. 2022, 52, 1212–1223. [Google Scholar] [CrossRef]
  61. Salimon, C.I.; Putz, F.E.; Menezes-Filho, L.; Anderson, A.; Silveira, M.; Brown, I.F.; Oliveira, L.C. Estimating state-wide biomass carbon stocks for a REDD plan in Acre, Brazil. For. Ecol. Manag. 2011, 262, 555–560. [Google Scholar] [CrossRef]
  62. Asner, G.P.; Powell, G.V.N.; Mascaro, J.; Knapp, D.E.; Clark, J.K.; Jacobson, J.; Kennedy-Bowdoin, T.; Balaji, A.; Paez-Acosta, G.; Victoria, E.; et al. High-resolution forest carbon stocks and emissions in the Amazon. Proc. Natl. Acad. Sci. USA 2010, 107, 16738–16742. [Google Scholar] [CrossRef] [PubMed]
  63. Saatchi, S.S.; Harris, N.L.; Brown, S.; Lefsky, M.; Mitchard, E.T.A.; Salas, W.; Zutta, B.R.; Buermann, W.; Lewis, S.L.; Hagen, S.; et al. Benchmark map of forest carbon stocks in tropical regions across three continents. Proc. Natl. Acad. Sci. USA 2011, 108, 9899–9904. [Google Scholar] [CrossRef] [PubMed]
  64. Baccini, A.; Goetz, S.J.; Walker, W.S.; Laporte, N.T.; Sun, M.; Sulla-Menashe, D.; Hackler, J.; Beck, P.S.A.; Dubayah, R.; Friedl, M.A.; et al. Estimated carbon dioxide emissions from tropical deforestation improved by carbon-density maps. Nat. Clim. Chang. 2012, 2, 182–185. [Google Scholar] [CrossRef]
  65. Clark, D.B.; Kellner, J.R. Tropical forest biomass estimation and the fallacy of misplaced concreteness. J. Veg. Sci. 2012, 23, 1191–1196. [Google Scholar] [CrossRef]
  66. Yuen, J.Q.; Fung, T.; Ziegler, A.D. Review of allometric equations for major land covers in SE Asia: Uncertainty and implications for above- and below-ground carbon estimates. For. Ecol. Manag. 2016, 360, 323–340. [Google Scholar] [CrossRef]
  67. Ruggiero, P.G.C.; Metzger, J.P.; Tambosi, L.R.; Nichols, E. Payment for ecosystem services programs in the Brazilian Atlantic Forest: Effective but not enough. Land Use Policy 2019, 82, 283–291. [Google Scholar] [CrossRef]
  68. Mamedes, I.; Guerra, A.; Rodrigues, D.B.B.; Garcia, L.C.; Godoi, R.F.; Oliveira, P.T.S. Brazilian payment for environmental services programs emphasize water-related services. Int. Soil Water Conserv. Res. 2023, 11, 276–289. [Google Scholar] [CrossRef]
  69. Mota, P.K.; Costa, A.M.; Prado, R.B.; Fernandes, L.F.S.; Pissarra, T.C.T.; Pacheco, F.A.L. Payment for Environmental Services: A critical review of schemes, concepts, and practice in Brazil. Sci. Total Environ. 2023, 899, 165639. [Google Scholar] [CrossRef]
Figure 1. Geographic location of the sites where data were collected. Triangles represent sites where aboveground biomass data were collected: Rainforest (RAF; green triangles), Semideciduous Forest (SF; yellow triangles), and Restinga Forest (RF; blue triangles), in the Atlantic Forest of Rio de Janeiro state (Brazil). Circles represent sampling units of the National Forest Inventory conducted in Rio de Janeiro (NFI-RJ; red dots). Data from the NFI-RJ were used to plan the biomass sampling design and estimate the total above-ground biomass stocks of the state’s forest cover.
Forests 15 01568 g001
Figure 2. Conceptual diagram summarizing (a) data collection, (b) model selection and validation, and (c) biomass estimation for the entire Rio de Janeiro state. DBH = diameter at breast height, MSH = mid-stem height, AGB = predicted aboveground biomass (Mg), Ht = total tree height (m), RAF = Rainforest, SF = Semideciduous Forest, RF = Restinga Forest.
Forests 15 01568 g002
Figure 3. Equivalence test (regression-based TOST using Bootstrap) for comparing means or similarities between field-measured biomass and the estimates produced by the forest-specific, local-generic, and pantropical equations. The analyses were based on biomass samples taken from 172 trees measured on site: (a) Distribution of AGB values across the different equations for measured trees on site. There were no significant differences (p-value > 0.01) between the observed values (measured on site) and those obtained using either local-generic equations or the forest-specific, though there was a significant difference when compared to values based on pantropical equation. The letters “a” and “b” represent the statistically significant difference between the treatments. (b) Relationship between AGB estimated based on specific equation per forest types and measured AGB. (c) Relationship between AGB estimated from the generic equation and measured AGB. (d) Relationship between AGB estimated from the pantropical equation and measured AGB. (e) Relationship between AGB estimated from pantropical equation and AGB estimated based on specific equation per forest types. (f) Relationship between AGB estimated from pantropical equation and AGB estimated from a generic equation for all forest types. (g) Relationship between AGB estimated from generic equation for all forest types and AGB estimated based on specific equation per forest types. RMSEs are expressed as the percentage of mean square value (PRMSE).
Forests 15 01568 g003
Figure 4. Equivalence test (regression-based TOST using Bootstrap) to compare means or similarities between the estimates generated by the forest-specific, local-generic, and pantropical equations. The analyses were based on field-measured biomass samples from 185 plots. (a) Distribution of AGB values across the different equations: Generic equation for all forest types, pantropical equation, and specific allometric equation for all forest types. Both AGBs estimated based on generic and specific per-forest types were significantly different for the pantropical equation. The letters “a” and “b” represent the statistically significant difference between the treatments. (b) Relationship between AGB estimated from the pantropical equation and AGB estimates based on specific equation per forest type. (c) Relationship between AGB estimated from the pantropical equation and AGB estimates from the generic equation. (d) AGB estimates from the generic equation and AGB estimates based on the specific equation per forest type. RMSEs are expressed as the percentage of mean square value (PRMSE).
Forests 15 01568 g004
Table 1. Single-predictor and two-predictor non-linear models tested to estimate the above-ground biomass of sampled trees in the Atlantic Forest of Rio de Janeiro state, Brazil.
Model Number AuthorMathematical ModelInput Variables
1Husch [34]y = β0 dβ1 + εiSingle (dbh)
2Spurr [35]y = β0 + β 1 . (d2 .h) + εiMultiple (dbh, Ht)
3Schumacher e Hall [36]y = β 0 dβ1 . hβ2 + εi
y, response variable; d, diameter at breast height (cm) measured 1.3 m above the ground; h, stem height or total height (m); β0, β1, and β2, regression coefficients; εi, associated error.
Table 2. Fitting and precision statistical parameters of the models tested to estimate above-ground biomass in the main Atlantic Forest vegetation types and the overall forest cover in Rio de Janeiro state.
EquationModelB0B1B2Syx%RyyAICVarPower
General15.45 × 10−41.9435 30.840.92−3921.8148
20.07361.74 × 10−5 29.780.92−3781.4865
32 × 10−41.5190.825127.650.92−4262.2998
RAF17.2 × 10−41.8586 33.270.89−1641.7630
20.07871.63 × 10−5 31.850.91−1651.4508
31.52 × 10−41.4650.962729.730.91−1842.2274
SF14.61 × 10−42.0109 24.710.93−1381.3700
20.08341.85 × 10−5 25.270.96−1261.2381
33 × 10−41.69540.505923.350.95−1401.6086
RF14.76 × 10−41.928 25.310.83−1422.3081
20.051.83 × 10−5 25.210.80−1301.2925
30.00041.58960.458024.220.82−1372.3529
B0, B1, and B2, regression coefficients (non-significant coefficients shown underscored); Syx%, relative standard error of the estimate; Ryy, coefficient of determination; AIC, Akaike Information Criterion; SF, Semideciduous Forest; RAF, Rainforest; RF, Restinga Forest. The best models are highlighted in bold. Non-significant coefficients are underlined.
Table 3. Estimates and associated statistics of the above-ground biomass of each vegetation type and the entire Atlantic Forest cover of Rio de Janeiro state produced with specific allometric equations fitted for the state’s main vegetation types and data from the National Forest Inventory collected in Rio de Janeiro (NFI-RJ).
Vegetation TypeArea (ha)UAsBiomass (Mg ha−1)CI (Mg ha−1)CV (%)Sampling Error (%)
DF5868.41332.8±9.416.028.55
SF452,922.56376.4±8.46.6311.06
RAF895,278.86885.5±10.07.0211.71
MF18,936.61953.0±10.211.1019.25
RF37,561.32248.7±11.713.9624.02
TOTAL1,410,567.618570.7±5.44.647.67
UAs, sampling units; CI, confidence interval; CV, coefficient of variation; DF, Deciduous Forest; SF, Semideciduous Forest; RAF, Rainforests; MF, Mangrove Forest; RF, Restinga Forest.
Table 4. Estimates and associated statistics of the above-ground biomass of each vegetation type and the entire Atlantic Forest cover of Rio de Janeiro state produced with a generic allometric equation fitted for the state’s total forest cover and data from the National Forest Inventory collected in Rio de Janeiro (NFI-RJ).
Vegetation TypeArea (ha)UAsBiomass (Mg ha−1)CI (Mg ha−1)CV (%)Sampling Error (%)
DF5868.41332.8±9.416.0228.55
SF452,922.56366.7±7.97.1511.93
RAF895,278.86892.4±10.66.8611.44
MF18,936.61953.0±10.211.1019.25
RF37,561.32227.7±10.822.8439.29
TOTAL1,410,567.618567.5±5.95.298.74
UAs, sampling units; CI, confidence interval; CV, coefficient of variation; DF, Deciduous Forest; SF, Semideciduous Forest; RAF, Rainforests; MF, Mangrove Forest; RF, Restinga Forest.
Table 5. Estimates and associated statistics of the above-ground biomass of each vegetation type and the entire Atlantic Forest cover of Rio de Janeiro state produced using a pantropical allometric equation from the literature and data from the National Forest Inventory collected in Rio de Janeiro (NFI-RJ).
Vegetation TypeArea (ha)UAsBiomass (Mg ha−1)CI (Mg ha−1)CV (%)Sampling Error (%)
DF5868.41329.5±11.221.2137.81
SF452,922.56374.3±11.59.3015.53
RAF895,278.868115.7±18.59.5815.97
MF18,936.61958.9±15.214.9225.88
RF37,561.32227.2±13.027.7547.75
TOTAL1,410,567.618579.0±9.37.1411.81
UAs, sampling units; CI, confidence interval; CV, coefficient of variation; DF, Deciduous Forest; SF, Semideciduous Forest; RAF, Rainforests; MF, Mangrove Forest; RF, Restinga Forest.
Disclaimer/Publisher’s Note: The statements, opinions and data contained in all publications are solely those of the individual author(s) and contributor(s) and not of MDPI and/or the editor(s). MDPI and/or the editor(s) disclaim responsibility for any injury to people or property resulting from any ideas, methods, instructions or products referred to in the content.

