Article

Effects of Growth and Treatment Conditions on the Quality of Norway Spruce (Picea abies L.) Sawn Timber

1
Fraunhofer Institute for Wood Research Wilhelm Klauditz-Institute WKI, 38108 Brunswick, Germany
2
Faculty of Resource Management, University of Applied Sciences and Arts Hildesheim/Holzminden/Göttingen, 37077 Göttingen, Germany
*
Author to whom correspondence should be addressed.
Forests 2024, 15(9), 1588; https://doi.org/10.3390/f15091588
Submission received: 12 August 2024 / Revised: 3 September 2024 / Accepted: 5 September 2024 / Published: 10 September 2024
(This article belongs to the Section Wood Science and Forest Products)

Abstract

:
A study was conducted to improve the effectiveness of silvicultural production of structural sawn timber from softwoods. It intends to explore prediction methods for mechanical timber quality. The study material was obtained from six stands divided into age groups of approximately 40- and 80-year-old trees (examining the influence of age). The stands were differentiated by their applied thinning system of thinning from below or above (examining the influence of the thinning system). Resulting from these different levels of data, i.e., stand parameters, tree anatomy, and visual board properties are examined and analyzed in ordinal logistic models and linear mixed models. Visual board properties were discerned by means of the German standard for visual grading of sawn timber. The mechanical board properties were measured in on-edge bending strength tests and allocated into strength classes, which were modeled in dependence of visual characteristics and forestry conditions. The evaluation of mechanical properties attributed a significant loss of timber quality to short rotation periods, non-ideal water supply, and a single-tree management system. The prediction capabilities of models based on site and tree characteristics were on par with the accuracy of visual grading. Management adaptations by intense thinning from above can lead to a significant decline in Norway spruce (Picea abies L.) timber quality when site factors coincide. Particular care should be taken in the management of locations with high yield potential. Non-destructive evaluation based on site characteristics combined with terrestrial laser scan data of tree characteristics has potential as a pregrading method.

1. Introduction

This study focuses on the use of Norway spruce (Picea abies L.) lumber as a load-bearing construction component in the form of sawn timber. The performance of sawn timber during processing and when installed is affected by natural wood properties like knots, its density, fiber deviations from the longitudinal axis, and reaction wood, as well as process-induced or amplified properties like cracks and distortions. The assessment of these criteria enables the definition of product classes with predictable quality. This study examines the non-destructive evaluation of sawn timber quality in dependance of visual criteria, tree characteristics, and site conditions. Regarding site conditions, the evaluation of the influence of thinning treatment and rotation time is of particular relevance to allow feedback on current silvicultural trends.
Due to climate change, the growing conditions of timber in temperate forests are uncertain, and management strategies need to be adapted to the changing circumstances [1,2,3]. In recent decades, in addition to high growth rates, forest owners have focused on the formation of stable stands to make them more resilient against abiotic damage events [4,5]. The main instrument to influence the ratio of stem height to diameter (slenderness) is the control of stand density, i.e., the number of trees per area [6]. When thinning a stand in Germany, two treatment strategies have been prevalent: The removal of trees from the lower stand layers creates a single-layer stand structure, usually associated with high stem density and slow growth rates, which is referred to as thinning from below (TFB). In contrast, the selection of tree individuals to be nurtured in the dominant stand layer and the removal of equal individuals leads to a more diverse stand structure and is called thinning from above (TFA). Studies on the impact of stand density in young stands of Norway spruce and Scots pine (Pinus sylvestris L.) revealed that stands with narrow spacing provided the highest mechanical properties [7]. Pretzsch [8] reported that a large reduction in stand density is associated with a loss of total yield volume, especially when reducing the stem count in lower stand layers, as is practiced in TFB. An accelerated diameter increase and thicker branches are associated with larger canopies, formed when trees in the co-dominant layer are cut by TFA for the benefit of increased annual growth of selected target tree individuals [9]. Although an increase in basal area growth of stands might be beneficial in silvicultural economic considerations of decreased rotation time, especially when thinning intensity is high [10], a decrease in average wood density of target trees when growth is stimulated [11] has a potentially negative impact on the mechanical properties of sawn timber. Jaakkola et al. [11] provide data on growth and density responses when thinned from below, while Bobinac et al. [12] examine the thinning effect on sites where higher stability and yield optimization were aimed for and the dominant tree layer reached diameter increments of 36% to 42%. In addition to a decrease in density in the target tree layer, a higher light availability implies a longer survival of branches in lower crown sections, increasing the knottiness of cut timber boards.
For centuries, conifers, especially Norway spruce, have been preferred as constructive timber due to their beneficial combination of growth and wood properties [13]. Despite their recent decline, spruce stands can be expected to remain a significant economic factor in the next decade due to their high stocks. Yet, the preference for TFA causes concerns about the quality of the raw material, for the previously mentioned reasons. Timber quality prediction could address these concerns and, when accounting for silvicultural parameters, identify adaptation opportunities to facilitate a sustainable supply. Therefore, we examine different approaches to non-destructive evaluation along the sawn timber production chain from stand characteristics, variables of tree anatomy, visual grading criteria, and mechanical properties by means of linear models, linear mixed models, and ordinal models of relationships between these levels.
The most widely used method for assessing the quality of sawn timber is visual grading. Even though a technological shift to machine grading methods is recognizable, visual grading has been the most important assessment method for wood quality [14] and remains a control mechanism in large timber plants and vital in smaller sawmills [15]. The German standard for the purely visual method is described in DIN 4074-1 [16] for softwood timber and considers various growth characteristics.
Apart from the visual assessment of sawn timber, mechanical methods as well as combinations thereof have been established. The visual grading accuracy was studied by Roblot et al. [17], where visual grades were compared with theoretical grades resulting from mechanical tests. The summarized result was that only 27% of spruce timber boards were correctly graded for spruce and 7% of Douglas-fir boards (Pseudotsuga menziesii [(M.) F.]). Individual grading criterion impacts according to UK grading standards have been examined by Algin [18], who focused on the knot area ratio of Sitka spruce (Picea sitchensis [(B.) C.]) boards. Stapel and van de Kuilen [19] extensively studied the impact of cross-section and knot assessment on the mechanical performance of visually graded timber and showed that a correction factor for timber dimension could improve the yield of higher grading classes. The effect of grain angle was studied using FEM modeling of induced stress by angular deviations of the light scattering tracheid effect [20] and using local fiber deviations [21] to predict tensile properties. A combination of optical scans and fiber angle measurement was used by Viguier et al. [22], achieving an 87% coefficient of determination in the prediction of bending stiffness and 62% in the prediction of bending strength. For defect-free wood, the anatomical feature of the micro-fibril-angle of wood cells was included in models for the stiffness of Scots pine (Pinus sylvestris [L.]) by Auty et al. [23], resulting in a significant increase in coefficient of determination.
Olofsson et al. [24] developed an approach for the mechanical grading of Scots pine timber with CT scanners employing machine learning to improve customer-specific grading with optical grading feedback from CT images. Burawska-Kupniewska et al. [25,26] investigated the dependence of the properties of graded timber on the height origin of samples in logs and found lower densities and bending strengths in the upper log sections.
Rais et al. [27] reported a high correlation of prediction accuracy between mechanical board grading and log grading via acoustic waves. It was noted that the prediction of timber quality from standing trees requires further research. Hecker et al. [28] also found a lack of accuracy in predicting board quality based on log quality.
Houllier et al. [29] intertwined silviculture, biometrics, and wood science to develop two models. Firstly, a model to simulate an average tree grown under known conditions of site quality, genetic disposition, and silviculture results in an estimation of annual ring distribution and knottiness based on merging several growth modeling equations. Secondly, a model to predict the timber quality of individual trees using the same growth modeling equations but applying them to reconstruct individual tree growth and thus predicting density and knot distribution, enabling a simulation of boards inside the stem and their expected quality. The relationship between spatial position of boards in logs was examined by Kliger et al. [30], where mechanical properties decreased from bark to pith [31,32], while the difference between the uppermost stem section and the lowest trunk section remained insignificant. Another silvicultural approach examined the influence of living crown ratio on the mechanical properties to determine if larger crowns result in lower mechanical performance due to increased auxin production [33]. Mechanical properties tended to be lower with larger crowns, with predictability in younger stands of spruce being more reliable.
Examination of the relationships between tree characteristics, acoustic measurements, and mechanical properties yielded increased consideration of stem characteristics [34]. A positive correlation between slenderness and sound velocity for co-dominant trees contrasted with a negative relationship of these variables for suppressed trees. The sound velocity in wood is expected to increase with wood density and undisturbed longitudinal orientation of wood fibers. Of readily available stand data, the mean ratio of height and diameter of trees inside a stand was best suited to predict the mean quality indication of mechanical grading via Dynagrade [35]. Høibø et al. [14], looking at the prediction of mechanically graded board quality, considered within-stand variation and found a residual variance of 53% when they modeled stem diameter, longitudinal board position, and dynamic elasticity measurements to explain board elasticity, suggesting a considerable random effect of individual trees. Different sites with Scots pine have been compared by Stöd et al. [36] with regard to the mechanical properties of from thinnings and final use. Clean wood samples exhibited better performance for samples from second thinning and final use harvests compared to material from firstly thinned stands.
In this study, several aspects of the works above will be combined to comprehensively investigate the biological requirements for good wood quality, using data at stand, tree, and board level. We will set out with the hypothesis that we can achieve satisfactory predictability in models for visual quality and mechanical board quality in dependence of available stand information and visual properties, respectively, referencing guidelines for model quality outlined by Nagelkerke [37], Hu et al. [38], and goodness-of-fit measures as outlined by Fagerland and Hosmer [39].

2. Materials and Methods

2.1. Sample Materials

The sawn timber was obtained from six stands in two different forest districts (Table 1). Stands 1–3 were located in the Rothaar Mountains in Hesse (Germany); stands 4–6 were located in the Harz Mountains in Lower Saxony (Germany). A minimum of 90% of the stand wood basal area consisted of spruce. The observed plots consisted of two age groups of stands: ~40 years old and trees ~80 years old, according to their stand age, which was validated in stem disc analysis. Three stands each were treated according to the silvicultural systems “Thinning-from-Above” (TFA) and “Thinning-from-Below” (TFB). The classification of stands into these categories was conducted by local district managers in accordance with inventory ledgers. The available water supply on the sites is an amalgamation of precipitation, groundwater availability, slope, and soil type. It was included as an ordinal factor in the data analysis as classified by forestry site mapping, with moderately fresh sites possessing a slightly lower water retention capacity.
A total of 20 trees per stand was selected by the local district managers to ensure a realistic sample of logs from thinning. The terrestrial laser scan data for tree architecture was gathered and generously provided by our project partners, and detailed computations can be found in Hoewler et al. [40]. This included data for tree height (TH), the height–diameter ratio (HDR), crown surface area (CS), crown base height (CB), and crown radius (CR). Due to the cost of logistics and processing, a random sample of these trees was selected to achieve a comparable volume in the sample of sawn timber. The sample material was cut as part of a commercial thinning measure. The spruce logs were cut at the Fraunhofer Institute for Wood Research, Wilhelm-Klauditz-Institute (WKI) (Braunschweig, Germany), using a mobile sawmill, model Timber Queen S 500 ES (Pezzolato S.p.A., Envie; Italy). Logs with diameters above 30 cm were halved and cant sawn; logs with diameters below 30 cm were plane sawn to maximize the yield. As such, the material consisted of flat-grained and angled boards. The timber was sawn to dimensions of 13 × 3 × 210 cm3, a compromise between realistic board proportions and the need to gain an adequate sample size from low-diameter trees as found predominantly in stands 1 and 2. The length was limited due to the constraints of the test equipment.
The material moisture was adjusted in a controlled drying process using a Vötsch double climatic chamber, heater type VEKZ 05/120/S (Weisstechnik GmbH, Balingen, Germany). The temperature was raised stepwise from 40 °C to 60 °C (±1 °C) while reducing the relative humidity from 75% to 55% (±1%) over five days and allowing an additional relaxation period of two days. Wood moisture was controlled to be 11 ± 2% using a Hydromette HT 95 T (Gann Mess- u. Regeltechnik GmbH, Gerlingen, Germany) on a sample of boards from the top, middle, and bottom of drying stacks. The wood moisture at the beginning of drying was between 40% and 50%. The moisture gradient was adjusted to keep the process fast yet gentle due to the technical limitations of the climate chamber, minimizing drying stresses. The dried sawn timber was planed to 12 × 2 × 210 cm3 with an accuracy of ±0.6 mm before grading. Boards with remaining traces of the pith were discarded.

2.2. Visual Grading and Mechanical Testing

The study material (N = 757 after sampling corresponding to 85 trees) was graded according to the specifications of DIN 4074-1 [13] for boards intended for further utilization as glue-laminated timber. The standard distinguishes between three grade classes (S-classes) (S 7, S 10, and S 13) in rising wood quality. The grading characteristics were determined using a measuring tape with an accuracy of ±1 mm. The impact of this measuring accuracy in units, as demanded in the standard, is given in brackets. The analyzed grading criteria thus included single knot (±0.4%; SK), knot clusters (±0.4%; KC), fiber angle (±1% at a targeted measuring distance of 50 mm; FA), pith, growth ring width (±0.2 while measuring an average over at least 5 annual rings; GRW), cracks, bends, and warps (±0.05%; TW), discolorations (±3.6%) and rot, compression wood (±3.6%; CW), and insect damage (±1 mm). Knots were measured as the sum of the projected circumference of a visible knot or knot cluster (knots within 15 cm) in relation to two-fold board width. The fiber angle was measured at the location of the highest visible grain deviation from the board axis, excluding deviations around knots, by measuring the distance from the board edge along drying cracks or along visible deviations along the wood grain marked by the course of annual rings. The width of growth rings was measured at a 90° angle to the ring orientation. A radial length of 2.5 cm was the minimally measured distance. At least five annual rings had to be included in the measurement. If this was not possible due to board thickness or due to highly irregular growth ring widths, two measurements were taken to use the mean. Wood warp in any direction was measured at the point of highest deformation as the gap width on a plane surface over a 2 m distance. Discolorations and compression wood were measured at the location of the most severe occurrence as a percentage of circumference. The assessment of compression wood was conducted visually, using color intensity and the proportion of latewood in the growth rings as indicators, e.g., specifically examining latewood proportions over 33% of the annual ring width. Each affected annual ring was measured at complete width. The material was graded according to the lowest permissible class as defined by the thresholds of DIN 4074-1 [15]. The available equipment for mechanical testing limited the possible board length. To accommodate the fact that we did not conduct a systematic test with the estimated point of least strength at the center of our test setup, we excluded wood characteristics at the outer 30 cm of each board end as these would have negligible effects on the test results, resting on the bearings and being at the outer limits of the stress impact.
A randomized sampling process was chosen to represent a design space of those grading criteria that were most commonly responsible for downgrades across all investigated stands, knots, and compression wood. In correspondence to the gradations of these criteria, a sample of 170 boards was drawn (N [S 13] = 12; N [S 10] = 25; N [S 7] = 60; N [rejects] = 73). To analyze the effects of plot and tree architecture on mean tree values, a subsample of 128 boards with scan data was available. The sample size was not increased to have a sufficient reserve to use as glue-laminated timber in further studies.
The selected boards were subjected to an edgewise four-point bending strength test as prescribed for sawn timber in EN 408 [41] to determine the modulus of rupture (MoR), the modulus of elasticity (MoE), and the wood raw density, which was measured at 12% wood moisture as reference to the moisture equilibrium at standard climate conditions of 20 °C and 65% relative humidity. A universal testing machine, Z250 (ZwickRoell GmbH & Co. KG, Ulm; Germany), was used to conduct the mechanical test. The bending test setup and procedure were arranged according to standard EN 408 [41], while accommodating the board dimensions of 12 × 2 × 210 cm3, see Figure 1. The deflection for the calculation of the MoE was measured using the movable crosshead. Indentations within the relevant force spectrum up to 30% of maximum force were avoided by using 5 cm-long steel plates at all metal-to wood contact points to minimize errors in the measured elasticity.
The raw density and wood moisture content of samples were measured after strength testing. A specimen of 5 cm length was cut from the cross-section as close to the rupture as possible, while avoiding cracks and wood defects. The cut specimens were measured, weighed, and then dried in an oven for 24 h at 103 ± 1 °C to 0% moisture content. The dry samples were measured and weighed again to determine moisture content and absolute dry density. The test configuration and specimen moisture were accounted for when calculating the results, using the formulae provided by EN 408 [41] and EN 384 [42], prior to assigning a hypothetical strength class using the characteristic values provided in DIN EN 338 [43].

2.3. Description of Data Analysis

To analyze the data for significant differences between groupings and to determine effect sizes, a significance level of alpha = 0.05 was used. Pearson’s correlation coefficient was used for bivariate analysis of parametrical data. OriginPro 2022 (OriginLab Corp., Northampton, MA, USA, Version 9.90) was used for basic statistical analysis, post hoc tests, and principal component analysis. The normal distribution of data clusters of individual stands was checked via the Shapiro–Wilk test. Homogeneity of variances was tested using Levene’s test. If the assumptions were met, the obtained data were subjected to a post hoc analysis using one-way ANOVA. The Holm–Bonferroni correction was applied for greater robustness of results with small sample sizes. Groupings were determined using the Holm–Bonferroni test. If the data were normally distributed but the homogeneity of variances was violated, the variant of Welch’s test for multiple comparisons, the pairwise comparison according to Games–Howell, was applied.
Linear models (LM), linear mixed models (LMM), and ordinal models (CLM) were constructed using the statistical software R (R Foundation for Statistical Computing, Vienna, Austria, Version 4.3.2.). Estimators and dependent variables were standardized to Z-scores prior to analysis where relative effect sizes were relevant. Slope variation was checked visually and by model iteration. The Akaike information criterion (AIC) was chosen to select optimally fitted linear models with backwards algorithms to account for sample size in LM construction. In addition to linear models for good interpretability of data, 2-factor linear and quadratic models were fitted for grading criterion effects. The results of model fitting consisted of standardized factor coefficients to weigh factors against each other and the adjusted coefficient of determination (CoD) R2adj to account for model complexity. Factor coefficients or estimators correspond to the predicted change of the dependent variable, measured in units of standard deviation, when the independent factor is changed by one unit of standard deviation. The model determination of LMMs was evaluated by grouped intra-class correlation coefficient (ICC) and Nakagawa’s conditional R2 for mixed models [44], as shown by Equation (1), with σ α 2 denoting the summed variance of random variables, σ f 2 the summed variance of fixed factors, and σ ε 2 the unexplained variance or error term.
R 2 c = σ f 2 + σ α 2 σ f 2 + σ α 2 + σ ε 2
The marginal R2m excludes the variance of random effects σ α 2 from the numerator. Nagelkerke’s pseudo-R2 was used to determine the coefficient of CLMs [38]. The AIC and corresponding coefficient of determination were used during the formulation of LMMs and CLMs without functional algorithm support to select an ideal factor composition while balancing determination and overinterpretation.
The model quality was evaluated using measures for predictive quality, the misclassification error and ranked probability score [45] and estimators for the goodness-of-fit, the tests of Hosmer–Lemeshow, Pulkstenis–Robinson, and Lipsitz [39]. Statistical assumptions for ordinal models of proportional odds were checked using the Brant test [46]. For modeling (linear, mixed effects, and ordinal), model comparison, power simulation, and visualization, the following R packages supplied all crucial functions and instructions: MuMIn, lme4, tidyverse, flexplot, MASS, StepReg, stats, performance, ordinal, effects, gofcat, generalhoslem, verification, ggplot2, and bayesplot.

3. Results

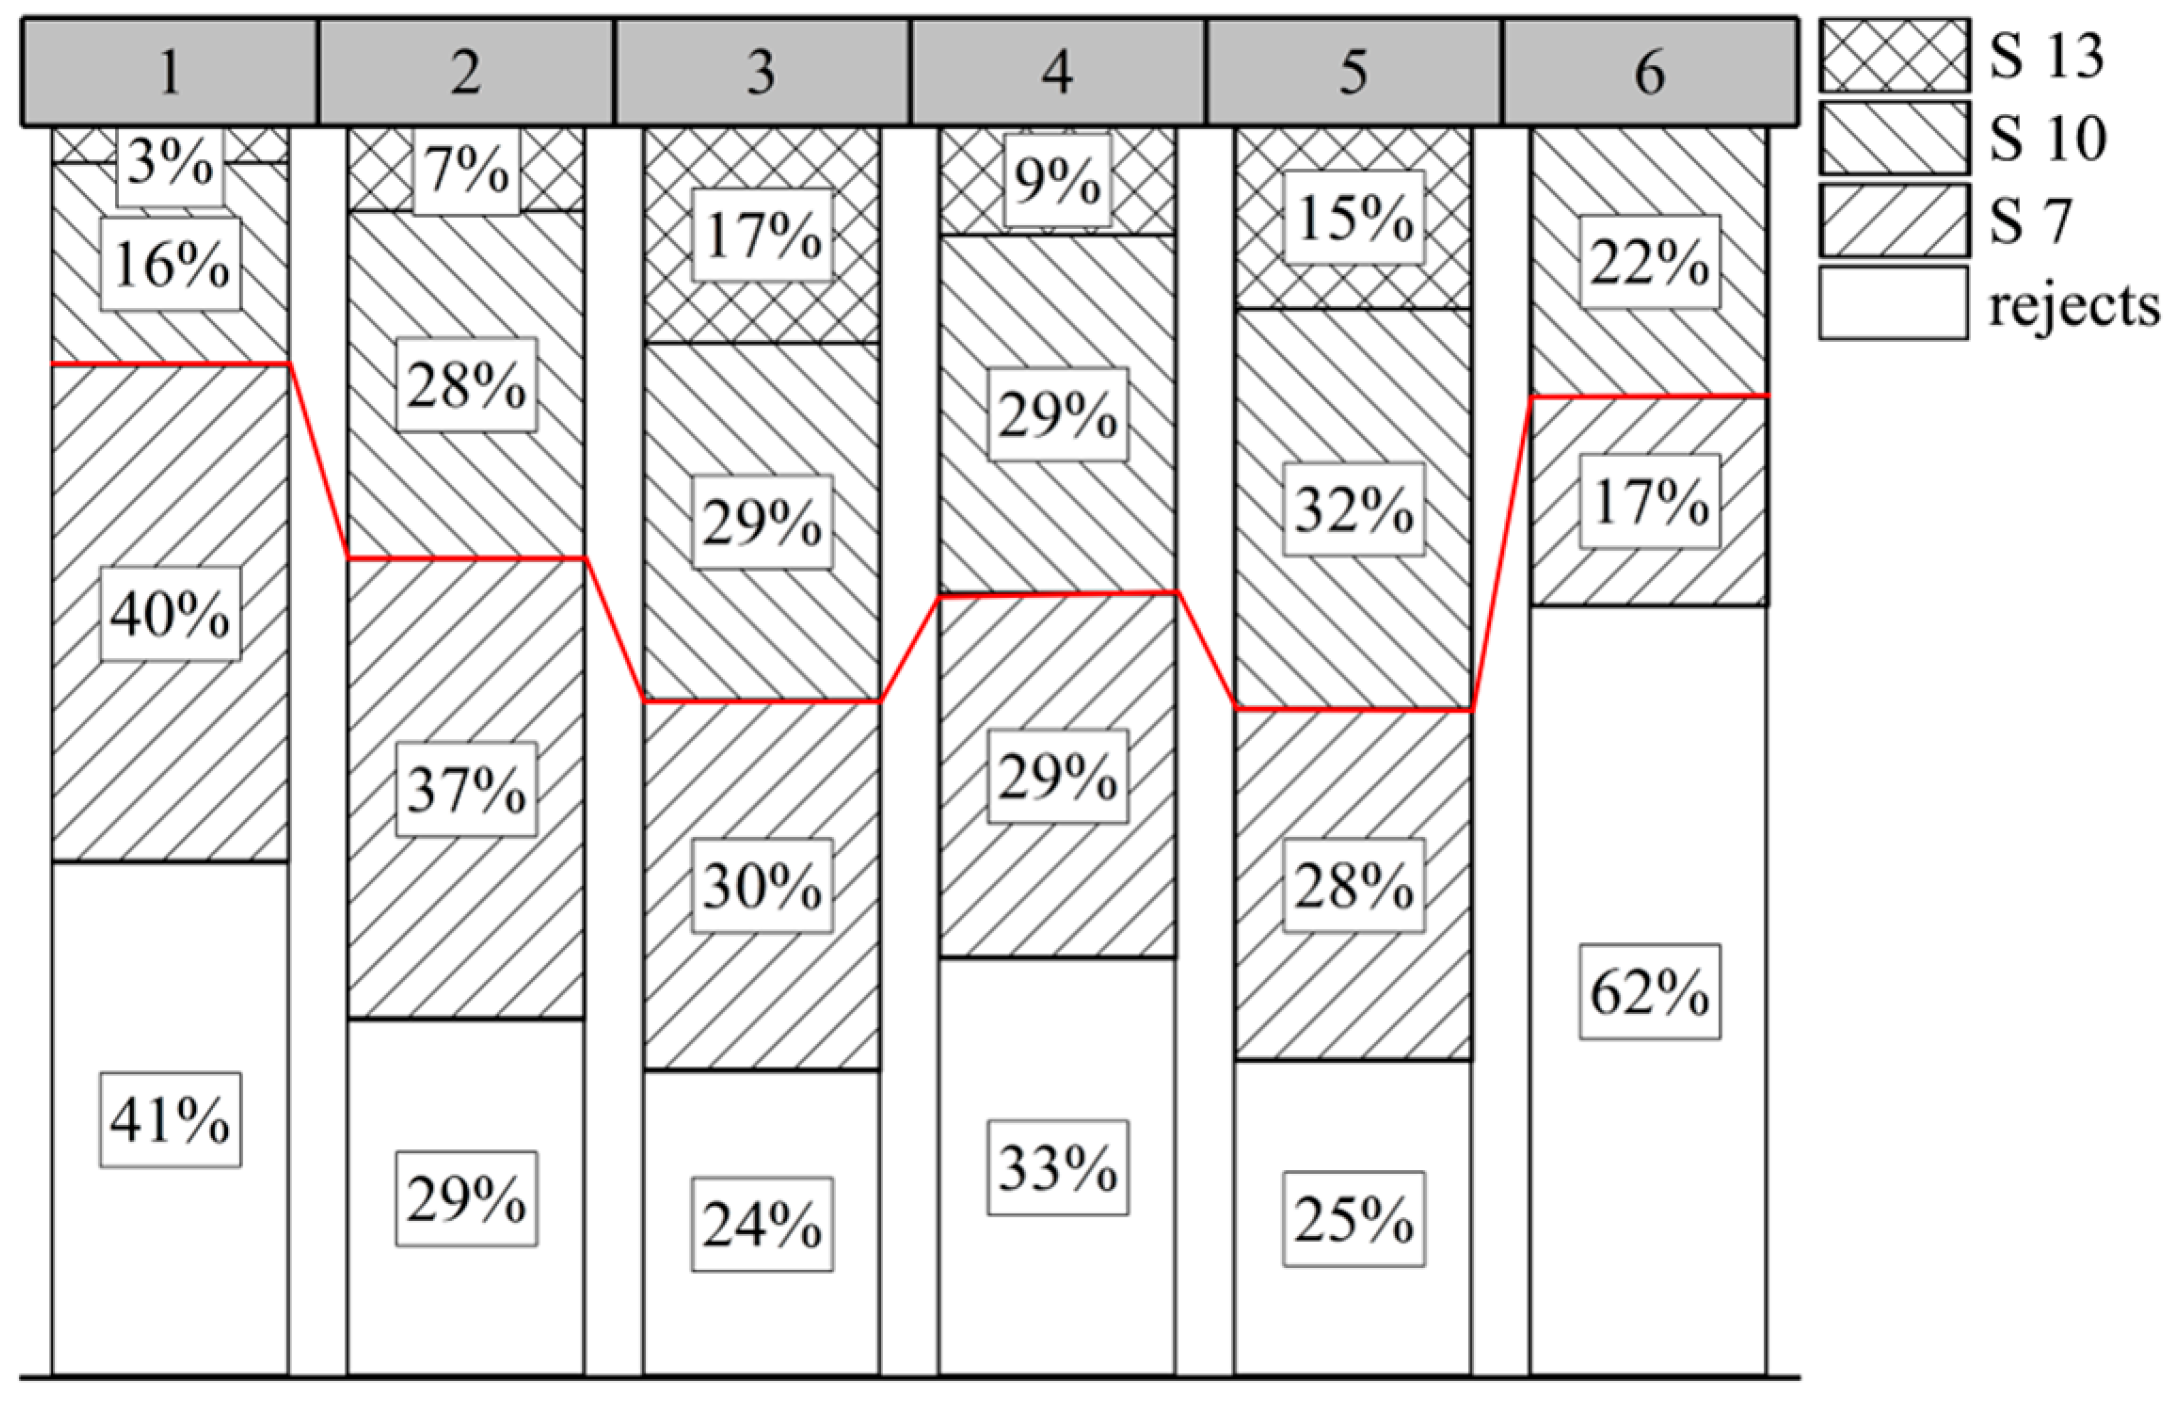
3.1. Visual Grading of Spruce Sawn Timber

To compare the different stands and how they might have been affected by different management procedures, the visual properties of the rejected boards were examined more closely. The relative results of the grading process of the sample boards are shown in Figure 2. Out of the sample stands, the highest percentage of grade class S 13 was sourced from stands 3 and 5, with 17% and 15%. Few boards from the younger stands 1, 2, and 6 met the requirements of S 13. A number of criteria can be found similarly manifested in different stands, while some criteria were of singular importance in specific stands, comparing their percentages (Figure 3). Combining the criteria SK and KC, knottiness is a prevalent feature in stands 2, 4, and 5, being a decisive criterion in 11% to 15% of total boards, resulting in rejection. The effect of knottiness on the visually graded yield is clarified by the proportion of affected boards in younger stands 1 and 6, comprising up to 37% of all boards exhibited.
KC ratios above 50% or single knot ratios above 33%. For the older stands, especially stand 4, it indicates a fast growth in its youth, rivaling the measured knot ratios of stand 6. The criterion of TW is predominant for stand 1, which affected up to 19% of boards in the reject attribute range and brought 43% of the boards into the S 7 class. The size of SK did not pose a constraint for the grading process of stand 1, while KC had demoted 6% of boards into rejects and 34% into S 7. KC was the cause of most rejections in stand 2, at 8%. The other criteria were found to be balanced in their expression. While CW was found to some extent in all stands, it was responsible for a large proportion of rejects in the samples of stand 3. Stands 4 and 5 were observed to be very similar in regard to the proportions of various visual criteria, with knottiness and CW making up the majority of demotions. For the samples of stand 6, GRW was the defining factor for downgrading, with 43% of all timber boards from stand 6 being demoted as rejects due to wide annual rings. In summary, SK was crucial in 80-year-old stands, while the effect of KC prevailed in the age group of 40-year-old trees. The importance of CW as a rejection factor is also dominant in the older age group, while it reaches only a maximum share of 6% among the rejected boards of 40-year-old trees.
The prediction of visual quality was proven to be insufficient, using the known forestry parameters as effects, as shown in Figure 4. The resulting ordinal model is described by Equation (2).
v i s u a l   g r a d e ~ 0.61 × a g e g r o u p + 0.05 × s i l v i c u l t u r e 0.34 × w a t e r   s u p p l y
Model analysis shows significance for the effects of age and water supply (Pr < 0.05). The indicator for model definition is the condition number of Hessian, which, at 1.3 × 10, is well below concerning thresholds of 10 × 106 as advised by Christensen [47]. The pseudo-R2N, however, clearly implies that no prediction of grade classes is possible at the examined sample size at R2N = 0.04.
To be sure, we evaluated the model in accordance with different metrics. The misclassification error of 0.68 indicates an overall low quality of prediction. The ranked probability score of 0.18 would indicate a proper model. It considers the distance between predicted classes, and so would lead us to misjudge the model accuracy as there is only a miniscule amount of predicted S 13 boards, and misclassifications are thus only wrong by one class. The three tests employed to measure the goodness-of-fit—Hosmer–Lemeshow, Pulkstenis–Robinson, and Lipsitz tests—all reject the hypothesis of no lack of fit. Our initial deduction based on the low pseudo-R2 therefore holds true.

3.2. Mechanical Properties of Sawn Timber in Dependence of the Study Site

The Pearson correlation coefficients between raw density and MoR of 0.61 and between raw density and MoE of 0.72 affirm the significant influence of the raw density on the mechanical performance. The material sourced from stands that were subjected to the management system of TFB, stand 1, and especially from the 80-year-old stands 5 and 3, showed higher mechanical properties at mean MoE of 13,298.28 N mm−2 and 16,802.37 N mm−2 and less or even none overlap of statistical significant groups in the multiple comparison (Table 2) to stands 4 and 6. In the visual grading process, the measurement of the annual growth ring width aims to approximate the wood density. The relation between these two factors was therefore analyzed.
Figure 5 shows graphically that sawn timber boards from TFB stands tended to be of higher wood density compared to TFA stands, even at comparable growth ring width. This was verified by assessing the dependency of the ratio of raw density and growth ring width on the type of silviculture. The result suggested a significant difference at a low error margin of p = 2.37 × 10⁻⁸ excluding stand 3 from the analysis as an outlier still resulted in a significant density advantage for the TFB system at p = 0.002 and a statistical power of 0.89. Based on the analysis of MoR, MoE, and density, we therefore assume significant quality differences between stands attributable to the impact of silviculture. These quality differences are not restricted to the effect of density, which can be proven by ANOVA and Welch’s t-test for the expression of grading criteria in dependence of the silvicultural system. Significant differences with p values < 0.00 were observed for SK, KC, and GRW. The silvicultural system had no significant effect on FA, TW, and CW with p values > 0.20.

3.3. Relationships of Tree Anatomy and Visual Board Properties

A more detailed step in predicting the quality of boards was performed by examining the effect of anatomical variables on the occurrence of visual grading criteria in linear mixed models. The resulting indicators in Table 3 have been restricted according to best fit, avoiding singularity of the linear mixed models. Using stand age as a grouping factor allows to differentiate between the specific influence of outward characteristics and the effect of tree age. The size of single knots is the only visual board property where a satisfyingly strong effect of anatomical factors was observable. The larger conditional coefficients of determination allow for an estimation of some visual properties, like the mean of knot cluster size, the mean of annual rings, and the occurrence of compression wood. For those variables, significant correlations were often present, but the effect was attributed to the age effect by evaluating the variance within the age group. Within groups, no significant specification of the prediction was possible. For the criterion of warp, neither anatomical variables nor group effects were significant and only a correlation of −0.02 to grain angle was observed. Examining the correlation of criteria between individual boards, warp and fiber angle were still not significantly correlated. To contextualize, the goodness-of-fit for linear mixed models can be estimated by the difference of R2m and R2c, where small differences indicate a good estimation of effects while large differences attribute predictive power to the grouping factor. This can also be verified by the intraclass correlation coefficient (ICC), which is capable of attributing variance within a nested model structure. We deduce that the SK size is sufficiently indicated by tree anatomy at an ICC of 0.09, while the other criteria have no good predictability or are subject to the grouping age effect, like KC with an ICC of 0.55.

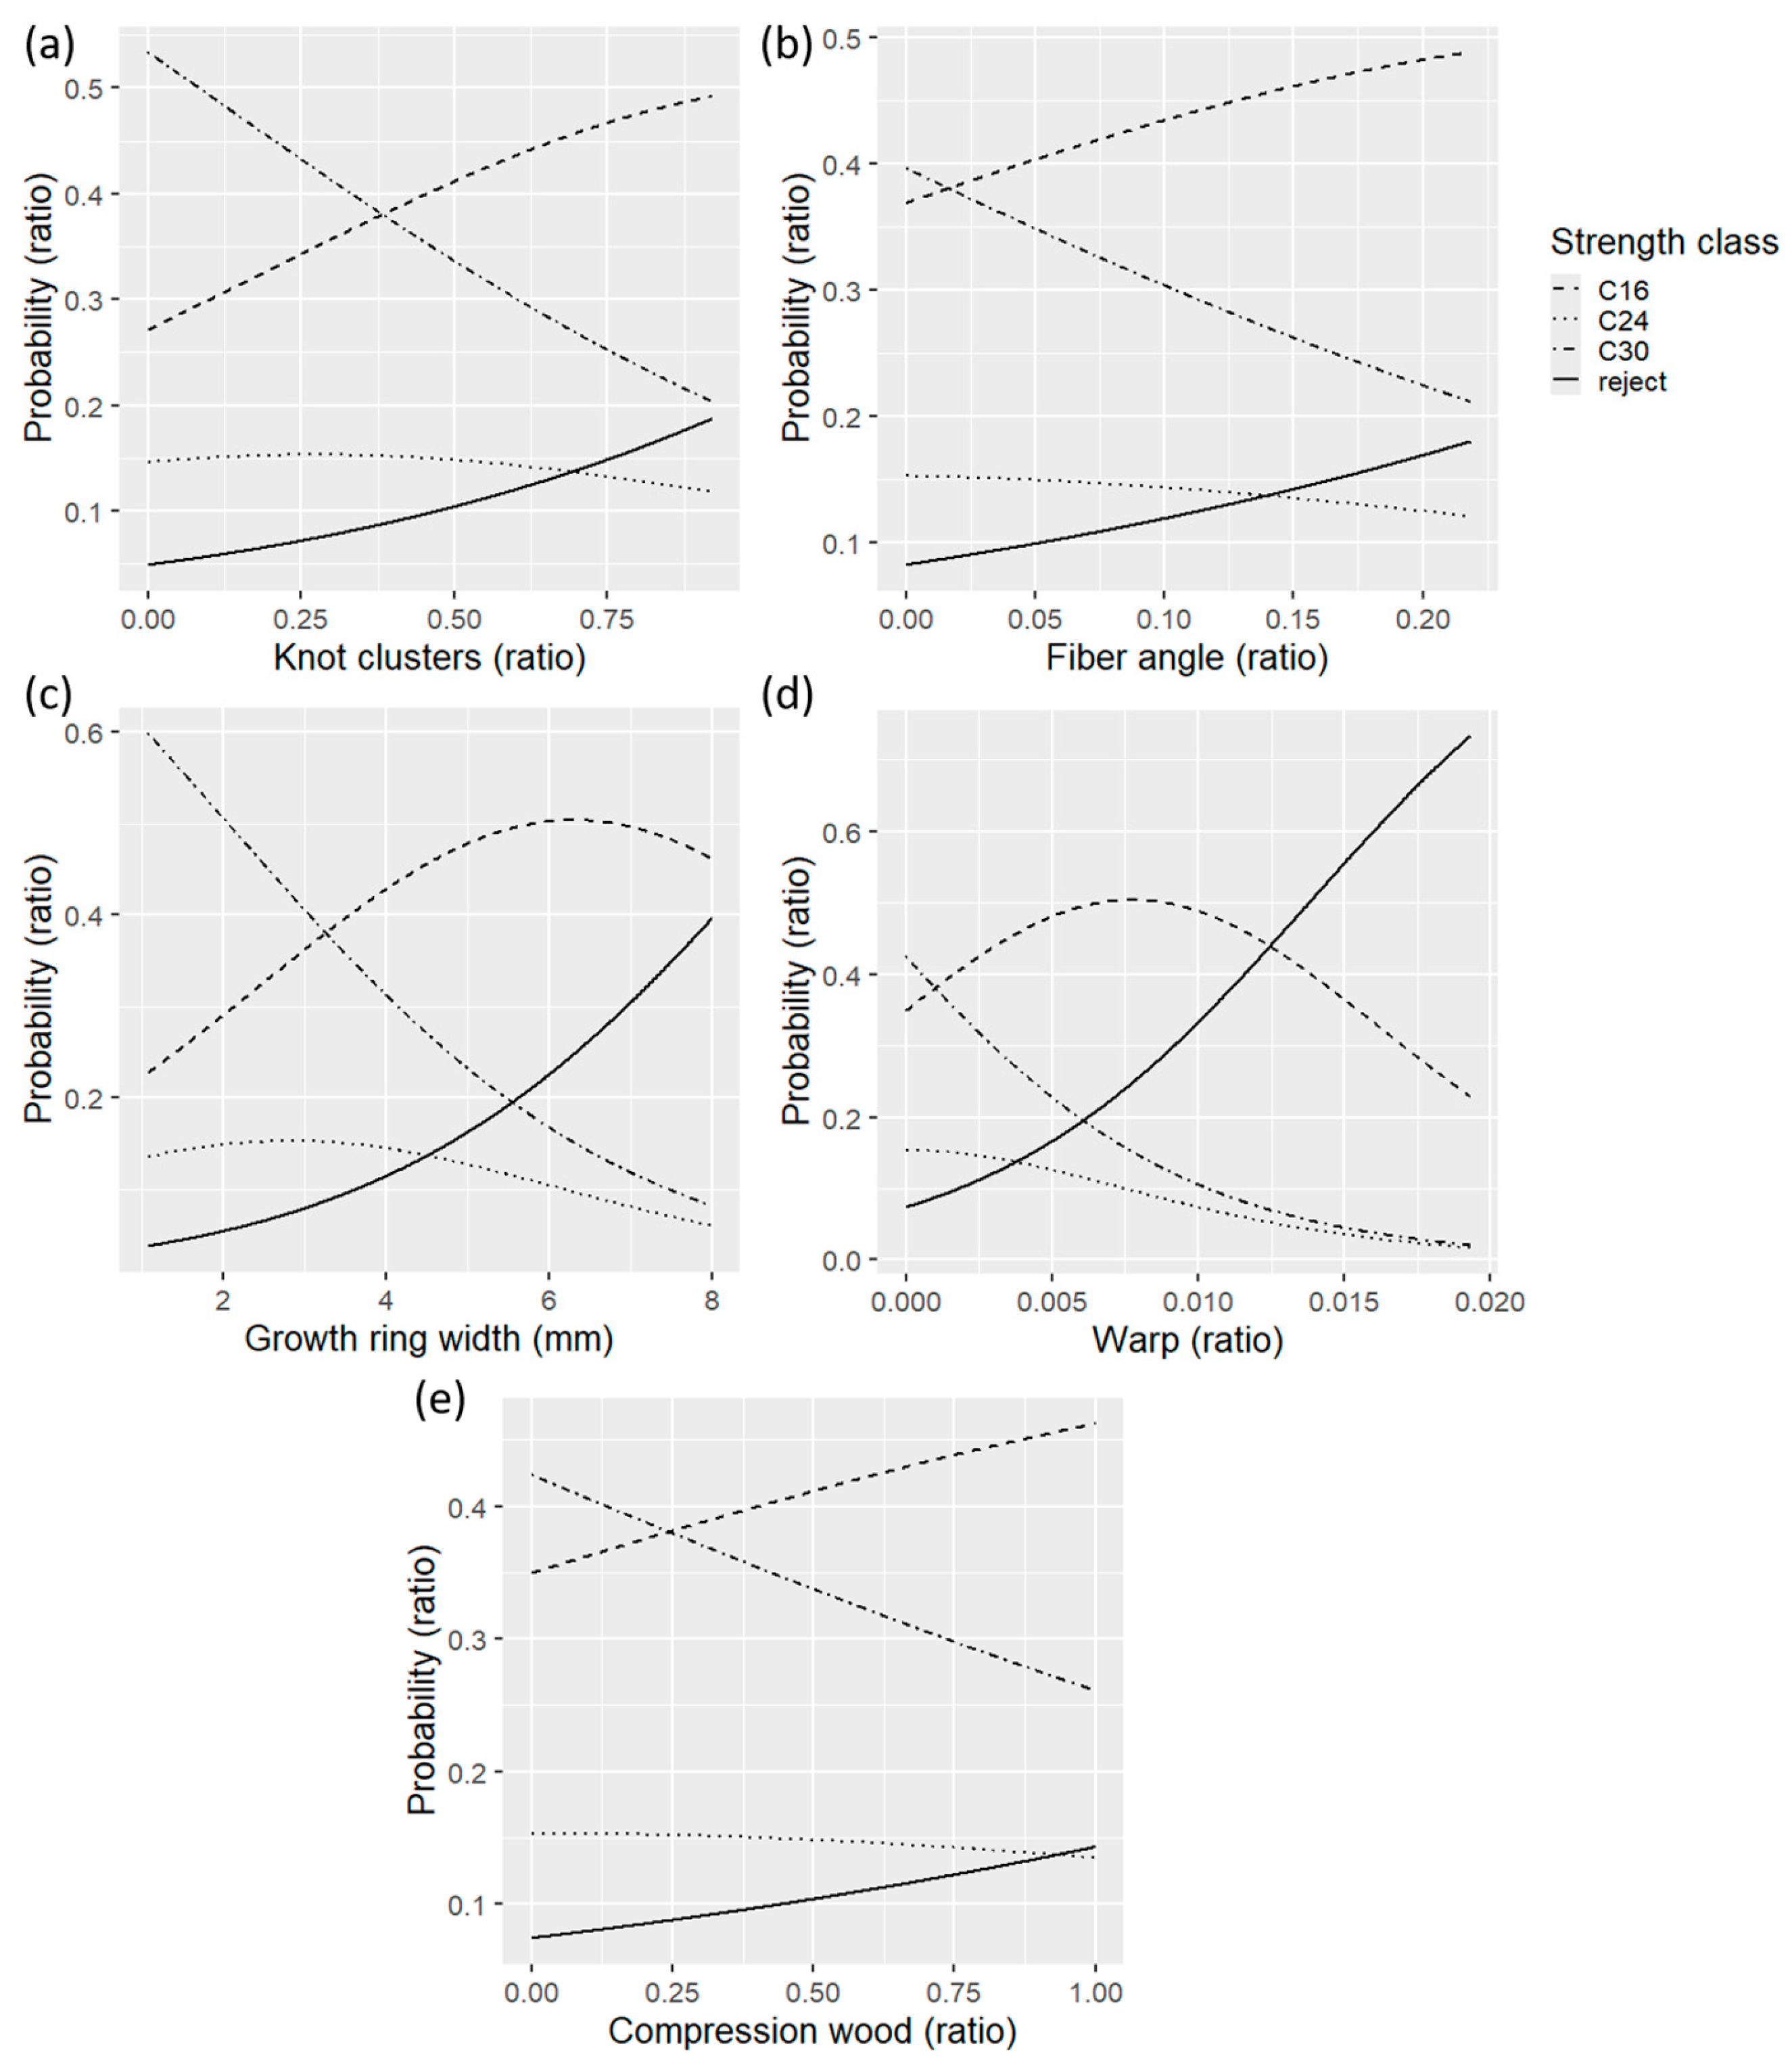
3.4. Ordinal Models for Board Quality in Dependence of Visual Properties

Correlation coefficients for visual criteria that are not dependent on storage duration and the sawing process were determined and are shown in Table 4. For most visual criteria, the single factor regressions show at least slightly significant correlations to the results of the four-point bending tests. The wood density correlated strongest with GRW. The anatomical and chemical changes during the formation of reaction wood are confirmed by the correlation with CW. The characteristic increase in late wood percentage has been expressed significantly in the board mean. The quadratic models, formulated to describe the interactions of visual criteria, reached an adjusted R2 of 0.54 for the MoE and 0.40 for the MoR after stepwise reduction for optimized AIC.
The prediction of single mechanical properties was generalized by ordinal linear models to predict the strength class, including MoR, MoE, and the board density as restrictive factors. The model interpretation works differently as for linear models. The strength class affiliation as ordinal factor is predicted by a function of coefficients for the visual criteria, given here by the cumulative link model (CLM) section of Table 4. As the calculation is based on actual measurement data, factor coefficients are not to be interpreted as relative to each other, which would require standardized data as Z-scores to relate to the standard deviation. Large coefficients like −168.53 for warp are explainable by the measuring procedure as percentile deviations on a length of two meters. The CLM is able to produce class predictions at an R2N of 0.27, waiving some determination compared to the mechanical values but more generalized and omitting any overfitting due to the inclusion of interactions or non-linear factors. The criterion of CW was omitted from the CLM due to a lack of additional explained variance of the mechanical performance. The factors have been visually isolated in Figure 6. The data represent the probability of class affiliation as a result of changing one independent factor while including the others as their median in a simulation based on the CLM function. In this visual representation, the lack of determination is apparent, as the class probabilities are oftentimes close to each other. Especially class C24 is subject to low determination. Prediction never resulted in an expected C24 quality, as the probability of a C16 or C30 prediction was always higher. In the CLM, the small interval between thresholds for C24 describes the unlikeliness for a board to be predicted as C24 based on our sample data. This corresponds to the narrow range of the MoE between characteristic values of DIN EN 338 [43] for the timber strength classes. A narrow range resulted in few cases being sorted into C24, and therefore a high model quality would be needed to achieve the predictive determination to adequately detect the C24 probability. The model has been evaluated by tests for goodness-of-fit. The Hosmer–Lemeshow test (p = 0.58) and Lipsitz test (p = 0.403) were in agreement of no significant lack of fit. The Pulkstenis–Robinson test was not applicable, as the regression on strength classes included no categorical predictors. There remains a considerable misclassification error of 0.53, which is an improvement compared to the 0.80 misclassification by the visual prediction. The CLM results in a ranked probability score of 0.17, which indicates a good prediction, meaning the misclassifications were not off by many classes. Considering the few strength classes in the evaluation, we could expect low results for this indicator.

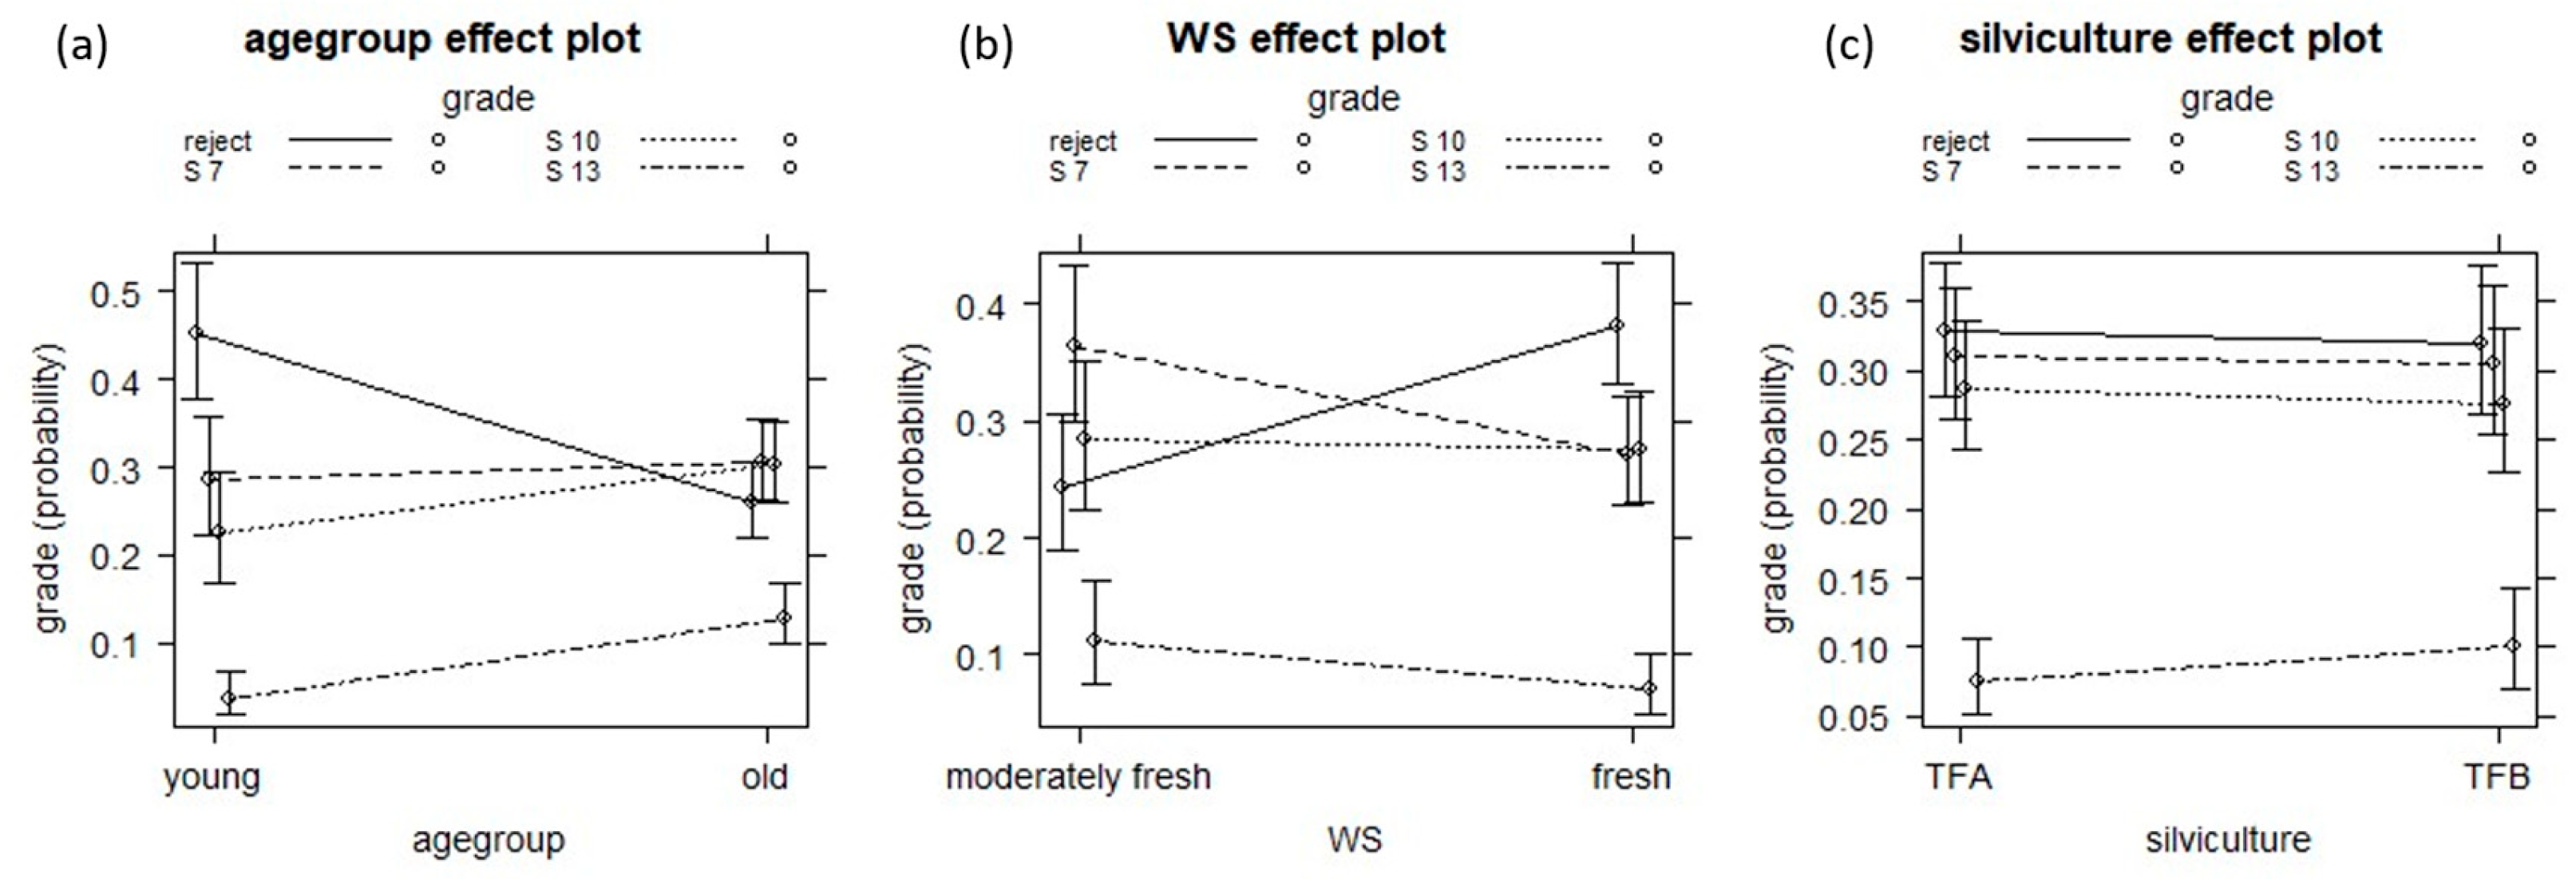
3.5. Ordinal Model for Board Quality Based on Tree Architecture and Forest Parameters

When examining the effects of tree architecture on the mechanical properties or viewed collectively the strength class of boards, we had to consider grouping factors. Although the stand selection was carefully conducted to minimize differences in growth conditions, small-scale differences still occurred (Table 1). Instead of formulating cumulative link mixed models, we included known stand characteristics in linear ordinal models. Instead of attributing variance to the stand itself, we use as much known information as possible to distinguish the stands.
The models shown in Table 5 were formulated additively, starting with HDR as a solitary factor to predict the strength class of boards. The probabilistic nature of CLMs allows us to combine tree properties with achieved strength class. The probabilities for assignment to the four chosen strength class divisions, with properties below C16 declared as rejects, are shown in Figure 7. The additive process considered logical implications of growth rate and knottiness in the examined lower stem section. The first modeling steps therefore included HDR and CB as indicators for growth rate, stand density [6], and possible knottiness in the lower stem section. The significance of single factors can change, as exemplified by CLM 2, where HDR falls slightly below the significance threshold of 95%. The next factor that was added in CLM 3 was TH. We deliberately chose to omit the age group of stands in favor of TH for the CLM construction to generalize the modeling approach by making it possible to compare wood quality on the continuous scale of tree height. Though test models have shown that we omit approximately 5% determination, TH, when combined with the other factors, is a suitable indicator for stand age and still correlates to tree age at the observed level. Further additions of stand-level information greatly increased the achieved R2, but can be seen as overinterpretation due to the limited sample of stand sites. We refrained from excluding the anatomical characteristics to convey the variability within one stand. The viability of adding factors was checked by the likelihood ratio test in a model comparison. The addition of CS was evaluated as a non-significant improvement on model accuracy, though the AIC was lowered. This was due to a disparage in sample size between models, caused by missing values of a few tree individuals. As described for Table 4, the given model estimators have to be evaluated in relation to their unit of measurement. The categorical factors for WS and silviculture, together with TH, indicating tree age, have the strongest impact on the expected board quality. The mechanical properties on fresh sites and sites that were thinned from above were comparatively lower.
As for the previous models, the soundness of CLM 5 was evaluated. The model reached a misclassification error of 0.42, improving the model based on visual criteria. The ranked probability score implies an acceptable prediction quality at 0.15 with a higher skill score than the previous models, meaning predictions, if wrong, do not result in extreme mispredictions. The measurements for goodness-of-fit, the Hosmer–Lemeshow test (p = 0.23), the Pulkstenis–Robinson test (p = 0.19), and the Lipsitz test (p = 0.06) agree on no significant lack of fit. The low p-value of the Lipsitz test indicates a need for a larger sample size due to its sensitivity to degrees of freedom.

4. Discussion

Significant differences between the growing areas of the Rothaar Mountains and the Harz Mountains in the expression of the different grading characteristics have been observed. Although we aimed for study sites with comparable environmental conditions, slight differences in altitude and water supply were evident in the data. As expected, site and age are predominant factors for wood quality. However, significant differences in wood density and expression of mechanically relevant grading criteria could be attributed to silviculture. Fiber angle and compression wood showed no dependency on the silvicultural system but showed a dependency on stand age. Warping as a drying-related defect was significantly less common in timber boards of the older age group. The applied drying technique was not equivalent to industrial drying kilns in regard to temperature, airflow velocity, and circulation, as it passed longitudinally through the stacks. The occurrence of drying defects therefore should only be compared relatively between the examined stands and not as an absolute reference for the deformation potential on the examined site. Only minor correlations were found between most visual board characteristics and anatomical tree characteristics. The tendency to warp, for example, seems to be caused mostly by in-board variances of density and fiber angle, not by variance between trees, and therefore is also not detected by its correlation to the global fiber angle of boards.
Even if a safety margin has to be taken into account in visual grading, the potential of usable structural timber was underestimated by visual grading. The visual rejection rate is in line with the findings of Burawska-Kupniewska et al. [26], where a rejection rate of 42.7% was achieved. The regression models predicted relatively low numbers of reject boards. The correlation of density and CW can be assumed to be common knowledge. However, the effect of CW on the expected strength class was not sufficiently expressed. Although the hygric and processing properties of CW should be considered, its impact on the mechanical properties did not justify the applied class thresholds. An application-oriented grading for indoor use, regarding boards with a high CW ratio, could take the hygric properties into account while considering low GRW and the CW ratio for their contributions to the mitigating effect of density to increase high quality yield. As an example of the impact of wood anatomy, the visual grading of stand 3 boards is not consistent with its superior mechanical properties. We can deduce that a specific anatomical growth pattern is imprinted during early growth stages, as suggested by Piemattei et al. [48], who examined changes of principal components for wood anatomy over several years, influencing, among other characteristics, the wood density sustainably even after growth conditions have changed due to thinning. To summarize, we can deduce that the model, including tree and site characteristics, predicted the mechanical board quality of our sample material better than the visual grading standard. This observation needs to be verified with additional experiments to generalize the model and keep the deductions from self-relied bias.
The data of mechanical testing exhibit high variance, leading to low coefficients of determination for the predictive models. We attribute this in part to the given inaccuracy when dealing in natural resources and the visual measurement of grading criteria. Another cause for the loss of accuracy is the chosen test design. Owing to the specifications of available testing equipment, the bending test setup was modified to the lower limits, as permitted in EN 408 [41]. The processability of sawn timber made it necessary to use a shorter length of timber boards. The standard procedure of placing the estimated weakest point in the center of the test setup was thus not possible. We mitigated that effect by ignoring the outer 30 cm of sawn timber boards during grading. The addition of a variable describing the distance of the weak point, often the largest knot cluster, to the setup center seems advisable for further studies when global strength properties are measured. Due to our effort to achieve a significant sample size for testing, the cutting angle of the boards was not taken into account, resulting in a wide range of growth ring angles during testing. It is likely that this further increased the observed variance in our data. The predictability was higher for the MoE due to weak points defining the measured maximum force rather than the elasticity of the required path to material failure. This was already presumable when analyzing the correlations of density and mechanical performance. In defect-free wood, a coefficient approaching 1.0 would be expected. However, the anisotropic properties of wood negatively influence this correlation. Lower correlation can be associated with a stronger effect of grain angle, knottiness, and other defects. The correlation of MoE (0.72) was higher than for MoR (0.61) as the impact of defects can be expected to be more pronounced at higher loads, and locale interactions of defects create an increasing uncertainty of the breakage point during mechanical testing. Mechanical wood grading uses these relations to predict the mechanical performance based on elasticity and density, where predictability is less susceptible to variance.
The R2N of the ordinal models was higher in forest- and tree-property-based cumulative link models compared to the visual grading procedure. The limitations of visual grading with GRW as a predictor for density do not apply with additional information of implied age and growth rate. The positive effect of tree slenderness on mechanical properties is consistent with the effects of growth rate-related grading criteria presented so far. High slenderness is associated with slower diameter increases and higher stand density. Only with an appropriate thinning treatment will the crown space be occupied by correspondingly small numbers of individuals, which is usually associated with the practice of TFA. A positive effect on the mechanical properties could be explained by correlations with the fiber angle and the internal wood stress, which were not predictable by the architectural data observed. A reason for the insignificance of further crown characteristics was the utilization of the lower parts of the trunk. Changes in the silviculture, the tree age, and the associated distortion of the correlations over the factor time led to an inaccuracy in the deduction of knot diameters via factors like the number of branches of first-order or first-order branches above a certain diameter. The results suggest that a larger number of plots is required to properly estimate the effect sizes of additional anatomical characteristics. This would be mandatory to shift the explained variance of mechanical properties from clustering effects (age, water supply, silviculture) to applicable tree architectural estimators. Predicting mechanical properties using mobile laser scanning as a non-destructive evaluation method for forest stands could prove to be a suitable approach for assessing and pricing logs of standing trees [49]. The model evaluations of Table 5 support this, as similar sample size, higher determination, and better indicators for model quality were reached, proving the validity of non-destructive evaluation methods prior to sawmill processing. In the non-destructive assessment of timber quality, other approaches focused predominantly on the acoustic velocity and dynamic MoE of the tree and timber. Llana et al. [50] achieved a CoD of up to 0.59 for the prediction of MoE using different measuring devices and supplied an extensive literature review. The CoD ranged between 0.43 and 0.78 for MoE [51,52] and 0.20 and 0.81 for MoR [53,54]. Taking into account the results of Pretzsch [7], according to which the total yield volume was higher for TFA due to the growth potential of the lower stand layers that would be removed in TFB, management with TFA in high-density stands seems to be preferable for a secured supply with high-quality timber. The observed medium quality range formed by stands 1, 2, 4, and 5 yielded respectable proportions of higher strength classes. The diverse demands on forest stands, such as structural richness and stability, have to be considered too. In respect to the stress climate change-linked influences have on European forests, a sustainable forest vitality might be the foremost concern of foresters.

5. Conclusions

The applied silvicultural system leads to significant differences in mechanical quality. Differences in visual board characteristics are caused by age and site effects, while only a small proportion of variance is explained by specific differences within these groups. Based on our mechanical experiments and ordinal modeling, the mitigating effect of high wood density on bending strength and elasticity should be considered in visual grading. With increasing board density, visual criteria like compression wood no longer have a significant effect on the mechanical performance, as proven by multiple comparisons (see Table 2) for the sawn timber of stand 3. The observed effect of compression wood on the mechanical performance could be a reason to re-evaluate its grading thresholds, as in the regression analysis (see Table 4), its effect was either insignificant or lightly positive. Constructive wood protection could compensate risks of increased dimensional instability in structural timber, and attenuated grading thresholds would greatly benefit the yield and the effectiveness at which spruce timber is utilized. A practical approach could be to change growth ring width from a continuous grading criterion to a grouping factor with specific thresholds.
Based on information about site characteristics and tree architecture, an estimation of the expectable mechanical quality of boards sourced from a particular tree is possible. However, the natural variance interferes greatly with any predictions. Trees with slower growth, due to lower water availability, higher stand density, and thinning from below, were more likely to yield high-quality timber. This yield was significantly increased by tree age. Our ordinal models demonstrate the suitability of a non-destructive evaluation system based on available site characteristics combined with terrestrial laser scan data. This approach could be usable as a pregrading method, allowing for adapted grading criteria in visual as well as mechanized grading procedures, more detailed than visual log grading. For comparison, all processed logs of this study were classified as being of the same log quality. A generalization demands the inclusion of a broader spectrum of site characteristics and holds potential for the addition of softwood species as grouping factors. General observations of the annual growth rate of the sample sites indicate a reduced growth caused by climate change stress symptoms. This could potentially increase the quality of available timber, although the overall yield is shrinking due to a loss in spruce coverage.

Author Contributions

Conceptualization, D.B. and B.K.; methodology, T.K. and D.B.; validation, T.K.; formal analysis, T.K.; investigation, T.K.; resources, B.K.; data curation, T.K.; writing—original draft preparation, T.K.; writing—review and editing, N.R. and B.K.; visualization, T.K.; supervision, D.B. and B.K.; project administration, B.K.; funding acquisition, B.K. and D.B. All authors have read and agreed to the published version of the manuscript.

Funding

This research was funded by the Forest Climate Fund of the Fachagentur Nachwachsende Rohstoffe (FNR) under grant 22WK314901 as commissioned by the German Federal Ministriy of Food and Agriculture (BMEL) and the German Federal Ministry for the Environment, Nature Conservation, Nuclear Safety and Consumer Protection (BMUV). The APC was funded by the Fraunhofer Society for the Advancement of Applied Research.

Data Availability Statement

The data of this research are available from the Open Science Framework (OSF) under DOI: 10.17605/OSF.IO/NBK5W.

Acknowledgments

The authors would like to thank the HOFOS Oldershausen GmbH, Lower Saxony State Forestry, and HessenForst State Forestry for the kind provision of sample sites and logs.

Conflicts of Interest

The authors declare no conflicts of interest. The funders had no role in the design of the study; in the collection, analyses, or interpretation of data; in the writing of the manuscript; or in the decision to publish the results.

References

  1. Puettmann, K.J. Silvicultural Challenges and options in the Context of Global Change: “Simple” Fixes and Opportunities for New Management Approaches. J. For. 2011, 109, 321–331. [Google Scholar]
  2. Temperli, C.; Bugmann, H.; Elkin, C. Adaptive management for competing forest goods and services under climate change. Ecol. Appl. 2012, 22, 2065–2077. [Google Scholar] [CrossRef] [PubMed]
  3. D’Amato, A.W.; Bradford, J.B.; Fraver Sand Palik, B.J. Effects of thinning on drought vulnerability and climate response in north temperate forest ecosystems. Ecol. Appl. 2013, 23, 1735–1742. [Google Scholar] [CrossRef]
  4. Müller, F.; Augustynczik AL, D.; Hanewinkel, M. Quantifying the risk mitigation efficiency of changing silvicultural systems under storm risk throughout history. Ann. For. Sci. 2019, 76, 116. [Google Scholar] [CrossRef]
  5. Yousefpour, R.; Gray, D.R. Managing forest risks in uncertain times of climate change. Ann. For. Sci. 2022, 79, 16. [Google Scholar] [CrossRef]
  6. Sharma, R.P.; Vacek, Z.; Vacek, S. Modeling individual tree height to diameter ratio for Norway spruce and European beech in Czech Republic. Trees 2016, 30, 1969–1982. [Google Scholar] [CrossRef]
  7. Šilinskas, B.; Varnagirytè-Kabašinskiene, I.; Aleinikovas, M.; Benušiene, L.; Aleinikovienè, J.; Škėma, M. Scots Pine and Norway Spruce Wood Properties at Sites with Different Stand Densities. Forests 2020, 11, 587. [Google Scholar] [CrossRef]
  8. Pretzsch, H. Density and growth of forest stands revisited. Effect of the temporal scale of observation, site quality, and thinning. For. Ecol. Manag. 2020, 460, 117879. [Google Scholar] [CrossRef]
  9. Valentine, H.T.; Mäkelä, A.; Green, E.J.; Amateis, R.L.; Mäkinen, H.; Ducey, M.J. Models relating stem growth to crown length dynamics: Application to Loblolly pine and Norway spruce. Trees 2012, 26, 469–478. [Google Scholar] [CrossRef]
  10. Bianchi, S.; Huuskonen, S.; Hynynen, J.; Siipilehto, J.; Niemistö, P. Tree-level differences in Norway spruce and Scots pine growth after extreme thinning treatments. Scand. J. For. Res. 2022, 37, 109–118. [Google Scholar] [CrossRef]
  11. Jaakkola, T.; Mäkinen, H.; Saranpää, P. Wood density of Norway spruce: Responses to timing and intensity of first commercial thinning and fertilization. For. Ecol. Manag. 2006, 237, 513–521. [Google Scholar] [CrossRef]
  12. Bobinac, M.; Andrasev, S.; Bauer-Zivkovic, A.; Susic, N. Effects of Heavy Thinnings on the increment and stability of a Norway spruce stand and its trees between the ages of 32 and 50. Sumar. List 2018, 142, 33–46. [Google Scholar]
  13. Kolář, T.; Dobrovolný, P.; Szabó, P.; Mikita, T.; Kyncl, J.; Sochova, I.; Rybníček, M. Wood species utilization for timber constructions in the Czech lands over the period 1400–1900. Dendrochronologia 2021, 70, 125900. [Google Scholar] [CrossRef]
  14. Høibø, O.; Vestøl, G.I.; Fischer, C.; Fjeld, L.; Øvrum, A. Bending properties and strength grading of Norway spruce: Variation within and between stands. Can. J. For. Resour. 2014, 44, 128–135. [Google Scholar] [CrossRef]
  15. Linke, G. Festigkeitssortierung Von Holzbauteilen Beim Bauen Im Bestand–Ein Beitrag Zur Substanzschonenden Erhaltung Historischer Gebäude. Doctoral Dissertation, Brandenburg University of Technology Cottbus-Senftenberg, Cottbus, Germany, 2023. [Google Scholar]
  16. DIN 4074-1; Strength Grading of Wood–Part 1: Coniferous Sawn Timber. Deutsches Institut für Normung e.V., Beuth Press GmbH: Berlin, Germany, 2012.
  17. Roblot, G.; Coudegnat, D.; Bleron, L.; Collet, R. Evaluation of the visual stress grading standard on French Spruce (Picea excelsa) and Douglas-fir (Pseudotsuga menziesii) sawn timber. Ann. For. Sci. 2008, 65, 812. [Google Scholar] [CrossRef]
  18. Algin, Z. Multivariate performance optimization of scaffold boards with selected softwood defects. Constr. Build. Mater. 2019, 220, 667–678. [Google Scholar] [CrossRef]
  19. Stapel, P.; van de Kuilen, J.-W.G. Influence of cross-section and knot assessment on the strength of visually graded Norway spruce. Eur. J. Wood Wood Prod. 2013, 72, 213–227. [Google Scholar] [CrossRef]
  20. Hu, M.; Olsson, A.; Johansson, M.; Oscarsson, J. Modelling local bending stiffness based on fiber orientation in sawn timber. Eur. J. Wood Wood Prod. 2018, 76, 1605–1621. [Google Scholar] [CrossRef]
  21. Briggert, A.; Olsson, A.; Oscarsson, J. Prediction of tensile strength of sawn timber: Models for calculation of yield in strength classes. Mater. Struct. 2020, 53, 53–55. [Google Scholar] [CrossRef]
  22. Viguier, J.; Jehl, A.; Collet, R.; Bleron, L.; Meriaudeau, F. Improving strength grading of lumber by grain angle measurement and mechanical modeling. Wood Mater. Sci. Eng. 2015, 10, 145–156. [Google Scholar] [CrossRef]
  23. Auty, D.; Achim, A.; Macdonald, E.; Cameron, A.D.; Gardiner, B.A. Models for Predicting Clearwood Mechanical properties of Scots Pine. For. Sci. 2016, 62, 403–413. [Google Scholar] [CrossRef]
  24. Olofsson, L.; Broman, O.; Oja, J.; Sandberg, D. Product-Adapted Grading of Scots pine Sawn Timber by an industrial CT-scanner Using a Visually-Trained Machine-Learning Method. Wood Mater. Sci. Eng. 2021, 16, 279–286. [Google Scholar] [CrossRef]
  25. Burawska-Kupniewska, I.; Krzosek, S.; Mańkowski, P. Mechanical Properties of Machine Stress Graded Sawn Timber Depending on the Log Type. Forests 2021, 12, 532. [Google Scholar] [CrossRef]
  26. Burawska-Kupniewska, I.; Krzosek, S.; Mańkowski, P. Efficiency of Visual and Machine Strength Grading of Sawn Timber with Respect to Log Type. Forests 2021, 12, 1467. [Google Scholar] [CrossRef]
  27. Rais, A.; Pretzsch, H.; van de Kuilen, J.-W.G. Roundwood pre-grading with longitudinal acoustic waves for production of structural boards. Eur. J. Wood Wood Prod. 2014, 72, 87–98. [Google Scholar] [CrossRef]
  28. Hecker, M.; Ressmann, J.; Becker, G.; Merforth, C. Prognose der Schnittholz-Qualität auf der Grundlage der Rundholz-Sortierung. Eur. J. Wood Wood Prod. 2000, 58, 168–176. [Google Scholar] [CrossRef]
  29. Houllier, F.; Leban, J.-M.; Colin, F. Linking growth modelling to timber quality assessment for Norway spruce. For. Ecol. Manag. 1995, 74, 91–102. [Google Scholar] [CrossRef]
  30. Kliger, I.R.; Perstorper, M.; Johansson, G.; Pellicane, P.J. Quality of timber products from Norway spruce. Part 3. Influence of spatial position and growth characteristics on bending stiffness and strength. Wood Sci. Technol. 1995, 29, 397–410. [Google Scholar]
  31. Brüchert, F.; Becker, G.; Speck, T. The mechanics of Norway spruce [Picea abies (L.) Karst]: Mechanical properties of standing trees from different thinning regimes. For. Ecol. Manag. 2000, 145, 45–62. [Google Scholar] [CrossRef]
  32. Lindström, H. Intra-Tree Models of Basic Density in Norway Spruce as an Input to Simulation Software. Silva Fenn. 2000, 34, 411–421. [Google Scholar] [CrossRef]
  33. Kuprevicius, A.; Auty, D.; Achim, A.; Caspersen, J.P. Quantifying the influence of live crown ratio on the mechanical properties of clear wood. Forestry 2013, 86, 361–369. [Google Scholar] [CrossRef]
  34. Krajnc, L.; Farrelly, N.; Harte, A.N. The influence of crown and stem characteristics on timber quality in softwoods. For. Ecol. Manag. 2019, 435, 8–17. [Google Scholar] [CrossRef]
  35. Øvrum, A. In-forest assessment of timber stiffness in Norway spruce (Picea abies (L.) Karst.). Eur. J. Wood Wood Prod. 2013, 71, 429–435. [Google Scholar] [CrossRef]
  36. Stöd, R.; Marttila, J.; Tomppo, L.; Haapala, A.; Verkasalo, E. Modulus of Elasticity and Bending Strength of Scots Pine (Pinus sylvestris L.) Wood from Commercial Thinnings. Forests 2024, 15, 567. [Google Scholar] [CrossRef]
  37. Nagelkerke, N.J. A note on a general definition of the coefficient of determination. Biometrika 1991, 78, 691–692. [Google Scholar] [CrossRef]
  38. Hu, B.; Shao, J.; Palta, M. Pseudo-R2 in logistic regression model. Stat. Sin. 2006, 16, 847–860. [Google Scholar]
  39. Fagerland, M.W.; Hosmer, D.W. Tests for goodness of fit in ordinal logistic regression models. J. Stat. Comput. Simul. 2016, 86, 3398–3418. [Google Scholar] [CrossRef]
  40. Hoewler, K.; Seidel, D.; Krenn, T.; Berthold, D.; Ehbrecht, M.; Mueller, J.; Kietz, B. Evaluation of softwood timber quality—A case study on two silvicultural systems in central Germany. Forests 2022, 13, 1910. [Google Scholar] [CrossRef]
  41. DIN EN 408; Timber Structures–Structural Timber and Glued Laminated Timber–Determination of Some Physical and Mechanical Properties; German Version EN 408:2010+A1:2012. Deutsches Institut für Normung e.V., Beuth Press GmbH: Berlin, Germany, 2012.
  42. DIN EN 384; Structural Timber-Determination of Characteristic Values of Mechanical Properties and Density; German Version EN 384:2016+A1:2018. Deutsches Institut für Normung e.V., Beuth Press GmbH: Berlin, Germany, 2018.
  43. DIN EN 338; Structural Timber–Strength Classes; German Version EN 338:2016. Deutsches Institut für Normung e.V., Beuth Press GmbH: Berlin, Germany, 2016.
  44. Nakagawa, S.; Johnson, P.C.D.; Schielzeth, H. The coefficient of determination R2 and Intra-class correlation coefficient from generalized linear mixed-effects models revisited and explained. J. R. Soc. Interface 2017, 14, 20170213. [Google Scholar] [CrossRef]
  45. Wilks, D.S. Statistical Methods in the Atmospheric Sciences; Academic Press: San Diego, CA, USA, 2005; Chapter 7. [Google Scholar]
  46. Brant, R. Assessing proportionality in the proportional odds model for ordinal logistic regression. Biometrics 1990, 46, 1171–1178. [Google Scholar] [CrossRef]
  47. Christensen, R.H.B. A Tutorial on Fitting Cumulative Link Mixed Models with clmm2 from the Ordinal Package. 2023. Available online: https://cran.r-project.org/web/packages/ordinal/vignettes/clmm2_tutorial.pdf (accessed on 1 July 2024).
  48. Piermattei, A.; von Arx, G.; Avanzi, C.; Fonti, P.; Gärtner, H.; Piotti, A.; Urbinati, C.; Vendramin, G.G.; Büntgen, U.; Crivellaro, A. Functional Relationships of Wood Anatomical Traits in Norway Spruce. Front. Plant Sci. 2020, 11, 683. [Google Scholar] [CrossRef] [PubMed]
  49. Kankare, V.; Joensuu, M.; Vauhkonen, J.; Tanhuanpää, T.; Vastaranta, M.; Hyyppä, J.; Hyyppä, H.; Alho, P.; Rikala, J.; Sipi, M. Estimation of the Timber Quality of Scots Pine with Terrestrial Laser Scanning. Forests 2014, 5, 1879–1895. [Google Scholar] [CrossRef]
  50. Llana, F.D.; Short, I.; Harte, A.M. Use of non-destructive test methods on Irish hardwood standing trees and small-diameter round wood timber for prediction of mechanical properties. Ann. For. Sci. 2020, 77, 62. [Google Scholar] [CrossRef]
  51. Villanueva, J.L. Mechanical Evaluation of Spanish Juniper (Junipera thurifera L.) Round Timber from Castilla y León. Visual Strength Grading and Resonance Evaluation. Final Project Degree. E.T.S.I. Agraria. University of Lleida. Lérida, Spain. 2009. Available online: http://hdl.handle.net/10459.1/45926 (accessed on 11 June 2024).
  52. Bertoldo, C. Predicting of Strength and Stiffness of Wood Using Acoustic Measurement in Trees. Ph.D. Dissertation, Faculdade de Enghenaria Agrícola, Universidade Estadual de Campinas, Campinas, SP, Brazil, 2014; 146p. [Google Scholar]
  53. Butler, M.A.; Dahlen, J.; Eberhardt, T.L.; Montes, C.; Antony, F.; Daniels, R.F. Acoustic evaluation of loblolly pine tree- and lumber-length logs allows for segregation of lumber modulus of elasticity, not for modulus of rupture. Ann. For. Sci. 2017, 74, 20. [Google Scholar] [CrossRef]
  54. Moore, J.R.; Lyon, A.Y.; Searles, G.J.; Lehneke, S.A.; Ridley-Ellis, D.J. Within- and between-stand variation in selected properties of Sitka spruce sawn timber in the UK; implications for segregation and grade recovery. Ann. For. Sci. 2013, 70, 403–415. [Google Scholar] [CrossRef]
Figure 1. Setup of the mechanical test for bending strength in accordance with the descriptions and limits of EN 408 [41].
Forests 15 01588 g001
Figure 2. Proportions of visual grading classes [15] for the sawn timber of the six sampled stands, with preferred classes S 13 and S 10 divided from less preferred classes S 7 and rejects by red line.
Forests 15 01588 g002
Figure 3. (a) Absolute number of rejected boards with the percentage of boards having expressed grading criteria to a relevant degree and (b) providing absolute numbers for the boards of grade class S 7 with the proportion of boards affected at a degree below the S 10 threshold but above the rejection limit.
Forests 15 01588 g003
Figure 4. Probability of visual grade class yield for the effects of (a) age group, (b) water supply, and (c) silviculture, based on ordinal modeling.
Forests 15 01588 g004
Figure 5. Raw wood density in relation to growth ring width as recorded during visual grading, divided into stands subjected to thinning from below (TFB) and thinning from above (TFA).
Forests 15 01588 g005
Figure 6. Ordinal prediction models for the yield probability of sawn timber strength classes in dependence of select visual criteria: (a) the ratio of knot clusters, (b) the Fiber angle, (c) the growth ring width, (d) warp and (e) the ratio of compression wood in sample boards.
Forests 15 01588 g006
Figure 7. Effect plots of a CLM including the statistically significant factors of CLM 5 with (a) the tree height, (b) the height-diameter ratio, (c) the crown base height, (d) silviculture and (e) the water supply indication.
Forests 15 01588 g007
Table 1. Stand descriptions of six study sites in the Rothaar Mountains (stands 1 to 3) and the Harz Mountains (stands 4 to 6).
Stand123456
Age (years)444183808039
Thinning SystemTFBTFATFBTFATFBTFA
Slope 1NNNW-WNSS
Altitude (m)450–520450–490430–520551–600501–550551–600
Basal area (m2∙ha−1)37.634.137.237.128.335
Mean height (m)21.625.329.833.828.220.5
Mean Diameter at Breast Height (cm)26.928.532.346.342.428.6
Soil conditionMesotrophicMesotrophicMesotrophicMesotrophicMesotrophicMesotrophic
Water supplyModerately FreshModerately FreshModerately FreshFreshFreshFresh
Last Thinning
(m3∙ha−1 ∙year−1)
-
(-)
59
(2012)
71
(2012)
12.7
(2018)
25.9
(2014)
41.3
(2014)
1 N: Northward slope; NW-W: Northwest-Westward slope; S: Southward slope.
Table 2. Overview of the mechanical properties of sample boards in dependence of stand with letters indicating statistically significant groupings determined by Games–Howell pairwise comparison or one-way ANOVA where applicable.
Stand 123456NormalityVariance
Mechanical properties Shapiro–Wilk Levene’s Test
ρ b,cb,cacbc>0.920.02
x ¯ 440.35432.80530.15402.85453.73400.30
MoRb,cb,cabbc>0.060.42
x ¯ 35.5132.5348.8234.6937.1121.52
MoE gb,cb,cacbd>0.150.01
x ¯ 12,081.1211,478.8716,802.3710,958.2813,298.287631.91
ρ : wood density at 12% wood moisture; MoR: modulus of rupture; MoE g: global modulus of elasticity.
Table 3. Effect strengths of independent variables of tree anatomy on the mean of visual board criteria in sampled tree individuals. Results of linear mixed models with age as random grouping factor.
Effect StrengthEstimatorsf.e.r.e.Correlation Coefficients
Visual CriteriaCBCRTHR2mR2cCBCRTHHDR
SK0.0060.0540.0020.210.28−0.110.340.14−0.29
KC−0.0010.0050.0110.060.57−0.18−0.14−0.230.21
FA0.0020.003 0.020.160.05−0.04−0.31−0.18
GRW0.0300.386 0.040.22−0.080.12−0.23−0.36
TW−1.4 × 10−54.3 × 10−5 0.010.06−0.04−0.03−0.010.04
CW−0.005−0.009−0.0010.010.33−0.030.280.35−0.22
SK: single knot ratio; KC: knot cluster ratio; FA: fiber angle; GRW: growth ring width; TW: torsion warp; CW: compression wood; CB: crown base height; CR: crown radius; TH: tree height; HDR: height–diameter ratio.
Table 4. Relationships between mechanical properties and visual grading criteria in the form of correlation coefficients, multiple linear regression, and cumulative link models.
CorrelationsSKKCFAGRWTWCWMoEMoRQuadratic Model adj. R2
MoE−0.29−0.34−0.20−0.48−0.490.03 0.54
MoR−0.27−0.32−0.18−0.41−0.330.100.79 0.40
Density−0.15−0.18−0.09−0.32−0.30.220.650.51
CLMCoefficients R2 Nagelkerke
Strength class0.88−1.65−4.41−0.41−168.53 0.27
reject|C16C16|C24C24|C30
thresholds−4.47−2.25−1.64
SK: single knot ratio; KC: knot cluster ratio; FA: fiber angle; GRW: growth ring width; TW: torsion warp; CW: compression wood; MoE: modulus of elasticity; MoR: modulus of rupture.
Table 5. Comparative evaluation of CLM models for the prediction of strength classes depending on site and tree characteristics.
Pr(>|z|)HDRCBTHWS.freshSilv.TFBCSAICLikelihood Ratio Test
CLM 10.026 311.26-
CLM 20.0810.004 304.610.003
CLM 30.0140.0010.019 301.040.018
CLM 40.8170.0020.0070.057 299.270.052
CLM 50.4190.7190.0000.0160.000 275.880.000
CLM 60.3830.4340.0230.0180.0000.554257.840.552
AIC is distorted by missing values in the data of the crown surface
CLM 5
Estimators
−0.01−0.020.17−1.202.58
Thresholdreject|C16C16|C24C24|C30 R2Np value
Coefficients1.514.14.9 0.352.6 × 10−9
HDR: height–diameter ratio; CB: crown base height; TH: tree height; WS: water supply; Silv: silvicultural system; CS: crown surface area; AIC: Akaike information criterion.
Disclaimer/Publisher’s Note: The statements, opinions and data contained in all publications are solely those of the individual author(s) and contributor(s) and not of MDPI and/or the editor(s). MDPI and/or the editor(s) disclaim responsibility for any injury to people or property resulting from any ideas, methods, instructions or products referred to in the content.

