
Conservation and Avoided Deforestation: Evidence from Protected Areas of Tanzania


 ,
,
Abstract
:1. Introduction
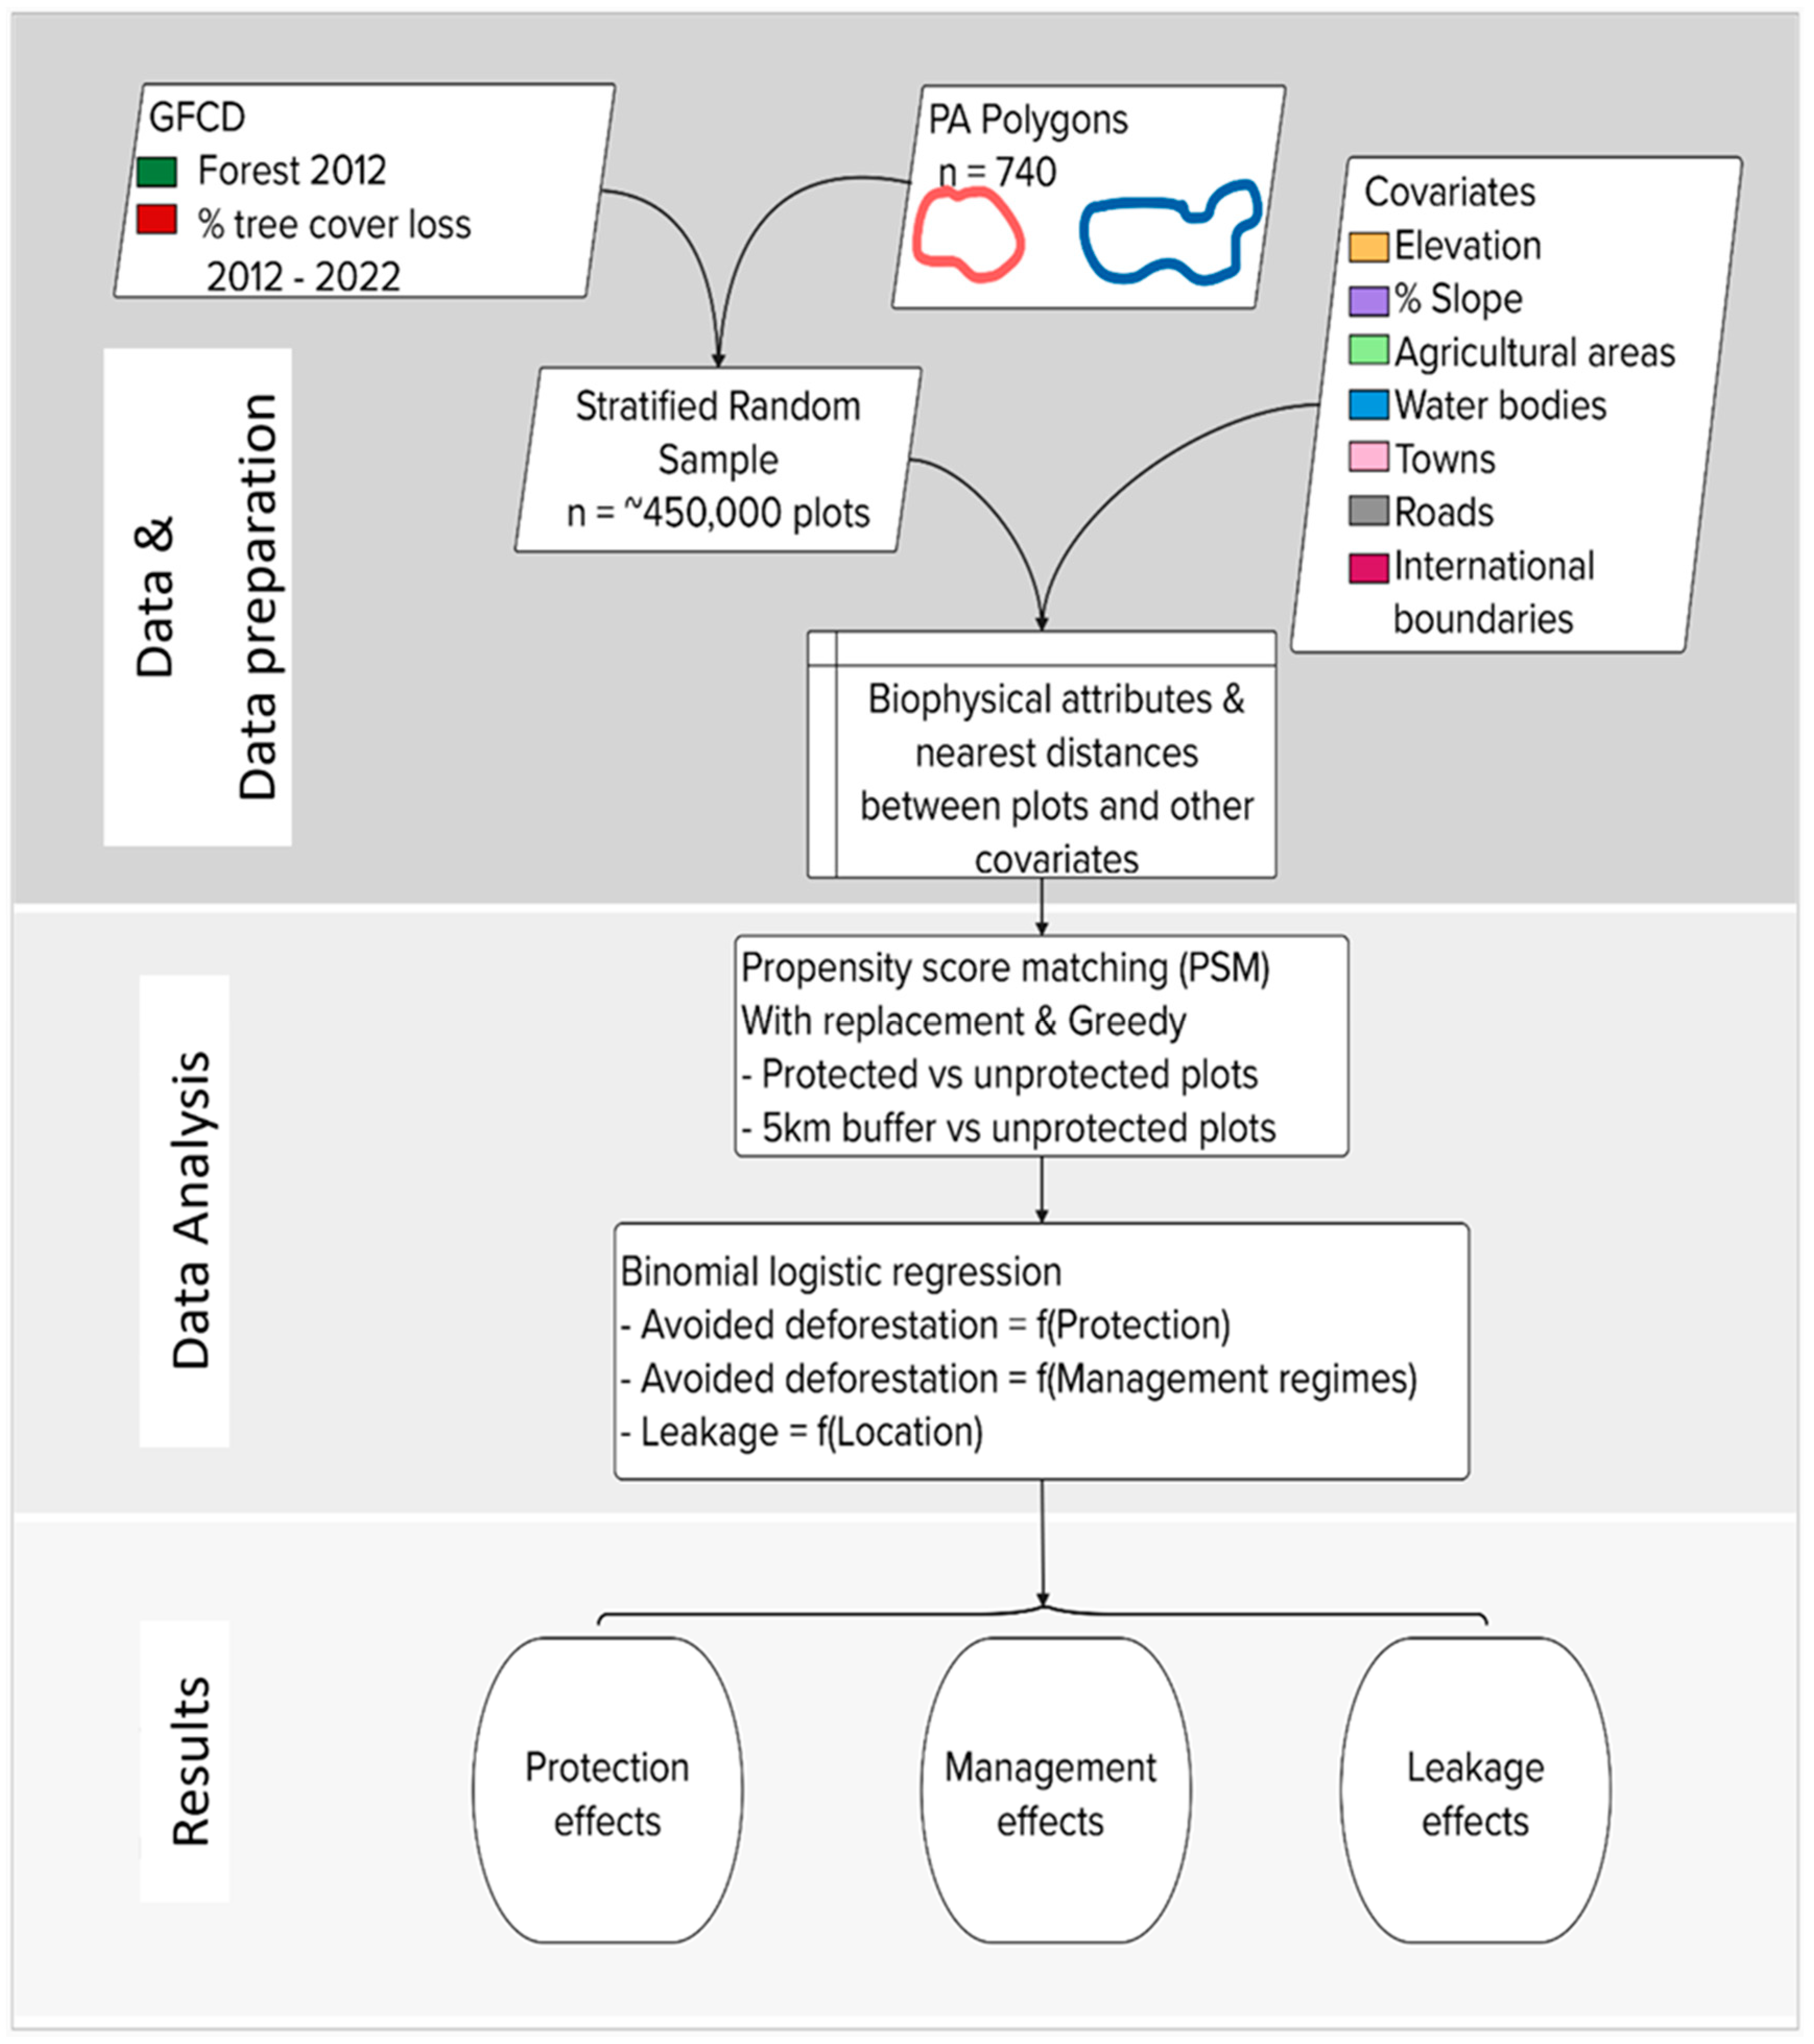
2. Methodology
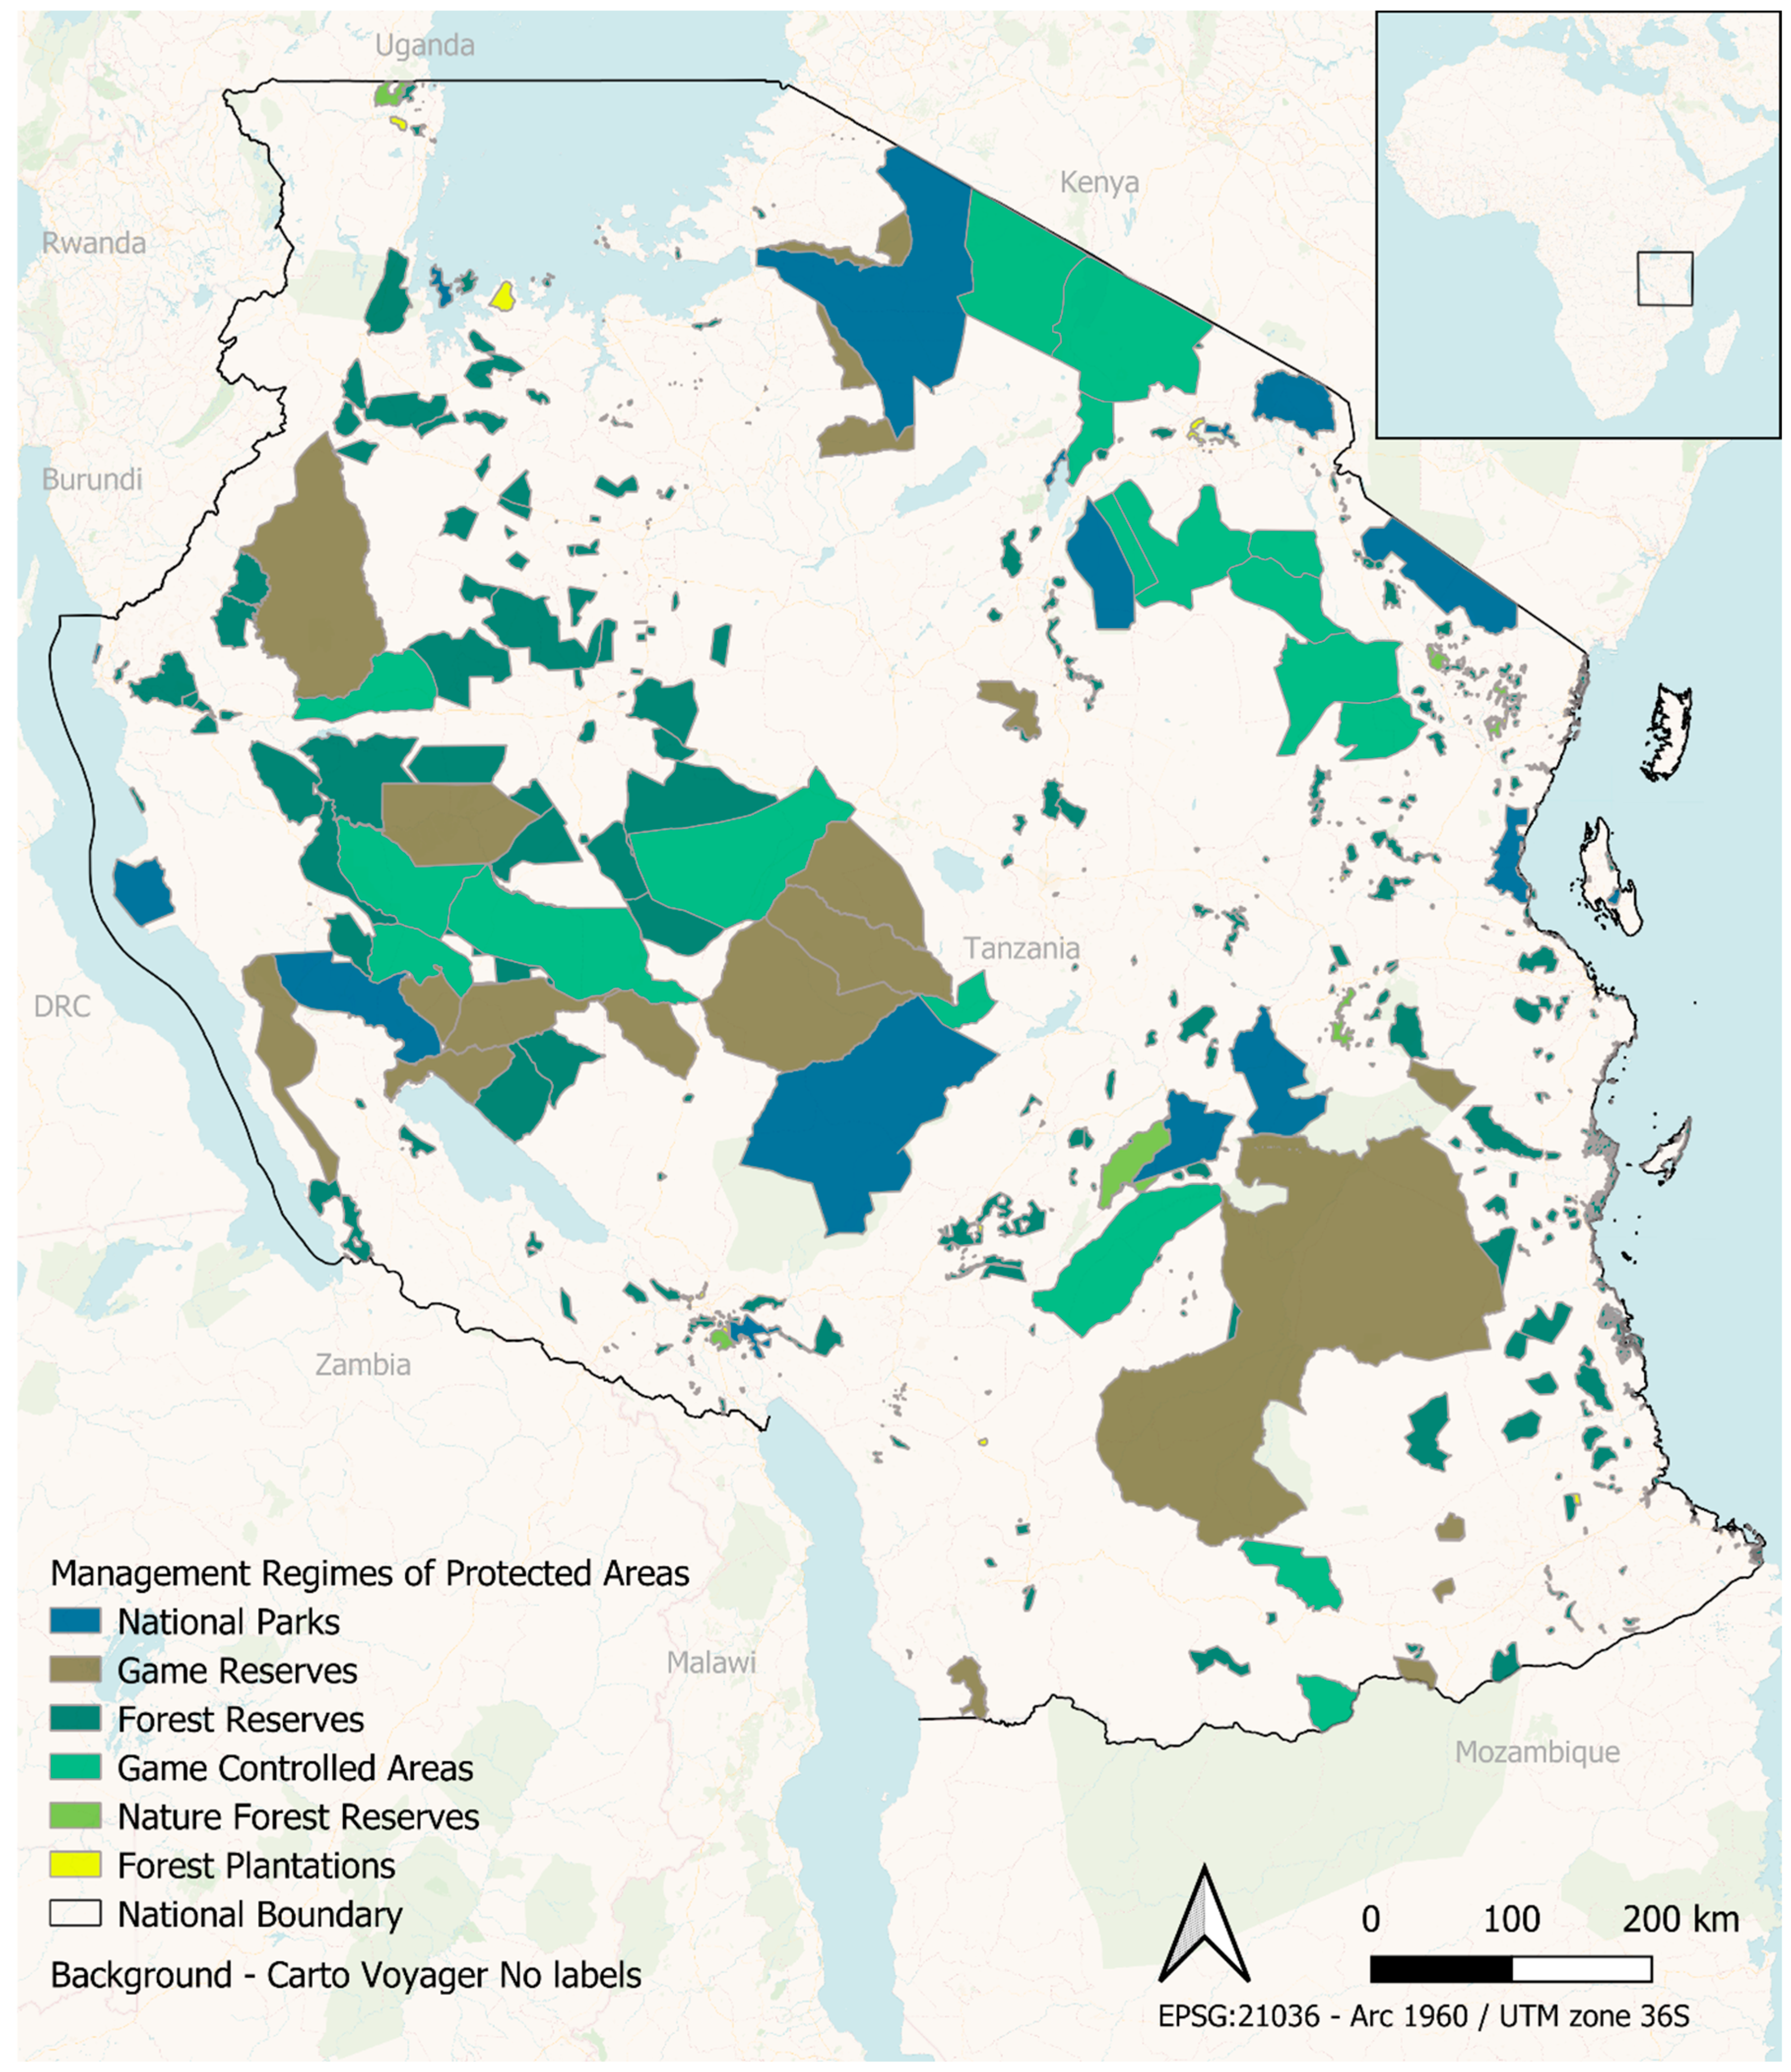
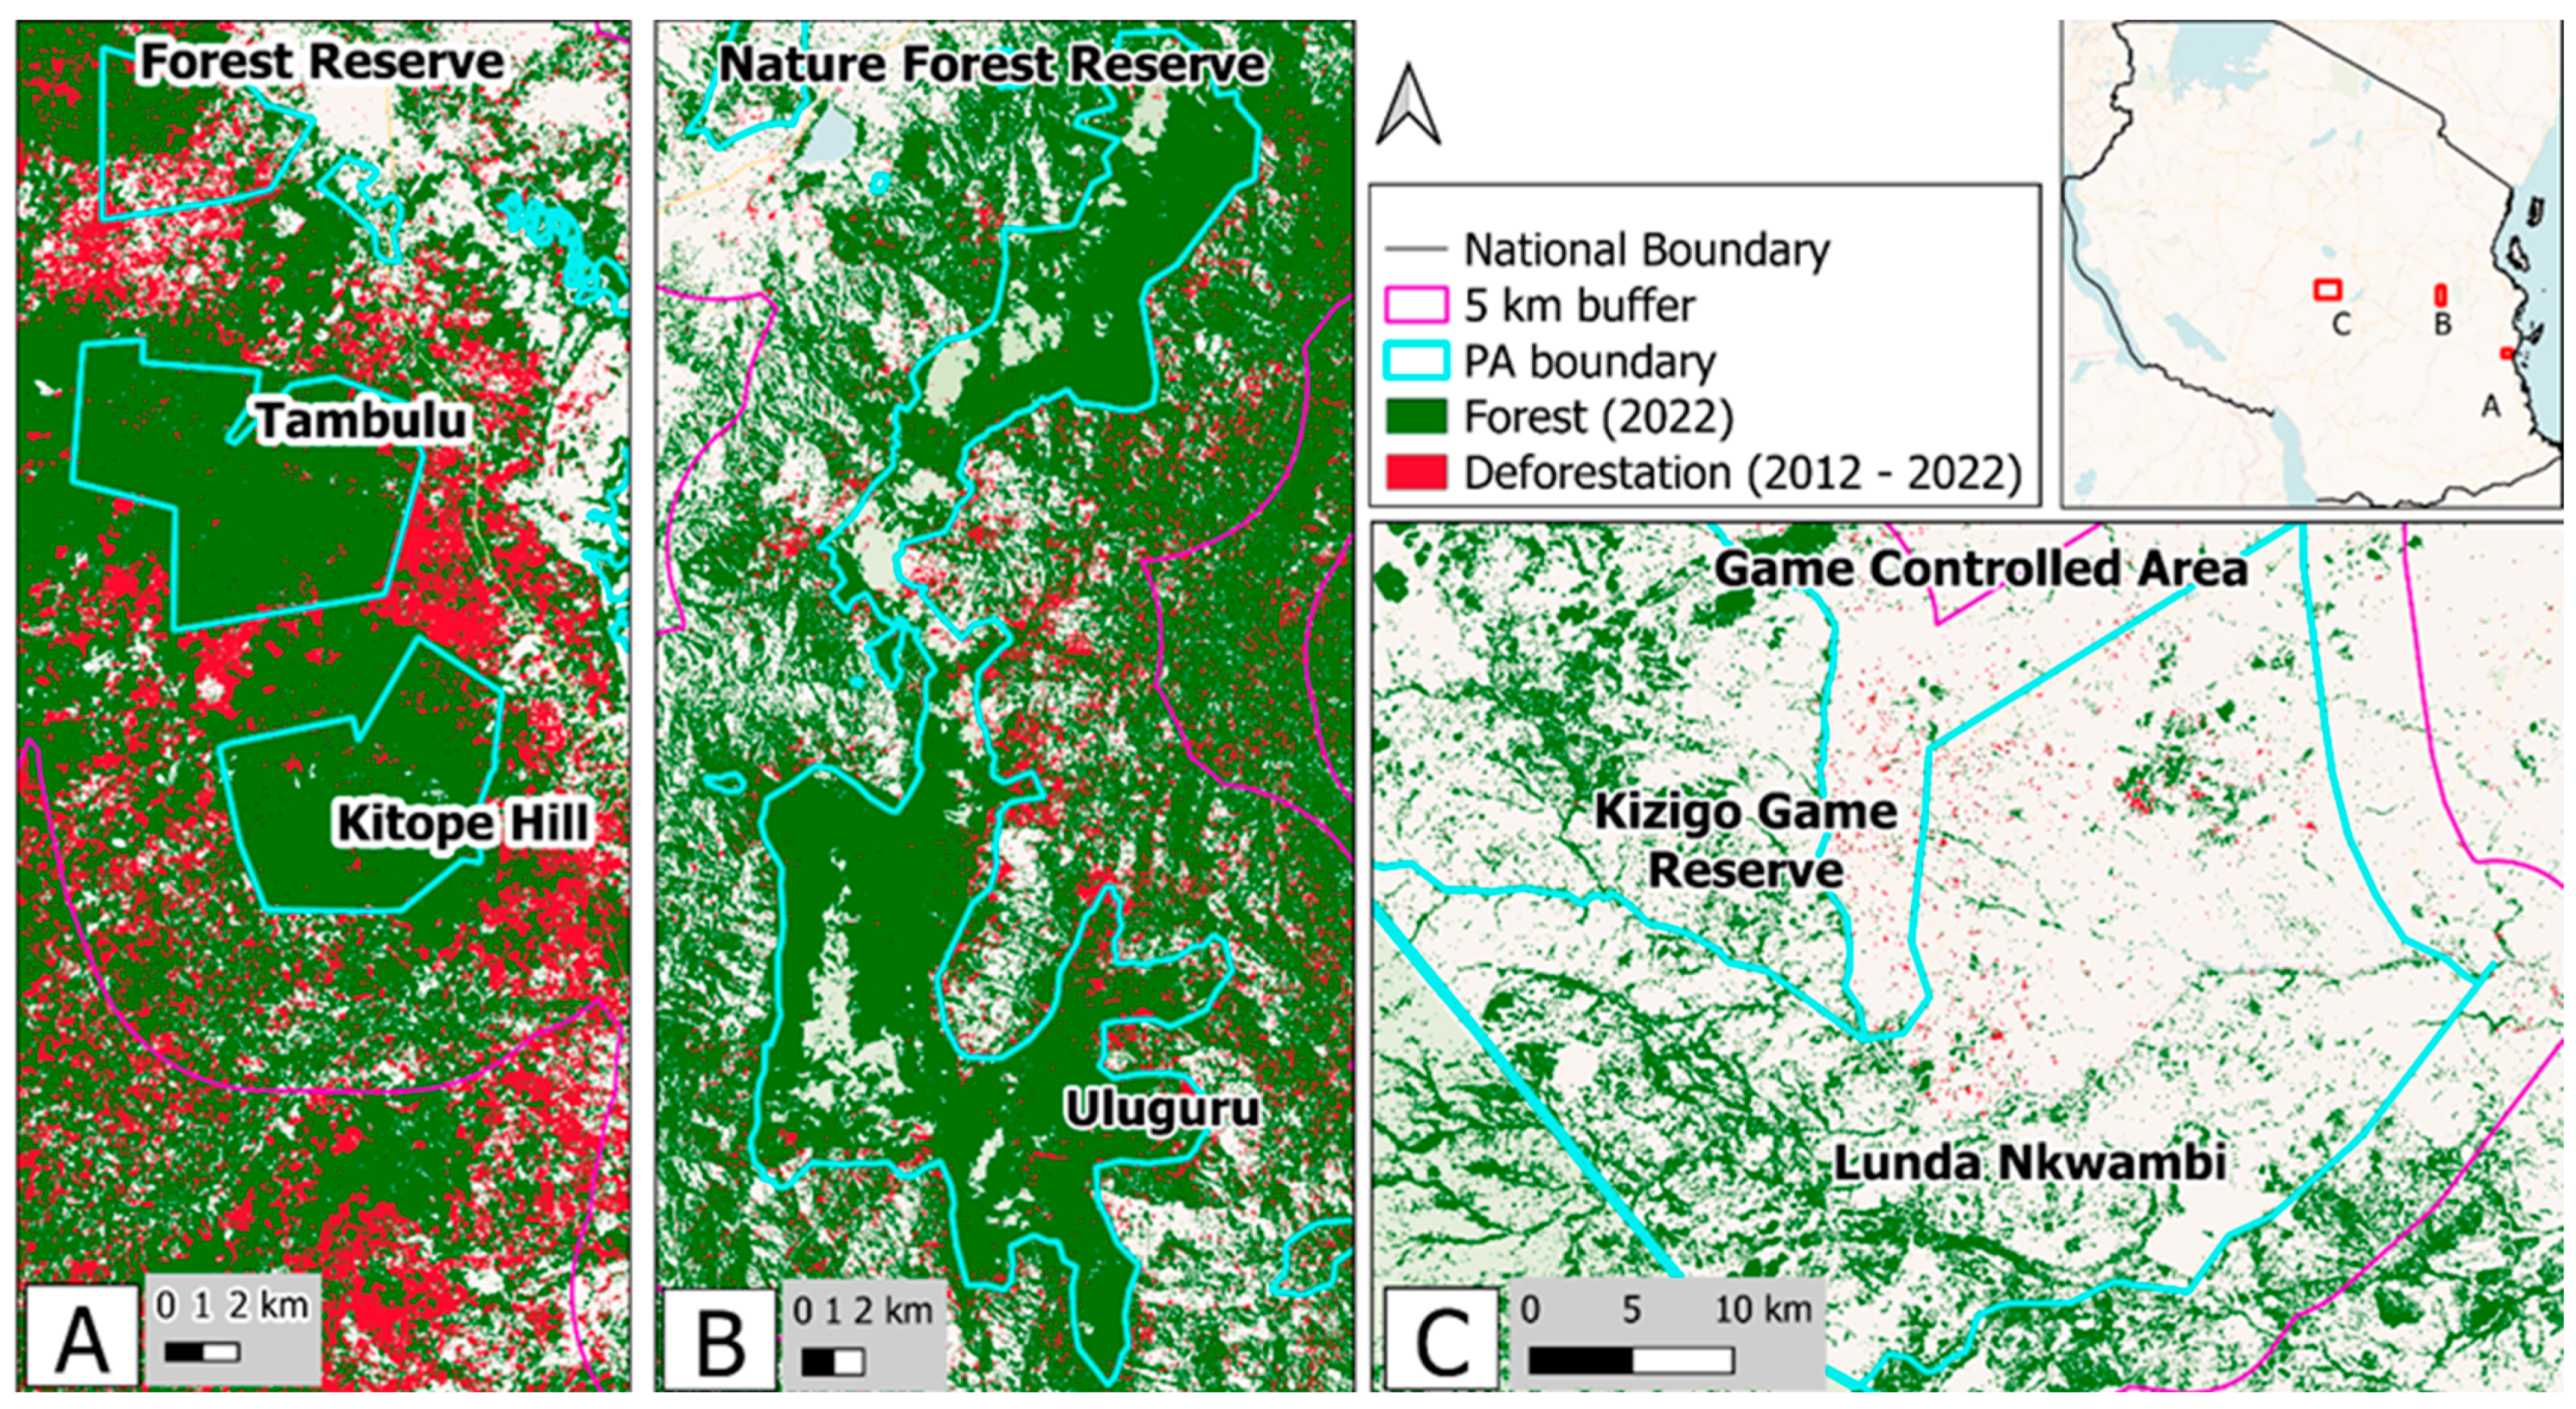
2.1. Study Area
2.2. Data and Sampling
2.2.1. Spatial Data on Forests and Deforestation
2.2.2. Sampling and Sample Plots
2.2.3. Covariate Data for Propensity Score Matching (PSM)
2.2.4. Data Limitations
2.3. Data Analysis
2.3.1. Propensity Score Matching
2.3.2. Logistic Modeling, Log Odds of Avoided Deforestation, and the Odds Ratios
- (i)
- A model for an overall protection effect: To assess the overall protection effect, we fitted a binomial logit model (Equation (1)) with a binary response variable—Avoided Deforestation (AD), and a binary predictor representing Treatment (T), indicating whether a forest area was Protected or Unprotected. The purpose is to estimate the change in the odds of avoiding deforestation due to protection compared with unprotected forests.
- (ii)
- Effectiveness of the PA management regimes compared with no protection: To evaluate the effectiveness of the PA management regimes compared with unprotected forest areas, we specified a logit model (Equation (2)). In Equation (2), the response variable was Avoided Deforestation (AD), with a binary outcome, i.e., (AD = 1 if deforestation was avoided; AD = 0 deforestation occurred). The predictor variable was categorical with six levels, representing the five management regimes (NP, GR, FR, NFR, GCA) (see Table 1) and the reference category Unprotected Forests (UF).
- (iii)
- Comparing the effectiveness of the five PA management regimes: After evaluating the effectiveness of each management regime compared with the unprotected forests (UF), we further compared the effectiveness between any two management regimes, using the odds ratio. First, we fitted five additional logit models similar to Equation 1, but each with a different management regime (NP, GR, FR, NFR, and GCA) as the reference category. The resulting coefficients allowed us to calculate the odds ratio between any two management regimes to compare their effectiveness in avoiding deforestation.
- (iv)
- Assessment of Leakage: To assess evidence of leakage, we fitted a logit model (Equation (3)) with a binary response variable (D = 1 if Deforested, D = 0 if not deforested) and a binary predictor representing location (L = 1 if inside buffer areas, L = 0 if in the unprotected forest areas beyond the buffer). Equation (3) estimated the log odds of deforestation within the buffer areas compared with unprotected areas outside the buffer areas.
- (v)
- Computing and interpreting the Odds Ratios (OR). Equations (1)–(3) above estimate the coefficients corresponding to the log odds of avoided deforestation. However, for a more intuitive comparison of the effectiveness of protection against no protection, a quantitative comparison of the different management regimes, or assessing leakage, we calculated the odds ratio (OR). The OR is computed as OR = exp(βi), where βi is the slope coefficient for the predictor variable (s) in each equation. For interpretation of the OR values, for instance, an OR > 1 indicates higher odds of avoided deforestation compared with the reference category. The computation of ORs also generates a Wald Confidence Interval (WCI). The WCIs were used to assess the statistical significance of each OR. Accordingly, confidence intervals that do not include 1 were considered statistically significant.
3. Results
3.1. The Overall Effect of Protection
3.2. Effectiveness of PA Management Regimes Compared with Unprotected Areas
3.3. Differences between Pairs of Management Regimes
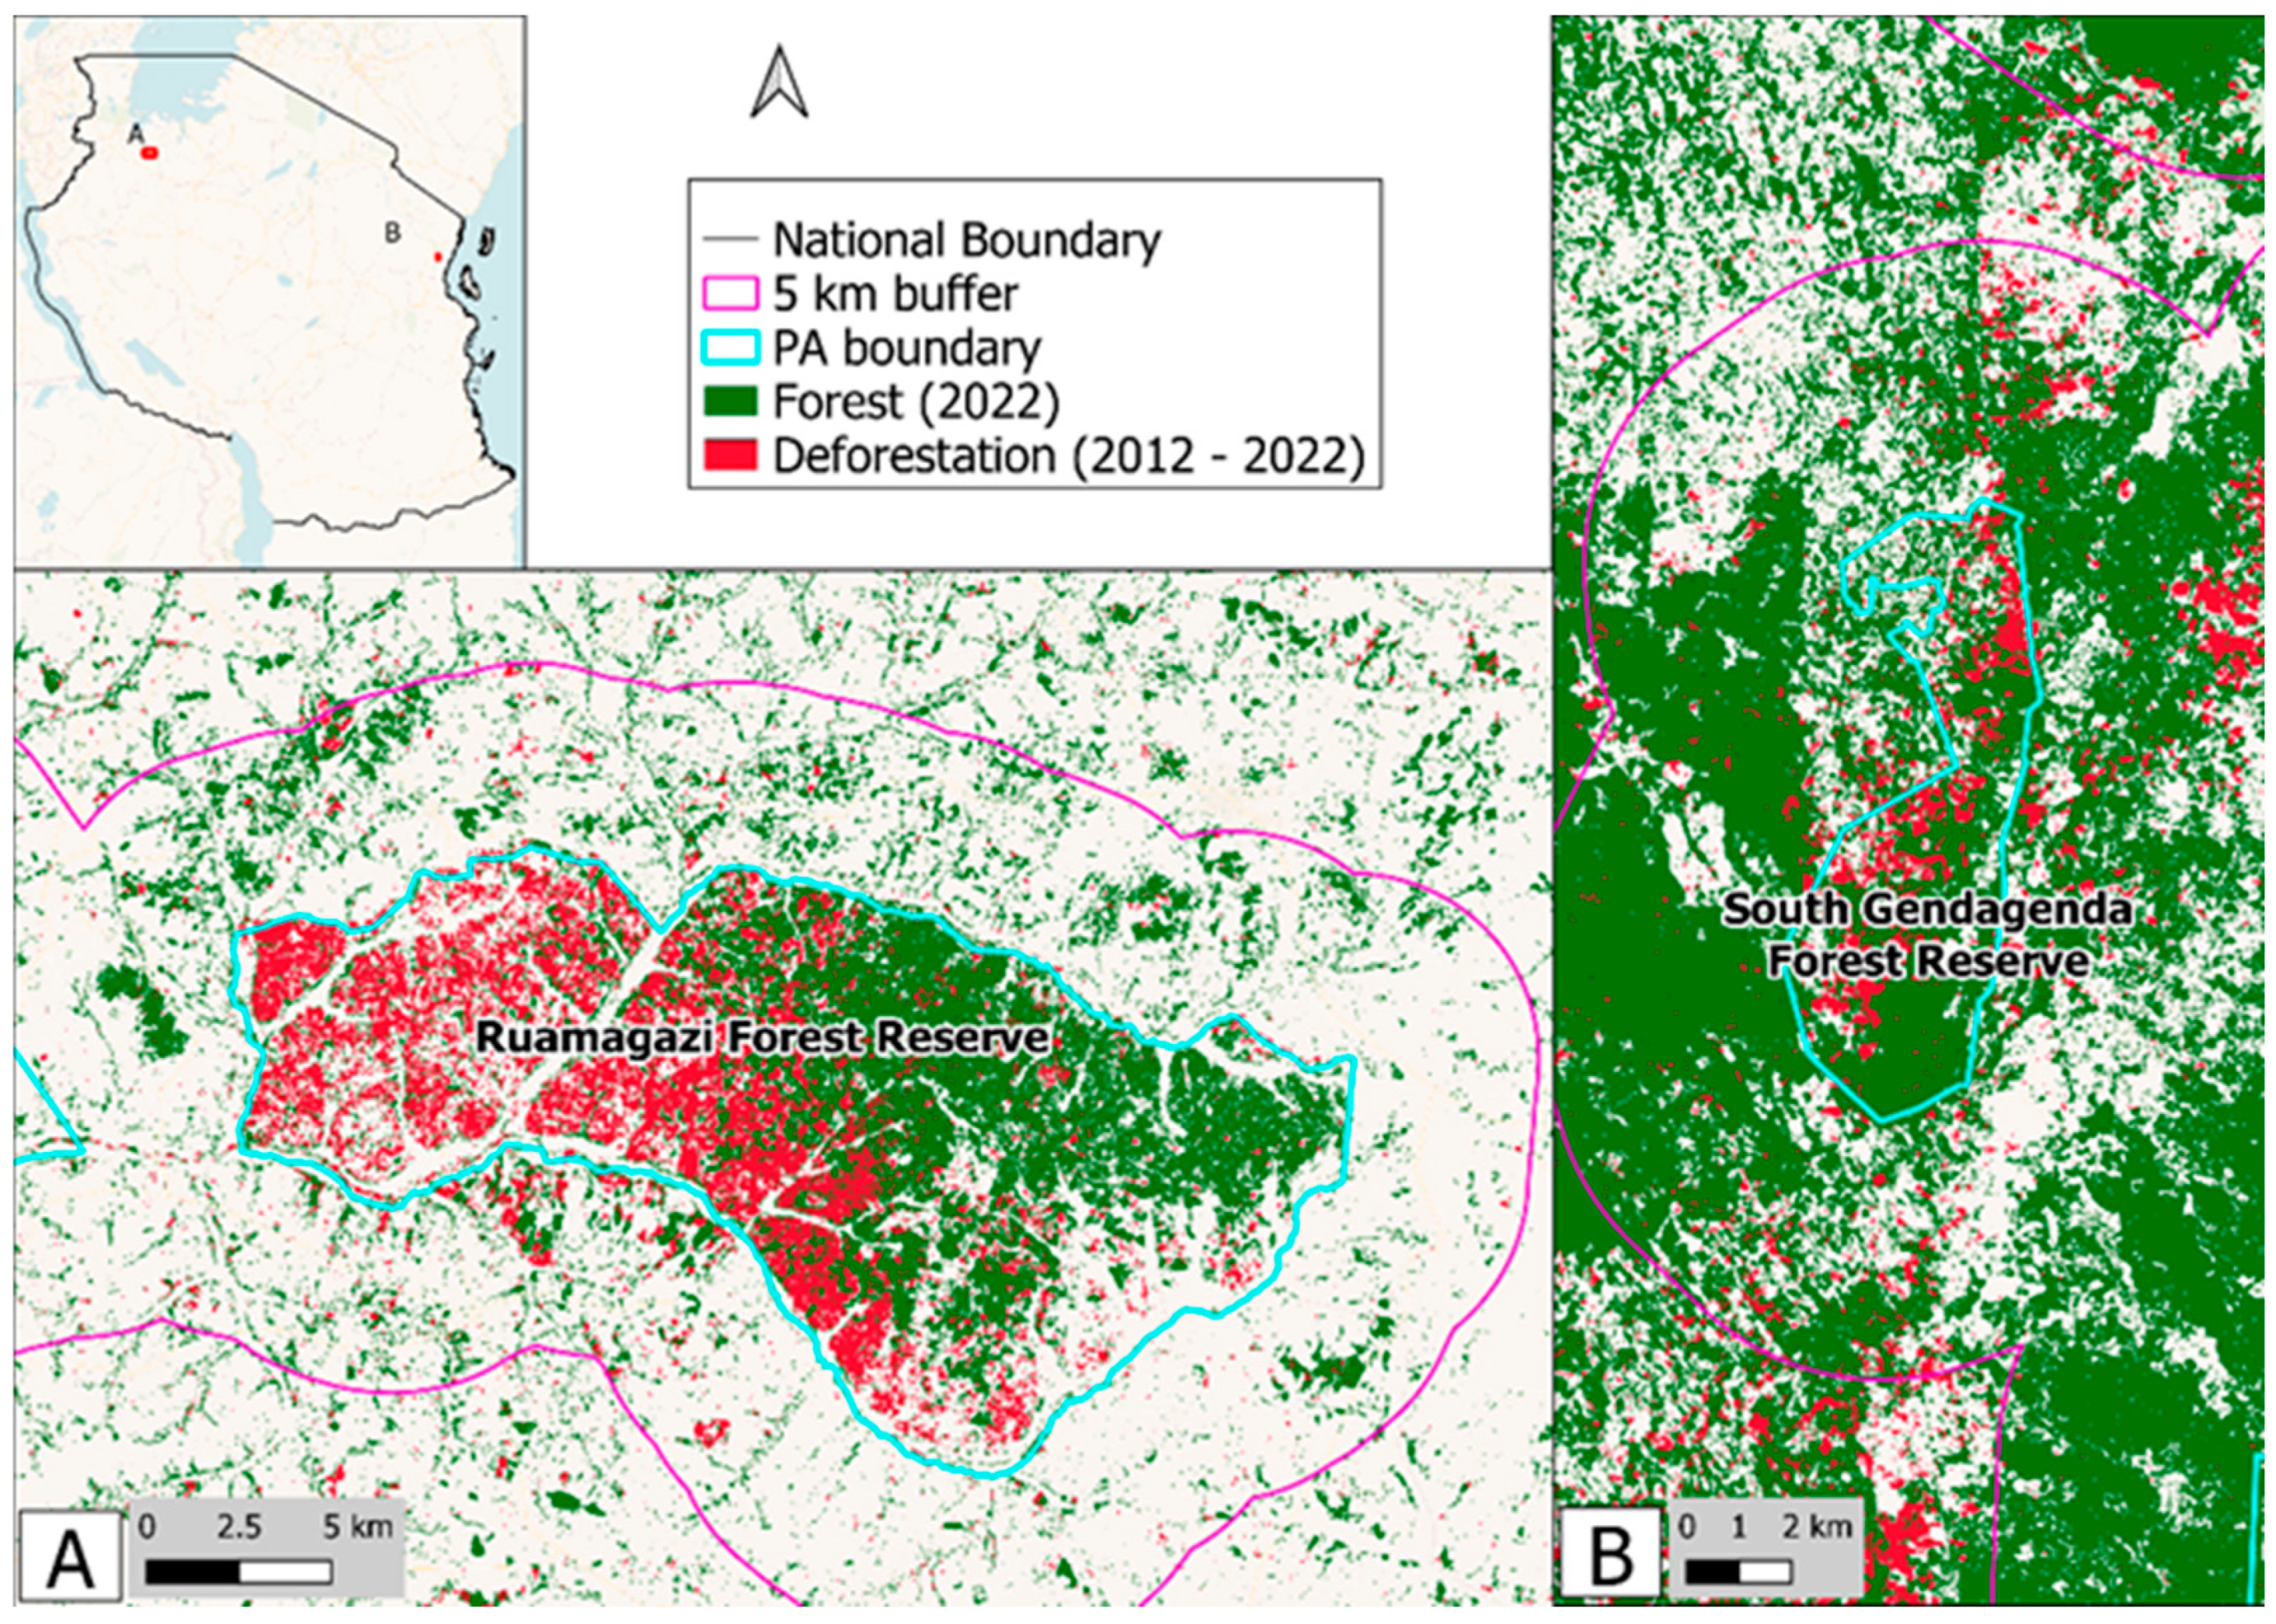
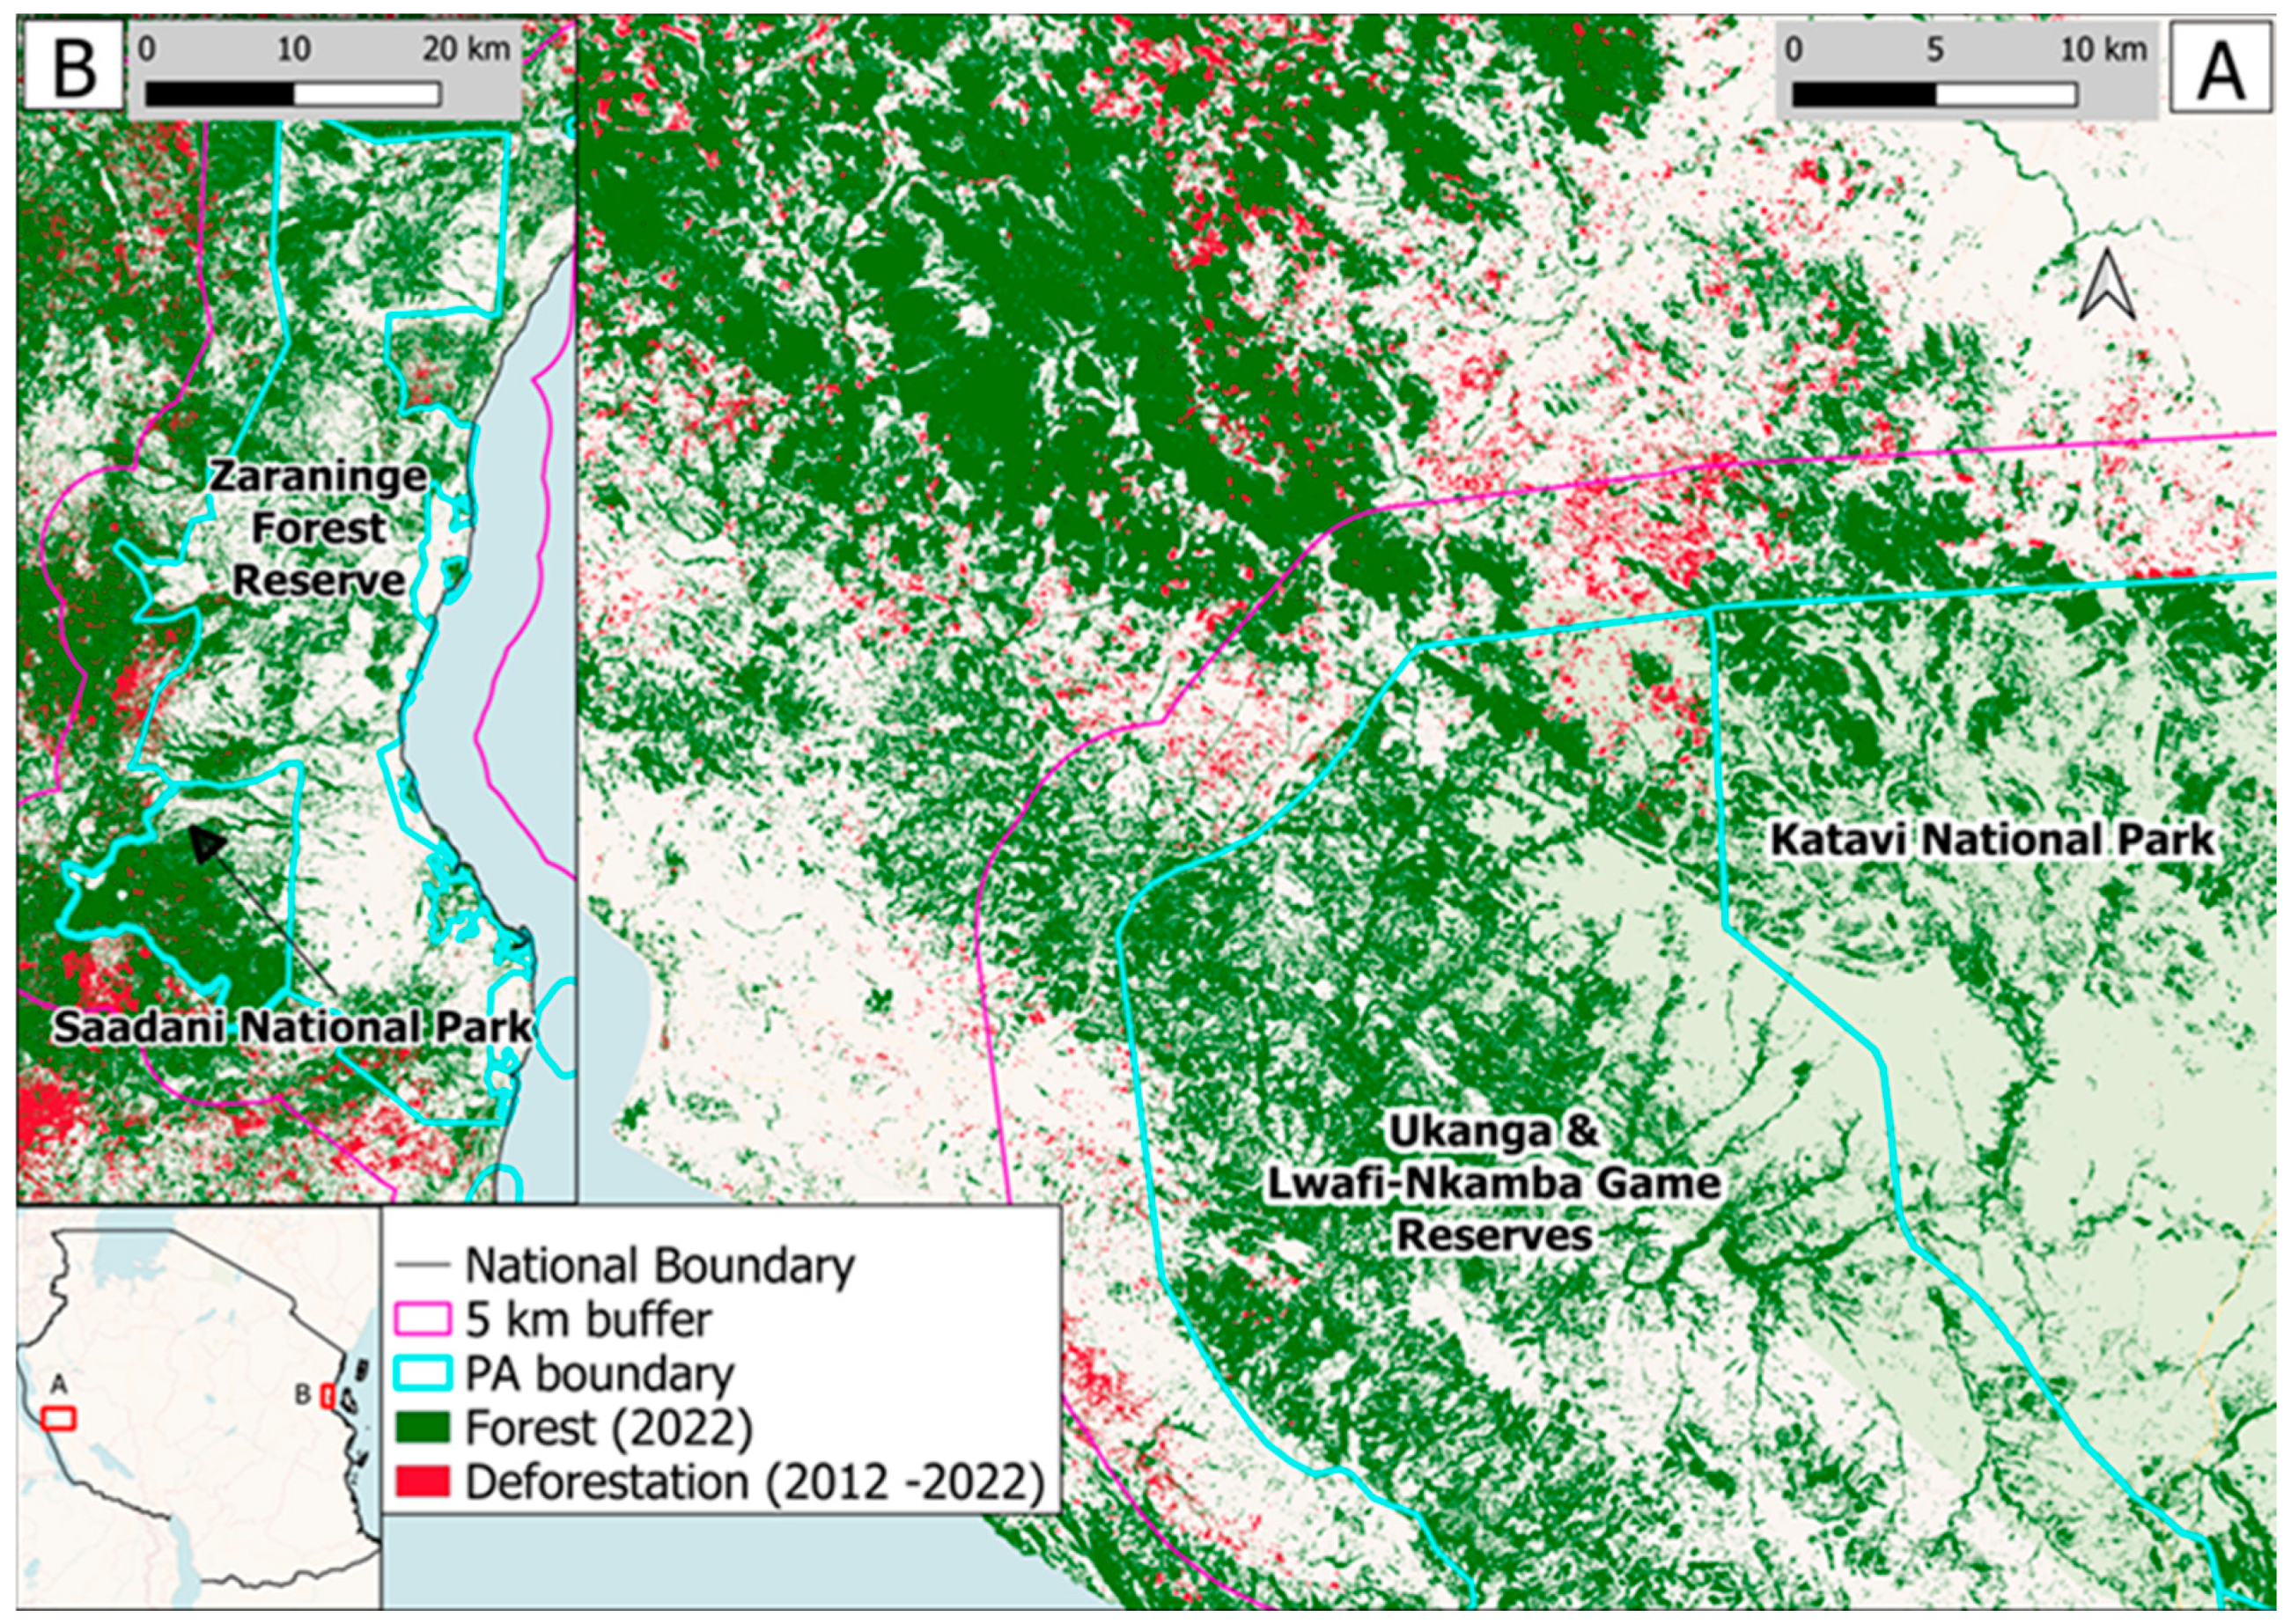
3.4. Evidence of Leakage
4. Discussion
4.1. Conservation Outcomes Are Positive Despite Continued Deforestation
4.2. Management Regimes Presented Variable Effectiveness
4.3. Limited Evidence of Deforestation Displacement
4.4. Implications to Climate and Biodiversity Objectives
5. Summary and Conclusions
Author Contributions
Funding
Data Availability Statement
Acknowledgments
Conflicts of Interest
References
- Pendrill, F.; Gardner, T.A.; Meyfroidt, P.; Persson, U.M.; Adams, J.; Azevedo, T.; Lima, M.G.B.; Baumann, M.; Curtis, P.G.; De Sy, V.; et al. Disentangling the numbers behind agriculture-driven tropical deforestation. Science 2022, 377, abm9267. [Google Scholar] [CrossRef] [PubMed]
- IUCN. Protected Planet: The World Database on Protected Areas (WDPA) and World Database on Other Effective Area-Based Conservation Measures (WD-OECM), August 2022, Cambridge, UK: UNEP-WCMC and IUCN. Available online: www.protectedplanet.net (accessed on 5 January 2023).
- UNEP. United Nationas Environment Programme. Conference of the Parties to the Convention on Biological DiversitY. Kunming-Montreal Global Biodiversity Framework Draft Decision Submitted by the President. CBD/COP/15/L.25; UNEP—United Nationas Environment Programme, Montreal Canada. 2022. Available online: https://www.cbd.int/doc/c/e6d3/cd1d/daf663719a03902a9b116c34/cop-15-l-25-en.pdf (accessed on 22 December 2022).
- UNFCCC. Adoption of the Paris Agreement. Draft Decision-/CP.21. Conference of the Parties Twenty-First Session Paris, 30 November to 11 December 2015. Available online: http://unfccc.int/resource/docs/2015/cop21/eng/l09.pdf (accessed on 29 December 2015).
- World Bank. Terrestrial Protected Areas (% of Total Land Area). 2022. Available online: https://data.worldbank.org/indicator/ER.LND.PTLD.ZS (accessed on 19 January 2023).
- United Nations. Transforming Our World: The 2030 Agenda for Sustainable Development. United Nations Department of Economic and Social Affairs. 2015. Available online: https://sustainabledevelopment.un.org/post2015/transformingourworld (accessed on 18 April 2024).
- Ract, C.; Burgess, N.D.; Dinesen, L.; Sumbi, P.; Malugu, I.; Latham, J.; Anderson, L.; Gereau, R.E.; de Lima, M.G.; Akida, A.; et al. Nature Forest Reserves in Tanzania and their importance for conservation. PLoS ONE 2024, 19, e0281408. [Google Scholar] [CrossRef] [PubMed] [PubMed Central]
- Burgess, N.D.; Loucks, C.; Stolton, S.; Dudley, N. The potential of forest reserves for augmenting the protected area network in Africa. Oryx 2007, 41, 151–159. [Google Scholar] [CrossRef]
- Liang, M.Y.; Gonzalez-Roglich, M.; Roehrdanz, P.; Tabor, K.; Zvoleff, A.; Leitold, V.; Silva, J.; Fatoyinbo, T.; Hansen, M.; Duncanson, L. Assessing protected area’s carbon stocks and ecological structure at regional-scale using GEDI lidar. Glob. Environ. Chang. 2023, 78, 102621. [Google Scholar] [CrossRef]
- Gizachew, B.; Rizzi, J.; Shirima, D.D.; Zahabu, E. Deforestation and Connectivity among Protected Areas of Tanzania. Forests 2020, 11, 170. [Google Scholar] [CrossRef]
- Ntiyakunze, M.S.; Stage, J. Forest dependence in Tanzania: Analysis of the determinants of perceived forest dependence. Trees For. People 2022, 8, 100277. [Google Scholar] [CrossRef]
- Doggart, N.; Morgan-Brown, T.; Lyimo, E.; Mbilinyi, B.; Meshack, C.K.; Sallu, S.M.; Spracklen, D.V. Agriculture is the main driver of deforestation in Tanzania. Environ. Res. Lett. 2020, 15, 034028. [Google Scholar] [CrossRef]
- The United Republic of Tanzania. Tanzania’s Forest Reference Emission Level Submission to the UNFCCC. 2017. Available online: https://redd.unfccc.int/media/2017_submission_frel_tanzania.pdf (accessed on 4 April 2024).
- Atmadja, S.; Verchot, L. A review of the state of research, policies and strategies in addressing leakage from reducing emissions from deforestation and forest degradation (REDD+). Mitig. Adapt. Strateg. Glob. Chang. 2012, 17, 311–336. [Google Scholar] [CrossRef]
- World Meteorological Organization. Land Use, Land-Use Change, and Forestry: A Special Report of the Intergovernmental Panel on Climate Change; Watson, R.T., Nolin, I.R., Bolin, B., Eds.; Cambridge University Press: Cambridge, UK, 2000. [Google Scholar]
- Fuller, C.; Ondei, S.; Brook, B.W.; Buettel, J.C. First, do no harm: A systematic review of deforestation spillovers from protected areas. Glob. Ecol. Conserv. 2019, 18, e00591. [Google Scholar] [CrossRef]
- Jusys, T. Quantifying avoided deforestation in Para: Protected areas, buffer zones and edge effects. J. Nat. Conserv. 2016, 33, 10–17. [Google Scholar] [CrossRef]
- Oestreicher, J.S.; Benessaiah, K.; Ruiz-Jaen, M.C.; Sloan, S.; Turner, K.; Pelletier, J.; Guay, B.; Clark, K.E.; Roche, D.G.; Meiners, M.; et al. Avoiding deforestation in Panamanian protected areas: An analysis of protection effectiveness and implications for reducing emissions from deforestation and forest degradation. Glob. Environ. Chang. 2009, 19, 279–291. [Google Scholar] [CrossRef]
- Vuohelainen, A.J.; Coad, L.; Marthews, T.R.; Malhi, Y.; Killeen, T.J. The Effectiveness of Contrasting Protected Areas in Preventing Deforestation in Madre de Dios, Peru. Environ. Manag. 2012, 50, 645–663. [Google Scholar] [CrossRef]
- Wittemyer, G.; Elsen, P.; Bean, W.T.; Burton, A.C.O.; Brashares, J.S. Accelerated human population growth at protected area edges. Science 2008, 321, 123–126. [Google Scholar] [CrossRef] [PubMed]
- Green, J.M.H.; Larrosa, C.; Burgess, N.D.; Balmford, A.; Johnston, A.; Mbilinyi, B.P.; Platts, P.J.; Coad, L. Deforestation in an African biodiversity hotspot: Extent, variation and the effectiveness of protected areas. Biol. Conserv. 2013, 164, 62–72. [Google Scholar] [CrossRef]
- Hansen, M.C.; Potapov, P.V.; Moore, R.; Hancher, M.; Turubanova, S.A.; Tyukavina, A.; Thau, D.; Stehman, S.V.; Goetz, S.J.; Loveland, T.R.; et al. High-Resolution Global Maps of 21st-Century Forest Cover Change. Science 2013, 342, 850–853. [Google Scholar] [CrossRef]
- Andam, K.S.; Ferraro, P.J.; Pfaff, A.; Sanchez-Azofeifa, G.A.; Robalino, J.A. Measuring the effectiveness of protected area networks in reducing deforestation. Proc. Natl. Acad. Sci. USA 2008, 105, 16089–16094. [Google Scholar] [CrossRef]
- Tachikawa, T.; Kaku, M.; Iwasaki, A.; Gesch, D.B.; Oimoen, M.J.; Zhang, Z.; Danielson, J.J.; Krieger, T.; Curtis, B.; Haase, J.; et al. Characteristics of ASTER GDEM version 2. In Proceedings of the 2011 IEEE International Geoscience and Remote Sensing Symposium, Vancouver, BC, Canada, 24–29 July 2011. [Google Scholar]
- Danielsson, P.E. Euclidean Distance Mapping. Comput. Vis. Graph 1980, 14, 227–248. [Google Scholar] [CrossRef]
- RCMRD. Tanzania Land Cover 2010 Scheme II. 2015. Available online: http://geoportal.rcmrd.org/layers/servir%3Atanzania_landcover_2010_scheme_ii (accessed on 1 March 2024).
- Harvard Geospatial Library. Tanzania Towns. 2002. Available online: https://hgl.harvard.edu/catalog/harvard-africover-tz-othertowns (accessed on 1 March 2024).
- Haklay, M.; Weber, P. OpenStreetMap: User-Generated Street Maps. IEEE Pervas. Comput. 2008, 7, 12–18. [Google Scholar] [CrossRef]
- OCHA. United Republic of Tanzania—Subnational Administrative Boundaries. 2018. Available online: https://data.humdata.org/dataset/cod-ab-tza (accessed on 1 March 2024).
- Austin, P.C.; Stuart, E.A. Estimating the effect of treatment on binary outcomes using full matching on the propensity score. Stat. Methods Med. Res. 2017, 26, 2505–2525. [Google Scholar] [CrossRef]
- Mcnicol, I.M.; Keane, A.; Burgess, N.D.; Bowers, S.J.; Mitchard, E.T.A.; Ryan, C.M. Protected areas reduce deforestation and degradation and enhance woody growth across African woodlands. Commun. Earth Environ. 2023, 4, 392. [Google Scholar] [CrossRef]
- Yang, H.B.; Viña, A.; Winkler, J.A.; Chung, M.G.; Dou, Y.; Wang, F.; Zhang, J.D.; Tang, Y.; Connor, T.; Zhao, Z.Q.; et al. Effectiveness of China’s protected areas in reducing deforestation. Environ. Sci. Pollut. R 2019, 26, 18651–18661. [Google Scholar] [CrossRef] [PubMed]
- Rubin, D.B. Matched Sampling for Causal Effects; Cambridge University Press: Cambridge, UK, 2006. [Google Scholar]
- SAS Institute. SAS; Version 9.4; SAS Institute: Cary, NC, USA, 2013. [Google Scholar]
- Wooldridge, J.M. Introductory Econometrics: A Modern Approach; Cengage Learning: Boston, MA, USA, 2020. [Google Scholar]
- Langhammer, P.F.; Bull, J.W.; Bicknell, J.E.; Oakley, J.L.; Brown, M.H.; Bruford, M.W.; Butchart, S.H.M.; Carr, J.A.; Church, D.; Cooney, R.; et al. The positive impact of conservation action. Science 2024, 384, 453–458. [Google Scholar] [CrossRef] [PubMed]
- Fritz, S.; Bayas, J.C.L.; See, L.; Schepaschenko, D.; Hofhansl, F.; Jung, M.R.; Duerauer, M.; Georgieva, I.; Danylo, O.; Lesiv, M.; et al. A Continental Assessment of the Drivers of Tropical Deforestation with a Focus on Protected Areas. Front. Conserv. Sci. 2022, 3, 830248. [Google Scholar] [CrossRef]
- Wade, C.M.; Austin, K.G.; Cajka, J.; Lapidus, D.; Everett, K.H.; Galperin, D.; Maynard, R.; Sobel, A. What Is Threatening Forests in Protected Areas? A Global Assessment of Deforestation in Protected Areas, 2001–2018. Forests 2020, 11, 539. [Google Scholar] [CrossRef] [PubMed]
- Thirgood, S.; Mosser, A.; Tham, S.; Hopcraft, G.; Mwangomo, E.; Mlengeya, T.; Kilewo, M.; Fryxell, J.; Sinclair, A.R.E.; Borner, M. Can parks protect migratory ungulates? The case of the Serengeti wildebeest. Anim. Conserv. 2004, 7, 113–120. [Google Scholar] [CrossRef]
- Rosa, I.M.D.; Rentsch, D.; Hopcraft, J.G.C. Evaluating Forest Protection Strategies: A Comparison of Land-Use Systems to Preventing Forest Loss in Tanzania. Sustainability 2018, 10, 4476. [Google Scholar] [CrossRef]
- Dos Santos, S. Tanzania’s Nature Reserves. In The Arc Journal; Tanzania Forest Conservation Group: Dar Es Salaam, Tanzania, 2017; Available online: https://www.cepf.net/sites/default/files/arc-journal-issue-30.pdf (accessed on 29 April 2024).
- Ford, S.A.; Jepsen, M.R.; Kingston, N.; Lewis, E.; Brooks, T.M.; MacSharry, B.; Mertz, O. Deforestation leakage undermines conservation value of tropical and subtropical forest protected areas. Glob. Ecol. Biogeogr. 2020, 29, 2014–2024. [Google Scholar] [CrossRef]
- Ewers, R.M.; Rodrigues, A.S.L. Estimates of reserve effectiveness are confounded by leakage. Trends Ecol. Evol. 2008, 23, 113–116. [Google Scholar] [CrossRef]
- URT. The United Republic of Tanzania. Nationally Determined Contribution. Vice President’s Office. 2021. Available online: https://unfccc.int/sites/default/files/NDC/2022-06/TANZANIA_NDC_SUBMISSION_30%20JULY%202021.pdf (accessed on 6 May 2024).
- UNFCCC. United Nations Framework Convention on Climate Change. (2015). Adoption of the Paris Agreement, Article 5 (FCCC/CP/2015/L.9/Rev.1). 2015. Available online: http://unfccc.int/resource/docs/2015/cop21/eng/l09r01.pdf (accessed on 6 June 2024).
- Myers, N.; Mittermeier, R.A.; Mittermeier, C.G.; da Fonseca, G.A.B.; Kent, J. Biodiversity hotspots for conservation priorities. Nature 2000, 403, 853–858. [Google Scholar] [CrossRef]

| PA Managing Authority | PA Management Regime | Number of PAs | Area (1000 ha) |
|---|---|---|---|
| Tanzania Forest Services | Nature Forest Reserves (NFR) | 8 | 73 |
| Forest Reserves (FR) | 657 | 14,240 | |
| Forest Plantations (FP) | 23 | 5961 | |
| Tanzania Wildlife Management Authority | Game Controlled Areas (GCA) | 18 | 8256 |
| Game Reserves (GR) | 17 | 4848 | |
| Tanzania National Parks Authority | National Parks (NP) | 17 | 330 |
| Total | 740 | 33,707 |
| Covariate | Description | Source |
|---|---|---|
| Elevation | Elevation in meters above mean sea level | ASTER GDEM V2 [24] |
| Slope | Slope (%) | |
| Agricultural areas | Polygons of Farmlands in Tanzania for the period near 2012 | [26] |
| Water bodies | Shape-file of inland water bodies of Tanzania | [26] |
| Towns | Towns from The Multipurpose Africover Database for the Environmental Resources produced by the Food and Agriculture Organization of the United Nations (FAO). | [27] |
| Roads | Center line of principal roads extracted from Open Street Map. | [28] |
| International boundaries | Shape polygon of Tanzania Administrative level | [29] |
| Management Regime | Odds Ratio (Protected vs. Unprotected) | Lower 95% CI | Upper 95% CI |
|---|---|---|---|
| National Parks | 8.54 * | 7.11 | 10.32 |
| Game Reserves | 9.76 * | 8.76 | 11.16 |
| Nature Forest Reserves | 2.05 * | 1.53 | 2.76 |
| Game Controlled Areas | 2.28 * | 2.10 | 2.53 |
| Forest Reserves | 1.58 * | 1.51 | 1.66 |
| Reference Management Regime | ||||||
|---|---|---|---|---|---|---|
| Management Regime | Game Reserves | National Parks | Game Controlled Areas | Nature Forest Reserves | Forest Reserves | |
| Game Reserves | 1 | 1.14 a | 4.28 * | 4.77 * | 6.18 * | |
| National Parks | 0.87 a | 1 | 3.75 * | 4.17 * | 5.40 * | |
| Game Controlled Areas | 0.23 * | 0.27 * | 1 | 1.11 b | 1.44 * | |
| Nature Forest Reserves | 0.21 * | 0.24 * | 0.90 b | 1 | 1.30 c | |
| Forest Reserves | 0.16 * | 0.18 * | 0.69 * | 0.77 c | 1 | |
Disclaimer/Publisher’s Note: The statements, opinions and data contained in all publications are solely those of the individual author(s) and contributor(s) and not of MDPI and/or the editor(s). MDPI and/or the editor(s) disclaim responsibility for any injury to people or property resulting from any ideas, methods, instructions or products referred to in the content. |
© 2024 by the authors. Licensee MDPI, Basel, Switzerland. This article is an open access article distributed under the terms and conditions of the Creative Commons Attribution (CC BY) license (https://creativecommons.org/licenses/by/4.0/).
Share and Cite
Gizachew, B.; Shirima, D.D.; Rizzi, J.; Kukunda, C.B.; Zahabu, E. Conservation and Avoided Deforestation: Evidence from Protected Areas of Tanzania. Forests 2024, 15, 1593. https://doi.org/10.3390/f15091593
Gizachew B, Shirima DD, Rizzi J, Kukunda CB, Zahabu E. Conservation and Avoided Deforestation: Evidence from Protected Areas of Tanzania. Forests. 2024; 15(9):1593. https://doi.org/10.3390/f15091593
Chicago/Turabian StyleGizachew, Belachew, Deo D. Shirima, Jonathan Rizzi, Collins B. Kukunda, and Eliakimu Zahabu. 2024. "Conservation and Avoided Deforestation: Evidence from Protected Areas of Tanzania" Forests 15, no. 9: 1593. https://doi.org/10.3390/f15091593