Article

Response of Live Oak Regeneration to Planting Density, Fertilizer, and Mulch

by
Brianne N. Innusa
1,
Owen T. Burney
2 and
Douglass F. Jacobs
1,*
1
Department of Forestry and Natural Resources, Purdue University, West Lafayette, IN 47907, USA
2
John T Harrington Forestry Research Center, New Mexico State University, Mora, NM 87732, USA
*
Author to whom correspondence should be addressed.
Forests 2024, 15(9), 1594; https://doi.org/10.3390/f15091594
Submission received: 22 July 2024 / Revised: 5 September 2024 / Accepted: 6 September 2024 / Published: 11 September 2024

Abstract

:
Maritime forests are coastal ecosystems that stabilize coastlines, recharge aquifers, and provide protection against storm surges. The range of these forests has been decreasing due to threats such as urban expansion, clearing for agriculture, climate change, and an influx of native but competitive loblolly pine (Pinus taeda L.) from pine plantations. To restore maritime forests, southern live oak (Quercus virginiana Mill.) should be established as the dominant canopy species; however, knowledge of how to grow live oak in a restoration setting is limited. We planted southern live oak seedlings into a clearcut experimental site that was formerly a loblolly pine plantation. Our goal was to test how planting density (1, 2, or 3 m), mulch, and fertilization at planting impacted the initial growth of seedlings over the course of four growing seasons. The application of fertilizer had an initial positive effect on seedling diameter (36%) after the first growing season. The application of mulch increased seedling height in years 2 through 4 (25.6% to 22.7%), diameter in years 3 and 4 (20.9% to 19.3%), and crown width in year four (8.5%). Planting density had no consistent effect over the first four years. These results demonstrate the potential benefits of incorporating fertilizer and mulch into restoration prescriptions to promote seedling field establishment. Planting density should continue to be monitored through canopy closure for potential effects of plant facilitation. Integrating silvicultural treatments such as planting density, soil amendments, and vegetation control may inform cost-effective management recommendations for maritime forest restoration.

1. Introduction

Coastal ecosystems are subject to a wide range of stressors including sea level rise, storm surges, anthropogenic modification, wave forces, salt spray, and saltwater inundation and intrusion [1,2]. Coastal environments absorb the impacts of these stressors and create a buffer between the ocean and inland environment [3,4,5]. Since the 1960s, coastal areas of the United States have held 54% of the nation’s population [6]. Approximately 6% of the U.S. coastlines are in ‘high hazard’ areas, home to 1.3 million people and about 30,000 families below the poverty line [3]. NOAA predicts that the sea level in the southeastern United States will rise 25–35 cm in the next 30 years (2020–2050) [7]. With this, storm surges and flooding will increase and go further inland. In the southeastern U.S., the effects of storm surges and sea level changes can be mitigated by preserving and restoring ecosystems, such as maritime forests, which can protect and stabilize coastlines.
Maritime forests are one of the critical interfaces between land and sea in the U.S. The Atlantic coast maritime forests are found from North Carolina to Florida mainly on barrier islands and mainland coastlines [1,8]. These forests protect coastlines from storm surges, stabilize coasts with their root systems, recharge aquifers, and provide a home for many endemic species. Since the colonial era, the amount of maritime forests left in the U.S. has decreased, partially due to the establishment of pine plantations [1]. Many of today’s maritime forests were at one point converted to pine plantations or are situated close to plantations, with the most prominent pine species being loblolly pine (Pinus taeda L.). Because of wind dispersion and past land use, more loblolly pine exists in maritime forests today and this species is displacing the once dominant canopy species, southern live oak (Quercus virginiana Mill.). Live oak is a keystone species in maritime forests that many species depend on for food and shelter. Loblolly pine is not a stable coastal species, as it is prone to damage from hurricanes, salt spray, saltwater inundation, and southern pine beetle (Dendroctonus frontalis Zimm.). This creates an imbalance in the forest canopy with loblolly pine not providing the shelter and support the understory and wildlife need to thrive [9]. Southern live oaks thrive in these stressful coastal environments. They are resistant to aerosolized salt spray, saltwater inundation, uprooting, and hurricane damage [10,11]. The re-establishment of southern live oak as the dominant canopy species would reduce habitat fragmentation, increase species diversity, and create a more robust coastal ecosystem to protect coastlines [8,12]. However, young live oaks have slower growth rates than loblolly pine and they naturally have limited regeneration and recruitment [13]. Increases in southern pine beetle provide restoration practitioners an opportunity to clear areas of maritime forests dominated by infected loblolly pine and re-establish southern live oak. Yet, fundamental information on how to successfully regenerate southern live oak in these ecosystems is lacking.
When planting live oak, the optimal planting density to ensure growth and long-term survival is unknown. If tree seedlings are planted too close together, intra- and interspecific competition can occur, reducing growth and survival. Plant allelopathy, the process of plants producing biochemicals that hinder neighboring plant growth and survival, is one example of the effects of competition. Southern live oak is categorized in the white oak group and while the allelopathic nature of live oak is unknown, a few species in Quercus L. secrete allelopathic chemicals for intra- and interspecific competition purposes [14,15]. Intraspecific competition for nutrients and sunlight can also result in tree mortality and the allocation of more resources to height instead of diameter [16] to help maintain their position in the canopy for sunlight [17,18]. However, these stems can be more prone to breakage because they have less reactionary wood such as compression/tension wood, and this can create storm resiliency issues [19]. If trees are planted far apart, interspecific competition is more likely to occur because there is more space and available resources for competing vegetation to establish, and live oak is susceptible to overtopping without vegetation control [20]. Identification of an optimal planting density for live oak will help ensure sufficient allocation of resources to both height and diameter to limit storm damage and the occurrence of competing vegetation. Once live oaks reach a large, mature size in the canopy, competing vegetation will naturally be reduced from lower light levels and a more humid environment [21,22].
Another silvicultural technique sometimes used during regeneration is mulching, which may improve planted seedling growth by reducing competing vegetation. This is accomplished by reducing the amount of sunlight that the competing vegetation receives, thereby stunting their growth [23]. Mulching can benefit trees, such as live oak seedlings, by slowly releasing nutrients through the organic decay of the wood chips [24]. Mulching can also modify the microclimate by controlling soil temperatures, retaining soil moisture, and reducing evapotranspiration [25]. These microclimate modifications can be beneficial in sub-temperate environments, such as southern Georgia where temperatures can easily reach 32–38 °C in summer and soil moisture is depleted in sandy soils [26,27]. Adding a layer of mulch can slow rainfall/stem runoff, reduce the impact of rain droplets, and increase soil infiltration [24]. Previous studies have shown that mulched plots of grasslands can have available soil moisture reserves up to a depth of one meter, while bare plots of grasslands would have half that depth [28]. This aligns with other studies stating that soil retention, seedling survival, and seedling growth increase with the use of organic mulches [29,30]. However, wood chip mulch has potential downfalls. Wood chips generally have a high carbon-to-nitrogen (C:N) ratio meaning soil bacteria will use the soil N to break down the C in the wood chips, temporarily reducing the amount of N available to seedlings [31]. Soil N will eventually be returned to the seedlings when the bacteria die and break down, but this can negatively impact seedlings. Whether wood chip mulch positively or negatively affects live oak establishment and growth has yet to be determined.
Fertilizer at planting may also benefit the early establishment of planted trees, including live oak, by promoting rapid early growth. Trees need macronutrients in large quantities to carry out cellular functions such as energy metabolism and protein synthesis. A previous study in central Florida found that initial nitrogen (N) fertilization after planting increased live oak growth rates, while potassium (K) and phosphorous (P) applications in conjunction with N had no effect [32]. In another maritime forest restoration study, N-P-K fertilization made a positive impact on live oak growth during the first year after planting [33], helping seedlings overcome initial competing vegetation and post-planting transplant shock due to limited soil nutrients and moisture [34]. Seedlings that incur transplant shock have reduced leaf surface area, a later leaf flush, and may be suppressed by competing vegetation [35,36]. Fertilization at planting has been shown to offset transplant shock [33,34].
The goal of this experiment was to determine how live oak seedlings planted in a loblolly pine clearcut responded to planting density, mulching, and fertilizer treatments. We also wanted to understand how these treatments affect competing vegetation. We hypothesized that (i) treatments with fertilizer or mulch would result in larger live oaks than the control treatment for each of these factors, and the positive effects would be of greater magnitude when these two treatments were combined. (ii) With increasing planting density (from 3 to 1 m spacing), live oak seedlings should be taller and have a smaller diameter. Additionally, the highest density (1 m) would have the shortest competing vegetation while the lowest density (3 m) would have the tallest competing vegetation, particularly during the first years after planting. These hypotheses can be explained by the expectation that (i) mulch should suppress competing vegetation, while fertilizer would increase the availability of soil nutrients, and combined the fertilizer may compensate for the low soil nitrogen availability created by the decomposing mulch; and (ii) intense intra- and interspecific competition will result in allocation of resources to shoot growth instead of root growth, and the 1 m spacing would form a closed canopy sooner than the 3 m spacings, shading out the competing vegetation.

2. Materials and Methods

2.1. Experimental Site

This experiment was located at Cannon’s Point Preserve (N 31°15′29″ W 81°20′45″), elev. 12.8 m on St. Simons Island in Georgia. Cannon’s Point Preserve is owned and stewarded by the St. Simons Land Trust and the conservation easement is held by The Nature Conservancy. Cannon’s Point Preserve is an approximately 9.7-km long, 261-hectare peninsula with some of the last intact maritime forest on the island. Historically, the peninsula was home to a Native American village in the Late Woodland period (c. 500–1000 A.D.) and the Early/Middle Mississippian period (c. 1000–1300 A.D.). In the 18th century, the peninsula was the plantation home of John Couper, his family, and an estimated 1500 slaves. The plantation grew grapes, olives, oranges, lemons, peaches, nectarines, apricots, plums, and figs [37,38,39]. The St. Simons Land Trust bought the land in 2012 and it has since been protected as a no-take conservation easement under The Nature Conservancy.
The soil in the experimental site at Cannon’s Point Preserve is a mix of Mandarin fine sand at 0%–2% slopes, Cainhoy fine sand at 0%–5% slopes, Rutledge fine sand, and Pottsburg sand [27]. This experiment was conducted over the span of three years, 2020 to 2023. The average annual precipitation in 2020 was 104.1 mm, in 2021 was 97.5 mm, in 2022 was 103.6 mm, and in 2023 was 107.7 mm. The average annual temperature in 2020 was a high of 31.1 °C and a low of 3.3 °C; in 2021 a high of 31.7 °C, a low of 6.4 °C; in 2022 a high of 32.5 °C and a low of −1.1 °C; and in 2023 a high of 36.6 °C and a low of −3.3 °C [40].

2.2. Plant Material

The live oak seedlings for this experiment were grown at the John T Harrington Forestry Research Center, New Mexico State University, Mora, New Mexico. Seeds were collected from various live oak trees on St. Simons Island in November 2018, all within the same seed zone as the study site. These seeds were first sown in starter trays (3.81 cm × 3.81 cm × 5.72 cm) in November 2018 until their roots started to develop. They were then transplanted in February 2019 into D16 cells (5.08 cm × 17.87 cm, 262.19 mL) with a media mix of two parts peat moss, one part vermiculite, and one part perlite. The seedlings were also regularly irrigated with water and water-soluble fertilizer. The experimental site was clearcut in 2015 due to the amount of loblolly pine infested with southern pine beetle. Seedlings were transported from New Mexico to Georgia just prior to planting in March 2020 and during 16–20 March 2020, 720 one-year-old live oak container seedlings were hand planted 1 m, 2 m, and 3 m apart in a clearcut plot using Jim-Gem KBC Dibble Bars. The planting method was standardized across individual planters. Planting density was maintained on the edges with a line of buffer live oaks planted according to the treatment spacing.

2.3. Experimental Design and Treatments

The 0.61 ha clearcut experimental site was fenced prior to planting to exclude deer browse. The total fencing perimeter was 1170 m with a width of 36 m and a length of 164 m. The fence was constructed out of 2.3 m tall fencing (Tenax Co.®, Baltimore, MD, USA) attached to three 3.05 m tall metal t-posts in each of the four corners. Metal T-posts along the perimeter were spaced every 2.5 m. This experiment was established as a randomized complete block with a split-split plot design (whole plot = planting density, sub-plot = mulching, sub-sub-plot = fertilizer) (Figure 1). The 3 m density whole plots were 32 m × 48 m, the 2 m density plots were 17 m × 25 m, and the 1 m density whole plots were 10 m × 14 m. All density plots contained the sub-plot and sub-sub-plot treatments. The seedlings were planted with a perimeter of buffer seedlings to maintain planting density and interspecific seedling competition. Each treatment combination was planted with 15 seedlings in four replicate blocks (4 blocks × 3 densities (1 m, 2 m, 3 m) × 2 mulching (yes or no) × 2 fertilizer (yes or no) × 15 seedlings per treatment) = 720 total sampling unit seedlings. Immediately after planting, 30 g of controlled-release fertilizer (Osmocote® The Scotts Co., Marysville, OH, USA, 15N-9P-12K, 12–14-month release rate) was applied with a dibble bar directly adjacent to the root plug of the seedling within the designated fertilized plots. The mulch was made from onsite logging slash/woody vegetation as well as masticated magnolia (Magnolia spp.), yaupon holly (Ilex vomitoria Ait.), wax myrtle (Myrica cerifera L.), and loblolly pine from a nearby site. In the mulch treatments, 0.058 m3 of mulch was applied around each seedling within a 1 m diameter and a 5 cm thickness. The non-mulched treatment was created by raking mastication chips out of the plot and placing them into the adjacent corresponding mulching sub-plot. Competing vegetation was controlled manually just prior to planting, one year after planting, and three years after planting.
The response variables were live oak height (cm) and diameter (mm); surrounding vegetative height (cm) and percent cover (%) in years 2, 3, and 4; and nutrient concentration of live oak leaves (%). The independent variables were the 12 treatment combinations, planting densities (1 m, 2 m, 3 m), fertilizer (with or without), and mulch (with or without).

2.4. Measurements

Baseline height and diameter were measured at the time of planting in March 2020 (baseline). Seedling survival, height, and diameter were measured once a year at the end of each growing season in February 2021 (year 1), March 2022 (year 2), January 2023 (year 3), and November 2023 (year 4). Seedling height was measured from ground level to the base of the last live bud, and seedling diameter was measured at ground level. The height and diameter of the live oak seedlings were slightly skewed with the mulch treatments. During the first year, the mulch treatment raised the ground level compared to other treatments. It was speculated that the heights and diameters would be shorter and smaller, respectively. To account for this, incremental height and diameter were used by subtracting the current year from the baseline data (year X height–baseline height). Only during the last round of measurement, November 2023, average crown width was recorded in centimeters. This was done by taking the average of the north-to-south and east-to-west crown widths.
Once a year during the growing season (July 2021, June 2022, July 2023), leaf samples were collected from five random seedlings per treatment (total of 60) per block (total of 240 seedlings). For each of the five seedlings, six to ten mature leaves (depending on seedling health) were taken from the south side of each plant in the middle portion of the seedling. These leaves were fully developed and free of signs of disease or pests. All leaves from each tree were placed in separate coin envelopes and transported back to the lab at Purdue University. Leaves were dried in a drying oven at 70 °C for 48 h, ground with a coffee grinder into a fine powder, and pooled together per treatment type creating one sample per treatment. Powder leaf tissue samples were sent to A&L Great Lakes Laboratories Inc. in Fort Wayne, IN, USA, and analyzed for total N (%), S (%), P (%), K (%), Mg (%), Ca (%), Na (%), B (ppm), Zn (ppm), Mn (ppm), Fe (ppm), Cu (ppm), and Al (ppm).
Average height, maximum height, and percent cover of the competing vegetation were measured once a year for three years on five random trees per block per treatment combination during the growing season (i.e., July 2021, 2022, and 2023). A different set of trees was selected each year for sampling. In July 2021 and May 2023, the competing vegetation was cut back to ground level after the measurements. No clearing was done in 2022. Percent cover consisted of categorizing each species into herbaceous, forb, vines/canes/briers, shrubs, and trees in a 1 × 1 m2 sampling transect over five random trees per block per treatment and recording what percentage of the square each category compromised. Since species are typically layered on top of each other, each category can add up to 100% separately.

2.5. Statistical Analysis

Survival, seedling growth (height, diameter), foliar nutrient content, and competing vegetation (percent cover, average height, maximum height) were analyzed separately using the package lme4 [40] for linear mixed effects models; MuMIn [41] and multcomp [42] for pairwise comparisons; tidyverse [43], ggpubr [44] for graphing; and dplyer [45] for organizing and analyzing data. Seedling growth was analyzed as incremental growth to account for measuring bias within mulch treatments. The fixed factors were density (1 m, 2 m, 3 m), mulch (yes or no), and fertilizer (yes or no). The random factors were density nested within block and mulch nested within density (Block/Density/Mulch). A three-way analysis of variance (ANOVA) and type III sum of squares was used for each model. Residuals from each response variable were tested for normality and homogeneity to fit the ANOVA assumptions. Each response variable met the assumptions, or they were log or square root transformed to meet them. When the ANOVA detected a significant treatment effect (p ≤ 0.05) for interactions or (in the absence of interaction effects) for main effects, a Tukey’s HSD test was used for a pairwise comparison (α = 0.05). All data were analyzed with R software version 4.2.2 [46].

3. Results

3.1. Seedling Survival and Growth

Survival in 2023 after four growing seasons was 99% (only 7 dead seedlings) and therefore a survival analysis was not warranted. The initial height and diameter (year 0) of all live oak seedlings across all treatments were mostly uniform with an average absolute height of 50 cm (±0.4 cm) and an average absolute diameter of 4.2 mm (±0.03 mm). The exception to this was the mulch treatments, which had shorter seedlings (F1,11 = 28.95, p < 0.001) with smaller diameters (F1,34 = 71.09, p < 0.001). The mulch treatments had a height of 47 cm (±0.5) and a diameter of 3.9 mm (±0.04) while the non-mulched treatments had a height of 53 cm (±0.5) and a diameter of 4.5 mm (±0.05).
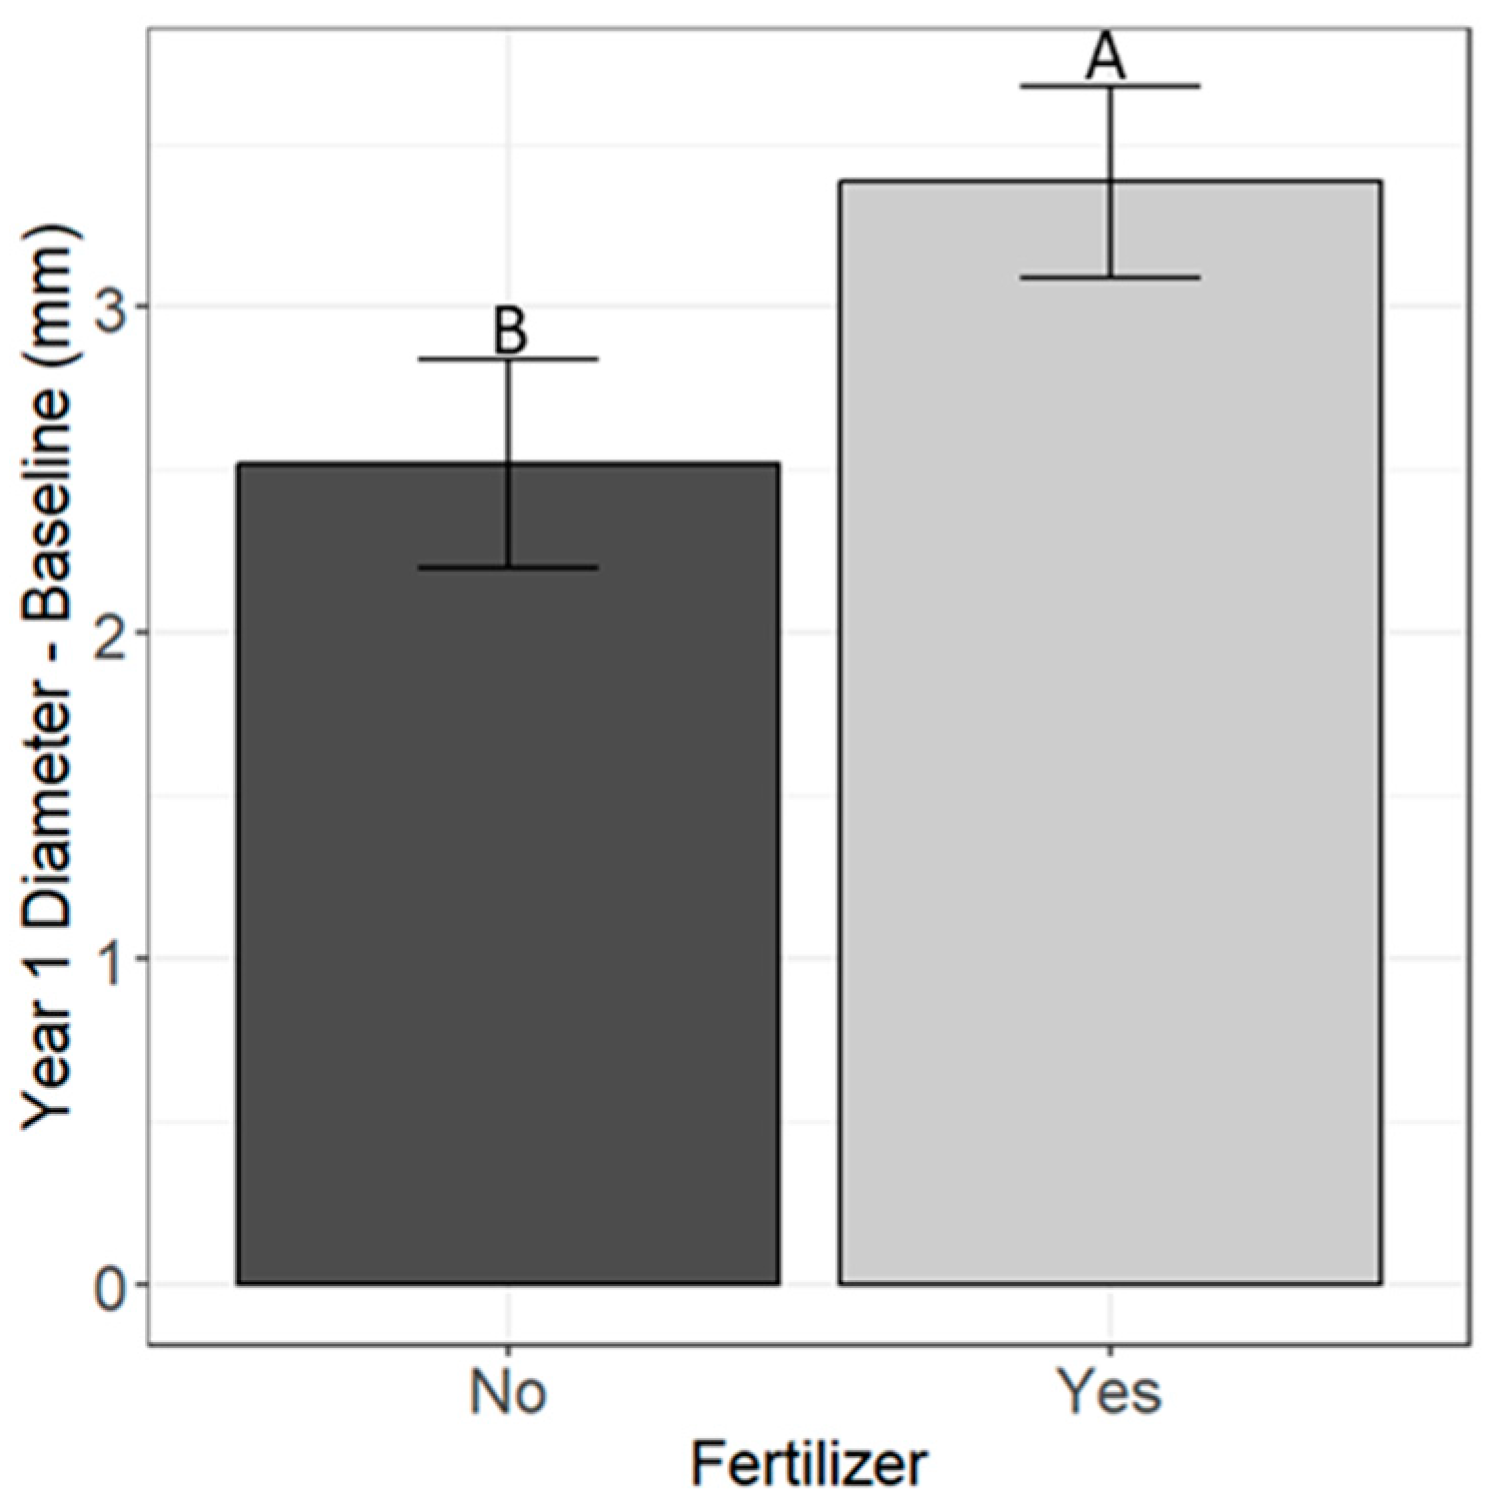
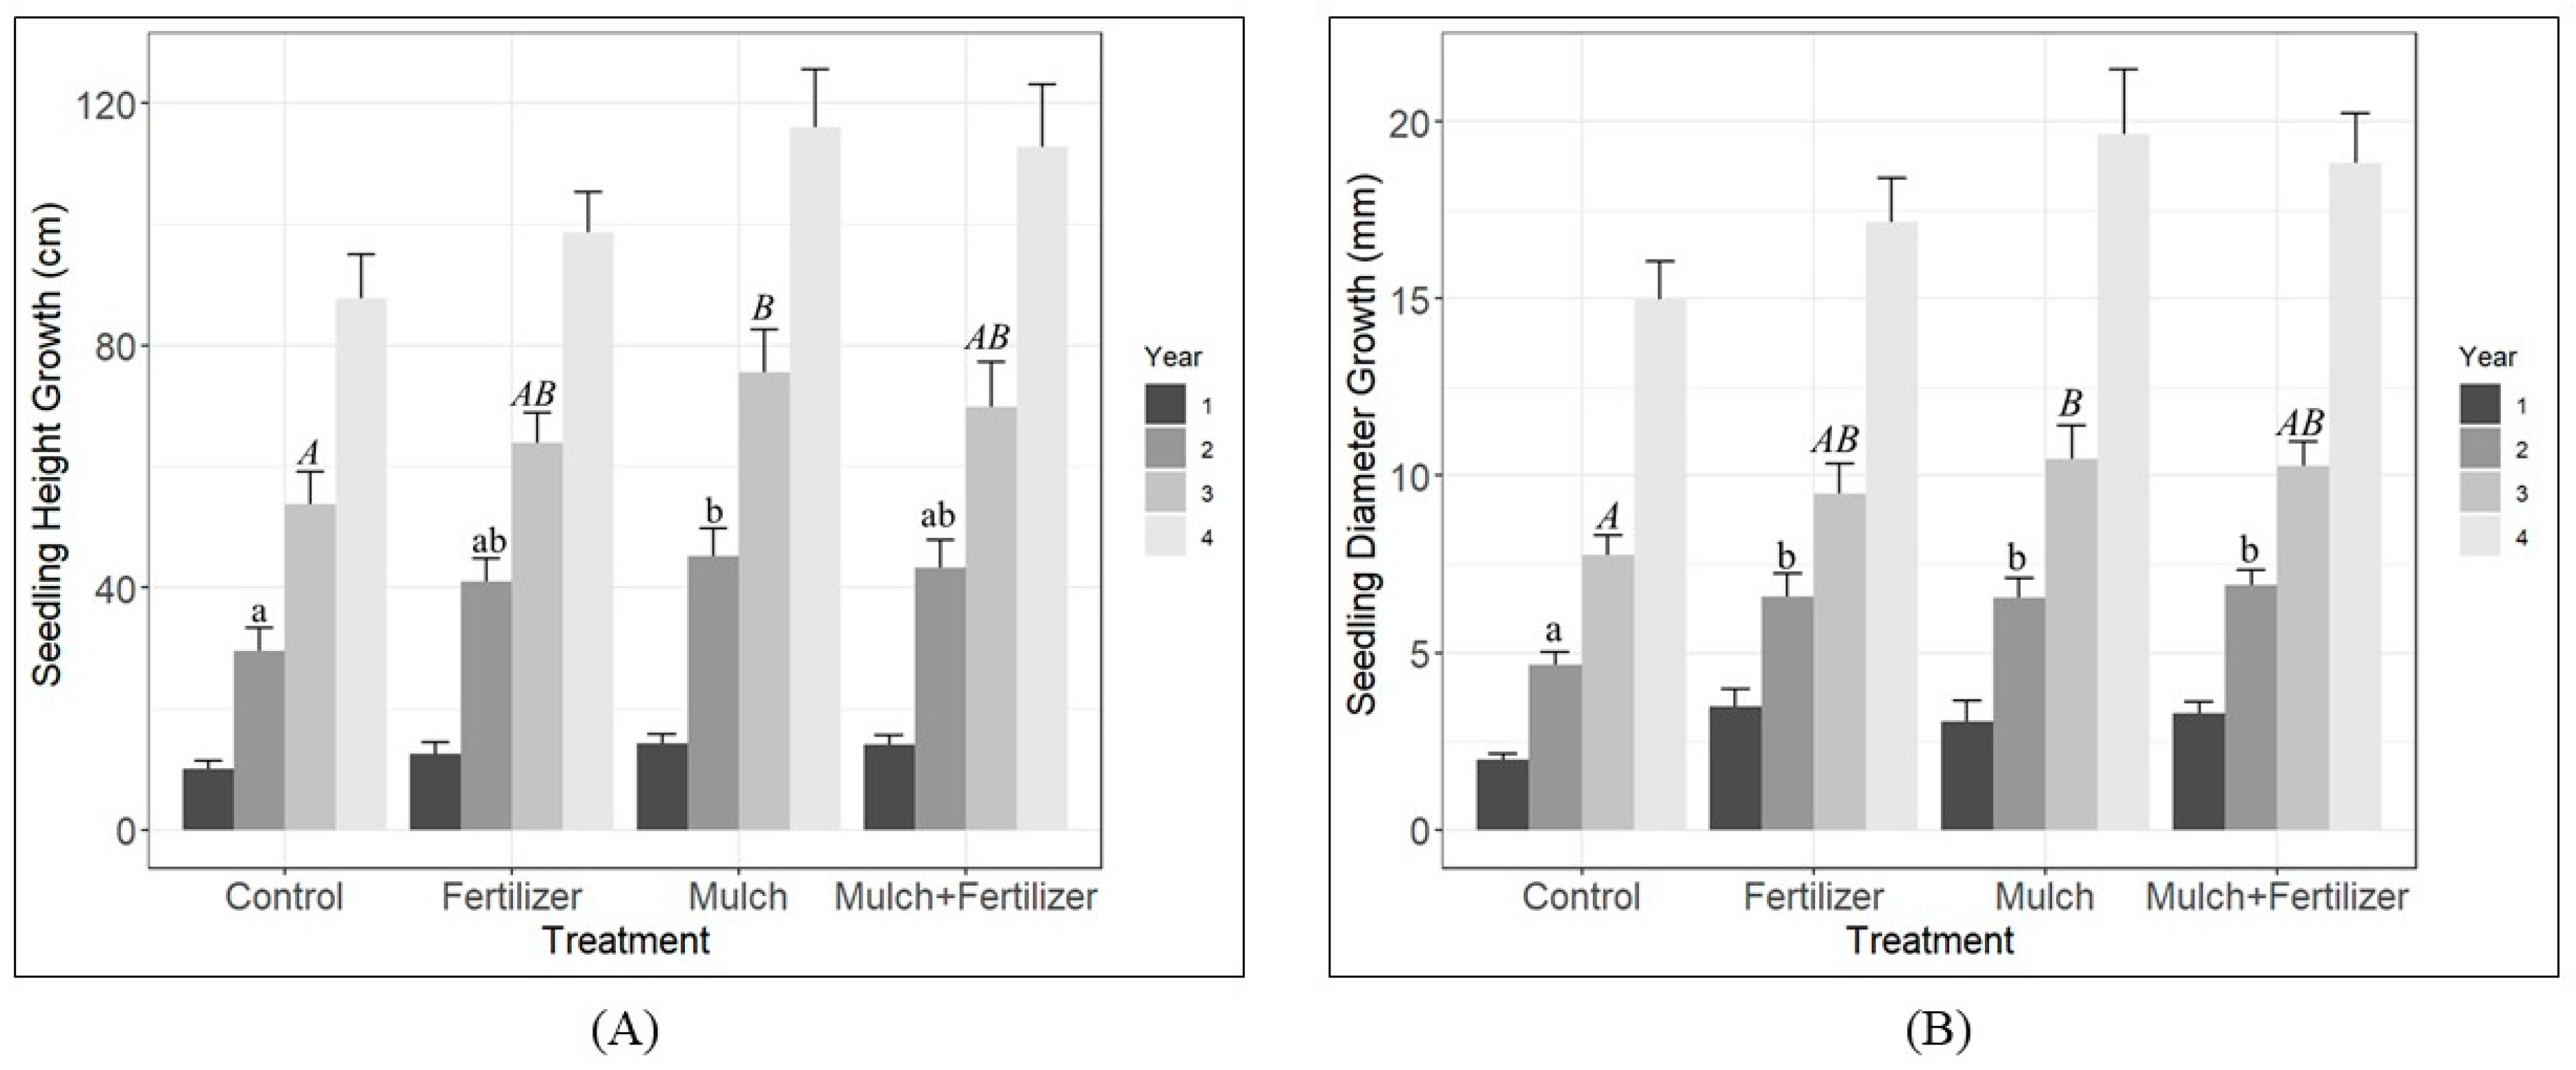
After the first growing season (year 1–year 0) there were no significant effects of any treatment on seedling height growth, but there was a significant interaction between density and fertilizer (F2,21 = 3.60, p = 0.045). However, a Tukey test could not detect a difference in means. First-year diameter growth was only significantly impacted by fertilizer (F1,40 = 10.13, p = 0.003) with a mean diameter growth of 3.4 mm (±0.29) in fertilized plots and 2.5 mm (±0.32) in non-fertilized plots across all treatment combinations of mulch and density (Figure 2). After the second growing season, there was an interaction between fertilizer and mulch (F1,22 = 22.00, p = 0.0264) on seedling height growth (Figure 3). The control seedlings had an average height growth of 35.2 cm (±2.92) and were shorter than the mulched and non-fertilized seedlings at 44.2 cm (±3.14). Diameter growth had a similar finding with the interaction between fertilizer and mulch being significant (F1,22 = 5.684, p = 0.026; Figure 3). The control seedlings with an average diameter growth of 4.6 mm (±0.38) were significantly smaller than the mulched and non-fertilized seedlings at 6.5 mm (±0.56), fertilized and non-mulched seedlings at 6.6 mm (±0.66), and fertilized and mulched seedlings at 6.9 mm (±0.44).
After the third growing season, mulch (F1,11 = 9.50, p = 0.010) had a significant effect on seedling height growth and the interaction between mulch and fertilizer (F1,22 = 4.37, p = 0.048) on seedling height growth was significant (Figure 3). Mulched seedlings had an average height growth of 72.6 cm (±5.05), and non-mulched seedlings had an average height growth of 58.9 cm (±3.68). Within the interaction, the control seedlings at an average height growth of 53.8 cm (±5.27) were shorter than the mulched and non-fertilized seedlings at 75.5 cm (±7.12). Seedling diameter growth had the same result as the main effect of mulch (F1,11 = 7.76, p = 0.018) being significant and the interaction between mulch and fertilizer (F1,22 = 4.37, p = 0.048) being significant (Figure 3). The mulched seedlings had an average diameter growth of 10.4 mm (±0.58), and the non-mulched seedlings had an average diameter growth of 8.6 mm (±0.52). Within the interaction, the control seedlings had a smaller diameter growth at 7.8 mm (±0.54) than the mulched and non-fertilized seedlings at 10.5 mm (±0.96). After the fourth growing season, the only main effect that was significant with height growth was mulch (F1,11 = 12.17, p = 0.005) and this was averaged over all treatment combinations with mulch (Figure 4). The mulched seedlings had an average height growth of 114.4 cm (±6.83), and the non-mulched seedlings had an average height growth of 93.2 cm (±4.95). The diameter showed the same result with mulch (F1,11 = 9.86, p = 0.009) having a significant impact (Figure 4). Mulched seedlings had an average diameter growth of 19.2 mm (±1.12 mm), and they were wider than non-mulched seedlings at 16.1 mm (±0.83). Total crown width after the fourth growing season was significantly impacted by mulch (F1,11 = 4.94, p = 0.048) (Figure 4). Seedlings that received mulch had an average crown width of 96 cm (±1.9) and seedlings that didn’t receive mulch had an average crown width of 88.5 cm (±1.8).

3.2. Foliar Nutrient Analysis N-P-K

Foliar nutrients of the southern live oak (Quercus virginiana) seedlings were analyzed during the second, third, and fourth growing seasons. In the second growing season, a significant effect (F1,11 = 6.08, p = 0.031) was detected between N and mulch but it was not biologically significant. The N concentration for mulched plots was 1.49% (±0.03) and 1.42% (±0.03) in non-mulched plots. A significant effect for N concentration was detected in the third growing season (F1,22 = 4.82, p = 0.039) with the fertilizer treatments but it was also not biologically significant. The mean N concentration in fertilized plots was 1.38% (±0.02) and 1.43% (±0.02) in non-fertilized plots. A significant difference in foliar nitrogen content between density, mulch, and fertilizer was not detected in the fourth growing season.
Foliar P concentrations had significant outcomes in the second, third, and fourth growing seasons but the differences were also small. In the second growing season, P concentrations in non-fertilized plots were 0.14% (±0.003) and fertilized plots were 0.13% (±0.004) (F1,41 = 4.84, p = 0.03). In the third growing season, P concentrations were higher in non-fertilized plots at 0.14% (±0.005) and fertilized plots were 0.13% (±0.003) (F1,34 = 6.74, p = 0.014). Lastly, in the fourth growing season, P concentrations were higher in non-mulched plots at 0.17% (±0.003) and mulched plots were 0.16% (±0.002) (F1,43 = 4.11, p = 0.048). For foliar K concentrations, a significant (F1,21 = 6.98, p = 0.015) effect was only seen during the second growing season with mulch and these differences were also small. Mulched plots had 0.54% (±0.01) and non-mulched plots had 0.48% (±0.01). Other macro and micronutrients were analyzed but their interpretation was beyond the scope of this study.

3.3. Competing Vegetation

When analyzing the average absolute height of the competing vegetation during the second growing season, there were significant interactions between density and fertilizer (F2,19.7 = 7.20, p = 0.004) (Figure 5). The 3 m × non-fertilized plots showed significantly taller vegetation at 91.6 cm (±8.6) than the 3 m × fertilized plots at 57.3 cm (±8.4). The third and fourth growing seasons showed no significant (p > 0.05) interactions between the average vegetation height and the treatments.
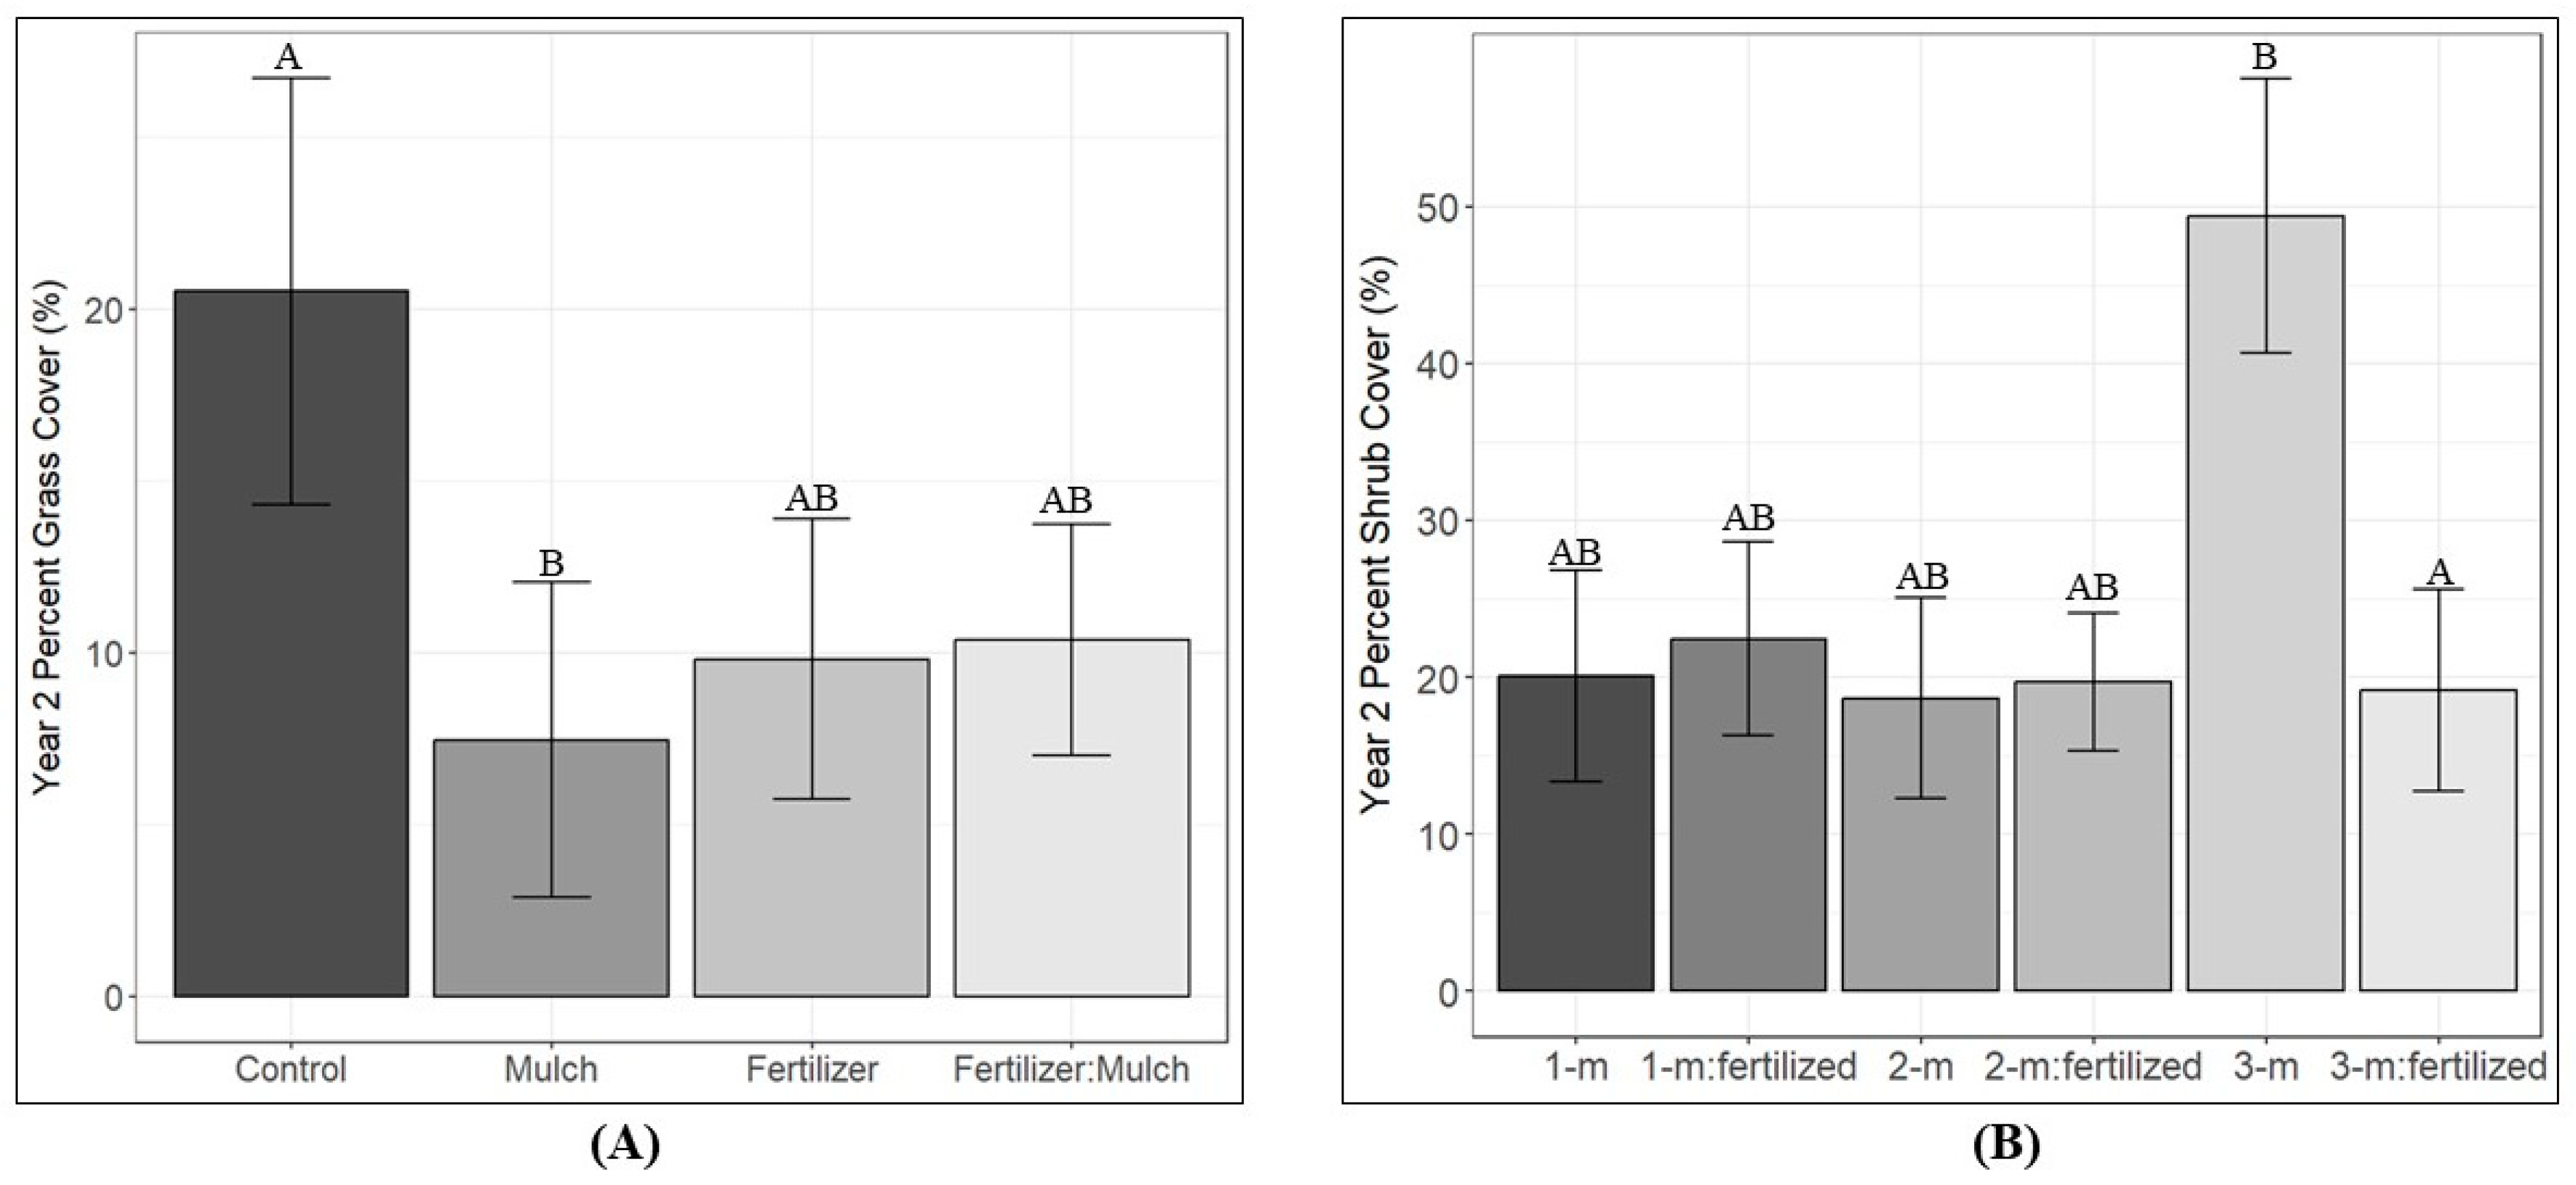
During the second growing season, the percent of grass coverage was reduced during the second growing season with the application of mulch × no-fertilizer at 7.3% (±2.6) compared to non-mulched × no fertilizer plots at 20.2% (±4.4) (F1,20.4 = 9.13, p = 0.007) (Figure 6). This trend did not continue in the third and fourth growing seasons.
In the second growing season, the percent of shrub coverage between the 3 m × no fertilizer plots and 3 m × fertilized plots was significantly different (F2,20.0 = 4.71, p = 0.021) (Figure 6). The 3 m × fertilized plots had a shrub cover of 19.2% (±5.2) and the 3 m × nonfertilized plots had a shrub cover of 49.6% (±6.5). This trend did not continue into subsequent years. The third and fourth growing seasons did not have any significant trends with individual vegetation types, average vegetation height, and maximum vegetation height.

4. Discussion

Over the course of four years, 99% of the seedlings survived, which did not vary by treatment. Seed source likely slightly contributed to survival. The seeds were sourced directly from the island and likely exhibited phenotypic traits that were adapted for the area such as winter temperature and length, water availability, soil type, competitive regime, and other biotic and abiotic factors [47,48,49,50,51,52]. Nursery cultural practices may have also had a significant influence on seedling survival. The container stock size (262 mL) used for propagation was larger than the operational size typically used in the region, which is primarily bareroot seedlings. A large container size promotes greater root production (including fine roots), higher root-to-shoot ratios, and increased amounts of stored carbohydrates, all of which can contribute to increased survival after planting in hardwood species [53,54]. There are no known live oak planting studies that have examined the importance of stock size on restoration success.
Our first hypothesis that fertilizer and mulch would promote live oak seedling growth was supported. One year after outplanting, fertilized seedlings had larger diameters than non-fertilized seedlings (Figure 2). This corresponds with other studies that show that controlled-release fertilizer (CRF) provides a positive growth response immediately after planting [32,33]. Larger diameters are a good indicator for belowground root growth, which may result in seedlings that are more resilient to extreme temperatures and storm damage [55,56]. Surprisingly, mulch continued to have an impact on seedling growth for up to four years after the post-planting application, despite the warm humid sub-tropical environment that promotes rapid decomposition [39,57]. In years 2–4, seedlings that received mulch made from masticated slash had positive growth responses (Figure 3 and Figure 4) and overall wider crowns than treatments that did not receive mulch (Figure 4). Our mulch was a mix of masticated slash with bark and wood chips from species like pine, magnolia, and oak. Bark chips have a higher lignin content and can take two to four years to break down, which would explain why it took two years to see a positive effect on seedling growth and why these effects can be seen well into the fourth year [58]. This is especially true for pine bark, which has a high lignin content and a slow decomposition rate [59,60]. The mulch may have provided structural changes to the soil that had more lasting effects. Previous studies have shown that wood chip applications result in the most above-ground biomass and below-ground root growth for seedlings as well as positive changes to soil properties such as moderation in soil temperature, increased soil moisture, more organic matter, and higher rates of microbial respiration [61,62]. Although we did not measure soil processes or structure, it is possible that these positive properties of mulch stimulated live oak seedling growth.
Our second hypothesis that planting density would impact seedling response was not supported over the four-year duration of this project. We anticipate that additional time may be necessary before intraspecific competition and crown closure begin to result in significant differences, especially for the wider-spaced plantings. These results align with previous studies that reported the effects of intra- and interspecific competition were only measurable three to five years after outplanting [63,64,65]. Photosynthate produced from photosynthesis can be allocated to (in relative priority order) maintenance respiration of living tissue, production of fine roots and leaves, flower and seed production, and/or primary and secondary growth [66]. The live oak seedlings were grown in a hot environment with sandy soil and vigorous competition. Although not directly measured, it is speculated that these environmental factors would likely cause the seedlings to allocate photosynthate primarily to maintenance during stressful periods in the first couple of years of growth [67]. Allocating resources below ground during regeneration establishment is also a common characteristic of many oaks to increase their survival during drought conditions [68,69,70,71]. The manual removal of competing vegetation during year two and year four across all treatments also likely impacted our results. This may have contributed to less interspecific competition in the 1 m spacings especially with regard to shading and below-ground root space [72]. In order to minimize management costs, maintain seedling survival, and ensure the training effect of plant facilitation on seedling shoot growth, an acceptable level of interspecific competition needs to be identified [63,73,74].
We did not see an interaction between fertilizer and mulch for foliar nitrogen, phosphorus, and potassium concentration in the three years it was sampled. Any changes with mulch and fertilizer individually were small. We expected foliar nitrogen to become more limiting with the addition of mulch [31]; however, a previous soil analysis conducted on a nearby experimental site [75] showed the soil nitrogen levels to be 67.8 (+5.1) kg/ha−1. According to fertilizer recommendations for tree planting in this region [76], this may be an ideal nitrogen level for pre-planting conditions. This is further supported by previous studies showing that the foliar N levels of swamp white oak and live oak were similar to the N levels of live oak seedlings in this experiment [33,77]. Sufficient soil nitrogen may have prevented the expression of any reduced soil nitrogen available to seedlings in the mulched treatments or wood chips did not consistently alter nitrogen availability [78]. Foliar phosphorus content decreased slightly with fertilizer in years two and three. A possible explanation for this is the addition of fertilizer slightly decreased the soil pH surrounding the live oak seedlings, limiting available phosphorus to plants [79]. Additionally, foliar nutrient analyses were conducted after the 12–14-month estimated release period of the fertilizer, which may have prevented the effects from being observed.
Before clearing the vegetation in year two, the 3 m non-fertilized plots had taller vegetation with more shrub coverage than the 3 m fertilized plots (Figure 5). These wide spacings mostly likely had the most available light, water, and soil nutrients that the fast-growing shrubs, such as wax myrtle (Myrica cerifera) and yaupon holly (Ilex vomitoria), took advantage of, but this is speculative [80]. The reduction in growth after fertilization may have been from a nutrient sink created around the live oaks. Based on the soil analysis in Phase 3, the baseline N-P-K may have been around 67.8 kg/ha−1, 99.6 ppm, and 17.3 ppm [81]. Levels of nitrogen and phosphorus would have been optimum for plant growth, but potassium may have been limiting [76,82].

5. Conclusions

Establishing viable silvicultural treatments for the restoration of maritime forests is important for the long-term health and stability of coastal ecosystems in the southern United States. With NOAA predicting sea levels to rise 25–35 cm in the next 30 years and an increase in the number of hurricanes, maritime forests will be needed for their ability to stabilize coastlines and provide a protective buffer against storm damage [1,7]. Our research provides guidelines for the successful outplanting of Q. virginiana seedlings, a keystone species in maritime forests. We demonstrated that the use of CRF can provide an initial short-term boost in diameter growth, which may be a good indicator for an increase in below-ground root growth. We also showed that applying mulch made from masticated slash is an effective soil amendment that can have lasting positive impacts four years after outplanting. Both treatments have the potential to help seedlings overcome transplant shock.
Although Q. virginiana seedlings did not respond to the density treatments during the regeneration stage over the first four years, the long-term effects of planting density may provide valuable information for future management strategies. Seedlings planted at an optimal planting density can maximize site occupancy by quickly reducing interspecific competition from competing vegetation through early canopy closure, while also increasing shoot growth and survival. This can be seen as a form of plant facilitation that can help build plant communities in maritime forests [83]. Q. virginiana seedlings that are planted close together may train each other to allocate resources to shoot growth to maintain sunlight exposure and act as nurse plants to Q. virginiana and other common understory species [84,85]. This may help to promote more rapid canopy closure and a favorable microclimate including increased humidity, soil moisture, soil nutrients, and low light levels [86]. These positive impacts of optimal planting density may help re-establish Q. virginiana as the dominant canopy species without the additional costs of manual removal and herbicide applications on competing species. Future research should be designed to examine the long-term effects of planting density, while also better understanding the influence of inter- vs. intra-specific competition in determining facilitative and competitive effects on Q. virginiana establishment.
Promoting natural tree regeneration and recruitment is an important component of creating resilient forest ecosystems, especially for foundation tree species such as oaks [87,88]. A common limiting factor is the cost involved in many management plans. In Georgia, 90% of forest land is privately owned and 60% of this is individual or family-owned property [89]. Our study suggests successful and effective restoration strategies that can potentially be implemented on a wide scale or for smaller family-owned forests.

Author Contributions

Conceptualization, O.T.B. and D.F.J.; methodology, B.N.I., O.T.B. and D.F.J.; software, B.N.I. and O.T.B.; validation, B.N.I., D.F.J. and O.T.B.; formal analysis, B.N.I., O.T.B. and D.F.J.; investigation, B.N.I., O.T.B. and D.F.J.; resources, O.T.B. and D.F.J.; data curation, B.N.I., O.T.B. and D.F.J.; writing—original draft preparation, B.N.I., D.F.J. and O.T.B.; writing—review and editing, B.N.I., D.F.J. and O.T.B.; visualization, B.N.I., D.F.J. and O.T.B.; supervision, O.T.B. and D.F.J.; project administration, O.T.B. and D.F.J.; funding acquisition, O.T.B. and D.F.J. All authors have read and agreed to the published version of the manuscript.

Funding

Funding support was provided by the USDA National Institute of Food and Agriculture, McIntire Stennis project IND011535, Hardwood Tree Improvement and Regeneration Center, the Fred M. van Eck Forest Foundation, JTH Forestry Research Center with NMSU, and the St. Simon’s Land Trust. St. Simon’s Land Trust provided access to research sites. In kind support from the St. Simon’s Land Trust, The Nature Conservancy, and Georgia Department of Natural Resources.

Data Availability Statement

Data and code used for analysis will be made available on request to the corresponding author.

Acknowledgments

Thank you to Stephanie Knox, Rebecca Cushing, Susan Shipman, Peter Geier, Pouli Sikelianos, Tammy Parsons, Aalap Dixit, Emily Thyroff, Caleb Redick, Tawn Speetjens, Andrei Toca, Cameron Dow, Jessica Elliott, Elias Gaffney, and Tate Holbrook for valuable assistance with this project.

Conflicts of Interest

The authors declare no conflicts of interest.

References

  1. Bellis, V.J. Ecology of Maritime Forests of the Southern Atlantic Coast: A Community Profile; U.S. Department of the Interior, National Biological Service: Washington, DC, USA, 1995.
  2. Woods, N.N.; Tuley, P.A.; Zinnert, J.C. Long-Term Community Dynamics Reveal Different Trajectories for Two Mid-Atlantic Maritime Forests. Forests 2021, 12, 1063. [Google Scholar] [CrossRef]
  3. Arkema, K.K.; Guannel, G.; Verutes, G.; Wood, S.A.; Guerry, A.; Ruckelshaus, M.; Kareiva, P.; Lacayo, M.; Silver, J.M. Coastal Habitats Shield People and Property from Sea-Level Rise and Storms. Nat. Clim. Chang. 2013, 3, 913–918. [Google Scholar] [CrossRef]
  4. Costanza, R.; Pérez-Maqueo, O.; Martinez, M.L.; Sutton, P.; Anderson, S.J.; Mulder, K. The Value of Coastal Wetlands for Hurricane Protection. Ambio 2008, 37, 241–248. [Google Scholar] [CrossRef]
  5. Gómez-Baggethun, E.; Barton, D.N. Classifying and Valuing Ecosystem Services for Urban Planning. Ecol. Econ. 2013, 86, 235–245. [Google Scholar] [CrossRef]
  6. Tibbetts, J. Coastal Cities: Living on the Edge. Environ. Health Perspect. 2002, 110, A674–A681. [Google Scholar] [CrossRef]
  7. NOAA 2022 Sea Level Rise Technical Report. Available online: https://oceanservice.noaa.gov/hazards/sealevelrise/sealevelrise-tech-report.html#step1 (accessed on 14 June 2024).
  8. Lopazanski, M.J.; Evans, J.P.; Shaw, R.E. An Assessment of Maritime Forest Resources on the North Carolina Coast; North Carolina Department of Natural Resources and Community Development, Division of Coastal Management: Raleigh, NC, USA, 1988.
  9. Conner, W.H.; Mixon, W.D.; Wood, G.W. Maritime Forest Habitat Dynamics on Bulls Island, Cape Romain National Wildlife Refuge, SC, Following Hurricane Hugo. For. Ecol. Manag. 2005, 212, 127–134. [Google Scholar] [CrossRef]
  10. Kurtz, C.M. Consequences of Salinity and Freezing Stress for Two Populations of Quercus virginiana Mill. (Fagaceae) Grown in a Common Garden. J. Torrey Bot. Soc. 2013, 140, 145–156. [Google Scholar] [CrossRef]
  11. Gresham, C.A.; Williams, T.M.; Lipscomb, D.J. Hurricane Hugo Wind Damage to Southeastern U.S. Coastal Forest Tree Species. Biotropica 1991, 23, 420–426. [Google Scholar] [CrossRef]
  12. Albers, G.; Alber, M. A Vegetative Survey of Back-Barrier Islands near Sapelo Island, Georgia; University of Georgia: Athens, Greece, 2003. [Google Scholar]
  13. Taggart, J.; Long, Z. Effects of White-Tailed Deer (Odocoileus virginianus) on the Maritime Forest of Bald Head Island, North Carolina. Am. Midl. Nat. 2015, 173, 283–293. [Google Scholar] [CrossRef]
  14. Baldwin, N.A.; Crosby, M.K. The Allelopathic Influence of Post Oak (Quercus stellata) on Plant Species in Southern U.S. Forests. In Proceedings of the 18th Biennal Southern Silvicultural Research Conference, Knoxville, TN, USA, 2–5 March 2015; United States Department of Agriculture (USDA), Forest Service: Asheville, NC, USA, 2015. [Google Scholar]
  15. Guang De, L.; Jia, L.; Li, X. Research Advances in Allelopathy of Quercus L. For. Stud. China 2007, 9, 287–294. [Google Scholar] [CrossRef]
  16. Saha, S.; Kuehne, C.; Bauhus, J. Intra- and Interspecific Competition Differently Influence Growth and Stem Quality of Young Oaks (Quercus robur L. and Quercus petraea (Mattuschka) Liebl.). Ann. For. Sci. 2014, 71, 381–393. [Google Scholar] [CrossRef]
  17. Waring, R.H.; Schlesinger, W.H. Forest Ecosystems, Concepts and Management; Acad. Press. Inc.: Orlando, FL, USA, 1985; Volume 340. [Google Scholar]
  18. Yang, X.; Zhang, W.; He, Q. Effects of Intraspecific Competition on Growth, Architecture and Biomass Allocation of Quercus liaotungensis. J. Plant Interact. 2019, 14, 284–294. [Google Scholar] [CrossRef]
  19. Wolf, A.; Møller, P.F.; Bradshaw, R.H.W.; Bigler, J. Storm Damage and Long-Term Mortality in a Semi-Natural, Temperate Deciduous Forest. For. Ecol. Manag. 2004, 188, 197–210. [Google Scholar] [CrossRef]
  20. Spector, T.; Putz, F.E. Crown Retreat of Open-Grown Southern Live Oaks (Quercus virginiana) Due to Canopy Encroachment in Florida, USA. For. Ecol. Manag. 2006, 228, 168–176. [Google Scholar] [CrossRef]
  21. Vince, S.W.; Humphrey, S.R.; Simons, R.W. The Ecology of Hydric Hammocks: A Community Profile; U.S. Department of the Interior, Fish and Wildlife Service, Research and Development: Washington, DC, USA, 1989.
  22. Wang, X.; Rahman, M.A.; Mokroš, M.; Rötzer, T.; Pattnaik, N.; Pang, Y.; Zhang, Y.; Da, L.; Song, K. The Influence of Vertical Canopy Structure on the Cooling and Humidifying Urban Microclimate during Hot Summer Days. Landsc. Urban Plan. 2023, 238, 104841. [Google Scholar] [CrossRef]
  23. Greenly, K.; Rakow, D. The Effect of Wood Mulch Type and Depth on Weed and Tree Growth and Certain Soil Parameters. AUF 1995, 21, 225–232. [Google Scholar] [CrossRef]
  24. Harris, R.W. Arboriculture: Integrated Management of Landscape Trees, Shrubs, and Vines; Prentice-Hall International: Engelwood Cliffs, NJ, USA, 1992. [Google Scholar]
  25. Chakraborty, D.; Nagarajan, S.; Aggarwal, P.; Gupta, V.K.; Tomar, R.K.; Garg, R.N.; Sahoo, R.N.; Sarkar, A.; Chopra, U.K.; Sarma, K.S.S.; et al. Effect of Mulching on Soil and Plant Water Status, and the Growth and Yield of Wheat (Triticum aestivum L.) in a Semi-Arid Environment. Agric. Water Manag. 2008, 95, 1323–1334. [Google Scholar] [CrossRef]
  26. NOAA Climate-Brunswick, GA. Available online: https://www.weather.gov/wrh/Climate?wfo=jax (accessed on 14 June 2023).
  27. Soil Survey Staff Web Soil Survey. Available online: https://www.nrcs.usda.gov/resources/data-and-reports/web-soil-survey (accessed on 16 June 2023).
  28. Shirish, P.; Kelkar, S.; Bhalerao, S. Mulching: A Soil and Water Conservation Practice. Res. J. Agric. For. Sci. 2013, 1, 2320–6063. [Google Scholar]
  29. Benigno, S.M.; Dixon, K.W.; Stevens, J.C. Increasing Soil Water Retention with Native-Sourced Mulch Improves Seedling Establishment in Postmine Mediterranean Sandy Soils. Restor. Ecol. 2013, 21, 617–626. [Google Scholar] [CrossRef]
  30. Percival, G.C.; Gklavakis, E.; Noviss, K. Influence of Pure Mulches on Survival, Growth and Vitality of Containerized and Field Planted Trees. J. Environ. Hortic. 2009, 27, 200–206. [Google Scholar] [CrossRef]
  31. Rakow, D.A. Types and Uses of Mulch in Landscape; Cornell University Cooperative Extension: Ithaca, NY, USA, 1989; pp. 1–4. [Google Scholar]
  32. Gilman, E.F.; Yeager, T.H.; Kent, D. Fertilizer Rate and Type Impacts Magnolia and Oak Growth in Sandy Landscape Soil. J. Arboric. 2000, 26, 177–182. [Google Scholar] [CrossRef]
  33. Thyroff, E.C.; Burney, O.T.; Oliet, J.A.; Redick, C.H.; Jacobs, D.F. Toward Identifying Alternatives to Fencing for Forest Restoration: Tube Shelters Outperform Mesh Shelters for Deer Browse Protection of Live Oak, Quercus virginiana. Land 2022, 11, 966. [Google Scholar] [CrossRef]
  34. Jacobs, D.F.; Salifu, K.F.; Seifert, J.R. Growth and Nutritional Response of Hardwood Seedlings to Controlled-Release Fertilization at Outplanting. For. Ecol. Manag. 2005, 214, 28–39. [Google Scholar] [CrossRef]
  35. Dey, D.C.; Jacobs, D.; McNabb, K.; Miller, G.; Baldwin, V.; Foster, G. Artificial Regeneration of Major Oak (Quercus) Species in the Eastern United States—A Review of the Literature. For. Sci. 2008, 54, 77–106. [Google Scholar] [CrossRef]
  36. Struve, D.K.; Joly, R.J. Transplanted Red Oak Seedlings Mediate Transplant Shock by Reducing Leaf Surface Area and Altering Carbon Allocation. Can. J. For. Res. 1992, 22, 1441–1448. [Google Scholar] [CrossRef]
  37. Gale Encyclopedia of World Biography: 2004 Supplement. Available online: https://www.gale.com/ebooks/9780787693459/encyclopedia-of-world-biography-2004-supplement (accessed on 26 November 2023).
  38. Georgia Historical Society Cannon’s Point Plantation. Available online: https://www.georgiahistory.com/ghmi_marker_updated/cannons-point-plantation/ (accessed on 26 November 2023).
  39. St Simons Land Trust Archaeology. Available online: https://sslt.org/protected-properties-2/cannons-point-preserve/research/archaeology/ (accessed on 26 November 2023).
  40. Bates, D.; Mächler, M.; Bolker, B.; Walker, S. Fitting Linear Mixed-Effects Models Using Lme4. J. Stat. Softw. 2015, 67, 1–48. [Google Scholar] [CrossRef]
  41. Barton, K. MuMIn: Multi-Model Inference, R Package Version 1.10.0. 2009. Available online: https://cran.r-project.org/web/packages/MuMIn/index.html (accessed on 26 November 2023).
  42. Hothorn, T.; Bretz, F.; Westfall, P. Simultaneous Inference in General Parametric Models. Biom. J. 2008, 50, 346–363. [Google Scholar] [CrossRef]
  43. Wickham, H.; Averick, M.; Bryan, J.; Chang, W.; McGowan, L.D.; François, R.; Grolemund, G.; Hayes, A.; Henry, L.; Hester, J.; et al. Welcome to the Tidyverse. J. Open Source Softw. 2019, 4, 1686. [Google Scholar] [CrossRef]
  44. Kassambara, A. Ggpubr: “ggplot2” Based Publication Ready Plots, R Package Version 0.6.0. 2023. Available online: https://cran.r-project.org/web/packages/ggpubr/index.html (accessed on 26 November 2023).
  45. Wickham, H.; François, R.; Henry, L.; Müller, K.; Vaughan, D. Dplyr: A Grammar of Data Manipulation, R Package Version 1.1.4. 2023. Available online: https://cran.r-project.org/web/packages/dplyr/index.html (accessed on 26 November 2023).
  46. R Core Team. R: A Language and Environment for Statistical Computing; R Foundation for Statistical Computing: Vienna, Austria, 2022. [Google Scholar]
  47. Aitken, S.N.; Yeaman, S.; Holliday, J.A.; Wang, T.; Curtis-McLane, S. Adaptation, Migration or Extirpation: Climate Change Outcomes for Tree Populations. Evol. Appl. 2008, 1, 95–111. [Google Scholar] [CrossRef]
  48. Balduman, L.M.; Aitken, S.N.; Harmon, M.; Adams, W.T. Genetic Variation in Cold Hardiness of Douglas-Fir in Relation to Parent Tree Environment. Can. J. For. Res. 1999, 29, 62–72. [Google Scholar] [CrossRef]
  49. Dudley, S.A. Differing Selection on Plant Physiological Traits in Response to Environmental Water Availability: A Test of Adaptive Hypotheses. Evolution 1996, 50, 92–102. [Google Scholar] [CrossRef] [PubMed]
  50. Linhart, Y.B.; Grant, M.C. Evolutionary Significance of Local Genetic Differentiation in Plants. Annu. Rev. Ecol. Syst. 1996, 27, 237–277. [Google Scholar] [CrossRef]
  51. Park, I.; DeWalt, S.J.; Siemann, E.; Rogers, W.E. Differences in Cold Hardiness between Introduced Populations of an Invasive Tree. Biol. Invasions 2012, 14, 2029–2038. [Google Scholar] [CrossRef]
  52. Ramírez-Valiente, J.A.; Sánchez-Gómez, D.; Aranda, I.; Valladares, F. Phenotypic Plasticity and Local Adaptation in Leaf Ecophysiological Traits of 13 Contrasting Cork Oak Populations under Different Water Availabilities. Tree Physiol. 2010, 30, 618–627. [Google Scholar] [CrossRef]
  53. Jacobs, D.F.; Davis, A.S.; Dumroese, R.K.; Burney, O.T. Nursery Cultural Techniques Facilitate Restoration of Acacia koa Competing with Invasive Grass in a Dry Tropical Forest. Forests 2020, 11, 1124. [Google Scholar] [CrossRef]
  54. Mariotti, B.; Maltoni, A.; Jacobs, D.F.; Tani, A. Container Effects on Growth and Biomass Allocation in Quercus robur and Juglans regia Seedlings. Scand. J. For. Res. 2015, 30, 401–415. [Google Scholar] [CrossRef]
  55. Davis, A.S.; Jacobs, D.F. Quantifying Root System Quality of Nursery Seedlings and Relationship to Outplanting Performance. New Forest 2005, 30, 295–311. [Google Scholar] [CrossRef]
  56. Haase, D.L. Understanding Forest Seedling Quality: Measurements and Interpretation. Tree Plant. Notes 2008, 52, 24–30. [Google Scholar]
  57. Schroth, G.; Zech, W.; Heimann, G. Mulch Decomposition under Agroforestry Condition in Sub-Humid Tropical Savanna Processes and Influence of Perennial Plants. Plant Soil 1992, 147, 1–11. [Google Scholar] [CrossRef]
  58. Bell, N.; Sullivan, D.M.; Cook, T. Mulching Woody Ornamentals with Organic Materials. Available online: https://extension.oregonstate.edu/catalog/pub/ec-1629-mulching-woody-ornamentals-organic-materials (accessed on 26 January 2024).
  59. Duryea, M.; English, R.J.; Hermansen, L.A. A Comparison of Landscape Mulches: Chemical, Allelopathic, and Decomposition Properties. AUF 1999, 25, 88–97. [Google Scholar] [CrossRef]
  60. Meentemeyer, V. Macroclimate and Lignin Control of Litter Decomposition Rates. Ecology 1978, 59, 465–472. [Google Scholar] [CrossRef]
  61. Maggard, A.O.; Will, R.E.; Hennessey, T.C.; McKinley, C.R.; Cole, J.C. Tree-Based Mulches Influence Soil Properties and Plant Growth. HortTechnology 2012, 22, 353–361. [Google Scholar] [CrossRef]
  62. Scharenbroch, B.; Watson, G.W. Wood Chips and Compost Improve Soil Quality and Increase Growth of Acer rubrum and Betula nigra in Compacted Urban Soil. Arboric. Urban For. 2014, 40, 319–331. [Google Scholar] [CrossRef]
  63. Andrzejczyk, T.; Liziniewicz, M.; Drozdowski, S. Effect of Spacing on Growth and Quality Parameters in Sessile Oak (Quercus petraea) Stands in Central Poland: Results 7 Years after Planting. Scand. J. For. Res. 2015, 30, 710–718. [Google Scholar] [CrossRef]
  64. Gauthier, M.-M.; Zellers, K.E.; Löf, M.; Jacobs, D.F. Inter- and Intra-Specific Competitiveness of Plantation-Grown American chestnut (Castanea dentata). For. Ecol. Manag. 2013, 291, 289–299. [Google Scholar] [CrossRef]
  65. Jensen, A.M.; Löf, M. Effects of Interspecific Competition from Surrounding Vegetation on Mortality, Growth and Stem Development in Young Oaks (Quercus robur). For. Ecol. Manag. 2017, 392, 176–183. [Google Scholar] [CrossRef]
  66. Oliver, C.; Larson, B. Forest Stand Dynamics, Update Edition; Yale School of the Environment Other Publications: New York, NY, USA, 1996; ISBN 978-0-471-13833-4. [Google Scholar]
  67. Huang, J.; Hammerbacher, A.; Weinhold, A.; Reichelt, M.; Gleixner, G.; Behrendt, T.; van Dam, N.M.; Sala, A.; Gershenzon, J.; Trumbore, S.; et al. Eyes on the Future–Evidence for Trade-Offs between Growth, Storage and Defense in Norway Spruce. New Phytol. 2019, 222, 144–158. [Google Scholar] [CrossRef]
  68. Canham, C.D.; Berkowitz, A.R.; Kelly, V.R.; Lovett, G.M.; Ollinger, S.V.; Schnurr, J. Biomass Allocation and Multiple Resource Limitation in Tree Seedlings. Can. J. For. Res. 1996, 26, 1521–1530. [Google Scholar] [CrossRef]
  69. Jacobs, D.F.; Salifu, K.F.; Seifert, J.R. Relative Contribution of Initial Root and Shoot Morphology in Predicting Field Performance of Hardwood Seedlings. New For. 2005, 30, 235–251. [Google Scholar] [CrossRef]
  70. Rebbeck, J.; Gottschalk, K.; Scherzer, A. Do Chestnut, Northern Red, and White Oak Germinant Seedlings Respond Similarly to Light Treatments? Growth and Biomass. Can. J. For. Res. 2011, 41, 2219–2230. [Google Scholar] [CrossRef]
  71. Villar-Salvador, P.; Puértolas, J.; Cuesta, B.; Peñuelas, J.L.; Uscola, M.; Heredia-Guerrero, N.; Rey Benayas, J.M. Increase in Size and Nitrogen Concentration Enhances Seedling Survival in Mediterranean Plantations. Insights from an Ecophysiological Conceptual Model of Plant Survival. New For. 2012, 43, 755–770. [Google Scholar] [CrossRef]
  72. Collet, C.; Löf, M.; Pagès, L. Root System Development of Oak Seedlings Analysed Using an Architectural Model. Effects of Competition with Grass. Plant Soil 2006, 279, 367–383. [Google Scholar] [CrossRef]
  73. Clatterbuck, W.K. The Potential of Using Coppice Growth as Training Trees in Plantations for the Production of High-Quality Oak Boles. In Proceedings of the 18th Biennial Southern Silvicultural Research Conference, Knoxville, TN, USA, 2–5 March 2015; U.S. Department of Agriculture, Forest Service, Southern Research Station: Asheville, NC, USA, 2015. [Google Scholar]
  74. Saha, S.; Kuehne, C.; Bauhus, J. Tree Species Richness and Stand Productivity in Low-Density Cluster Plantings with Oaks (Quercus robur L. and Q. petraea (Mattuschka) Liebl.). Forests 2013, 4, 650–665. [Google Scholar] [CrossRef]
  75. Thyroff, E.C.; Burney, O.T.; Jacobs, D.F. Herbivory and Competing Vegetation Interact as Site Limiting Factors in Maritime Forest Restoration. Forests 2019, 10, 950. [Google Scholar] [CrossRef]
  76. Kissel, D.E.; Sonon, L.S. Soil Test Handbook for Georgia: Fertilizer Recommendations by Crops; University of Georgia Cooperative Extension: Athens, GA, USA, 2008. [Google Scholar]
  77. Sambeek, J.W.V.; Kabrick, J.M.; Dey, D.C. Foliar Nutrient Responses of Oak Saplings to Nitrogen Treatments on Alkaline Soils within the Missouri River Floodplain. In Proceedings of the 20th Central Hardwood Forest Conference, Columbia, MO, USA, 28 March–1 April 2016; USDA US Forest Service: Newtown Square, PA, USA, 2017. [Google Scholar]
  78. Miller, E.M.; Seastedt, T.R. Impacts of Woodchip Amendments and Soil Nutrient Availability on Understory Vegetation Establishment Following Thinning of a Ponderosa Pine Forest. For. Ecol. Manag. 2009, 258, 263–272. [Google Scholar] [CrossRef]
  79. Geisseler, D.; Scow, K.M. Long-Term Effects of Mineral Fertilizers on Soil Microorganisms—A Review. Soil Biol. Biochem. 2014, 75, 54–63. [Google Scholar] [CrossRef]
  80. Southern Trees Fact Sheets. IFAS Extension University of Florida. Available online: https://edis.ifas.ufl.edu/collections/envhort-trees (accessed on 28 January 2024).
  81. Thyroff, E.C.; Burney, O.T.; Mickelbart, M.V.; Jacobs, D.F. Unraveling Shade Tolerance and Plasticity of Semi-Evergreen Oaks: Insights From Maritime Forest Live Oak Restoration. Front. Plant Sci. 2019, 10, 1526. [Google Scholar] [CrossRef]
  82. Mylavarapu, R.; Li, Y.; Silveira, M.; Mackowiak, C.; McCray, M. Soil-Test-Based Phosphorus Recommendations for Commercial Agricultural Production in Florida. Available online: https://edis.ifas.ufl.edu/publication/SS699 (accessed on 14 December 2023).
  83. Fajardo, A.; McIntire, E.J.B. Under Strong Niche Overlap Conspecifics Do Not Compete but Help Each Other to Survive: Facilitation at the Intraspecific Level. J. Ecol. 2011, 99, 642–650. [Google Scholar] [CrossRef]
  84. Meilan, R. Planning the Tree Planting Operation. In Planting and Care of Fine Hardwood Seedlings; Purdue University Cooperative Extension Service: West Lafayette, IN, USA, 2006. [Google Scholar]
  85. Padilla, F.M.; Pugnaire, F.I. The Role of Nurse Plants in the Restoration of Degraded Environments. Front. Ecol. Environ. 2006, 4, 196–202. [Google Scholar] [CrossRef]
  86. Callaway, R.M. Direct Mechanisms for Facilitation. In Positive Interactions and Interdependence in Plant Communities; Springer: Dordrecht, The Netherlands, 2007; pp. 15–116. ISBN 978-1-4020-6223-0. [Google Scholar]
  87. Hanberry, B.B.; Nowacki, G.J. Oaks Were the Historical Foundation Genus of the East-Central United States. Quat. Sci. Rev. 2016, 145, 94–103. [Google Scholar] [CrossRef]
  88. Reyer, C.P.O.; Rammig, A.; Brouwers, N.; Langerwisch, F. Forest Resilience, Tipping Points and Global Change Processes. J. Ecol. 2015, 103, 1–4. [Google Scholar] [CrossRef]
  89. Butler, B.J.; Butler, S.M. Family Forest Ownerships with 10+ Acres in Georgia, 2011–2013; U.S. Department of Agriculture, Forest Service, Northern Research Station: Newtown Square, PA, USA, 2016; 2p. [CrossRef]
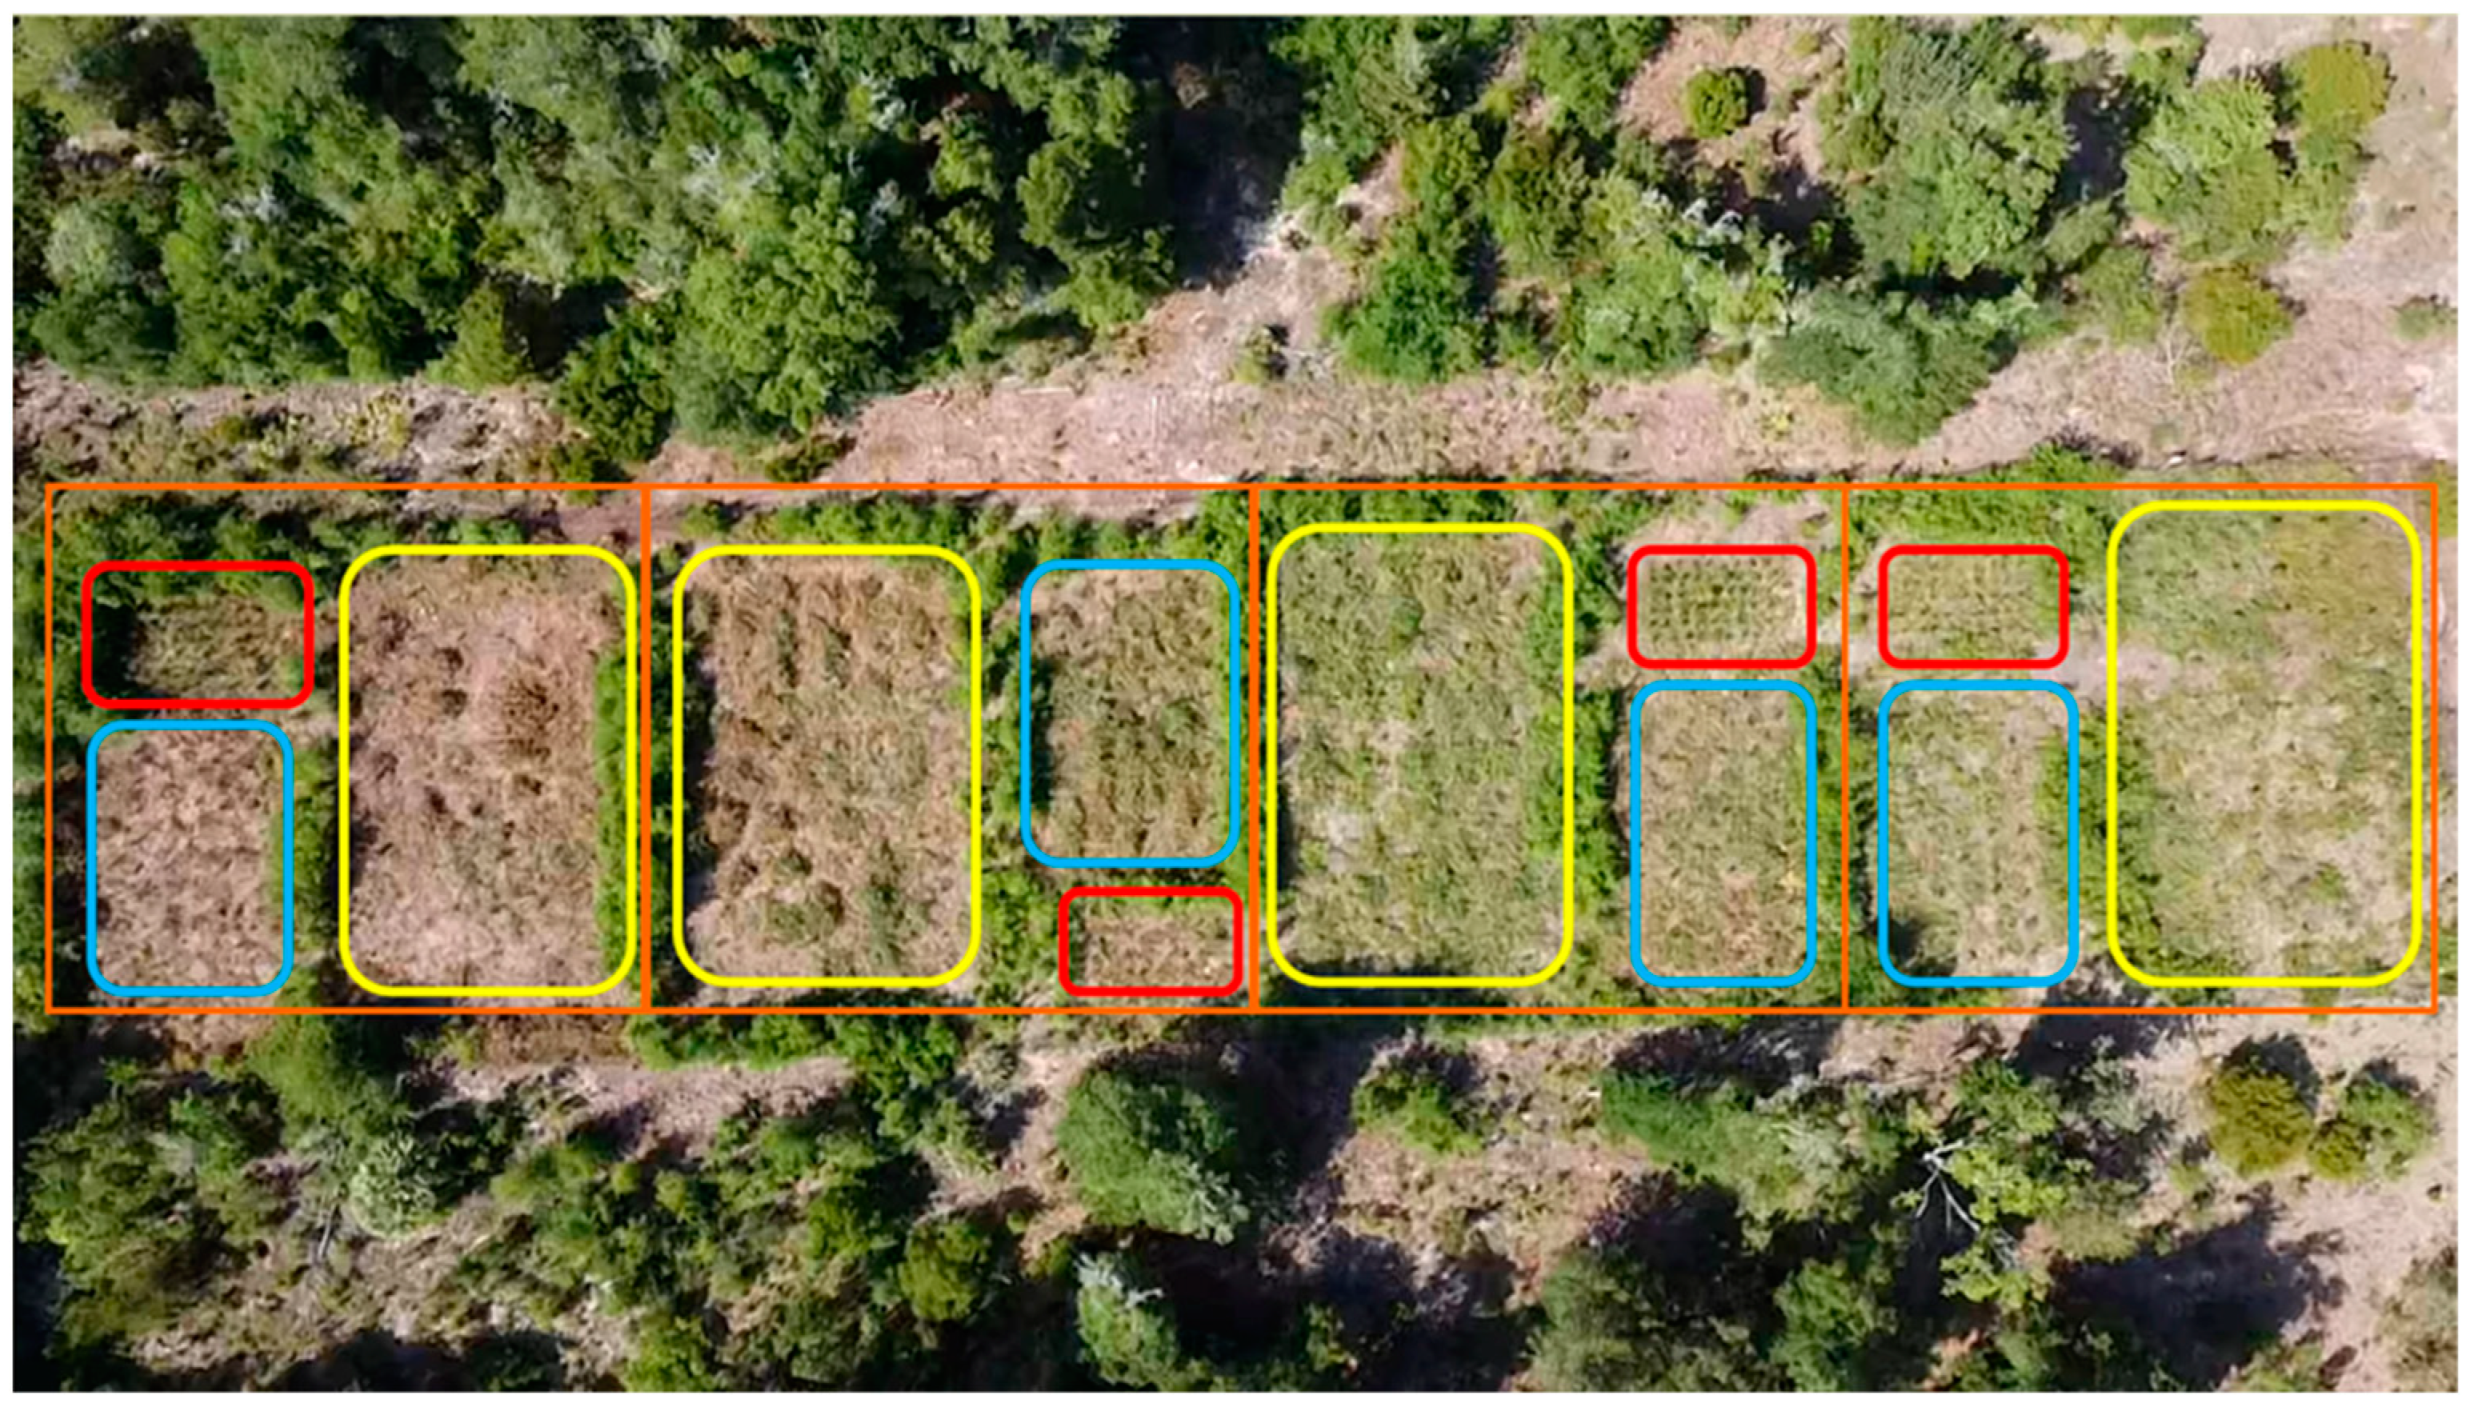
Figure 1. Map of experimental site layout for each of the four replicate blocks (orange squares). Within each block there was a 3 m (yellow), 2 m (blue), and 1 m (red) density treatment (whole plot). Half of each density treatment within a block was either mulched or non-mulched (sub-plot) and half of each mulch treatment was either fertilized or non-fertilized (sub-sub-plot).
Forests 15 01594 g001
Figure 2. Mean (±SE) diameter growth of Q. virginiana seedlings after the first growing season across all density and mulch treatments looking at main effects only. Different letters indicate significant differences between treatments (α = 0.05).
Forests 15 01594 g002
Figure 3. Mean (±SE) Q. virginiana seedling height growth (cm) (A) and seedling diameter (mm) (B) in all four years for the control, only fertilizer, only mulch, and mulch + fertilizer plots. The first- and fourth-year interactions were not analyzed as only the main effects were significant. Different letters indicate significant differences between treatments within that year (α = 0.05).
Forests 15 01594 g003
Figure 4. Mean (±SE) height (cm) (A), diameter (mm) (B), crown width (cm) (C). Total growth of Q. virginiana seedlings after the fourth growing season across all density and fertilizer treatments. Different letters indicate significant differences between treatments (α = 0.05).
Forests 15 01594 g004
Figure 5. Mean (±SE) Average competing vegetation height around Q. virginiana seedlings after the second growing season (year 2). The 3 m, non-fertilized seedlings (3 m) had significantly taller competing vegetation than the 3 m, fertilized seedlings (3 m:fertilized). Different letters indicate significant differences between treatments (α = 0.05).
Forests 15 01594 g005
Figure 6. Mean (±SE) grass coverage (A) and shrub coverage (B) around Q. virginiana seedlings after the second growing season. The application of mulch significantly decreased the percentage of grass compared to the control (left). The 3 m non-fertilized seedlings had a significantly higher percentage of shrub cover than the 3 m, fertilized seedlings. Different letters indicate significant differences between treatments (α = 0.05).
Forests 15 01594 g006
Disclaimer/Publisher’s Note: The statements, opinions and data contained in all publications are solely those of the individual author(s) and contributor(s) and not of MDPI and/or the editor(s). MDPI and/or the editor(s) disclaim responsibility for any injury to people or property resulting from any ideas, methods, instructions or products referred to in the content.